Zip Codes with the Highest Percentage of Population with a Degree in Psychology in Houston, TX
RELATED REPORTS & OPTIONS
Psychology
Houston
Compare Zip Codes
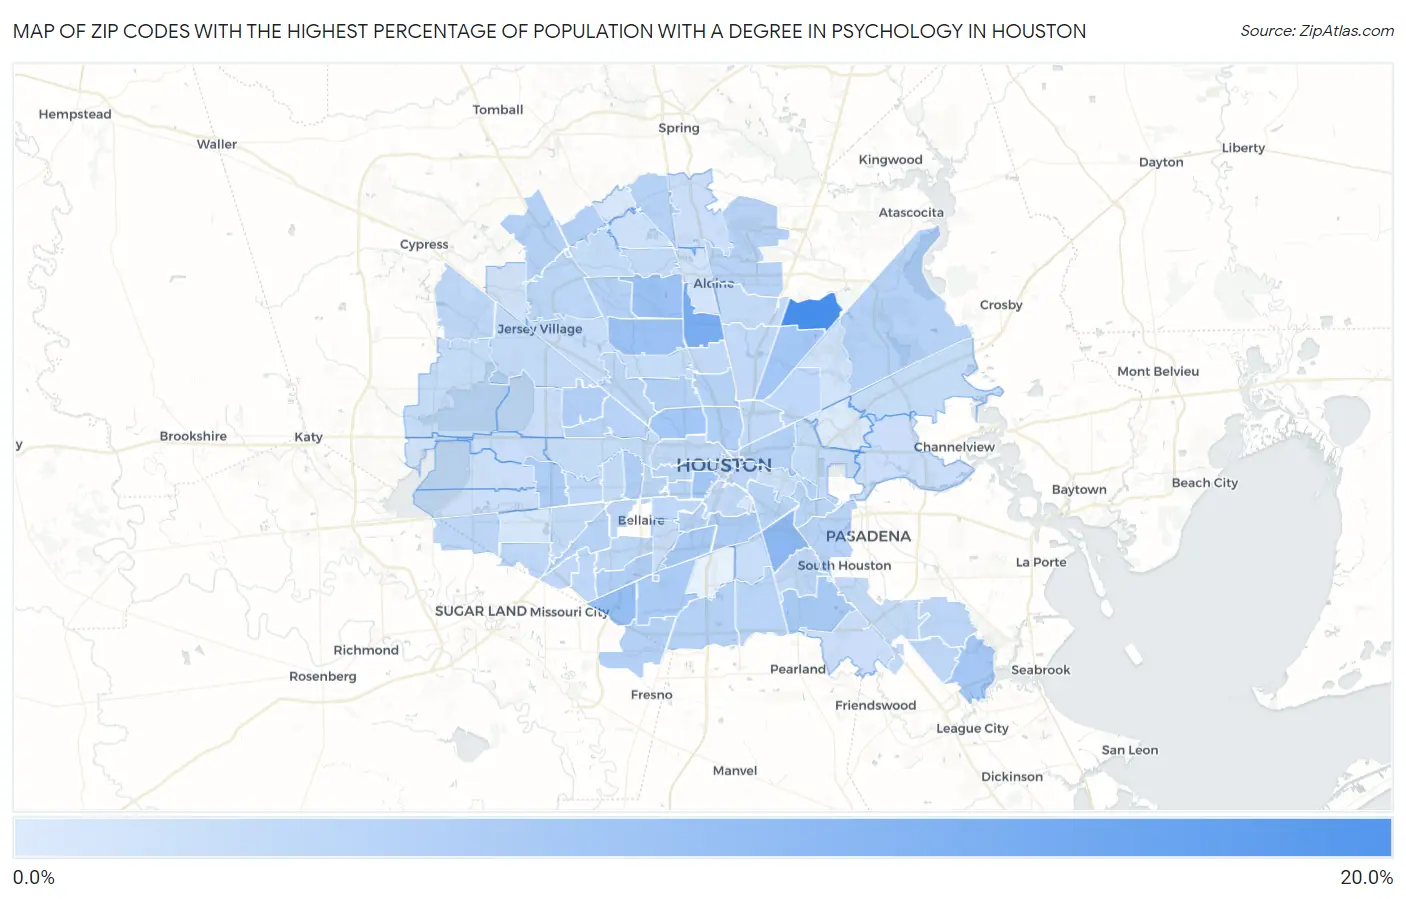
Map of Zip Codes with the Highest Percentage of Population with a Degree in Psychology in Houston
0.33%
19.4%
Zip Codes with the Highest Percentage of Population with a Degree in Psychology in Houston, TX
| Zip Code | % Graduates | vs State | vs National | |
| 1. | 77050 | 19.4% | 4.3%(+15.1)#22 | 5.1%(+14.4)#695 |
| 2. | 77037 | 12.4% | 4.3%(+8.14)#66 | 5.1%(+7.39)#1,619 |
| 3. | 77087 | 10.2% | 4.3%(+5.88)#97 | 5.1%(+5.13)#2,403 |
| 4. | 77085 | 9.1% | 4.3%(+4.81)#126 | 5.1%(+4.06)#3,039 |
| 5. | 77088 | 8.6% | 4.3%(+4.25)#158 | 5.1%(+3.50)#3,560 |
| 6. | 77038 | 8.1% | 4.3%(+3.85)#175 | 5.1%(+3.10)#3,969 |
| 7. | 77006 | 7.3% | 4.3%(+2.99)#213 | 5.1%(+2.24)#5,151 |
| 8. | 77016 | 7.3% | 4.3%(+2.98)#214 | 5.1%(+2.23)#5,158 |
| 9. | 77008 | 7.3% | 4.3%(+2.97)#215 | 5.1%(+2.22)#5,187 |
| 10. | 77058 | 7.1% | 4.3%(+2.79)#223 | 5.1%(+2.04)#5,484 |
| 11. | 77075 | 6.9% | 4.3%(+2.55)#229 | 5.1%(+1.80)#5,901 |
| 12. | 77054 | 6.7% | 4.3%(+2.44)#240 | 5.1%(+1.68)#6,142 |
| 13. | 77045 | 6.4% | 4.3%(+2.10)#272 | 5.1%(+1.35)#6,887 |
| 14. | 77042 | 6.1% | 4.3%(+1.85)#295 | 5.1%(+1.10)#7,535 |
| 15. | 77021 | 6.1% | 4.3%(+1.80)#301 | 5.1%(+1.05)#7,659 |
| 16. | 77009 | 5.7% | 4.3%(+1.41)#353 | 5.1%(+0.659)#8,861 |
| 17. | 77035 | 5.6% | 4.3%(+1.26)#369 | 5.1%(+0.511)#9,303 |
| 18. | 77056 | 5.5% | 4.3%(+1.22)#374 | 5.1%(+0.472)#9,450 |
| 19. | 77053 | 5.4% | 4.3%(+1.07)#398 | 5.1%(+0.322)#9,939 |
| 20. | 77069 | 5.3% | 4.3%(+1.02)#409 | 5.1%(+0.263)#10,115 |
| 21. | 77080 | 5.2% | 4.3%(+0.924)#424 | 5.1%(+0.171)#10,459 |
| 22. | 77020 | 5.2% | 4.3%(+0.901)#429 | 5.1%(+0.148)#10,535 |
| 23. | 77022 | 5.1% | 4.3%(+0.844)#438 | 5.1%(+0.092)#10,739 |
| 24. | 77047 | 5.1% | 4.3%(+0.842)#440 | 5.1%(+0.090)#10,744 |
| 25. | 77070 | 5.1% | 4.3%(+0.831)#445 | 5.1%(+0.078)#10,781 |
| 26. | 77018 | 5.0% | 4.3%(+0.731)#459 | 5.1%(-0.022)#11,157 |
| 27. | 77044 | 5.0% | 4.3%(+0.697)#465 | 5.1%(-0.056)#11,300 |
| 28. | 77074 | 5.0% | 4.3%(+0.690)#467 | 5.1%(-0.062)#11,317 |
| 29. | 77090 | 5.0% | 4.3%(+0.660)#474 | 5.1%(-0.092)#11,424 |
| 30. | 77086 | 4.9% | 4.3%(+0.604)#485 | 5.1%(-0.148)#11,626 |
| 31. | 77017 | 4.8% | 4.3%(+0.536)#499 | 5.1%(-0.217)#11,837 |
| 32. | 77055 | 4.7% | 4.3%(+0.418)#517 | 5.1%(-0.334)#12,257 |
| 33. | 77030 | 4.7% | 4.3%(+0.374)#524 | 5.1%(-0.378)#12,423 |
| 34. | 77032 | 4.6% | 4.3%(+0.339)#537 | 5.1%(-0.414)#12,564 |
| 35. | 77098 | 4.6% | 4.3%(+0.317)#543 | 5.1%(-0.435)#12,653 |
| 36. | 77023 | 4.5% | 4.3%(+0.223)#561 | 5.1%(-0.530)#13,032 |
| 37. | 77019 | 4.5% | 4.3%(+0.221)#562 | 5.1%(-0.531)#13,035 |
| 38. | 77012 | 4.4% | 4.3%(+0.080)#605 | 5.1%(-0.673)#13,567 |
| 39. | 77048 | 4.3% | 4.3%(+0.044)#610 | 5.1%(-0.709)#13,703 |
| 40. | 77059 | 4.3% | 4.3%(+0.005)#620 | 5.1%(-0.747)#13,845 |
| 41. | 77092 | 4.3% | 4.3%(-0.027)#631 | 5.1%(-0.780)#13,954 |
| 42. | 77003 | 4.3% | 4.3%(-0.033)#632 | 5.1%(-0.786)#13,981 |
| 43. | 77062 | 4.2% | 4.3%(-0.059)#641 | 5.1%(-0.812)#14,086 |
| 44. | 77027 | 4.2% | 4.3%(-0.095)#653 | 5.1%(-0.848)#14,209 |
| 45. | 77081 | 4.2% | 4.3%(-0.103)#659 | 5.1%(-0.856)#14,242 |
| 46. | 77064 | 4.1% | 4.3%(-0.162)#674 | 5.1%(-0.915)#14,444 |
| 47. | 77083 | 4.1% | 4.3%(-0.208)#685 | 5.1%(-0.960)#14,603 |
| 48. | 77028 | 4.0% | 4.3%(-0.308)#712 | 5.1%(-1.06)#14,960 |
| 49. | 77031 | 4.0% | 4.3%(-0.326)#718 | 5.1%(-1.08)#15,026 |
| 50. | 77046 | 4.0% | 4.3%(-0.332)#725 | 5.1%(-1.08)#15,052 |
| 51. | 77063 | 3.9% | 4.3%(-0.363)#735 | 5.1%(-1.12)#15,165 |
| 52. | 77095 | 3.9% | 4.3%(-0.388)#743 | 5.1%(-1.14)#15,239 |
| 53. | 77071 | 3.9% | 4.3%(-0.430)#755 | 5.1%(-1.18)#15,385 |
| 54. | 77099 | 3.8% | 4.3%(-0.470)#765 | 5.1%(-1.22)#15,518 |
| 55. | 77096 | 3.8% | 4.3%(-0.509)#770 | 5.1%(-1.26)#15,657 |
| 56. | 77005 | 3.8% | 4.3%(-0.541)#784 | 5.1%(-1.29)#15,773 |
| 57. | 77007 | 3.7% | 4.3%(-0.550)#787 | 5.1%(-1.30)#15,797 |
| 58. | 77004 | 3.7% | 4.3%(-0.592)#797 | 5.1%(-1.34)#15,934 |
| 59. | 77076 | 3.7% | 4.3%(-0.599)#799 | 5.1%(-1.35)#15,965 |
| 60. | 77093 | 3.7% | 4.3%(-0.599)#800 | 5.1%(-1.35)#15,966 |
| 61. | 77061 | 3.7% | 4.3%(-0.621)#810 | 5.1%(-1.37)#16,037 |
| 62. | 77026 | 3.6% | 4.3%(-0.655)#817 | 5.1%(-1.41)#16,164 |
| 63. | 77041 | 3.4% | 4.3%(-0.882)#872 | 5.1%(-1.63)#16,961 |
| 64. | 77067 | 3.4% | 4.3%(-0.891)#873 | 5.1%(-1.64)#16,985 |
| 65. | 77039 | 3.4% | 4.3%(-0.935)#883 | 5.1%(-1.69)#17,103 |
| 66. | 77034 | 3.3% | 4.3%(-0.952)#888 | 5.1%(-1.70)#17,160 |
| 67. | 77036 | 3.3% | 4.3%(-1.04)#904 | 5.1%(-1.79)#17,411 |
| 68. | 77057 | 3.2% | 4.3%(-1.08)#912 | 5.1%(-1.83)#17,566 |
| 69. | 77029 | 3.2% | 4.3%(-1.13)#928 | 5.1%(-1.89)#17,756 |
| 70. | 77066 | 3.1% | 4.3%(-1.23)#953 | 5.1%(-1.98)#18,035 |
| 71. | 77024 | 3.0% | 4.3%(-1.28)#968 | 5.1%(-2.03)#18,179 |
| 72. | 77084 | 3.0% | 4.3%(-1.32)#975 | 5.1%(-2.08)#18,307 |
| 73. | 77049 | 3.0% | 4.3%(-1.33)#976 | 5.1%(-2.08)#18,312 |
| 74. | 77091 | 2.9% | 4.3%(-1.38)#987 | 5.1%(-2.13)#18,468 |
| 75. | 77079 | 2.9% | 4.3%(-1.38)#989 | 5.1%(-2.14)#18,479 |
| 76. | 77040 | 2.9% | 4.3%(-1.43)#994 | 5.1%(-2.18)#18,601 |
| 77. | 77033 | 2.8% | 4.3%(-1.52)#1,007 | 5.1%(-2.27)#18,850 |
| 78. | 77089 | 2.6% | 4.3%(-1.66)#1,036 | 5.1%(-2.41)#19,255 |
| 79. | 77073 | 2.6% | 4.3%(-1.71)#1,044 | 5.1%(-2.46)#19,376 |
| 80. | 77015 | 2.5% | 4.3%(-1.83)#1,061 | 5.1%(-2.58)#19,686 |
| 81. | 77043 | 2.5% | 4.3%(-1.85)#1,065 | 5.1%(-2.60)#19,729 |
| 82. | 77025 | 2.4% | 4.3%(-1.90)#1,075 | 5.1%(-2.65)#19,873 |
| 83. | 77002 | 2.4% | 4.3%(-1.92)#1,084 | 5.1%(-2.68)#19,935 |
| 84. | 77011 | 2.3% | 4.3%(-1.96)#1,093 | 5.1%(-2.71)#20,011 |
| 85. | 77082 | 2.3% | 4.3%(-1.97)#1,096 | 5.1%(-2.72)#20,033 |
| 86. | 77077 | 2.2% | 4.3%(-2.06)#1,114 | 5.1%(-2.81)#20,284 |
| 87. | 77010 | 2.2% | 4.3%(-2.10)#1,120 | 5.1%(-2.85)#20,380 |
| 88. | 77014 | 2.0% | 4.3%(-2.34)#1,154 | 5.1%(-3.10)#20,919 |
| 89. | 77078 | 1.7% | 4.3%(-2.55)#1,178 | 5.1%(-3.30)#21,343 |
| 90. | 77065 | 1.7% | 4.3%(-2.58)#1,180 | 5.1%(-3.33)#21,385 |
| 91. | 77094 | 1.7% | 4.3%(-2.63)#1,195 | 5.1%(-3.38)#21,491 |
| 92. | 77060 | 1.6% | 4.3%(-2.66)#1,198 | 5.1%(-3.41)#21,529 |
| 93. | 77072 | 1.2% | 4.3%(-3.07)#1,245 | 5.1%(-3.82)#22,275 |
| 94. | 77204 | 1.1% | 4.3%(-3.17)#1,256 | 5.1%(-3.93)#22,463 |
| 95. | 77068 | 0.98% | 4.3%(-3.32)#1,270 | 5.1%(-4.07)#22,688 |
| 96. | 77013 | 0.33% | 4.3%(-3.97)#1,330 | 5.1%(-4.72)#23,384 |
1
Common Questions
What are the Top 10 Zip Codes with the Highest Percentage of Population with a Degree in Psychology in Houston, TX?
Top 10 Zip Codes with the Highest Percentage of Population with a Degree in Psychology in Houston, TX are:
What zip code has the Highest Percentage of Population with a Degree in Psychology in Houston, TX?
77050 has the Highest Percentage of Population with a Degree in Psychology in Houston, TX with 19.4%.
What is the Percentage of Population with a Degree in Psychology in Houston, TX?
Percentage of Population with a Degree in Psychology in Houston is 4.4%.
What is the Percentage of Population with a Degree in Psychology in Texas?
Percentage of Population with a Degree in Psychology in Texas is 4.3%.
What is the Percentage of Population with a Degree in Psychology in the United States?
Percentage of Population with a Degree in Psychology in the United States is 5.1%.