Zip Codes with the Highest Percentage of Population Employed in Legal Services & Support in Houston, TX
RELATED REPORTS & OPTIONS
Legal Services & Support
Houston
Compare Zip Codes
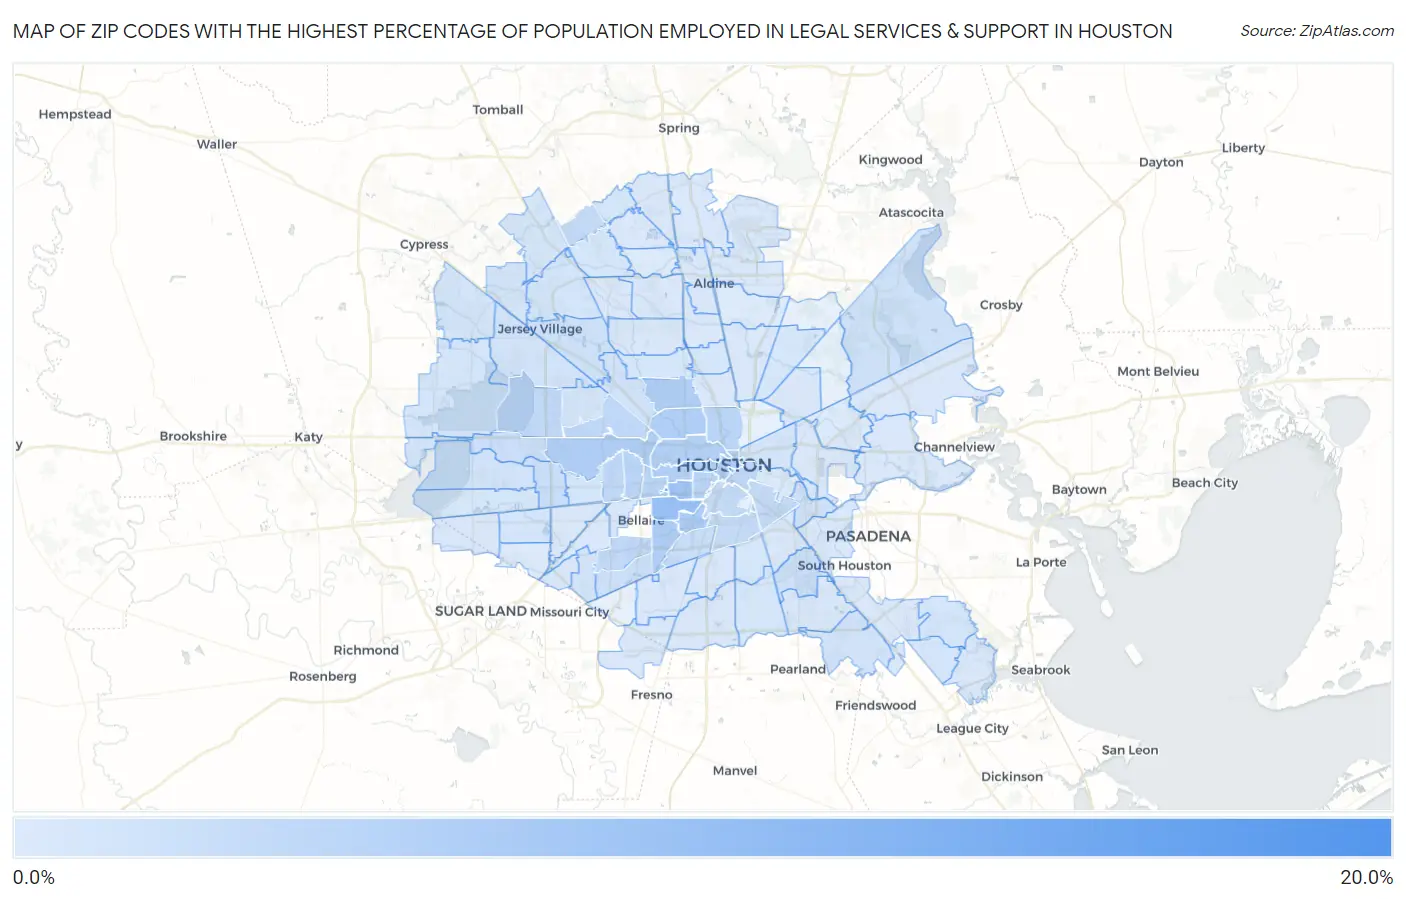
Map of Zip Codes with the Highest Percentage of Population Employed in Legal Services & Support in Houston
0.0088%
17.1%
Zip Codes with the Highest Percentage of Population Employed in Legal Services & Support in Houston, TX
| Zip Code | % Employed | vs State | vs National | |
| 1. | 77046 | 17.1% | 1.0%(+16.1)#4 | 1.2%(+15.9)#66 |
| 2. | 77010 | 8.7% | 1.0%(+7.69)#11 | 1.2%(+7.52)#212 |
| 3. | 77005 | 7.5% | 1.0%(+6.46)#17 | 1.2%(+6.29)#300 |
| 4. | 77098 | 6.7% | 1.0%(+5.67)#18 | 1.2%(+5.50)#379 |
| 5. | 77030 | 5.2% | 1.0%(+4.18)#30 | 1.2%(+4.00)#668 |
| 6. | 77024 | 5.0% | 1.0%(+3.98)#33 | 1.2%(+3.80)#717 |
| 7. | 77018 | 4.9% | 1.0%(+3.87)#35 | 1.2%(+3.69)#755 |
| 8. | 77002 | 4.9% | 1.0%(+3.84)#36 | 1.2%(+3.67)#762 |
| 9. | 77025 | 4.7% | 1.0%(+3.70)#38 | 1.2%(+3.52)#804 |
| 10. | 77008 | 4.7% | 1.0%(+3.69)#39 | 1.2%(+3.51)#808 |
| 11. | 77019 | 4.4% | 1.0%(+3.44)#42 | 1.2%(+3.26)#921 |
| 12. | 77007 | 4.4% | 1.0%(+3.36)#44 | 1.2%(+3.18)#956 |
| 13. | 77006 | 4.1% | 1.0%(+3.08)#51 | 1.2%(+2.91)#1,088 |
| 14. | 77056 | 3.8% | 1.0%(+2.75)#62 | 1.2%(+2.58)#1,250 |
| 15. | 77009 | 3.7% | 1.0%(+2.66)#65 | 1.2%(+2.48)#1,307 |
| 16. | 77027 | 3.6% | 1.0%(+2.62)#67 | 1.2%(+2.44)#1,331 |
| 17. | 77003 | 3.4% | 1.0%(+2.37)#78 | 1.2%(+2.19)#1,516 |
| 18. | 77057 | 3.2% | 1.0%(+2.21)#86 | 1.2%(+2.03)#1,639 |
| 19. | 77055 | 3.2% | 1.0%(+2.20)#87 | 1.2%(+2.03)#1,643 |
| 20. | 77096 | 3.0% | 1.0%(+1.96)#102 | 1.2%(+1.79)#1,876 |
| 21. | 77043 | 2.9% | 1.0%(+1.84)#109 | 1.2%(+1.67)#2,018 |
| 22. | 77004 | 2.8% | 1.0%(+1.83)#111 | 1.2%(+1.65)#2,033 |
| 23. | 77069 | 2.7% | 1.0%(+1.69)#124 | 1.2%(+1.51)#2,208 |
| 24. | 77023 | 2.6% | 1.0%(+1.63)#128 | 1.2%(+1.46)#2,287 |
| 25. | 77021 | 2.6% | 1.0%(+1.63)#129 | 1.2%(+1.45)#2,293 |
| 26. | 77042 | 2.2% | 1.0%(+1.17)#158 | 1.2%(+0.991)#3,082 |
| 27. | 77054 | 2.1% | 1.0%(+1.10)#167 | 1.2%(+0.924)#3,210 |
| 28. | 77079 | 2.0% | 1.0%(+1.01)#179 | 1.2%(+0.832)#3,431 |
| 29. | 77035 | 1.7% | 1.0%(+0.736)#224 | 1.2%(+0.561)#4,159 |
| 30. | 77061 | 1.7% | 1.0%(+0.656)#237 | 1.2%(+0.481)#4,450 |
| 31. | 77012 | 1.6% | 1.0%(+0.552)#250 | 1.2%(+0.376)#4,811 |
| 32. | 77044 | 1.4% | 1.0%(+0.401)#293 | 1.2%(+0.226)#5,429 |
| 33. | 77040 | 1.4% | 1.0%(+0.393)#299 | 1.2%(+0.218)#5,469 |
| 34. | 77077 | 1.3% | 1.0%(+0.290)#322 | 1.2%(+0.114)#5,950 |
| 35. | 77092 | 1.3% | 1.0%(+0.267)#330 | 1.2%(+0.092)#6,062 |
| 36. | 77041 | 1.2% | 1.0%(+0.170)#360 | 1.2%(-0.005)#6,657 |
| 37. | 77089 | 1.2% | 1.0%(+0.167)#361 | 1.2%(-0.009)#6,681 |
| 38. | 77071 | 1.2% | 1.0%(+0.148)#370 | 1.2%(-0.028)#6,788 |
| 39. | 77063 | 1.1% | 1.0%(+0.095)#393 | 1.2%(-0.081)#7,151 |
| 40. | 77062 | 1.1% | 1.0%(+0.055)#406 | 1.2%(-0.120)#7,404 |
| 41. | 77094 | 1.0% | 1.0%(+0.029)#421 | 1.2%(-0.146)#7,566 |
| 42. | 77020 | 1.0% | 1.0%(+0.022)#425 | 1.2%(-0.154)#7,616 |
| 43. | 77072 | 0.93% | 1.0%(-0.078)#464 | 1.2%(-0.253)#8,346 |
| 44. | 77095 | 0.92% | 1.0%(-0.090)#471 | 1.2%(-0.266)#8,446 |
| 45. | 77065 | 0.91% | 1.0%(-0.094)#473 | 1.2%(-0.270)#8,488 |
| 46. | 77059 | 0.90% | 1.0%(-0.103)#476 | 1.2%(-0.279)#8,558 |
| 47. | 77064 | 0.90% | 1.0%(-0.105)#477 | 1.2%(-0.281)#8,574 |
| 48. | 77084 | 0.89% | 1.0%(-0.123)#493 | 1.2%(-0.298)#8,728 |
| 49. | 77080 | 0.88% | 1.0%(-0.133)#499 | 1.2%(-0.308)#8,818 |
| 50. | 77016 | 0.83% | 1.0%(-0.174)#511 | 1.2%(-0.349)#9,153 |
| 51. | 77066 | 0.72% | 1.0%(-0.293)#585 | 1.2%(-0.468)#10,253 |
| 52. | 77076 | 0.70% | 1.0%(-0.310)#602 | 1.2%(-0.486)#10,436 |
| 53. | 77068 | 0.69% | 1.0%(-0.322)#615 | 1.2%(-0.498)#10,546 |
| 54. | 77070 | 0.67% | 1.0%(-0.333)#623 | 1.2%(-0.509)#10,673 |
| 55. | 77033 | 0.65% | 1.0%(-0.357)#641 | 1.2%(-0.533)#10,936 |
| 56. | 77082 | 0.63% | 1.0%(-0.377)#656 | 1.2%(-0.553)#11,116 |
| 57. | 77048 | 0.63% | 1.0%(-0.381)#660 | 1.2%(-0.556)#11,166 |
| 58. | 77091 | 0.62% | 1.0%(-0.388)#667 | 1.2%(-0.563)#11,238 |
| 59. | 77060 | 0.57% | 1.0%(-0.442)#701 | 1.2%(-0.617)#11,872 |
| 60. | 77081 | 0.52% | 1.0%(-0.488)#729 | 1.2%(-0.664)#12,380 |
| 61. | 77075 | 0.51% | 1.0%(-0.499)#736 | 1.2%(-0.675)#12,516 |
| 62. | 77083 | 0.50% | 1.0%(-0.510)#751 | 1.2%(-0.686)#12,659 |
| 63. | 77047 | 0.50% | 1.0%(-0.512)#755 | 1.2%(-0.688)#12,683 |
| 64. | 77031 | 0.49% | 1.0%(-0.518)#759 | 1.2%(-0.693)#12,751 |
| 65. | 77053 | 0.48% | 1.0%(-0.529)#773 | 1.2%(-0.704)#12,891 |
| 66. | 77028 | 0.46% | 1.0%(-0.549)#795 | 1.2%(-0.725)#13,150 |
| 67. | 77058 | 0.43% | 1.0%(-0.573)#813 | 1.2%(-0.749)#13,426 |
| 68. | 77036 | 0.40% | 1.0%(-0.603)#839 | 1.2%(-0.779)#13,792 |
| 69. | 77088 | 0.38% | 1.0%(-0.625)#856 | 1.2%(-0.801)#14,032 |
| 70. | 77090 | 0.38% | 1.0%(-0.633)#862 | 1.2%(-0.808)#14,133 |
| 71. | 77014 | 0.34% | 1.0%(-0.666)#893 | 1.2%(-0.842)#14,567 |
| 72. | 77087 | 0.33% | 1.0%(-0.683)#905 | 1.2%(-0.858)#14,757 |
| 73. | 77093 | 0.31% | 1.0%(-0.693)#911 | 1.2%(-0.869)#14,860 |
| 74. | 77037 | 0.31% | 1.0%(-0.697)#914 | 1.2%(-0.872)#14,903 |
| 75. | 77029 | 0.30% | 1.0%(-0.706)#921 | 1.2%(-0.881)#15,004 |
| 76. | 77015 | 0.30% | 1.0%(-0.711)#927 | 1.2%(-0.886)#15,076 |
| 77. | 77073 | 0.29% | 1.0%(-0.722)#934 | 1.2%(-0.898)#15,187 |
| 78. | 77022 | 0.28% | 1.0%(-0.725)#936 | 1.2%(-0.900)#15,212 |
| 79. | 77049 | 0.28% | 1.0%(-0.727)#937 | 1.2%(-0.903)#15,242 |
| 80. | 77017 | 0.27% | 1.0%(-0.739)#952 | 1.2%(-0.915)#15,397 |
| 81. | 77038 | 0.26% | 1.0%(-0.753)#959 | 1.2%(-0.928)#15,567 |
| 82. | 77074 | 0.25% | 1.0%(-0.761)#967 | 1.2%(-0.937)#15,665 |
| 83. | 77086 | 0.24% | 1.0%(-0.772)#972 | 1.2%(-0.948)#15,805 |
| 84. | 77051 | 0.21% | 1.0%(-0.802)#995 | 1.2%(-0.978)#16,132 |
| 85. | 77034 | 0.18% | 1.0%(-0.833)#1,015 | 1.2%(-1.01)#16,450 |
| 86. | 77045 | 0.17% | 1.0%(-0.839)#1,017 | 1.2%(-1.01)#16,493 |
| 87. | 77032 | 0.16% | 1.0%(-0.851)#1,026 | 1.2%(-1.03)#16,622 |
| 88. | 77011 | 0.12% | 1.0%(-0.886)#1,054 | 1.2%(-1.06)#16,938 |
| 89. | 77067 | 0.091% | 1.0%(-0.917)#1,080 | 1.2%(-1.09)#17,197 |
| 90. | 77013 | 0.071% | 1.0%(-0.937)#1,088 | 1.2%(-1.11)#17,326 |
| 91. | 77099 | 0.042% | 1.0%(-0.966)#1,104 | 1.2%(-1.14)#17,456 |
| 92. | 77039 | 0.0088% | 1.0%(-0.999)#1,114 | 1.2%(-1.17)#17,509 |
1
Common Questions
What are the Top 10 Zip Codes with the Highest Percentage of Population Employed in Legal Services & Support in Houston, TX?
Top 10 Zip Codes with the Highest Percentage of Population Employed in Legal Services & Support in Houston, TX are:
What zip code has the Highest Percentage of Population Employed in Legal Services & Support in Houston, TX?
77046 has the Highest Percentage of Population Employed in Legal Services & Support in Houston, TX with 17.1%.
What is the Percentage of Population Employed in Legal Services & Support in Houston, TX?
Percentage of Population Employed in Legal Services & Support in Houston is 1.7%.
What is the Percentage of Population Employed in Legal Services & Support in Texas?
Percentage of Population Employed in Legal Services & Support in Texas is 1.0%.
What is the Percentage of Population Employed in Legal Services & Support in the United States?
Percentage of Population Employed in Legal Services & Support in the United States is 1.2%.