Zip Codes with the Highest Percentage of Hawaiian / Pacific Population in Houston, TX
RELATED REPORTS & OPTIONS
Hawaiian / Pacific
Houston
Compare Zip Codes
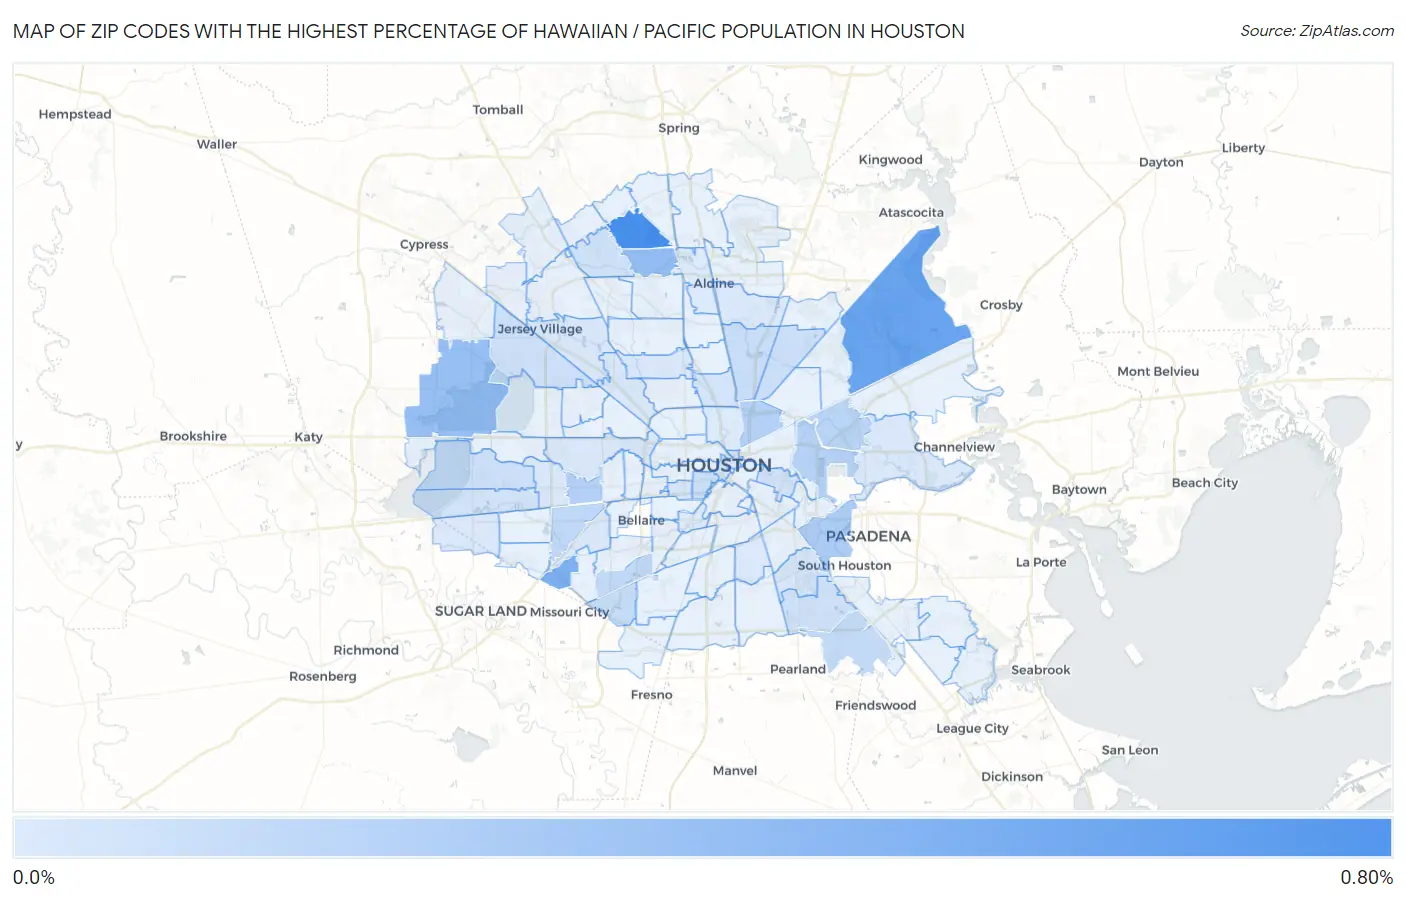
Map of Zip Codes with the Highest Percentage of Hawaiian / Pacific Population in Houston
0.0043%
0.64%
Zip Codes with the Highest Percentage of Hawaiian / Pacific Population in Houston, TX
| Zip Code | Hawaiian / Pacific | vs State | vs National | |
| 1. | 77014 | 0.64% | 0.094%(+0.551)#55 | 0.19%(+0.455)#1,156 |
| 2. | 77044 | 0.50% | 0.094%(+0.405)#71 | 0.19%(+0.310)#1,413 |
| 3. | 77031 | 0.42% | 0.094%(+0.327)#87 | 0.19%(+0.232)#1,639 |
| 4. | 77067 | 0.32% | 0.094%(+0.224)#110 | 0.19%(+0.129)#2,026 |
| 5. | 77084 | 0.30% | 0.094%(+0.210)#118 | 0.19%(+0.114)#2,103 |
| 6. | 77017 | 0.21% | 0.094%(+0.115)#161 | 0.19%(+0.020)#2,731 |
| 7. | 77026 | 0.18% | 0.094%(+0.090)#175 | 0.19%(-0.005)#2,954 |
| 8. | 77063 | 0.18% | 0.094%(+0.083)#181 | 0.19%(-0.012)#3,023 |
| 9. | 77029 | 0.17% | 0.094%(+0.081)#184 | 0.19%(-0.014)#3,055 |
| 10. | 77013 | 0.15% | 0.094%(+0.058)#207 | 0.19%(-0.037)#3,334 |
| 11. | 77036 | 0.13% | 0.094%(+0.035)#227 | 0.19%(-0.060)#3,613 |
| 12. | 77035 | 0.13% | 0.094%(+0.032)#232 | 0.19%(-0.063)#3,656 |
| 13. | 77089 | 0.11% | 0.094%(+0.015)#251 | 0.19%(-0.080)#3,883 |
| 14. | 77085 | 0.10% | 0.094%(+0.009)#261 | 0.19%(-0.086)#3,983 |
| 15. | 77006 | 0.092% | 0.094%(-0.002)#276 | 0.19%(-0.097)#4,194 |
| 16. | 77093 | 0.091% | 0.094%(-0.002)#277 | 0.19%(-0.097)#4,199 |
| 17. | 77077 | 0.072% | 0.094%(-0.022)#310 | 0.19%(-0.117)#4,601 |
| 18. | 77016 | 0.071% | 0.094%(-0.022)#311 | 0.19%(-0.117)#4,602 |
| 19. | 77041 | 0.069% | 0.094%(-0.025)#319 | 0.19%(-0.120)#4,655 |
| 20. | 77066 | 0.066% | 0.094%(-0.027)#326 | 0.19%(-0.122)#4,725 |
| 21. | 77075 | 0.065% | 0.094%(-0.028)#330 | 0.19%(-0.123)#4,742 |
| 22. | 77082 | 0.056% | 0.094%(-0.037)#343 | 0.19%(-0.133)#4,939 |
| 23. | 77011 | 0.054% | 0.094%(-0.040)#346 | 0.19%(-0.135)#4,988 |
| 24. | 77098 | 0.045% | 0.094%(-0.049)#365 | 0.19%(-0.144)#5,208 |
| 25. | 77022 | 0.045% | 0.094%(-0.049)#367 | 0.19%(-0.144)#5,218 |
| 26. | 77061 | 0.032% | 0.094%(-0.062)#392 | 0.19%(-0.157)#5,588 |
| 27. | 77074 | 0.028% | 0.094%(-0.065)#400 | 0.19%(-0.160)#5,693 |
| 28. | 77092 | 0.028% | 0.094%(-0.066)#403 | 0.19%(-0.161)#5,731 |
| 29. | 77042 | 0.027% | 0.094%(-0.067)#407 | 0.19%(-0.162)#5,748 |
| 30. | 77024 | 0.027% | 0.094%(-0.067)#408 | 0.19%(-0.162)#5,756 |
| 31. | 77002 | 0.027% | 0.094%(-0.067)#409 | 0.19%(-0.162)#5,764 |
| 32. | 77091 | 0.026% | 0.094%(-0.067)#410 | 0.19%(-0.162)#5,776 |
| 33. | 77040 | 0.022% | 0.094%(-0.071)#422 | 0.19%(-0.167)#5,930 |
| 34. | 77039 | 0.014% | 0.094%(-0.079)#440 | 0.19%(-0.174)#6,154 |
| 35. | 77033 | 0.014% | 0.094%(-0.079)#441 | 0.19%(-0.175)#6,159 |
| 36. | 77015 | 0.013% | 0.094%(-0.080)#445 | 0.19%(-0.175)#6,179 |
| 37. | 77083 | 0.013% | 0.094%(-0.080)#447 | 0.19%(-0.175)#6,184 |
| 38. | 77030 | 0.0080% | 0.094%(-0.086)#460 | 0.19%(-0.181)#6,338 |
| 39. | 77009 | 0.0054% | 0.094%(-0.088)#466 | 0.19%(-0.183)#6,385 |
| 40. | 77060 | 0.0043% | 0.094%(-0.089)#468 | 0.19%(-0.184)#6,405 |
1
Common Questions
What are the Top 10 Zip Codes with the Highest Percentage of Hawaiian / Pacific Population in Houston, TX?
Top 10 Zip Codes with the Highest Percentage of Hawaiian / Pacific Population in Houston, TX are:
What zip code has the Highest Percentage of Hawaiian / Pacific Population in Houston, TX?
77014 has the Highest Percentage of Hawaiian / Pacific Population in Houston, TX with 0.64%.
What is the Percentage of Hawaiian / Pacific Population in Houston, TX?
Percentage of Hawaiian / Pacific Population in Houston is 0.051%.
What is the Percentage of Hawaiian / Pacific Population in Texas?
Percentage of Hawaiian / Pacific Population in Texas is 0.094%.
What is the Percentage of Hawaiian / Pacific Population in the United States?
Percentage of Hawaiian / Pacific Population in the United States is 0.19%.