Zip Codes with the Highest Percentage of Population Employed in Health Diagnosing & Treating in Indiana
RELATED REPORTS & OPTIONS
Health Diagnosing & Treating
Indiana
Compare Zip Codes
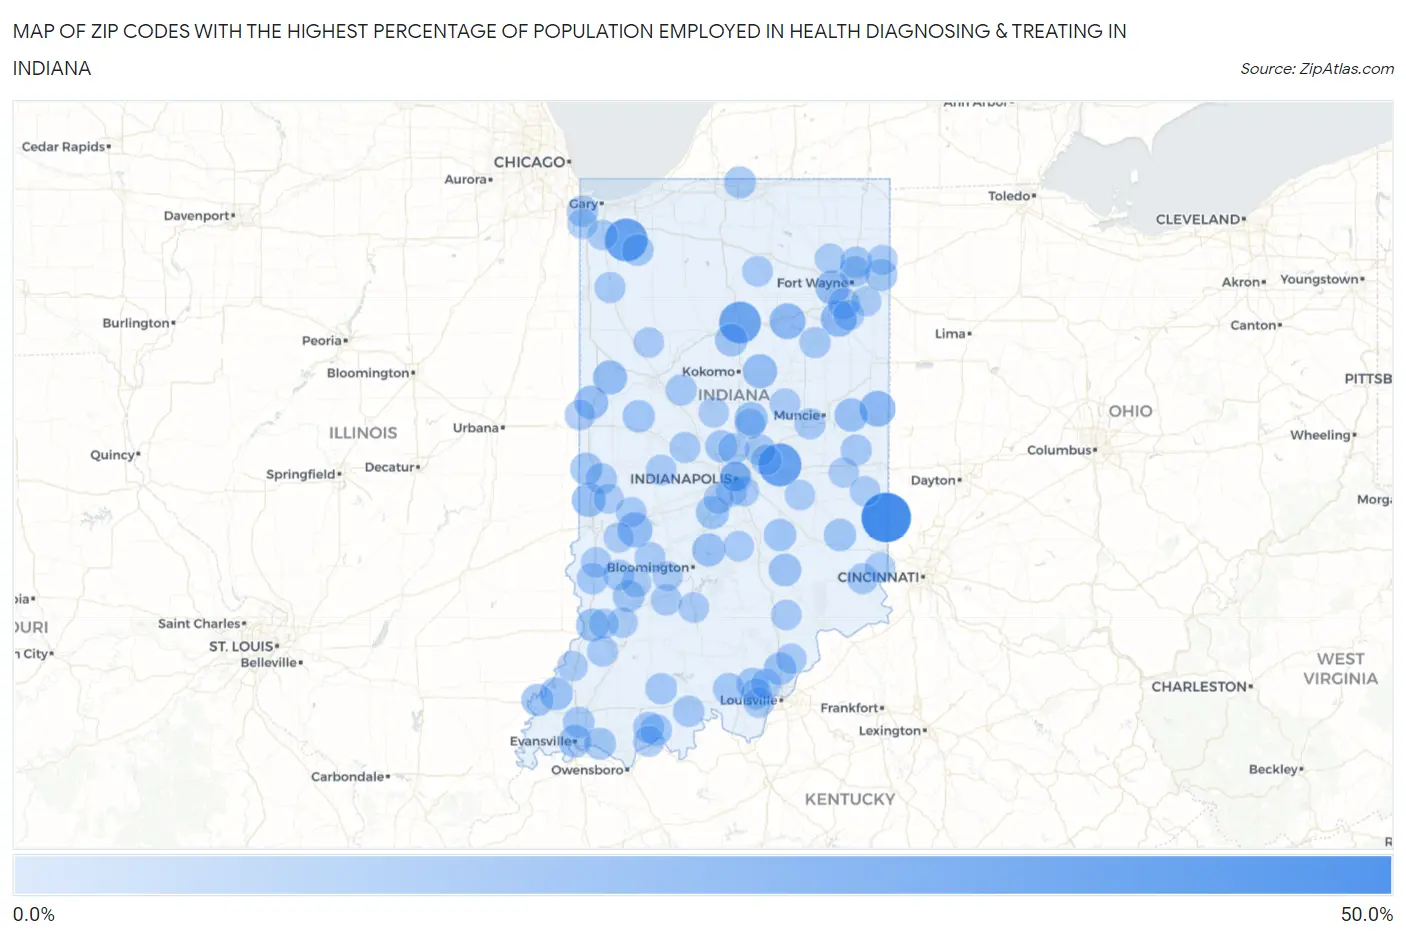
Map of Zip Codes with the Highest Percentage of Population Employed in Health Diagnosing & Treating in Indiana
0.0%
50.0%
Zip Codes with the Highest Percentage of Population Employed in Health Diagnosing & Treating in Indiana
| Zip Code | % Employed | vs State | vs National | |
| 1. | 47010 | 50.0% | 6.6%(+43.4)#1 | 6.2%(+43.8)#63 |
| 2. | 46302 | 35.7% | 6.6%(+29.2)#2 | 6.2%(+29.5)#145 |
| 3. | 46154 | 35.5% | 6.6%(+29.0)#3 | 6.2%(+29.3)#147 |
| 4. | 46958 | 33.3% | 6.6%(+26.8)#4 | 6.2%(+27.1)#166 |
| 5. | 46791 | 21.2% | 6.6%(+14.6)#5 | 6.2%(+14.9)#476 |
| 6. | 46941 | 20.8% | 6.6%(+14.2)#6 | 6.2%(+14.5)#496 |
| 7. | 47382 | 20.6% | 6.6%(+14.1)#7 | 6.2%(+14.4)#506 |
| 8. | 47840 | 18.7% | 6.6%(+12.2)#8 | 6.2%(+12.5)#641 |
| 9. | 46814 | 17.9% | 6.6%(+11.3)#9 | 6.2%(+11.6)#719 |
| 10. | 46936 | 17.5% | 6.6%(+11.0)#10 | 6.2%(+11.3)#765 |
| 11. | 47975 | 17.3% | 6.6%(+10.7)#11 | 6.2%(+11.0)#785 |
| 12. | 47991 | 16.9% | 6.6%(+10.3)#12 | 6.2%(+10.6)#832 |
| 13. | 47884 | 16.8% | 6.6%(+10.2)#13 | 6.2%(+10.5)#846 |
| 14. | 47340 | 15.9% | 6.6%(+9.31)#14 | 6.2%(+9.62)#978 |
| 15. | 47468 | 15.8% | 6.6%(+9.21)#15 | 6.2%(+9.51)#995 |
| 16. | 46030 | 15.6% | 6.6%(+9.04)#16 | 6.2%(+9.35)#1,018 |
| 17. | 46111 | 15.2% | 6.6%(+8.63)#17 | 6.2%(+8.93)#1,111 |
| 18. | 47665 | 14.9% | 6.6%(+8.35)#18 | 6.2%(+8.65)#1,175 |
| 19. | 47516 | 14.7% | 6.6%(+8.15)#19 | 6.2%(+8.46)#1,216 |
| 20. | 47708 | 14.3% | 6.6%(+7.73)#20 | 6.2%(+8.04)#1,321 |
| 21. | 46967 | 14.3% | 6.6%(+7.73)#21 | 6.2%(+8.04)#1,327 |
| 22. | 47236 | 14.2% | 6.6%(+7.65)#22 | 6.2%(+7.96)#1,354 |
| 23. | 47143 | 14.1% | 6.6%(+7.52)#23 | 6.2%(+7.83)#1,388 |
| 24. | 47967 | 13.9% | 6.6%(+7.32)#24 | 6.2%(+7.63)#1,445 |
| 25. | 47234 | 13.8% | 6.6%(+7.23)#25 | 6.2%(+7.54)#1,478 |
| 26. | 47616 | 13.8% | 6.6%(+7.22)#26 | 6.2%(+7.52)#1,487 |
| 27. | 47036 | 13.8% | 6.6%(+7.21)#27 | 6.2%(+7.52)#1,489 |
| 28. | 47847 | 13.5% | 6.6%(+6.90)#28 | 6.2%(+7.21)#1,592 |
| 29. | 46077 | 13.2% | 6.6%(+6.63)#29 | 6.2%(+6.94)#1,675 |
| 30. | 46797 | 12.9% | 6.6%(+6.37)#30 | 6.2%(+6.67)#1,770 |
| 31. | 47630 | 12.9% | 6.6%(+6.35)#31 | 6.2%(+6.66)#1,778 |
| 32. | 47124 | 12.8% | 6.6%(+6.24)#32 | 6.2%(+6.54)#1,834 |
| 33. | 46530 | 12.5% | 6.6%(+6.00)#33 | 6.2%(+6.30)#1,930 |
| 34. | 47443 | 12.5% | 6.6%(+5.99)#34 | 6.2%(+6.30)#1,933 |
| 35. | 46798 | 12.5% | 6.6%(+5.99)#35 | 6.2%(+6.29)#1,937 |
| 36. | 46845 | 12.5% | 6.6%(+5.96)#36 | 6.2%(+6.27)#1,948 |
| 37. | 46347 | 12.4% | 6.6%(+5.86)#37 | 6.2%(+6.17)#1,995 |
| 38. | 47115 | 12.2% | 6.6%(+5.67)#38 | 6.2%(+5.97)#2,094 |
| 39. | 47725 | 11.9% | 6.6%(+5.33)#39 | 6.2%(+5.64)#2,288 |
| 40. | 47862 | 11.9% | 6.6%(+5.33)#40 | 6.2%(+5.64)#2,289 |
| 41. | 47531 | 11.8% | 6.6%(+5.27)#41 | 6.2%(+5.58)#2,317 |
| 42. | 47576 | 11.7% | 6.6%(+5.18)#42 | 6.2%(+5.49)#2,369 |
| 43. | 47575 | 11.7% | 6.6%(+5.16)#43 | 6.2%(+5.47)#2,376 |
| 44. | 47882 | 11.7% | 6.6%(+5.13)#44 | 6.2%(+5.44)#2,395 |
| 45. | 47550 | 11.7% | 6.6%(+5.12)#45 | 6.2%(+5.42)#2,406 |
| 46. | 46058 | 11.5% | 6.6%(+4.99)#46 | 6.2%(+5.30)#2,492 |
| 47. | 46321 | 11.5% | 6.6%(+4.91)#47 | 6.2%(+5.21)#2,555 |
| 48. | 46032 | 11.4% | 6.6%(+4.87)#48 | 6.2%(+5.18)#2,575 |
| 49. | 47615 | 11.4% | 6.6%(+4.86)#49 | 6.2%(+5.17)#2,581 |
| 50. | 46792 | 11.4% | 6.6%(+4.85)#50 | 6.2%(+5.16)#2,589 |
| 51. | 46037 | 11.3% | 6.6%(+4.80)#51 | 6.2%(+5.10)#2,625 |
| 52. | 47453 | 11.1% | 6.6%(+4.56)#52 | 6.2%(+4.87)#2,805 |
| 53. | 46825 | 11.1% | 6.6%(+4.55)#53 | 6.2%(+4.86)#2,817 |
| 54. | 47334 | 11.1% | 6.6%(+4.53)#54 | 6.2%(+4.83)#2,834 |
| 55. | 47339 | 11.0% | 6.6%(+4.50)#55 | 6.2%(+4.80)#2,858 |
| 56. | 47943 | 11.0% | 6.6%(+4.47)#56 | 6.2%(+4.78)#2,878 |
| 57. | 47445 | 11.0% | 6.6%(+4.41)#57 | 6.2%(+4.71)#2,919 |
| 58. | 46147 | 10.9% | 6.6%(+4.36)#58 | 6.2%(+4.67)#2,952 |
| 59. | 47122 | 10.9% | 6.6%(+4.32)#59 | 6.2%(+4.63)#2,985 |
| 60. | 47032 | 10.7% | 6.6%(+4.12)#60 | 6.2%(+4.43)#3,157 |
| 61. | 46063 | 10.6% | 6.6%(+4.05)#61 | 6.2%(+4.35)#3,229 |
| 62. | 47431 | 10.6% | 6.6%(+4.02)#62 | 6.2%(+4.32)#3,245 |
| 63. | 46777 | 10.5% | 6.6%(+3.98)#63 | 6.2%(+4.29)#3,277 |
| 64. | 47451 | 10.5% | 6.6%(+3.92)#64 | 6.2%(+4.23)#3,337 |
| 65. | 47982 | 10.4% | 6.6%(+3.84)#65 | 6.2%(+4.14)#3,425 |
| 66. | 47557 | 10.4% | 6.6%(+3.83)#66 | 6.2%(+4.13)#3,437 |
| 67. | 46217 | 10.3% | 6.6%(+3.78)#67 | 6.2%(+4.08)#3,496 |
| 68. | 46172 | 10.3% | 6.6%(+3.76)#68 | 6.2%(+4.06)#3,523 |
| 69. | 46508 | 10.3% | 6.6%(+3.74)#69 | 6.2%(+4.05)#3,540 |
| 70. | 47853 | 10.3% | 6.6%(+3.74)#70 | 6.2%(+4.05)#3,541 |
| 71. | 47568 | 10.3% | 6.6%(+3.72)#71 | 6.2%(+4.03)#3,565 |
| 72. | 46055 | 10.2% | 6.6%(+3.68)#72 | 6.2%(+3.99)#3,608 |
| 73. | 46034 | 10.2% | 6.6%(+3.62)#73 | 6.2%(+3.93)#3,668 |
| 74. | 46204 | 10.1% | 6.6%(+3.60)#74 | 6.2%(+3.90)#3,702 |
| 75. | 47163 | 10.1% | 6.6%(+3.57)#75 | 6.2%(+3.87)#3,738 |
| 76. | 47879 | 10.1% | 6.6%(+3.51)#76 | 6.2%(+3.81)#3,819 |
| 77. | 47136 | 10.0% | 6.6%(+3.46)#77 | 6.2%(+3.76)#3,875 |
| 78. | 47270 | 10.0% | 6.6%(+3.45)#78 | 6.2%(+3.76)#3,898 |
| 79. | 46237 | 10.0% | 6.6%(+3.45)#79 | 6.2%(+3.75)#3,908 |
| 80. | 47929 | 9.9% | 6.6%(+3.36)#80 | 6.2%(+3.67)#3,987 |
| 81. | 47119 | 9.9% | 6.6%(+3.34)#81 | 6.2%(+3.64)#4,009 |
| 82. | 46164 | 9.9% | 6.6%(+3.30)#82 | 6.2%(+3.61)#4,057 |
| 83. | 46723 | 9.8% | 6.6%(+3.24)#83 | 6.2%(+3.55)#4,123 |
| 84. | 46104 | 9.8% | 6.6%(+3.23)#84 | 6.2%(+3.54)#4,137 |
| 85. | 47465 | 9.8% | 6.6%(+3.23)#85 | 6.2%(+3.53)#4,141 |
| 86. | 47335 | 9.8% | 6.6%(+3.21)#86 | 6.2%(+3.51)#4,171 |
| 87. | 47325 | 9.7% | 6.6%(+3.19)#87 | 6.2%(+3.50)#4,189 |
| 88. | 46113 | 9.7% | 6.6%(+3.19)#88 | 6.2%(+3.50)#4,198 |
| 89. | 46311 | 9.7% | 6.6%(+3.18)#89 | 6.2%(+3.49)#4,210 |
| 90. | 47025 | 9.7% | 6.6%(+3.17)#90 | 6.2%(+3.48)#4,225 |
| 91. | 47524 | 9.7% | 6.6%(+3.15)#91 | 6.2%(+3.46)#4,246 |
| 92. | 46743 | 9.7% | 6.6%(+3.11)#92 | 6.2%(+3.41)#4,313 |
| 93. | 46050 | 9.6% | 6.6%(+3.08)#93 | 6.2%(+3.38)#4,357 |
| 94. | 47846 | 9.6% | 6.6%(+3.07)#94 | 6.2%(+3.38)#4,370 |
| 95. | 46307 | 9.6% | 6.6%(+3.03)#95 | 6.2%(+3.33)#4,430 |
| 96. | 47874 | 9.5% | 6.6%(+3.00)#96 | 6.2%(+3.30)#4,474 |
| 97. | 47459 | 9.5% | 6.6%(+2.99)#97 | 6.2%(+3.29)#4,481 |
| 98. | 46745 | 9.5% | 6.6%(+2.95)#98 | 6.2%(+3.25)#4,543 |
| 99. | 46202 | 9.5% | 6.6%(+2.93)#99 | 6.2%(+3.24)#4,565 |
| 100. | 47512 | 9.4% | 6.6%(+2.88)#100 | 6.2%(+3.19)#4,638 |
Common Questions
What are the Top 10 Zip Codes with the Highest Percentage of Population Employed in Health Diagnosing & Treating in Indiana?
Top 10 Zip Codes with the Highest Percentage of Population Employed in Health Diagnosing & Treating in Indiana are:
What zip code has the Highest Percentage of Population Employed in Health Diagnosing & Treating in Indiana?
47010 has the Highest Percentage of Population Employed in Health Diagnosing & Treating in Indiana with 50.0%.
What is the Percentage of Population Employed in Health Diagnosing & Treating in the State of Indiana?
Percentage of Population Employed in Health Diagnosing & Treating in Indiana is 6.6%.
What is the Percentage of Population Employed in Health Diagnosing & Treating in the United States?
Percentage of Population Employed in Health Diagnosing & Treating in the United States is 6.2%.