Zip Codes with the Highest Poverty Level Among Married Couples in Houston, TX
RELATED REPORTS & OPTIONS
Highest Poverty | Married Couple
Houston
Compare Zip Codes
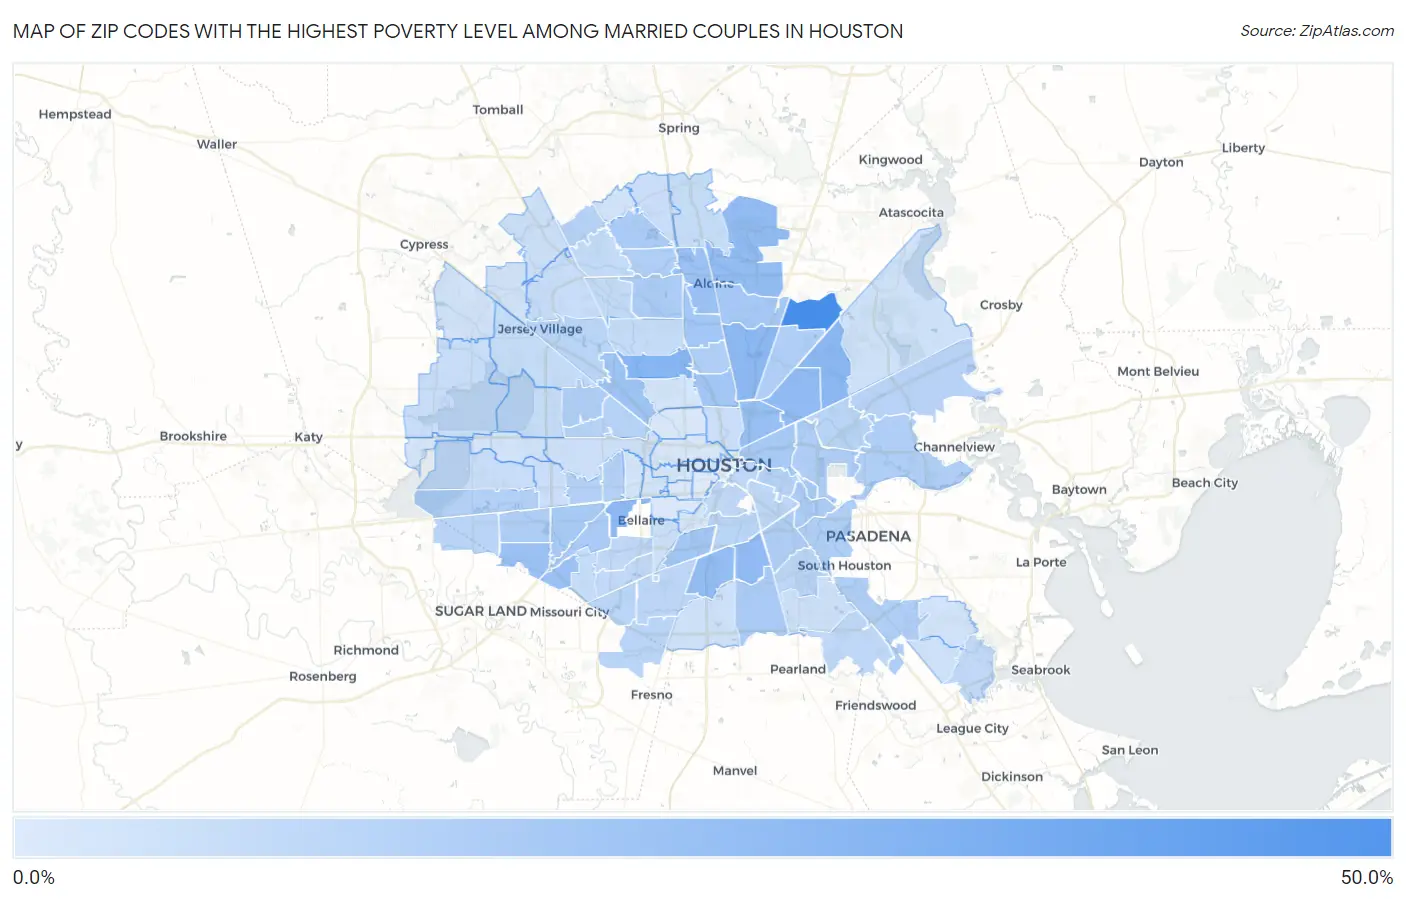
Map of Zip Codes with the Highest Poverty Level Among Married Couples in Houston
0.076%
49.3%
Zip Codes with the Highest Poverty Level Among Married Couples in Houston, TX
| Zip Code | Married Couples Poverty | vs State | vs National | |
| 1. | 77050 | 49.3% | 5.9%(+43.3)#15 | 4.5%(+44.8)#220 |
| 2. | 77091 | 26.3% | 5.9%(+20.4)#41 | 4.5%(+21.8)#832 |
| 3. | 77093 | 24.5% | 5.9%(+18.6)#53 | 4.5%(+20.0)#945 |
| 4. | 77078 | 24.4% | 5.9%(+18.5)#56 | 4.5%(+20.0)#949 |
| 5. | 77081 | 24.0% | 5.9%(+18.0)#57 | 4.5%(+19.5)#986 |
| 6. | 77033 | 22.7% | 5.9%(+16.8)#64 | 4.5%(+18.3)#1,090 |
| 7. | 77028 | 22.4% | 5.9%(+16.5)#70 | 4.5%(+18.0)#1,124 |
| 8. | 77032 | 22.2% | 5.9%(+16.2)#73 | 4.5%(+17.7)#1,154 |
| 9. | 77051 | 21.9% | 5.9%(+16.0)#76 | 4.5%(+17.4)#1,176 |
| 10. | 77026 | 20.3% | 5.9%(+14.4)#90 | 4.5%(+15.9)#1,330 |
| 11. | 77099 | 19.4% | 5.9%(+13.4)#100 | 4.5%(+14.9)#1,451 |
| 12. | 77031 | 19.1% | 5.9%(+13.1)#106 | 4.5%(+14.6)#1,495 |
| 13. | 77060 | 18.7% | 5.9%(+12.8)#112 | 4.5%(+14.2)#1,547 |
| 14. | 77092 | 18.1% | 5.9%(+12.1)#120 | 4.5%(+13.6)#1,654 |
| 15. | 77054 | 16.9% | 5.9%(+11.0)#141 | 4.5%(+12.4)#1,832 |
| 16. | 77022 | 16.4% | 5.9%(+10.5)#152 | 4.5%(+12.0)#1,936 |
| 17. | 77037 | 16.4% | 5.9%(+10.5)#153 | 4.5%(+12.0)#1,937 |
| 18. | 77039 | 15.9% | 5.9%(+9.93)#160 | 4.5%(+11.4)#2,044 |
| 19. | 77020 | 15.6% | 5.9%(+9.67)#170 | 4.5%(+11.1)#2,112 |
| 20. | 77036 | 15.3% | 5.9%(+9.35)#181 | 4.5%(+10.8)#2,194 |
| 21. | 77048 | 14.7% | 5.9%(+8.76)#190 | 4.5%(+10.2)#2,376 |
| 22. | 77074 | 14.5% | 5.9%(+8.55)#197 | 4.5%(+10.0)#2,434 |
| 23. | 77014 | 14.4% | 5.9%(+8.47)#200 | 4.5%(+9.94)#2,455 |
| 24. | 77012 | 13.8% | 5.9%(+7.82)#214 | 4.5%(+9.29)#2,651 |
| 25. | 77038 | 13.5% | 5.9%(+7.61)#228 | 4.5%(+9.08)#2,736 |
| 26. | 77087 | 13.5% | 5.9%(+7.54)#230 | 4.5%(+9.01)#2,765 |
| 27. | 77080 | 13.4% | 5.9%(+7.49)#233 | 4.5%(+8.96)#2,783 |
| 28. | 77072 | 13.2% | 5.9%(+7.31)#236 | 4.5%(+8.78)#2,860 |
| 29. | 77029 | 13.1% | 5.9%(+7.20)#239 | 4.5%(+8.67)#2,902 |
| 30. | 77034 | 12.7% | 5.9%(+6.81)#259 | 4.5%(+8.28)#3,066 |
| 31. | 77017 | 12.7% | 5.9%(+6.75)#262 | 4.5%(+8.22)#3,092 |
| 32. | 77076 | 12.5% | 5.9%(+6.57)#270 | 4.5%(+8.04)#3,171 |
| 33. | 77016 | 12.5% | 5.9%(+6.56)#271 | 4.5%(+8.03)#3,173 |
| 34. | 77067 | 12.3% | 5.9%(+6.33)#282 | 4.5%(+7.80)#3,262 |
| 35. | 77015 | 12.2% | 5.9%(+6.26)#286 | 4.5%(+7.73)#3,299 |
| 36. | 77082 | 12.0% | 5.9%(+6.11)#292 | 4.5%(+7.58)#3,368 |
| 37. | 77063 | 12.0% | 5.9%(+6.08)#296 | 4.5%(+7.55)#3,385 |
| 38. | 77057 | 12.0% | 5.9%(+6.06)#297 | 4.5%(+7.53)#3,397 |
| 39. | 77011 | 11.1% | 5.9%(+5.17)#334 | 4.5%(+6.64)#3,886 |
| 40. | 77069 | 11.1% | 5.9%(+5.15)#335 | 4.5%(+6.62)#3,895 |
| 41. | 77055 | 10.8% | 5.9%(+4.88)#350 | 4.5%(+6.35)#4,061 |
| 42. | 77049 | 10.6% | 5.9%(+4.69)#358 | 4.5%(+6.16)#4,175 |
| 43. | 77085 | 10.1% | 5.9%(+4.14)#382 | 4.5%(+5.61)#4,503 |
| 44. | 77013 | 10.1% | 5.9%(+4.13)#383 | 4.5%(+5.60)#4,509 |
| 45. | 77083 | 9.9% | 5.9%(+3.94)#397 | 4.5%(+5.41)#4,667 |
| 46. | 77053 | 9.8% | 5.9%(+3.85)#403 | 4.5%(+5.32)#4,733 |
| 47. | 77040 | 9.7% | 5.9%(+3.82)#406 | 4.5%(+5.29)#4,760 |
| 48. | 77021 | 9.7% | 5.9%(+3.75)#412 | 4.5%(+5.22)#4,804 |
| 49. | 77061 | 9.3% | 5.9%(+3.41)#426 | 4.5%(+4.88)#5,071 |
| 50. | 77045 | 9.1% | 5.9%(+3.12)#440 | 4.5%(+4.59)#5,337 |
| 51. | 77023 | 8.7% | 5.9%(+2.75)#469 | 4.5%(+4.22)#5,678 |
| 52. | 77003 | 8.5% | 5.9%(+2.55)#491 | 4.5%(+4.02)#5,871 |
| 53. | 77089 | 8.2% | 5.9%(+2.27)#522 | 4.5%(+3.74)#6,140 |
| 54. | 77035 | 8.0% | 5.9%(+2.08)#532 | 4.5%(+3.55)#6,340 |
| 55. | 77096 | 7.8% | 5.9%(+1.92)#544 | 4.5%(+3.39)#6,527 |
| 56. | 77058 | 7.5% | 5.9%(+1.58)#569 | 4.5%(+3.05)#6,966 |
| 57. | 77004 | 7.5% | 5.9%(+1.58)#570 | 4.5%(+3.05)#6,970 |
| 58. | 77086 | 7.0% | 5.9%(+1.08)#610 | 4.5%(+2.55)#7,658 |
| 59. | 77066 | 7.0% | 5.9%(+1.07)#612 | 4.5%(+2.54)#7,679 |
| 60. | 77043 | 6.7% | 5.9%(+0.769)#640 | 4.5%(+2.24)#8,114 |
| 61. | 77073 | 6.5% | 5.9%(+0.575)#665 | 4.5%(+2.04)#8,416 |
| 62. | 77088 | 6.3% | 5.9%(+0.371)#686 | 4.5%(+1.84)#8,770 |
| 63. | 77071 | 6.2% | 5.9%(+0.260)#702 | 4.5%(+1.73)#8,955 |
| 64. | 77041 | 6.2% | 5.9%(+0.255)#703 | 4.5%(+1.72)#8,967 |
| 65. | 77084 | 5.9% | 5.9%(-0.077)#737 | 4.5%(+1.39)#9,566 |
| 66. | 77077 | 5.7% | 5.9%(-0.198)#747 | 4.5%(+1.27)#9,795 |
| 67. | 77064 | 5.6% | 5.9%(-0.348)#767 | 4.5%(+1.12)#10,076 |
| 68. | 77009 | 5.4% | 5.9%(-0.519)#789 | 4.5%(+0.950)#10,426 |
| 69. | 77090 | 5.4% | 5.9%(-0.551)#797 | 4.5%(+0.918)#10,498 |
| 70. | 77042 | 5.1% | 5.9%(-0.853)#841 | 4.5%(+0.617)#11,136 |
| 71. | 77070 | 4.5% | 5.9%(-1.47)#918 | 4.5%(-0.006)#12,557 |
| 72. | 77075 | 4.2% | 5.9%(-1.69)#956 | 4.5%(-0.221)#13,118 |
| 73. | 77024 | 4.2% | 5.9%(-1.72)#963 | 4.5%(-0.251)#13,192 |
| 74. | 77062 | 4.1% | 5.9%(-1.83)#981 | 4.5%(-0.364)#13,521 |
| 75. | 77047 | 4.0% | 5.9%(-1.93)#999 | 4.5%(-0.457)#13,746 |
| 76. | 77044 | 3.9% | 5.9%(-2.04)#1,013 | 4.5%(-0.569)#14,077 |
| 77. | 77025 | 3.9% | 5.9%(-2.07)#1,022 | 4.5%(-0.606)#14,180 |
| 78. | 77059 | 3.4% | 5.9%(-2.51)#1,090 | 4.5%(-1.04)#15,513 |
| 79. | 77065 | 3.3% | 5.9%(-2.67)#1,118 | 4.5%(-1.20)#15,976 |
| 80. | 77068 | 3.1% | 5.9%(-2.82)#1,134 | 4.5%(-1.35)#16,502 |
| 81. | 77079 | 3.0% | 5.9%(-2.91)#1,153 | 4.5%(-1.44)#16,795 |
| 82. | 77095 | 2.9% | 5.9%(-3.03)#1,182 | 4.5%(-1.56)#17,170 |
| 83. | 77027 | 2.8% | 5.9%(-3.17)#1,209 | 4.5%(-1.70)#17,692 |
| 84. | 77018 | 2.7% | 5.9%(-3.23)#1,221 | 4.5%(-1.76)#17,887 |
| 85. | 77056 | 2.6% | 5.9%(-3.37)#1,241 | 4.5%(-1.90)#18,370 |
| 86. | 77019 | 2.2% | 5.9%(-3.68)#1,297 | 4.5%(-2.21)#19,457 |
| 87. | 77094 | 1.8% | 5.9%(-4.14)#1,384 | 4.5%(-2.67)#21,225 |
| 88. | 77030 | 1.7% | 5.9%(-4.26)#1,410 | 4.5%(-2.79)#21,694 |
| 89. | 77007 | 1.6% | 5.9%(-4.32)#1,419 | 4.5%(-2.85)#21,929 |
| 90. | 77008 | 1.4% | 5.9%(-4.50)#1,454 | 4.5%(-3.03)#22,541 |
| 91. | 77098 | 0.77% | 5.9%(-5.16)#1,528 | 4.5%(-3.69)#24,674 |
| 92. | 77005 | 0.56% | 5.9%(-5.37)#1,544 | 4.5%(-3.90)#25,214 |
| 93. | 77006 | 0.076% | 5.9%(-5.86)#1,560 | 4.5%(-4.39)#25,842 |
1
Common Questions
What are the Top 10 Zip Codes with the Highest Poverty Level Among Married Couples in Houston, TX?
Top 10 Zip Codes with the Highest Poverty Level Among Married Couples in Houston, TX are:
What zip code has the Highest Poverty Level Among Married Couples in Houston, TX?
77050 has the Highest Poverty Level Among Married Couples in Houston, TX with 49.3%.
What is the Poverty Level Among Married Couples in Houston, TX?
Poverty Level Among Married Couples in Houston is 9.3%.
What is the Poverty Level Among Married Couples in Texas?
Poverty Level Among Married Couples in Texas is 5.9%.
What is the Poverty Level Among Married Couples in the United States?
Poverty Level Among Married Couples in the United States is 4.5%.