Zip Codes with the Highest Percentage of Population with a Degree in Liberal Arts and History in Houston, TX
RELATED REPORTS & OPTIONS
Liberal Arts and History
Houston
Compare Zip Codes
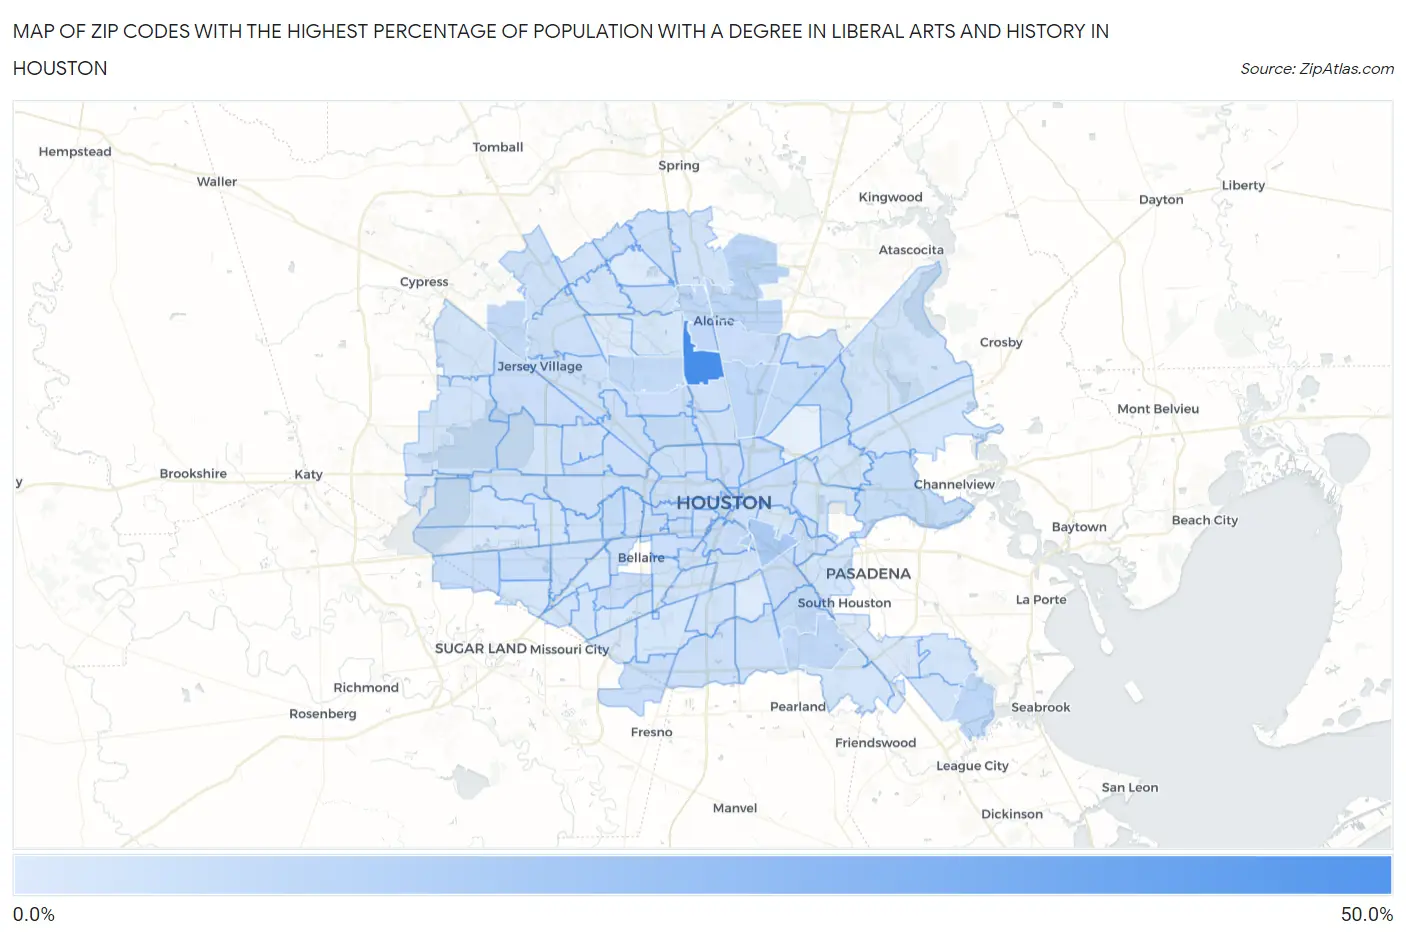
Map of Zip Codes with the Highest Percentage of Population with a Degree in Liberal Arts and History in Houston
0.19%
41.3%
Zip Codes with the Highest Percentage of Population with a Degree in Liberal Arts and History in Houston, TX
| Zip Code | % Graduates | vs State | vs National | |
| 1. | 77037 | 41.3% | 4.2%(+37.2)#10 | 4.9%(+36.4)#238 |
| 2. | 77023 | 11.9% | 4.2%(+7.78)#105 | 4.9%(+7.06)#2,225 |
| 3. | 77204 | 10.7% | 4.2%(+6.52)#132 | 4.9%(+5.80)#2,713 |
| 4. | 77032 | 8.0% | 4.2%(+3.81)#239 | 4.9%(+3.09)#4,942 |
| 5. | 77093 | 7.1% | 4.2%(+2.93)#309 | 4.9%(+2.21)#6,261 |
| 6. | 77058 | 7.0% | 4.2%(+2.89)#312 | 4.9%(+2.17)#6,327 |
| 7. | 77060 | 7.0% | 4.2%(+2.83)#319 | 4.9%(+2.11)#6,417 |
| 8. | 77075 | 6.9% | 4.2%(+2.75)#331 | 4.9%(+2.03)#6,548 |
| 9. | 77088 | 6.2% | 4.2%(+2.03)#407 | 4.9%(+1.31)#8,071 |
| 10. | 77065 | 6.1% | 4.2%(+1.99)#411 | 4.9%(+1.27)#8,165 |
| 11. | 77061 | 5.9% | 4.2%(+1.72)#445 | 4.9%(+1.00)#8,858 |
| 12. | 77016 | 5.8% | 4.2%(+1.64)#457 | 4.9%(+0.917)#9,060 |
| 13. | 77078 | 5.7% | 4.2%(+1.58)#462 | 4.9%(+0.856)#9,223 |
| 14. | 77057 | 5.7% | 4.2%(+1.53)#468 | 4.9%(+0.807)#9,355 |
| 15. | 77098 | 5.6% | 4.2%(+1.45)#482 | 4.9%(+0.729)#9,566 |
| 16. | 77015 | 5.5% | 4.2%(+1.35)#497 | 4.9%(+0.627)#9,873 |
| 17. | 77018 | 5.5% | 4.2%(+1.34)#499 | 4.9%(+0.615)#9,900 |
| 18. | 77004 | 5.2% | 4.2%(+1.01)#543 | 4.9%(+0.291)#10,836 |
| 19. | 77053 | 5.1% | 4.2%(+0.944)#552 | 4.9%(+0.223)#11,053 |
| 20. | 77083 | 5.0% | 4.2%(+0.804)#574 | 4.9%(+0.083)#11,479 |
| 21. | 77072 | 5.0% | 4.2%(+0.800)#575 | 4.9%(+0.078)#11,499 |
| 22. | 77002 | 4.9% | 4.2%(+0.742)#589 | 4.9%(+0.021)#11,663 |
| 23. | 77019 | 4.9% | 4.2%(+0.732)#592 | 4.9%(+0.011)#11,693 |
| 24. | 77026 | 4.9% | 4.2%(+0.708)#597 | 4.9%(-0.014)#11,789 |
| 25. | 77020 | 4.8% | 4.2%(+0.615)#616 | 4.9%(-0.106)#12,076 |
| 26. | 77012 | 4.6% | 4.2%(+0.490)#636 | 4.9%(-0.231)#12,516 |
| 27. | 77009 | 4.6% | 4.2%(+0.448)#643 | 4.9%(-0.274)#12,650 |
| 28. | 77087 | 4.6% | 4.2%(+0.400)#655 | 4.9%(-0.321)#12,795 |
| 29. | 77005 | 4.5% | 4.2%(+0.365)#664 | 4.9%(-0.356)#12,927 |
| 30. | 77096 | 4.5% | 4.2%(+0.345)#669 | 4.9%(-0.376)#12,984 |
| 31. | 77041 | 4.5% | 4.2%(+0.303)#679 | 4.9%(-0.419)#13,109 |
| 32. | 77039 | 4.4% | 4.2%(+0.213)#696 | 4.9%(-0.509)#13,410 |
| 33. | 77091 | 4.3% | 4.2%(+0.173)#702 | 4.9%(-0.549)#13,557 |
| 34. | 77068 | 4.3% | 4.2%(+0.143)#709 | 4.9%(-0.578)#13,656 |
| 35. | 77081 | 4.2% | 4.2%(+0.061)#729 | 4.9%(-0.660)#13,965 |
| 36. | 77036 | 4.1% | 4.2%(-0.012)#758 | 4.9%(-0.733)#14,245 |
| 37. | 77076 | 4.0% | 4.2%(-0.134)#780 | 4.9%(-0.855)#14,712 |
| 38. | 77024 | 3.9% | 4.2%(-0.228)#802 | 4.9%(-0.950)#15,088 |
| 39. | 77090 | 3.9% | 4.2%(-0.259)#809 | 4.9%(-0.980)#15,201 |
| 40. | 77048 | 3.9% | 4.2%(-0.291)#816 | 4.9%(-1.01)#15,290 |
| 41. | 77064 | 3.9% | 4.2%(-0.294)#818 | 4.9%(-1.02)#15,304 |
| 42. | 77055 | 3.8% | 4.2%(-0.314)#822 | 4.9%(-1.04)#15,392 |
| 43. | 77003 | 3.8% | 4.2%(-0.349)#831 | 4.9%(-1.07)#15,521 |
| 44. | 77056 | 3.7% | 4.2%(-0.417)#840 | 4.9%(-1.14)#15,767 |
| 45. | 77047 | 3.7% | 4.2%(-0.438)#845 | 4.9%(-1.16)#15,837 |
| 46. | 77027 | 3.7% | 4.2%(-0.439)#846 | 4.9%(-1.16)#15,842 |
| 47. | 77007 | 3.7% | 4.2%(-0.440)#847 | 4.9%(-1.16)#15,844 |
| 48. | 77092 | 3.7% | 4.2%(-0.446)#848 | 4.9%(-1.17)#15,869 |
| 49. | 77079 | 3.6% | 4.2%(-0.541)#871 | 4.9%(-1.26)#16,220 |
| 50. | 77050 | 3.6% | 4.2%(-0.554)#876 | 4.9%(-1.28)#16,260 |
| 51. | 77030 | 3.5% | 4.2%(-0.617)#888 | 4.9%(-1.34)#16,468 |
| 52. | 77070 | 3.4% | 4.2%(-0.767)#937 | 4.9%(-1.49)#17,025 |
| 53. | 77063 | 3.3% | 4.2%(-0.842)#955 | 4.9%(-1.56)#17,290 |
| 54. | 77008 | 3.3% | 4.2%(-0.850)#957 | 4.9%(-1.57)#17,309 |
| 55. | 77006 | 3.3% | 4.2%(-0.866)#960 | 4.9%(-1.59)#17,367 |
| 56. | 77067 | 3.3% | 4.2%(-0.876)#962 | 4.9%(-1.60)#17,405 |
| 57. | 77040 | 3.2% | 4.2%(-0.972)#979 | 4.9%(-1.69)#17,729 |
| 58. | 77022 | 3.2% | 4.2%(-0.986)#983 | 4.9%(-1.71)#17,780 |
| 59. | 77080 | 3.1% | 4.2%(-1.01)#988 | 4.9%(-1.74)#17,874 |
| 60. | 77044 | 2.9% | 4.2%(-1.24)#1,032 | 4.9%(-1.96)#18,646 |
| 61. | 77073 | 2.9% | 4.2%(-1.24)#1,039 | 4.9%(-1.96)#18,677 |
| 62. | 77054 | 2.9% | 4.2%(-1.27)#1,042 | 4.9%(-1.99)#18,740 |
| 63. | 77066 | 2.8% | 4.2%(-1.31)#1,053 | 4.9%(-2.03)#18,872 |
| 64. | 77062 | 2.7% | 4.2%(-1.41)#1,072 | 4.9%(-2.13)#19,186 |
| 65. | 77051 | 2.7% | 4.2%(-1.45)#1,080 | 4.9%(-2.17)#19,297 |
| 66. | 77084 | 2.7% | 4.2%(-1.45)#1,081 | 4.9%(-2.17)#19,328 |
| 67. | 77021 | 2.7% | 4.2%(-1.48)#1,090 | 4.9%(-2.21)#19,446 |
| 68. | 77031 | 2.6% | 4.2%(-1.50)#1,099 | 4.9%(-2.22)#19,504 |
| 69. | 77069 | 2.6% | 4.2%(-1.54)#1,104 | 4.9%(-2.26)#19,615 |
| 70. | 77042 | 2.6% | 4.2%(-1.57)#1,114 | 4.9%(-2.29)#19,705 |
| 71. | 77025 | 2.5% | 4.2%(-1.60)#1,120 | 4.9%(-2.32)#19,822 |
| 72. | 77074 | 2.5% | 4.2%(-1.61)#1,124 | 4.9%(-2.33)#19,849 |
| 73. | 77059 | 2.5% | 4.2%(-1.66)#1,138 | 4.9%(-2.38)#20,014 |
| 74. | 77013 | 2.5% | 4.2%(-1.67)#1,140 | 4.9%(-2.39)#20,052 |
| 75. | 77049 | 2.4% | 4.2%(-1.72)#1,151 | 4.9%(-2.44)#20,186 |
| 76. | 77029 | 2.4% | 4.2%(-1.72)#1,154 | 4.9%(-2.45)#20,202 |
| 77. | 77010 | 2.4% | 4.2%(-1.77)#1,162 | 4.9%(-2.49)#20,311 |
| 78. | 77017 | 2.3% | 4.2%(-1.82)#1,176 | 4.9%(-2.54)#20,458 |
| 79. | 77089 | 2.3% | 4.2%(-1.86)#1,187 | 4.9%(-2.58)#20,572 |
| 80. | 77095 | 2.3% | 4.2%(-1.87)#1,189 | 4.9%(-2.59)#20,591 |
| 81. | 77077 | 2.2% | 4.2%(-1.97)#1,207 | 4.9%(-2.69)#20,882 |
| 82. | 77071 | 2.1% | 4.2%(-2.04)#1,215 | 4.9%(-2.76)#21,052 |
| 83. | 77043 | 2.1% | 4.2%(-2.06)#1,225 | 4.9%(-2.79)#21,129 |
| 84. | 77011 | 2.0% | 4.2%(-2.19)#1,246 | 4.9%(-2.91)#21,451 |
| 85. | 77045 | 1.7% | 4.2%(-2.41)#1,281 | 4.9%(-3.13)#21,989 |
| 86. | 77038 | 1.6% | 4.2%(-2.51)#1,294 | 4.9%(-3.23)#22,203 |
| 87. | 77099 | 1.6% | 4.2%(-2.57)#1,304 | 4.9%(-3.29)#22,350 |
| 88. | 77035 | 1.6% | 4.2%(-2.58)#1,305 | 4.9%(-3.30)#22,370 |
| 89. | 77082 | 1.4% | 4.2%(-2.77)#1,330 | 4.9%(-3.49)#22,720 |
| 90. | 77085 | 0.99% | 4.2%(-3.16)#1,369 | 4.9%(-3.88)#23,403 |
| 91. | 77094 | 0.92% | 4.2%(-3.23)#1,372 | 4.9%(-3.95)#23,516 |
| 92. | 77046 | 0.84% | 4.2%(-3.31)#1,380 | 4.9%(-4.03)#23,642 |
| 93. | 77034 | 0.76% | 4.2%(-3.39)#1,385 | 4.9%(-4.11)#23,743 |
| 94. | 77086 | 0.34% | 4.2%(-3.81)#1,404 | 4.9%(-4.53)#24,134 |
| 95. | 77014 | 0.22% | 4.2%(-3.93)#1,409 | 4.9%(-4.65)#24,194 |
| 96. | 77033 | 0.19% | 4.2%(-3.97)#1,411 | 4.9%(-4.69)#24,201 |
1
Common Questions
What are the Top 10 Zip Codes with the Highest Percentage of Population with a Degree in Liberal Arts and History in Houston, TX?
Top 10 Zip Codes with the Highest Percentage of Population with a Degree in Liberal Arts and History in Houston, TX are:
What zip code has the Highest Percentage of Population with a Degree in Liberal Arts and History in Houston, TX?
77037 has the Highest Percentage of Population with a Degree in Liberal Arts and History in Houston, TX with 41.3%.
What is the Percentage of Population with a Degree in Liberal Arts and History in Houston, TX?
Percentage of Population with a Degree in Liberal Arts and History in Houston is 3.6%.
What is the Percentage of Population with a Degree in Liberal Arts and History in Texas?
Percentage of Population with a Degree in Liberal Arts and History in Texas is 4.2%.
What is the Percentage of Population with a Degree in Liberal Arts and History in the United States?
Percentage of Population with a Degree in Liberal Arts and History in the United States is 4.9%.