Zip Codes with the Highest Percentage of Population with a Degree in Liberal Arts and History in Lancaster, PA
RELATED REPORTS & OPTIONS
Liberal Arts and History
Lancaster
Compare Zip Codes
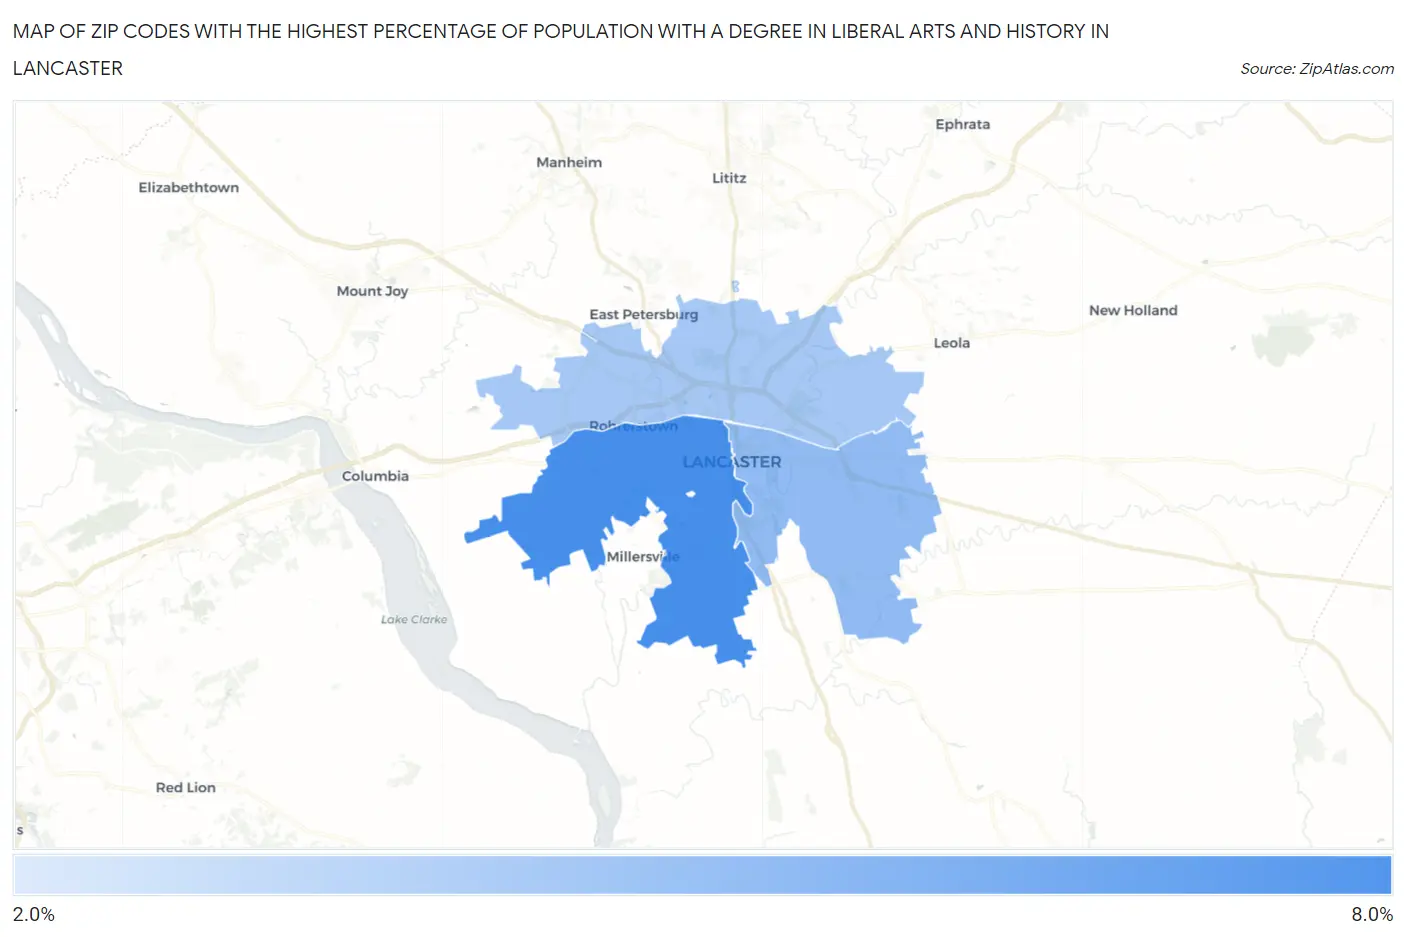
Map of Zip Codes with the Highest Percentage of Population with a Degree in Liberal Arts and History in Lancaster
2.5%
7.0%
Zip Codes with the Highest Percentage of Population with a Degree in Liberal Arts and History in Lancaster, PA
| Zip Code | % Graduates | vs State | vs National | |
| 1. | 17603 | 7.0% | 4.6%(+2.38)#310 | 4.9%(+2.12)#6,407 |
| 2. | 17602 | 4.7% | 4.6%(+0.134)#611 | 4.9%(-0.129)#12,178 |
| 3. | 17601 | 4.1% | 4.6%(-0.504)#726 | 4.9%(-0.767)#14,380 |
| 4. | 17606 | 2.5% | 4.6%(-2.11)#1,014 | 4.9%(-2.37)#19,988 |
1
Common Questions
What are the Top 3 Zip Codes with the Highest Percentage of Population with a Degree in Liberal Arts and History in Lancaster, PA?
Top 3 Zip Codes with the Highest Percentage of Population with a Degree in Liberal Arts and History in Lancaster, PA are:
What zip code has the Highest Percentage of Population with a Degree in Liberal Arts and History in Lancaster, PA?
17603 has the Highest Percentage of Population with a Degree in Liberal Arts and History in Lancaster, PA with 7.0%.
What is the Percentage of Population with a Degree in Liberal Arts and History in Lancaster, PA?
Percentage of Population with a Degree in Liberal Arts and History in Lancaster is 6.4%.
What is the Percentage of Population with a Degree in Liberal Arts and History in Pennsylvania?
Percentage of Population with a Degree in Liberal Arts and History in Pennsylvania is 4.6%.
What is the Percentage of Population with a Degree in Liberal Arts and History in the United States?
Percentage of Population with a Degree in Liberal Arts and History in the United States is 4.9%.