Zip Codes with the Highest Percentage of Population with a Degree in Liberal Arts and History in Levittown, PA
RELATED REPORTS & OPTIONS
Liberal Arts and History
Levittown
Compare Zip Codes
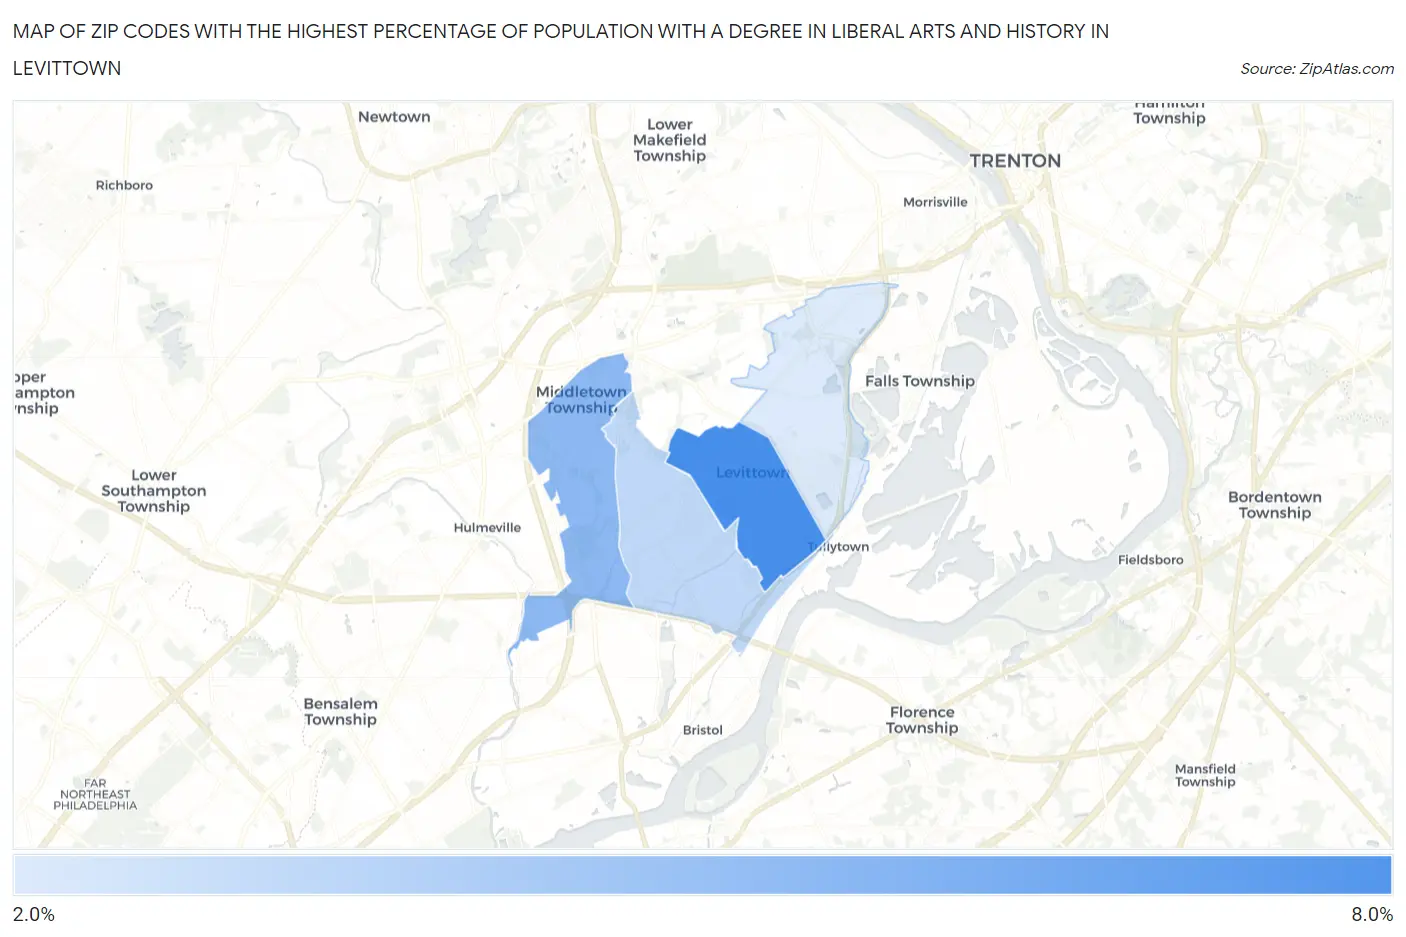
Map of Zip Codes with the Highest Percentage of Population with a Degree in Liberal Arts and History in Levittown
2.3%
6.5%
Zip Codes with the Highest Percentage of Population with a Degree in Liberal Arts and History in Levittown, PA
| Zip Code | % Graduates | vs State | vs National | |
| 1. | 19055 | 6.5% | 4.6%(+1.94)#352 | 4.9%(+1.67)#7,255 |
| 2. | 19056 | 4.6% | 4.6%(-0.045)#636 | 4.9%(-0.308)#12,750 |
| 3. | 19057 | 3.2% | 4.6%(-1.42)#891 | 4.9%(-1.68)#17,699 |
| 4. | 19054 | 2.3% | 4.6%(-2.28)#1,038 | 4.9%(-2.54)#20,471 |
1
Common Questions
What are the Top 3 Zip Codes with the Highest Percentage of Population with a Degree in Liberal Arts and History in Levittown, PA?
Top 3 Zip Codes with the Highest Percentage of Population with a Degree in Liberal Arts and History in Levittown, PA are:
What zip code has the Highest Percentage of Population with a Degree in Liberal Arts and History in Levittown, PA?
19055 has the Highest Percentage of Population with a Degree in Liberal Arts and History in Levittown, PA with 6.5%.
What is the Percentage of Population with a Degree in Liberal Arts and History in Levittown, PA?
Percentage of Population with a Degree in Liberal Arts and History in Levittown is 3.7%.
What is the Percentage of Population with a Degree in Liberal Arts and History in Pennsylvania?
Percentage of Population with a Degree in Liberal Arts and History in Pennsylvania is 4.6%.
What is the Percentage of Population with a Degree in Liberal Arts and History in the United States?
Percentage of Population with a Degree in Liberal Arts and History in the United States is 4.9%.