Zip Codes with the Highest Percentage of Population with a Degree in Liberal Arts and History in Bethlehem, PA
RELATED REPORTS & OPTIONS
Liberal Arts and History
Bethlehem
Compare Zip Codes
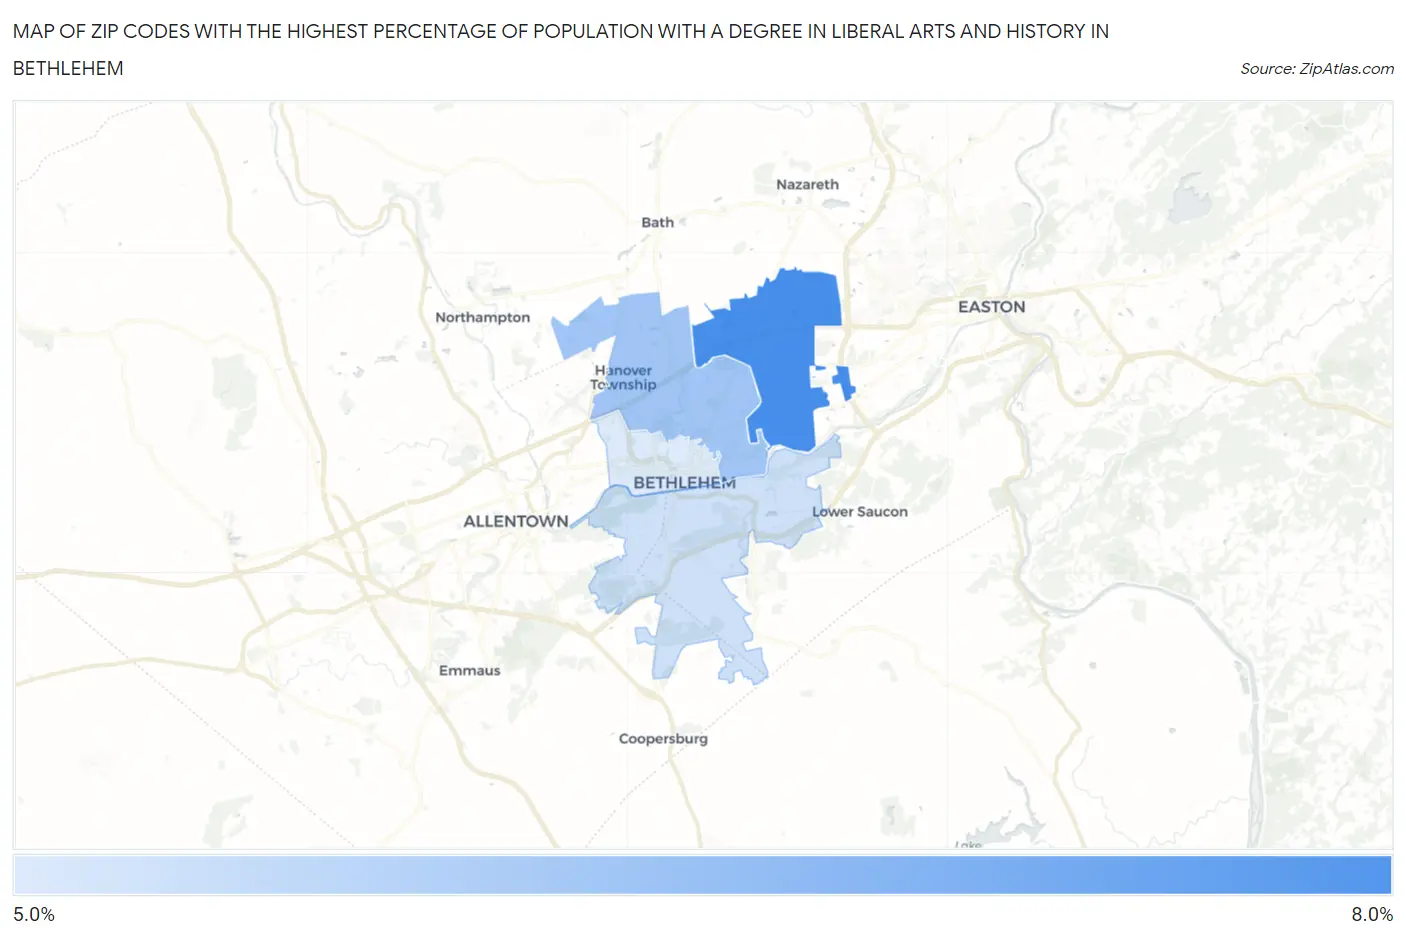
Map of Zip Codes with the Highest Percentage of Population with a Degree in Liberal Arts and History in Bethlehem
5.2%
6.1%
Zip Codes with the Highest Percentage of Population with a Degree in Liberal Arts and History in Bethlehem, PA
| Zip Code | % Graduates | vs State | vs National | |
| 1. | 18020 | 6.1% | 4.6%(+1.51)#407 | 4.9%(+1.25)#8,218 |
| 2. | 18017 | 5.6% | 4.6%(+0.982)#480 | 4.9%(+0.720)#9,587 |
| 3. | 18015 | 5.3% | 4.6%(+0.703)#511 | 4.9%(+0.441)#10,404 |
| 4. | 18018 | 5.2% | 4.6%(+0.626)#521 | 4.9%(+0.364)#10,627 |
1
Common Questions
What are the Top 3 Zip Codes with the Highest Percentage of Population with a Degree in Liberal Arts and History in Bethlehem, PA?
Top 3 Zip Codes with the Highest Percentage of Population with a Degree in Liberal Arts and History in Bethlehem, PA are:
What zip code has the Highest Percentage of Population with a Degree in Liberal Arts and History in Bethlehem, PA?
18020 has the Highest Percentage of Population with a Degree in Liberal Arts and History in Bethlehem, PA with 6.1%.
What is the Percentage of Population with a Degree in Liberal Arts and History in Bethlehem, PA?
Percentage of Population with a Degree in Liberal Arts and History in Bethlehem is 5.8%.
What is the Percentage of Population with a Degree in Liberal Arts and History in Pennsylvania?
Percentage of Population with a Degree in Liberal Arts and History in Pennsylvania is 4.6%.
What is the Percentage of Population with a Degree in Liberal Arts and History in the United States?
Percentage of Population with a Degree in Liberal Arts and History in the United States is 4.9%.