Zip Codes with the Highest Percentage of Population with a Degree in Liberal Arts and History in Carlisle, PA
RELATED REPORTS & OPTIONS
Liberal Arts and History
Carlisle
Compare Zip Codes
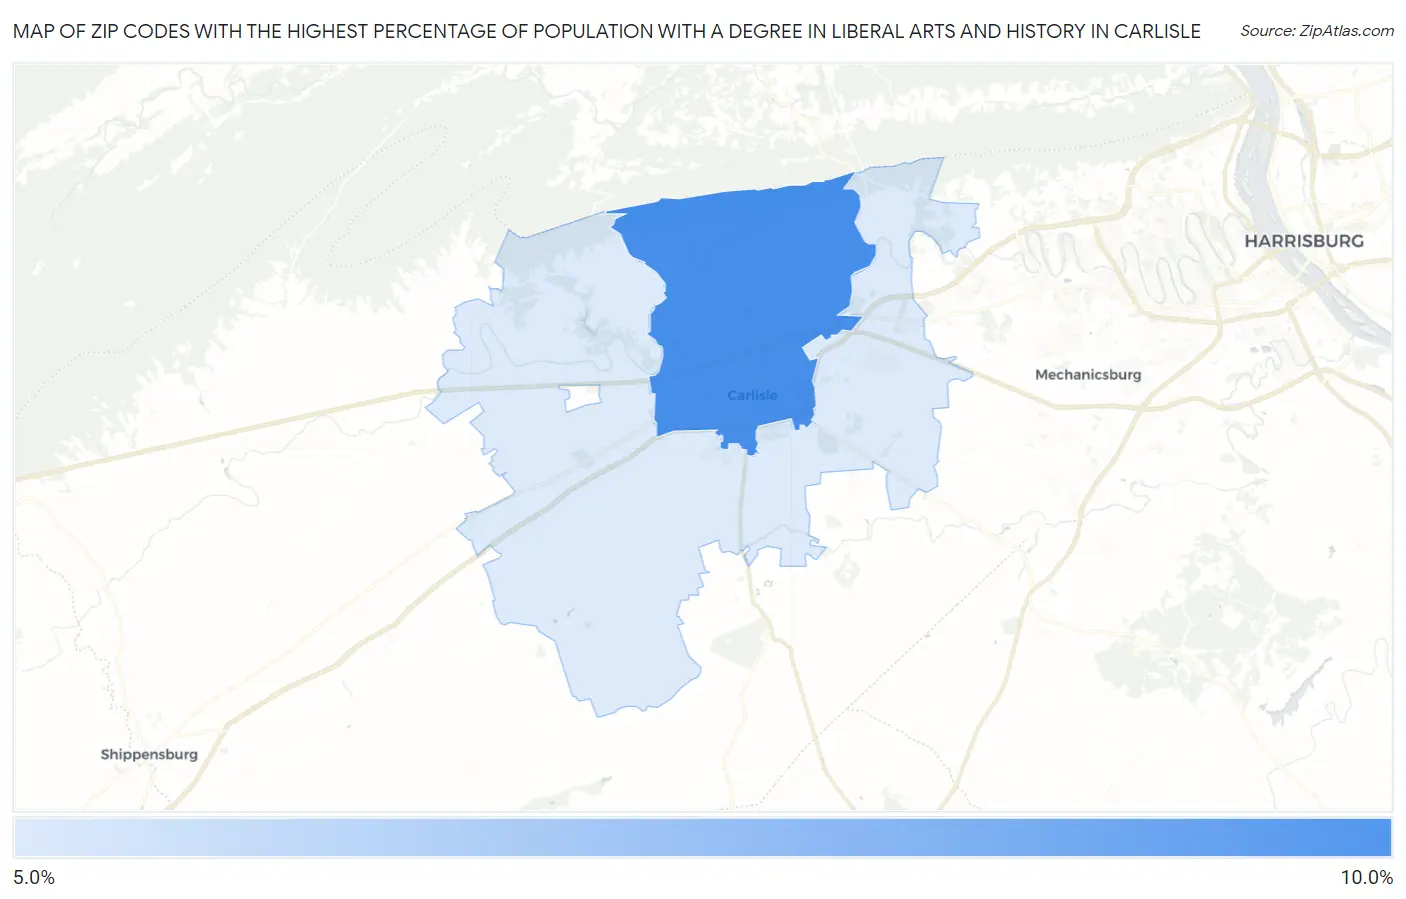
Map of Zip Codes with the Highest Percentage of Population with a Degree in Liberal Arts and History in Carlisle
5.2%
9.7%
Zip Codes with the Highest Percentage of Population with a Degree in Liberal Arts and History in Carlisle, PA
| Zip Code | % Graduates | vs State | vs National | |
| 1. | 17013 | 9.7% | 4.6%(+5.04)#168 | 4.9%(+4.78)#3,334 |
| 2. | 17015 | 5.2% | 4.6%(+0.632)#519 | 4.9%(+0.370)#10,616 |
1
Common Questions
What are the Top Zip Codes with the Highest Percentage of Population with a Degree in Liberal Arts and History in Carlisle, PA?
Top Zip Codes with the Highest Percentage of Population with a Degree in Liberal Arts and History in Carlisle, PA are:
What zip code has the Highest Percentage of Population with a Degree in Liberal Arts and History in Carlisle, PA?
17013 has the Highest Percentage of Population with a Degree in Liberal Arts and History in Carlisle, PA with 9.7%.
What is the Percentage of Population with a Degree in Liberal Arts and History in Pennsylvania?
Percentage of Population with a Degree in Liberal Arts and History in Pennsylvania is 4.6%.
What is the Percentage of Population with a Degree in Liberal Arts and History in the United States?
Percentage of Population with a Degree in Liberal Arts and History in the United States is 4.9%.