Zip Codes with the Highest Percentage of Population with a Degree in Liberal Arts and History in New Castle, PA
RELATED REPORTS & OPTIONS
Liberal Arts and History
New Castle
Compare Zip Codes
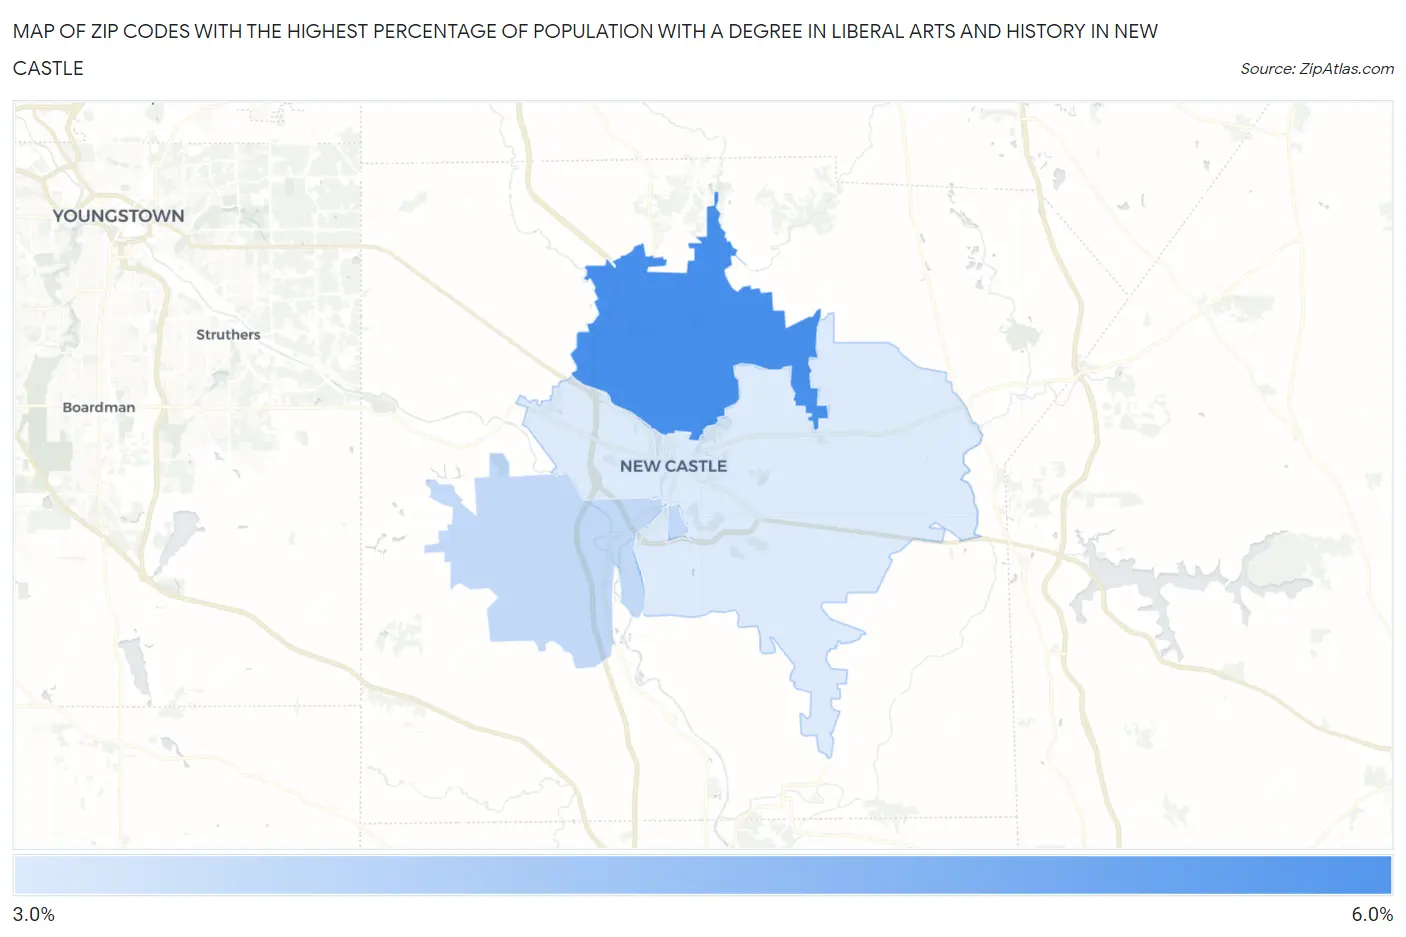
Map of Zip Codes with the Highest Percentage of Population with a Degree in Liberal Arts and History in New Castle
3.2%
5.2%
Zip Codes with the Highest Percentage of Population with a Degree in Liberal Arts and History in New Castle, PA
| Zip Code | % Graduates | vs State | vs National | |
| 1. | 16105 | 5.2% | 4.6%(+0.582)#531 | 4.9%(+0.320)#10,748 |
| 2. | 16102 | 3.6% | 4.6%(-1.03)#812 | 4.9%(-1.30)#16,316 |
| 3. | 16101 | 3.2% | 4.6%(-1.41)#888 | 4.9%(-1.67)#17,650 |
1
Common Questions
What are the Top Zip Codes with the Highest Percentage of Population with a Degree in Liberal Arts and History in New Castle, PA?
Top Zip Codes with the Highest Percentage of Population with a Degree in Liberal Arts and History in New Castle, PA are:
What zip code has the Highest Percentage of Population with a Degree in Liberal Arts and History in New Castle, PA?
16105 has the Highest Percentage of Population with a Degree in Liberal Arts and History in New Castle, PA with 5.2%.
What is the Percentage of Population with a Degree in Liberal Arts and History in New Castle, PA?
Percentage of Population with a Degree in Liberal Arts and History in New Castle is 3.9%.
What is the Percentage of Population with a Degree in Liberal Arts and History in Pennsylvania?
Percentage of Population with a Degree in Liberal Arts and History in Pennsylvania is 4.6%.
What is the Percentage of Population with a Degree in Liberal Arts and History in the United States?
Percentage of Population with a Degree in Liberal Arts and History in the United States is 4.9%.