Zip Codes with the Highest Percentage of Population with a Degree in Liberal Arts and History in York, PA
RELATED REPORTS & OPTIONS
Liberal Arts and History
York
Compare Zip Codes
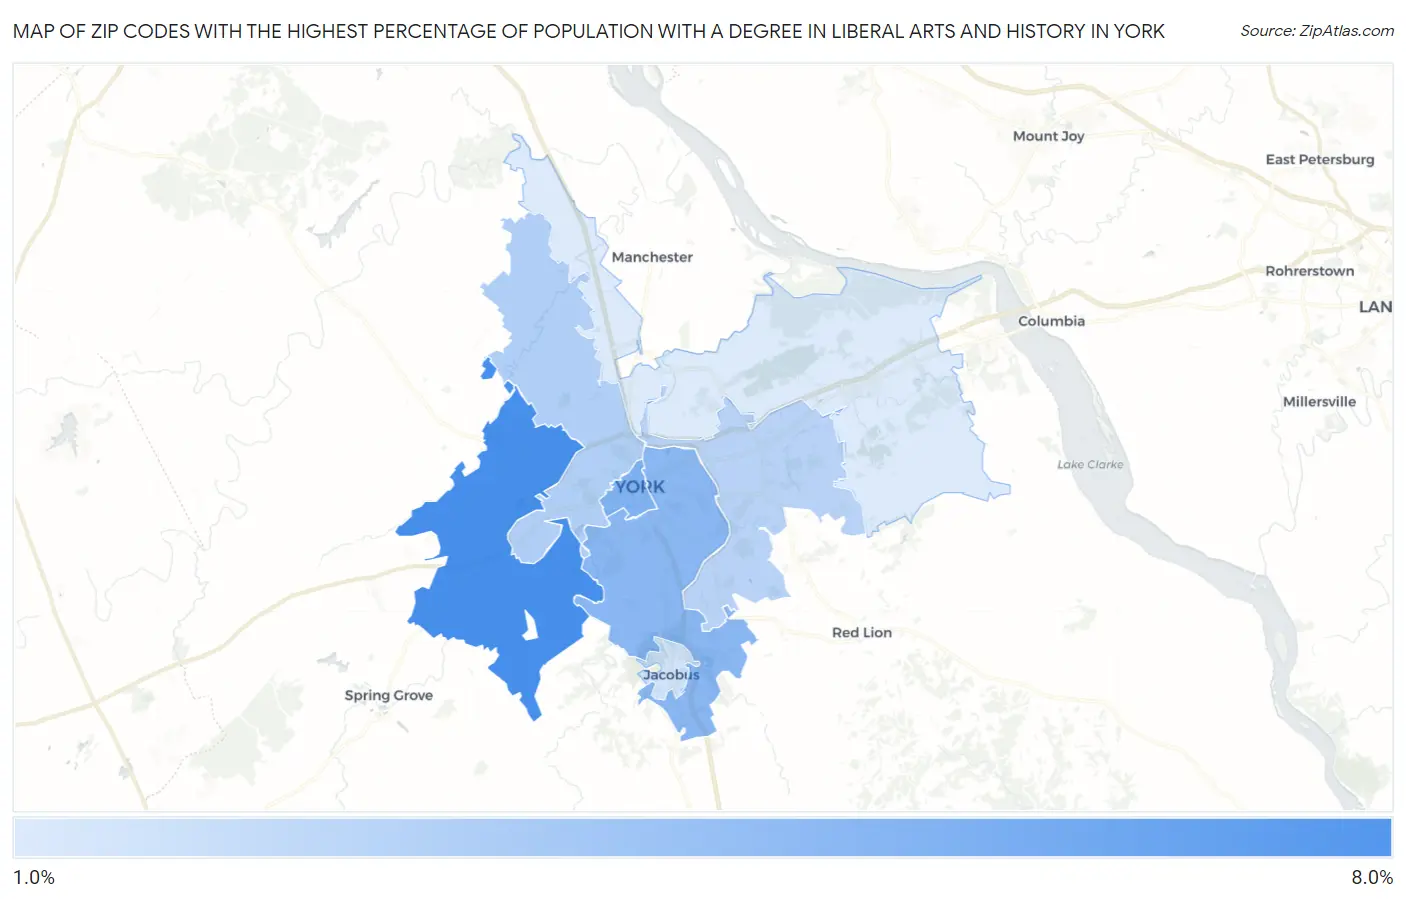
Map of Zip Codes with the Highest Percentage of Population with a Degree in Liberal Arts and History in York
1.9%
6.6%
Zip Codes with the Highest Percentage of Population with a Degree in Liberal Arts and History in York, PA
| Zip Code | % Graduates | vs State | vs National | |
| 1. | 17408 | 6.6% | 4.6%(+1.98)#346 | 4.9%(+1.72)#7,159 |
| 2. | 17401 | 4.8% | 4.6%(+0.155)#607 | 4.9%(-0.108)#12,082 |
| 3. | 17403 | 4.5% | 4.6%(-0.129)#654 | 4.9%(-0.392)#13,025 |
| 4. | 17404 | 3.2% | 4.6%(-1.41)#885 | 4.9%(-1.67)#17,638 |
| 5. | 17402 | 3.0% | 4.6%(-1.59)#921 | 4.9%(-1.85)#18,280 |
| 6. | 17407 | 2.2% | 4.6%(-2.37)#1,051 | 4.9%(-2.63)#20,714 |
| 7. | 17406 | 1.9% | 4.6%(-2.74)#1,114 | 4.9%(-3.01)#21,690 |
1
Common Questions
What are the Top 5 Zip Codes with the Highest Percentage of Population with a Degree in Liberal Arts and History in York, PA?
Top 5 Zip Codes with the Highest Percentage of Population with a Degree in Liberal Arts and History in York, PA are:
What zip code has the Highest Percentage of Population with a Degree in Liberal Arts and History in York, PA?
17408 has the Highest Percentage of Population with a Degree in Liberal Arts and History in York, PA with 6.6%.
What is the Percentage of Population with a Degree in Liberal Arts and History in York, PA?
Percentage of Population with a Degree in Liberal Arts and History in York is 4.1%.
What is the Percentage of Population with a Degree in Liberal Arts and History in Pennsylvania?
Percentage of Population with a Degree in Liberal Arts and History in Pennsylvania is 4.6%.
What is the Percentage of Population with a Degree in Liberal Arts and History in the United States?
Percentage of Population with a Degree in Liberal Arts and History in the United States is 4.9%.