Zip Codes with the Highest Percentage of Population Employed in Real Estate, Rental & Leasing in Philadelphia, PA
RELATED REPORTS & OPTIONS
Real Estate, Rental & Leasing
Philadelphia
Compare Zip Codes
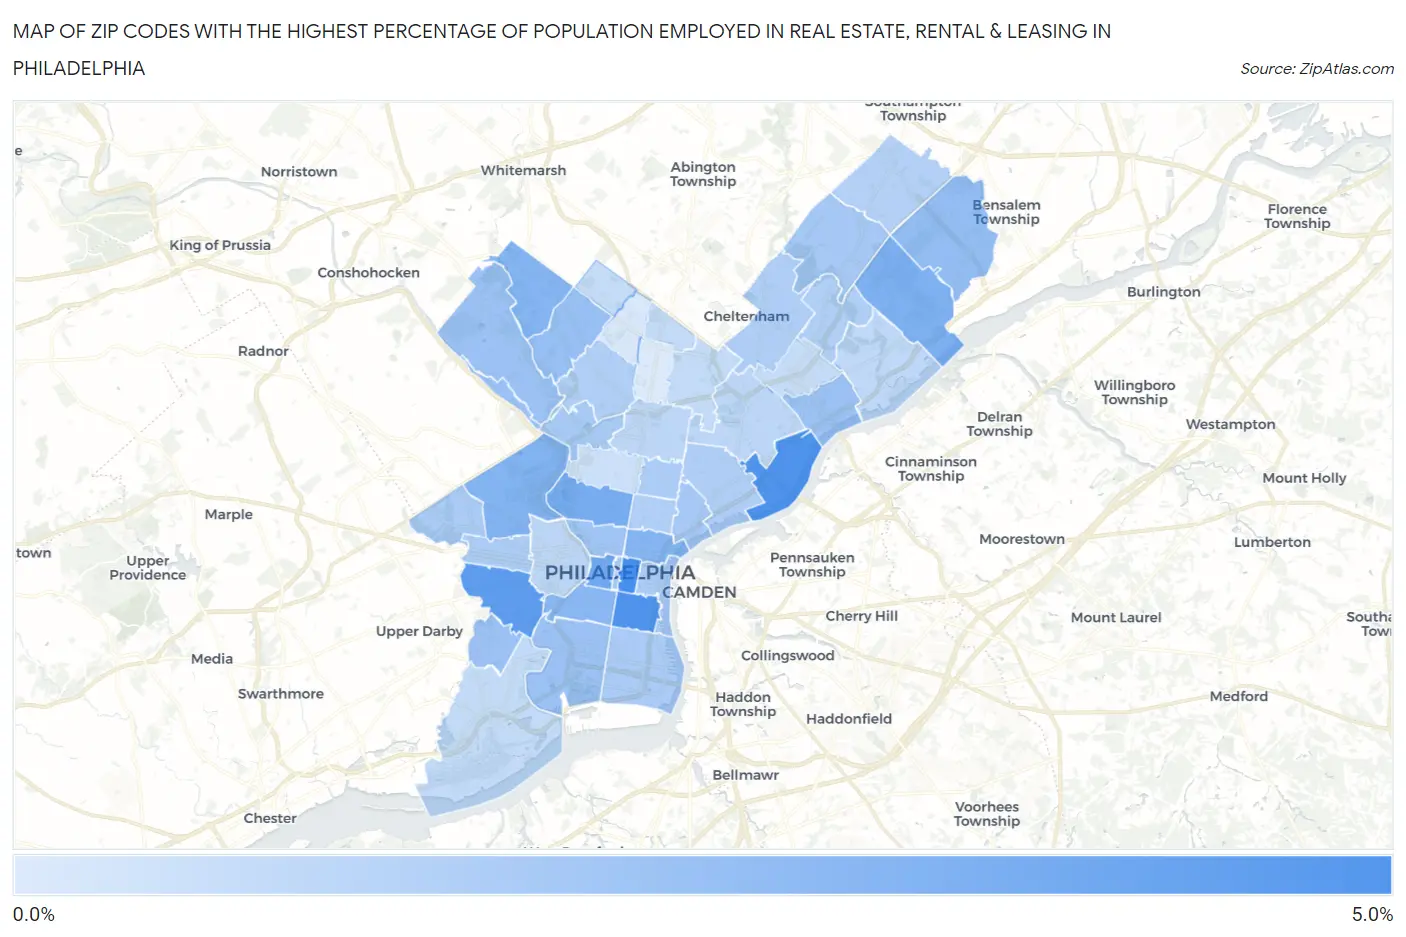
Map of Zip Codes with the Highest Percentage of Population Employed in Real Estate, Rental & Leasing in Philadelphia
0.10%
4.1%
Zip Codes with the Highest Percentage of Population Employed in Real Estate, Rental & Leasing in Philadelphia, PA
| Zip Code | % Employed | vs State | vs National | |
| 1. | 19107 | 4.1% | 1.5%(+2.63)#78 | 1.9%(+2.23)#2,045 |
| 2. | 19147 | 4.0% | 1.5%(+2.46)#80 | 1.9%(+2.06)#2,240 |
| 3. | 19137 | 3.9% | 1.5%(+2.37)#82 | 1.9%(+1.97)#2,310 |
| 4. | 19143 | 3.5% | 1.5%(+1.98)#98 | 1.9%(+1.58)#2,895 |
| 5. | 19103 | 3.0% | 1.5%(+1.51)#126 | 1.9%(+1.11)#3,891 |
| 6. | 19121 | 2.8% | 1.5%(+1.32)#143 | 1.9%(+0.918)#4,404 |
| 7. | 19114 | 2.6% | 1.5%(+1.14)#160 | 1.9%(+0.742)#4,983 |
| 8. | 19131 | 2.5% | 1.5%(+0.997)#182 | 1.9%(+0.598)#5,532 |
| 9. | 19118 | 2.4% | 1.5%(+0.930)#193 | 1.9%(+0.531)#5,795 |
| 10. | 19123 | 2.4% | 1.5%(+0.926)#195 | 1.9%(+0.527)#5,816 |
| 11. | 19146 | 2.3% | 1.5%(+0.814)#216 | 1.9%(+0.415)#6,278 |
| 12. | 19154 | 2.1% | 1.5%(+0.590)#260 | 1.9%(+0.191)#7,407 |
| 13. | 19119 | 1.9% | 1.5%(+0.441)#298 | 1.9%(+0.042)#8,226 |
| 14. | 19127 | 1.9% | 1.5%(+0.408)#305 | 1.9%(+0.009)#8,467 |
| 15. | 19128 | 1.9% | 1.5%(+0.390)#314 | 1.9%(-0.009)#8,584 |
| 16. | 19135 | 1.8% | 1.5%(+0.337)#339 | 1.9%(-0.062)#8,935 |
| 17. | 19142 | 1.8% | 1.5%(+0.332)#343 | 1.9%(-0.067)#8,966 |
| 18. | 19145 | 1.8% | 1.5%(+0.297)#355 | 1.9%(-0.102)#9,202 |
| 19. | 19130 | 1.7% | 1.5%(+0.191)#393 | 1.9%(-0.208)#9,872 |
| 20. | 19125 | 1.6% | 1.5%(+0.101)#428 | 1.9%(-0.298)#10,486 |
| 21. | 19115 | 1.6% | 1.5%(+0.095)#435 | 1.9%(-0.304)#10,535 |
| 22. | 19129 | 1.5% | 1.5%(+0.044)#454 | 1.9%(-0.354)#10,877 |
| 23. | 19102 | 1.5% | 1.5%(+0.032)#458 | 1.9%(-0.366)#10,966 |
| 24. | 19151 | 1.5% | 1.5%(-0.034)#483 | 1.9%(-0.433)#11,496 |
| 25. | 19148 | 1.5% | 1.5%(-0.039)#485 | 1.9%(-0.438)#11,545 |
| 26. | 19133 | 1.4% | 1.5%(-0.086)#499 | 1.9%(-0.485)#11,922 |
| 27. | 19139 | 1.4% | 1.5%(-0.091)#500 | 1.9%(-0.490)#11,961 |
| 28. | 19106 | 1.4% | 1.5%(-0.131)#518 | 1.9%(-0.530)#12,266 |
| 29. | 19111 | 1.3% | 1.5%(-0.152)#524 | 1.9%(-0.551)#12,407 |
| 30. | 19134 | 1.3% | 1.5%(-0.161)#529 | 1.9%(-0.560)#12,477 |
| 31. | 19152 | 1.3% | 1.5%(-0.211)#552 | 1.9%(-0.610)#12,858 |
| 32. | 19122 | 1.3% | 1.5%(-0.224)#560 | 1.9%(-0.623)#12,963 |
| 33. | 19144 | 1.2% | 1.5%(-0.244)#566 | 1.9%(-0.643)#13,100 |
| 34. | 19116 | 1.2% | 1.5%(-0.277)#586 | 1.9%(-0.676)#13,375 |
| 35. | 19104 | 0.98% | 1.5%(-0.512)#705 | 1.9%(-0.911)#15,321 |
| 36. | 19124 | 0.97% | 1.5%(-0.525)#714 | 1.9%(-0.924)#15,421 |
| 37. | 19140 | 0.96% | 1.5%(-0.535)#718 | 1.9%(-0.933)#15,494 |
| 38. | 19136 | 0.87% | 1.5%(-0.627)#768 | 1.9%(-1.03)#16,211 |
| 39. | 19126 | 0.79% | 1.5%(-0.707)#803 | 1.9%(-1.11)#16,810 |
| 40. | 19153 | 0.76% | 1.5%(-0.728)#821 | 1.9%(-1.13)#16,970 |
| 41. | 19120 | 0.75% | 1.5%(-0.739)#829 | 1.9%(-1.14)#17,047 |
| 42. | 19150 | 0.71% | 1.5%(-0.780)#854 | 1.9%(-1.18)#17,384 |
| 43. | 19149 | 0.70% | 1.5%(-0.796)#862 | 1.9%(-1.19)#17,526 |
| 44. | 19132 | 0.51% | 1.5%(-0.979)#955 | 1.9%(-1.38)#18,961 |
| 45. | 19138 | 0.23% | 1.5%(-1.26)#1,080 | 1.9%(-1.66)#20,865 |
| 46. | 19141 | 0.10% | 1.5%(-1.39)#1,113 | 1.9%(-1.79)#21,388 |
1
Common Questions
What are the Top 10 Zip Codes with the Highest Percentage of Population Employed in Real Estate, Rental & Leasing in Philadelphia, PA?
Top 10 Zip Codes with the Highest Percentage of Population Employed in Real Estate, Rental & Leasing in Philadelphia, PA are:
What zip code has the Highest Percentage of Population Employed in Real Estate, Rental & Leasing in Philadelphia, PA?
19107 has the Highest Percentage of Population Employed in Real Estate, Rental & Leasing in Philadelphia, PA with 4.1%.
What is the Percentage of Population Employed in Real Estate, Rental & Leasing in Philadelphia, PA?
Percentage of Population Employed in Real Estate, Rental & Leasing in Philadelphia is 1.7%.
What is the Percentage of Population Employed in Real Estate, Rental & Leasing in Pennsylvania?
Percentage of Population Employed in Real Estate, Rental & Leasing in Pennsylvania is 1.5%.
What is the Percentage of Population Employed in Real Estate, Rental & Leasing in the United States?
Percentage of Population Employed in Real Estate, Rental & Leasing in the United States is 1.9%.