Zip Codes with the Highest Percentage of Population Employed in Real Estate, Rental & Leasing in Norristown, PA
RELATED REPORTS & OPTIONS
Real Estate, Rental & Leasing
Norristown
Compare Zip Codes
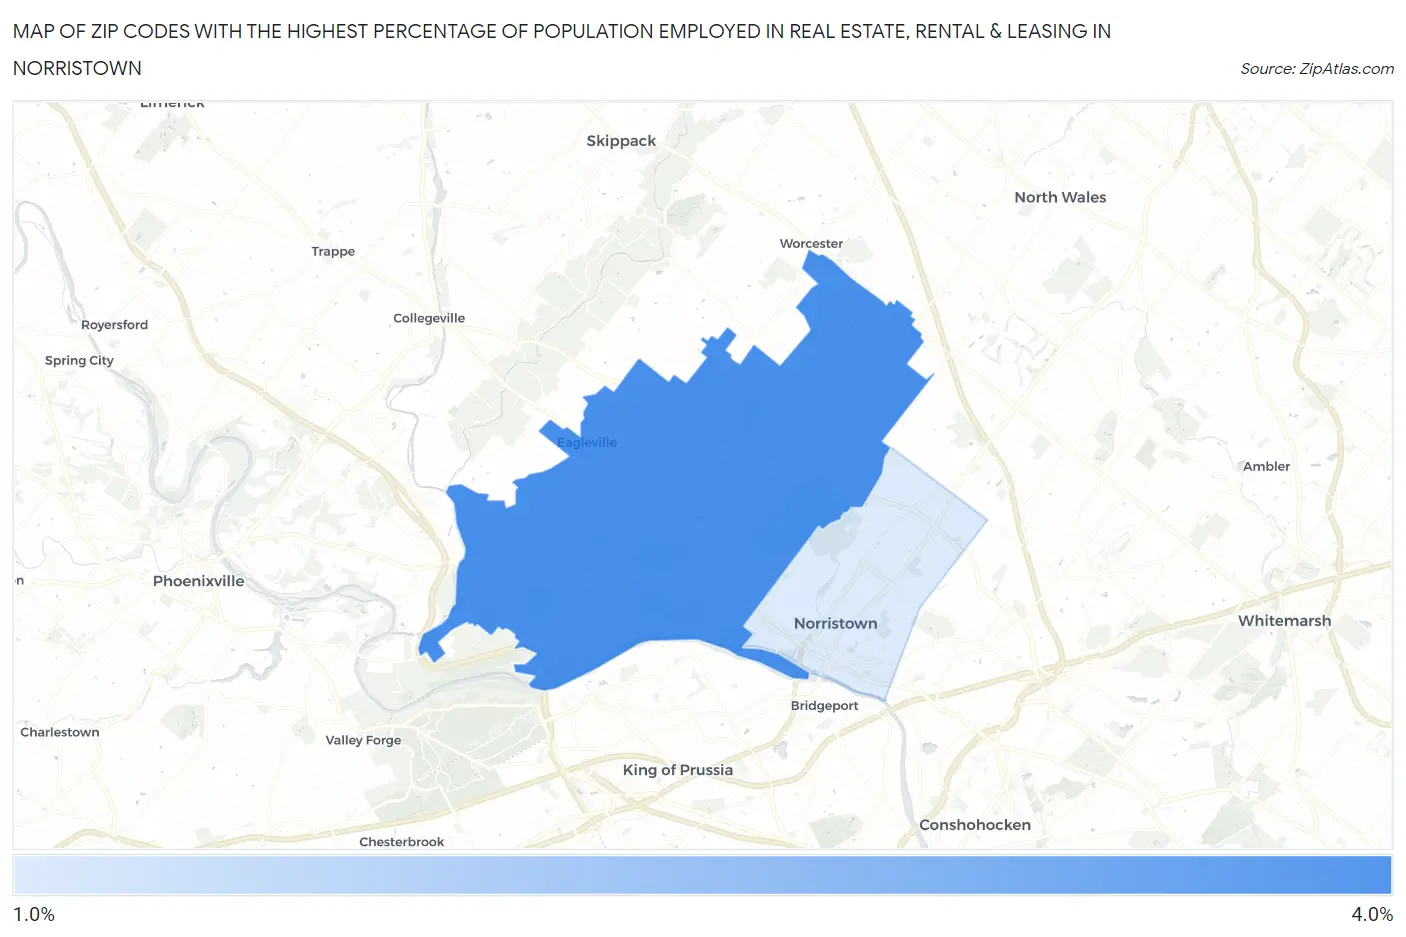
Map of Zip Codes with the Highest Percentage of Population Employed in Real Estate, Rental & Leasing in Norristown
1.4%
3.8%
Zip Codes with the Highest Percentage of Population Employed in Real Estate, Rental & Leasing in Norristown, PA
| Zip Code | % Employed | vs State | vs National | |
| 1. | 19403 | 3.8% | 1.5%(+2.34)#85 | 1.9%(+1.94)#2,356 |
| 2. | 19401 | 1.4% | 1.5%(-0.045)#488 | 1.9%(-0.444)#11,601 |
1
Common Questions
What are the Top Zip Codes with the Highest Percentage of Population Employed in Real Estate, Rental & Leasing in Norristown, PA?
Top Zip Codes with the Highest Percentage of Population Employed in Real Estate, Rental & Leasing in Norristown, PA are:
What zip code has the Highest Percentage of Population Employed in Real Estate, Rental & Leasing in Norristown, PA?
19403 has the Highest Percentage of Population Employed in Real Estate, Rental & Leasing in Norristown, PA with 3.8%.
What is the Percentage of Population Employed in Real Estate, Rental & Leasing in Pennsylvania?
Percentage of Population Employed in Real Estate, Rental & Leasing in Pennsylvania is 1.5%.
What is the Percentage of Population Employed in Real Estate, Rental & Leasing in the United States?
Percentage of Population Employed in Real Estate, Rental & Leasing in the United States is 1.9%.