Zip Codes with the Highest Percentage of Population Employed in Real Estate, Rental & Leasing in Bethlehem, PA
RELATED REPORTS & OPTIONS
Real Estate, Rental & Leasing
Bethlehem
Compare Zip Codes
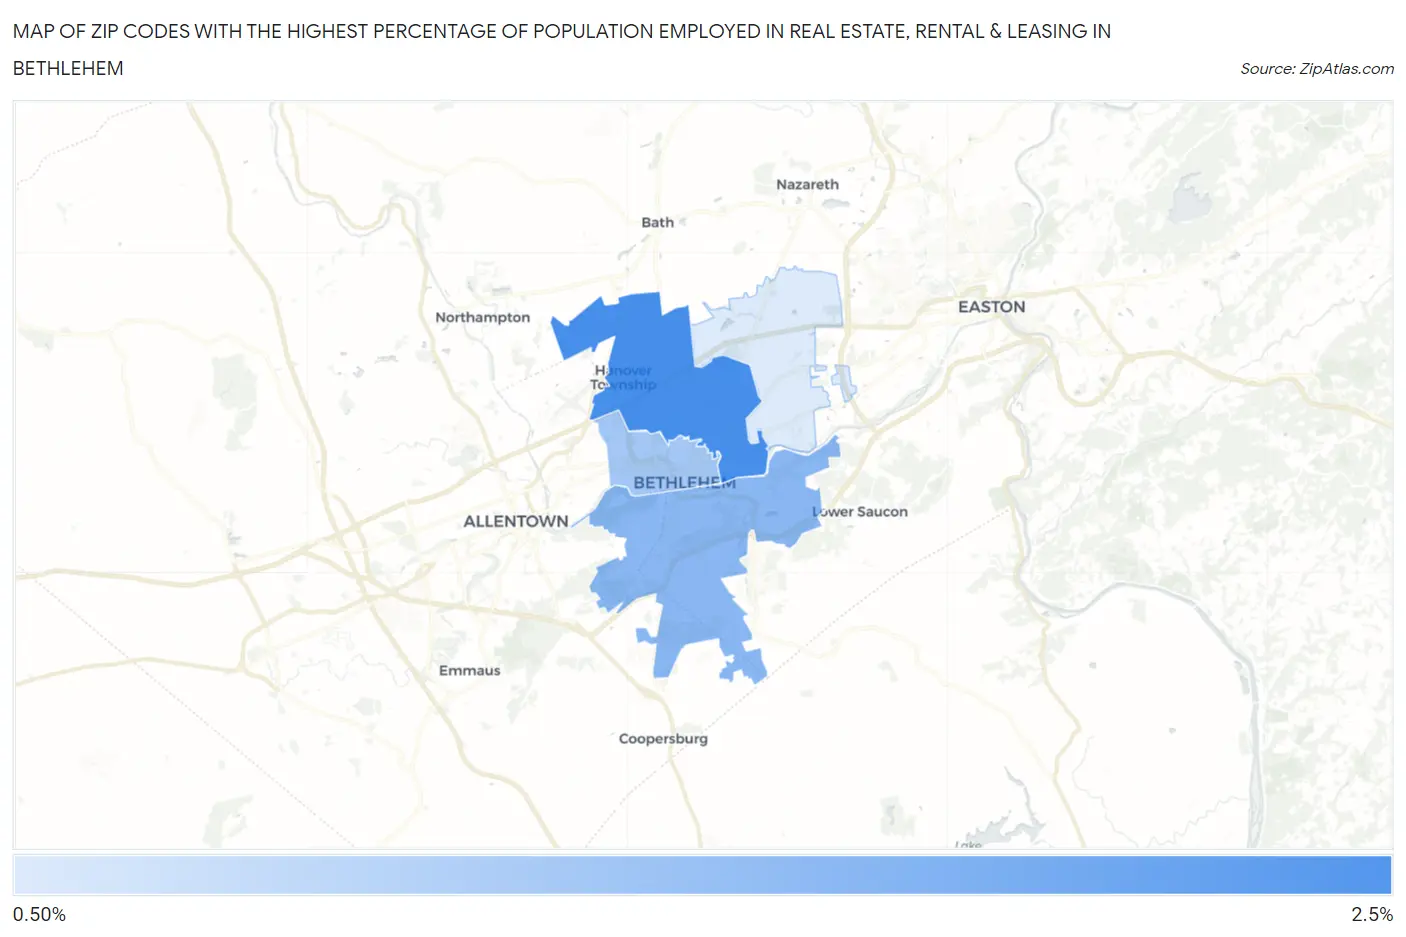
Map of Zip Codes with the Highest Percentage of Population Employed in Real Estate, Rental & Leasing in Bethlehem
0.77%
2.4%
Zip Codes with the Highest Percentage of Population Employed in Real Estate, Rental & Leasing in Bethlehem, PA
| Zip Code | % Employed | vs State | vs National | |
| 1. | 18017 | 2.4% | 1.5%(+0.886)#202 | 1.9%(+0.487)#5,985 |
| 2. | 18015 | 1.7% | 1.5%(+0.174)#406 | 1.9%(-0.225)#9,992 |
| 3. | 18018 | 1.4% | 1.5%(-0.108)#511 | 1.9%(-0.507)#12,102 |
| 4. | 18020 | 0.77% | 1.5%(-0.720)#817 | 1.9%(-1.12)#16,900 |
1
Common Questions
What are the Top 3 Zip Codes with the Highest Percentage of Population Employed in Real Estate, Rental & Leasing in Bethlehem, PA?
Top 3 Zip Codes with the Highest Percentage of Population Employed in Real Estate, Rental & Leasing in Bethlehem, PA are:
What zip code has the Highest Percentage of Population Employed in Real Estate, Rental & Leasing in Bethlehem, PA?
18017 has the Highest Percentage of Population Employed in Real Estate, Rental & Leasing in Bethlehem, PA with 2.4%.
What is the Percentage of Population Employed in Real Estate, Rental & Leasing in Bethlehem, PA?
Percentage of Population Employed in Real Estate, Rental & Leasing in Bethlehem is 1.6%.
What is the Percentage of Population Employed in Real Estate, Rental & Leasing in Pennsylvania?
Percentage of Population Employed in Real Estate, Rental & Leasing in Pennsylvania is 1.5%.
What is the Percentage of Population Employed in Real Estate, Rental & Leasing in the United States?
Percentage of Population Employed in Real Estate, Rental & Leasing in the United States is 1.9%.