Zip Codes with the Highest Percentage of Population with a Degree in Computers and Mathematics in Tulsa, OK

RELATED REPORTS & OPTIONS

Computers and Mathematics
Population
Families and Households
Female Fertility
Female Fertility (Unmarried)
Race (Community Size)
Race (Percentage)
Ancestry (Community Size)
AfghanAfricanAleutAmericanApacheArabArapahoArgentineanArmenianAustralianAustrianBahamianBangladeshiBasqueBelgianBelizeanBhutaneseBlackfeetBolivianBrazilianBritishBulgarianBurmeseCajunCanadianCelticCentral AmericanCentral American IndianCherokeeCheyenneChickasawChileanChippewaChoctawColombianComancheCosta RicanCreekCroatianCubanCzechCzechoslovakianDanishDelawareDominicanDutchDutch West IndianEastern EuropeanEcuadorianEgyptianEnglishEstonianEthiopianEuropeanFilipinoFinnishFrenchFrench American IndianFrench CanadianGermanGerman RussianGhanaianGreekGuamanian / ChamorroGuatemalanHaitianHonduranHungarianIcelanderIndian (Asian)IndonesianInupiatIranianIraqiIrishIroquoisIsraeliItalianJamaicanJapaneseJordanianKenyanKiowaKoreanLaotianLatvianLebaneseLiberianLithuanianLumbeeLuxembourgerMalaysianMexicanMexican American IndianMoroccanNative HawaiianNavajoNicaraguanNigerianNorthern EuropeanNorwegianOsageOttawaPakistaniPalestinianPanamanianPennsylvania GermanPeruvianPimaPolishPortuguesePotawatomiPuebloPuerto RicanRomanianRussianSalvadoranSamoanScandinavianScotch-IrishScottishSeminoleSiouxSlavicSlovakSloveneSouth AmericanSouth American IndianSpaniardSpanishSpanish AmericanSri LankanSubsaharan AfricanSudaneseSwedishSwissSyrianThaiTlingit-HaidaTrinidadian and TobagonianTurkishUgandanUkrainianUruguayanVenezuelanVietnameseWelshWest IndianYugoslavian
Ancestry (Percentage)
AfghanAfricanAleutAmericanApacheArabArapahoArgentineanArmenianAustralianAustrianBahamianBangladeshiBasqueBelgianBelizeanBhutaneseBlackfeetBolivianBrazilianBritishBulgarianBurmeseCajunCanadianCelticCentral AmericanCentral American IndianCherokeeCheyenneChickasawChileanChippewaChoctawColombianComancheCosta RicanCreekCroatianCubanCzechCzechoslovakianDanishDelawareDominicanDutchDutch West IndianEastern EuropeanEcuadorianEgyptianEnglishEstonianEthiopianEuropeanFilipinoFinnishFrenchFrench American IndianFrench CanadianGermanGerman RussianGhanaianGreekGuamanian / ChamorroGuatemalanHaitianHonduranHungarianIcelanderIndian (Asian)IndonesianInupiatIranianIraqiIrishIroquoisIsraeliItalianJamaicanJapaneseJordanianKenyanKiowaKoreanLaotianLatvianLebaneseLiberianLithuanianLumbeeLuxembourgerMalaysianMexicanMexican American IndianMoroccanNative HawaiianNavajoNicaraguanNigerianNorthern EuropeanNorwegianOsageOttawaPakistaniPalestinianPanamanianPennsylvania GermanPeruvianPimaPolishPortuguesePotawatomiPuebloPuerto RicanRomanianRussianSalvadoranSamoanScandinavianScotch-IrishScottishSeminoleSiouxSlavicSlovakSloveneSouth AmericanSouth American IndianSpaniardSpanishSpanish AmericanSri LankanSubsaharan AfricanSudaneseSwedishSwissSyrianThaiTlingit-HaidaTrinidadian and TobagonianTurkishUgandanUkrainianUruguayanVenezuelanVietnameseWelshWest IndianYugoslavian
Immigrant Origin (Total)
AfghanistanAfricaArgentinaAsiaAustraliaAustriaBahamasBangladeshBelgiumBelizeBoliviaBrazilBurma / MyanmarCameroonCanadaCaribbeanCentral AmericaChileChinaColombiaCosta RicaCubaDenmarkDominican RepublicEastern AfricaEastern AsiaEastern EuropeEcuadorEgyptEl SalvadorEnglandEritreaEthiopiaEuropeFranceGermanyGhanaGreeceGuatemalaHaitiHondurasHong KongIndiaIndonesiaIranIraqIrelandIsraelItalyJamaicaJapanJordanKazakhstanKenyaKoreaKuwaitLaosLatin AmericaLatviaLebanonLiberiaMalaysiaMexicoMicronesiaMiddle AfricaMoroccoNepalNetherlandsNicaraguaNigeriaNorthern AfricaNorthern EuropeNorwayOceaniaPakistanPanamaPeruPhilippinesPolandPortugalRomaniaRussiaSaudi ArabiaScotlandSouth AfricaSouth AmericaSouth Central AsiaSouth Eastern AsiaSouthern EuropeSpainSwedenSyriaTaiwanThailandTrinidad and TobagoTurkeyUgandaUkraineUruguayVenezuelaVietnamWestern AfricaWestern AsiaWestern EuropeZaireZimbabwe
Immigrant Origin (Percentage)
AfghanistanAfricaArgentinaAsiaAustraliaAustriaBahamasBangladeshBelgiumBelizeBoliviaBrazilBurma / MyanmarCameroonCanadaCaribbeanCentral AmericaChileChinaColombiaCosta RicaCubaDenmarkDominican RepublicEastern AfricaEastern AsiaEastern EuropeEcuadorEgyptEl SalvadorEnglandEritreaEthiopiaEuropeFranceGermanyGhanaGreeceGuatemalaHaitiHondurasHong KongIndiaIndonesiaIranIraqIrelandIsraelItalyJamaicaJapanJordanKazakhstanKenyaKoreaKuwaitLaosLatin AmericaLatviaLebanonLiberiaMalaysiaMexicoMicronesiaMiddle AfricaMoroccoNepalNetherlandsNicaraguaNigeriaNorthern AfricaNorthern EuropeNorwayOceaniaPakistanPanamaPeruPhilippinesPolandPortugalRomaniaRussiaSaudi ArabiaScotlandSouth AfricaSouth AmericaSouth Central AsiaSouth Eastern AsiaSouthern EuropeSpainSwedenSyriaTaiwanThailandTrinidad and TobagoTurkeyUgandaUkraineUruguayVenezuelaVietnamWestern AfricaWestern AsiaWestern EuropeZaireZimbabwe
Income
Income (Families)
Income (Households)
Poverty
Poverty (Families)
Unemployment
Employment Occupations
Employment Industries
Employer Class
Commute Time
Commute Means
School Enrollment
Education by Degree Field
Occupancy
Finances
Physical Characteristics
Tulsa
Compare Zip Codes
Comparison Subject

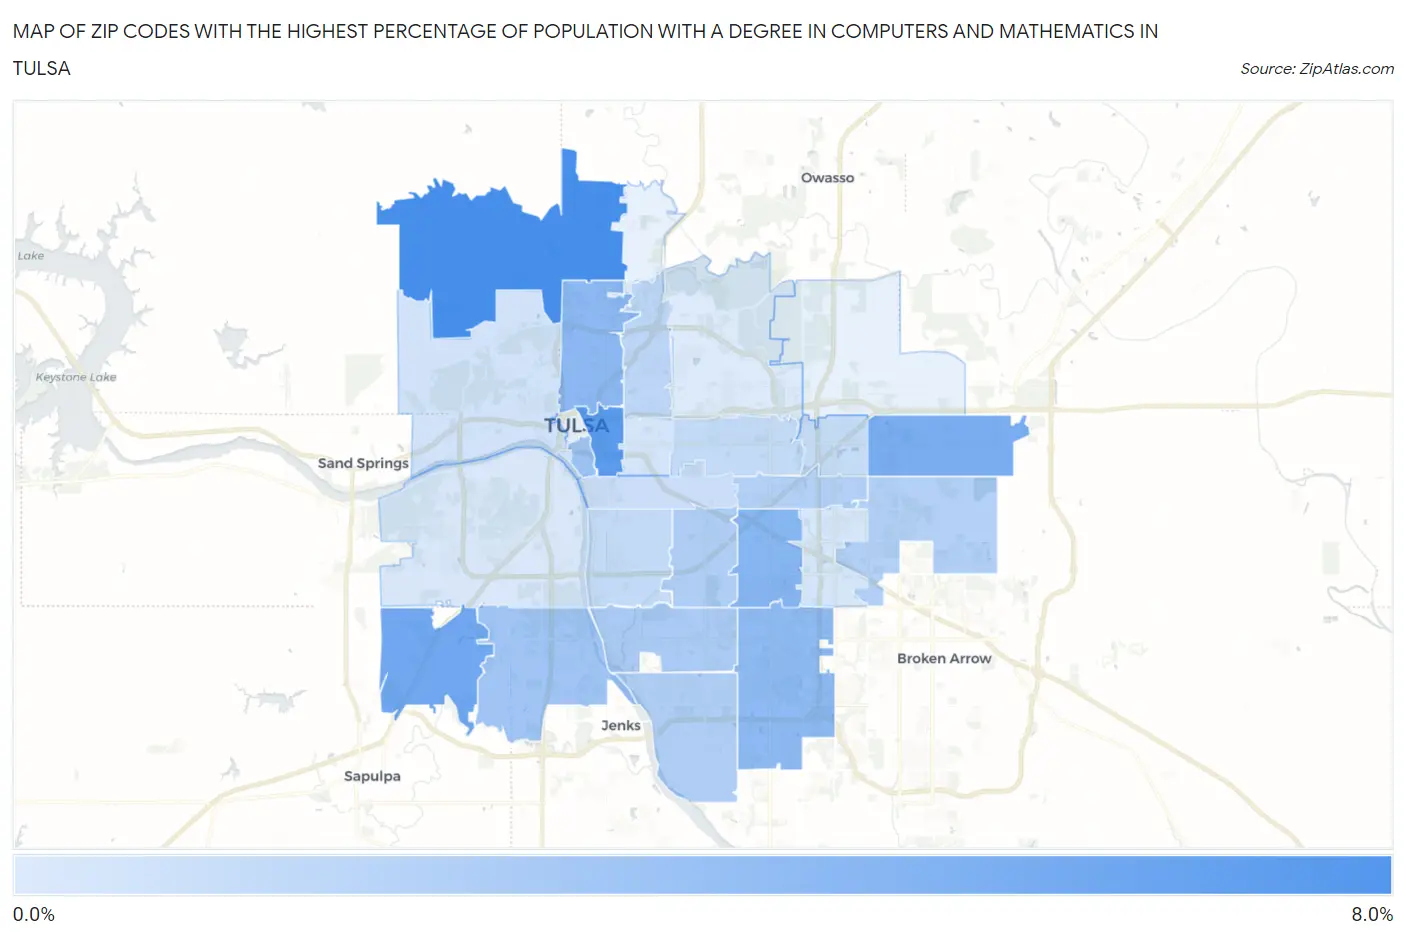
Map of Zip Codes with the Highest Percentage of Population with a Degree in Computers and Mathematics in Tulsa

0.0%
8.0%
Zip Codes with the Highest Percentage of Population with a Degree in Computers and Mathematics in Tulsa Map

Zip Codes with the Highest Percentage of Population with a Degree in Computers and Mathematics in Tulsa, OK

Zip Code % Graduates vs State vs National
1.741267.9%3.4%(+4.41)#484.9%(+2.96)#3,020
2.741207.0%3.4%(+3.58)#584.9%(+2.13)#3,789
3.741316.0%3.4%(+2.55)#774.9%(+1.11)#5,298
4.741085.6%3.4%(+2.16)#874.9%(+0.709)#6,061
5.741455.0%3.4%(+1.52)#1034.9%(+0.071)#7,529
6.741064.7%3.4%(+1.28)#1104.9%(-0.171)#8,209
7.741334.6%3.4%(+1.14)#1164.9%(-0.309)#8,606
8.741194.0%3.4%(+0.599)#1374.9%(-0.848)#10,318
9.741323.8%3.4%(+0.386)#1544.9%(-1.06)#11,069
10.741363.4%3.4%(-0.036)#1854.9%(-1.48)#12,625
11.741353.2%3.4%(-0.210)#1954.9%(-1.66)#13,240
12.741373.2%3.4%(-0.250)#1984.9%(-1.70)#13,402
13.741293.1%3.4%(-0.390)#2114.9%(-1.84)#13,888
14.741343.0%3.4%(-0.474)#2164.9%(-1.92)#14,171
15.741102.6%3.4%(-0.798)#2364.9%(-2.24)#15,344
16.741122.3%3.4%(-1.19)#2554.9%(-2.63)#16,746
17.741052.3%3.4%(-1.19)#2564.9%(-2.64)#16,755
18.741282.2%3.4%(-1.25)#2644.9%(-2.70)#16,997
19.741142.0%3.4%(-1.43)#2864.9%(-2.87)#17,559
20.741271.7%3.4%(-1.74)#3034.9%(-3.19)#18,518
21.741041.6%3.4%(-1.82)#3114.9%(-3.27)#18,787
22.741461.5%3.4%(-1.96)#3264.9%(-3.41)#19,181
23.741071.4%3.4%(-2.08)#3364.9%(-3.53)#19,520
24.741151.2%3.4%(-2.23)#3534.9%(-3.68)#19,958

Common Questions

What are the Top 10 Zip Codes with the Highest Percentage of Population with a Degree in Computers and Mathematics in Tulsa, OK?
Top 10 Zip Codes with the Highest Percentage of Population with a Degree in Computers and Mathematics in Tulsa, OK are:
#1
7.9%
#2
7.0%
#3
6.0%
#4
5.6%
#5
5.0%
#6
4.7%
#7
4.6%
#8
4.0%
#9
3.8%
#10
3.4%
What zip code has the Highest Percentage of Population with a Degree in Computers and Mathematics in Tulsa, OK?
74126 has the Highest Percentage of Population with a Degree in Computers and Mathematics in Tulsa, OK with 7.9%.
What is the Percentage of Population with a Degree in Computers and Mathematics in Tulsa, OK?
Percentage of Population with a Degree in Computers and Mathematics in Tulsa is 3.2%.
What is the Percentage of Population with a Degree in Computers and Mathematics in Oklahoma?
Percentage of Population with a Degree in Computers and Mathematics in Oklahoma is 3.4%.
What is the Percentage of Population with a Degree in Computers and Mathematics in the United States?
Percentage of Population with a Degree in Computers and Mathematics in the United States is 4.9%.