Zip Codes with the Highest Percentage of Population Employed in Food Preparation & Serving in Tulsa, OK

RELATED REPORTS & OPTIONS

Food Preparation & Serving
Population
Families and Households
Female Fertility
Female Fertility (Unmarried)
Race (Community Size)
Race (Percentage)
Ancestry (Community Size)
AfghanAfricanAleutAmericanApacheArabArapahoArgentineanArmenianAustralianAustrianBahamianBangladeshiBasqueBelgianBelizeanBhutaneseBlackfeetBolivianBrazilianBritishBulgarianBurmeseCajunCanadianCelticCentral AmericanCentral American IndianCherokeeCheyenneChickasawChileanChippewaChoctawColombianComancheCosta RicanCreekCroatianCubanCzechCzechoslovakianDanishDelawareDominicanDutchDutch West IndianEastern EuropeanEcuadorianEgyptianEnglishEstonianEthiopianEuropeanFilipinoFinnishFrenchFrench American IndianFrench CanadianGermanGerman RussianGhanaianGreekGuamanian / ChamorroGuatemalanHaitianHonduranHungarianIcelanderIndian (Asian)IndonesianInupiatIranianIraqiIrishIroquoisIsraeliItalianJamaicanJapaneseJordanianKenyanKiowaKoreanLaotianLatvianLebaneseLiberianLithuanianLumbeeLuxembourgerMalaysianMexicanMexican American IndianMoroccanNative HawaiianNavajoNicaraguanNigerianNorthern EuropeanNorwegianOsageOttawaPakistaniPalestinianPanamanianPennsylvania GermanPeruvianPimaPolishPortuguesePotawatomiPuebloPuerto RicanRomanianRussianSalvadoranSamoanScandinavianScotch-IrishScottishSeminoleSiouxSlavicSlovakSloveneSouth AmericanSouth American IndianSpaniardSpanishSpanish AmericanSri LankanSubsaharan AfricanSudaneseSwedishSwissSyrianThaiTlingit-HaidaTrinidadian and TobagonianTurkishUgandanUkrainianUruguayanVenezuelanVietnameseWelshWest IndianYugoslavian
Ancestry (Percentage)
AfghanAfricanAleutAmericanApacheArabArapahoArgentineanArmenianAustralianAustrianBahamianBangladeshiBasqueBelgianBelizeanBhutaneseBlackfeetBolivianBrazilianBritishBulgarianBurmeseCajunCanadianCelticCentral AmericanCentral American IndianCherokeeCheyenneChickasawChileanChippewaChoctawColombianComancheCosta RicanCreekCroatianCubanCzechCzechoslovakianDanishDelawareDominicanDutchDutch West IndianEastern EuropeanEcuadorianEgyptianEnglishEstonianEthiopianEuropeanFilipinoFinnishFrenchFrench American IndianFrench CanadianGermanGerman RussianGhanaianGreekGuamanian / ChamorroGuatemalanHaitianHonduranHungarianIcelanderIndian (Asian)IndonesianInupiatIranianIraqiIrishIroquoisIsraeliItalianJamaicanJapaneseJordanianKenyanKiowaKoreanLaotianLatvianLebaneseLiberianLithuanianLumbeeLuxembourgerMalaysianMexicanMexican American IndianMoroccanNative HawaiianNavajoNicaraguanNigerianNorthern EuropeanNorwegianOsageOttawaPakistaniPalestinianPanamanianPennsylvania GermanPeruvianPimaPolishPortuguesePotawatomiPuebloPuerto RicanRomanianRussianSalvadoranSamoanScandinavianScotch-IrishScottishSeminoleSiouxSlavicSlovakSloveneSouth AmericanSouth American IndianSpaniardSpanishSpanish AmericanSri LankanSubsaharan AfricanSudaneseSwedishSwissSyrianThaiTlingit-HaidaTrinidadian and TobagonianTurkishUgandanUkrainianUruguayanVenezuelanVietnameseWelshWest IndianYugoslavian
Immigrant Origin (Total)
AfghanistanAfricaArgentinaAsiaAustraliaAustriaBahamasBangladeshBelgiumBelizeBoliviaBrazilBurma / MyanmarCameroonCanadaCaribbeanCentral AmericaChileChinaColombiaCosta RicaCubaDenmarkDominican RepublicEastern AfricaEastern AsiaEastern EuropeEcuadorEgyptEl SalvadorEnglandEritreaEthiopiaEuropeFranceGermanyGhanaGreeceGuatemalaHaitiHondurasHong KongIndiaIndonesiaIranIraqIrelandIsraelItalyJamaicaJapanJordanKazakhstanKenyaKoreaKuwaitLaosLatin AmericaLatviaLebanonLiberiaMalaysiaMexicoMicronesiaMiddle AfricaMoroccoNepalNetherlandsNicaraguaNigeriaNorthern AfricaNorthern EuropeNorwayOceaniaPakistanPanamaPeruPhilippinesPolandPortugalRomaniaRussiaSaudi ArabiaScotlandSouth AfricaSouth AmericaSouth Central AsiaSouth Eastern AsiaSouthern EuropeSpainSwedenSyriaTaiwanThailandTrinidad and TobagoTurkeyUgandaUkraineUruguayVenezuelaVietnamWestern AfricaWestern AsiaWestern EuropeZaireZimbabwe
Immigrant Origin (Percentage)
AfghanistanAfricaArgentinaAsiaAustraliaAustriaBahamasBangladeshBelgiumBelizeBoliviaBrazilBurma / MyanmarCameroonCanadaCaribbeanCentral AmericaChileChinaColombiaCosta RicaCubaDenmarkDominican RepublicEastern AfricaEastern AsiaEastern EuropeEcuadorEgyptEl SalvadorEnglandEritreaEthiopiaEuropeFranceGermanyGhanaGreeceGuatemalaHaitiHondurasHong KongIndiaIndonesiaIranIraqIrelandIsraelItalyJamaicaJapanJordanKazakhstanKenyaKoreaKuwaitLaosLatin AmericaLatviaLebanonLiberiaMalaysiaMexicoMicronesiaMiddle AfricaMoroccoNepalNetherlandsNicaraguaNigeriaNorthern AfricaNorthern EuropeNorwayOceaniaPakistanPanamaPeruPhilippinesPolandPortugalRomaniaRussiaSaudi ArabiaScotlandSouth AfricaSouth AmericaSouth Central AsiaSouth Eastern AsiaSouthern EuropeSpainSwedenSyriaTaiwanThailandTrinidad and TobagoTurkeyUgandaUkraineUruguayVenezuelaVietnamWestern AfricaWestern AsiaWestern EuropeZaireZimbabwe
Income
Income (Families)
Income (Households)
Poverty
Poverty (Families)
Unemployment
Employment Occupations
Employment Industries
Employer Class
Commute Time
Commute Means
School Enrollment
Education by Degree Field
Occupancy
Finances
Physical Characteristics
Tulsa
Compare Zip Codes
Comparison Subject

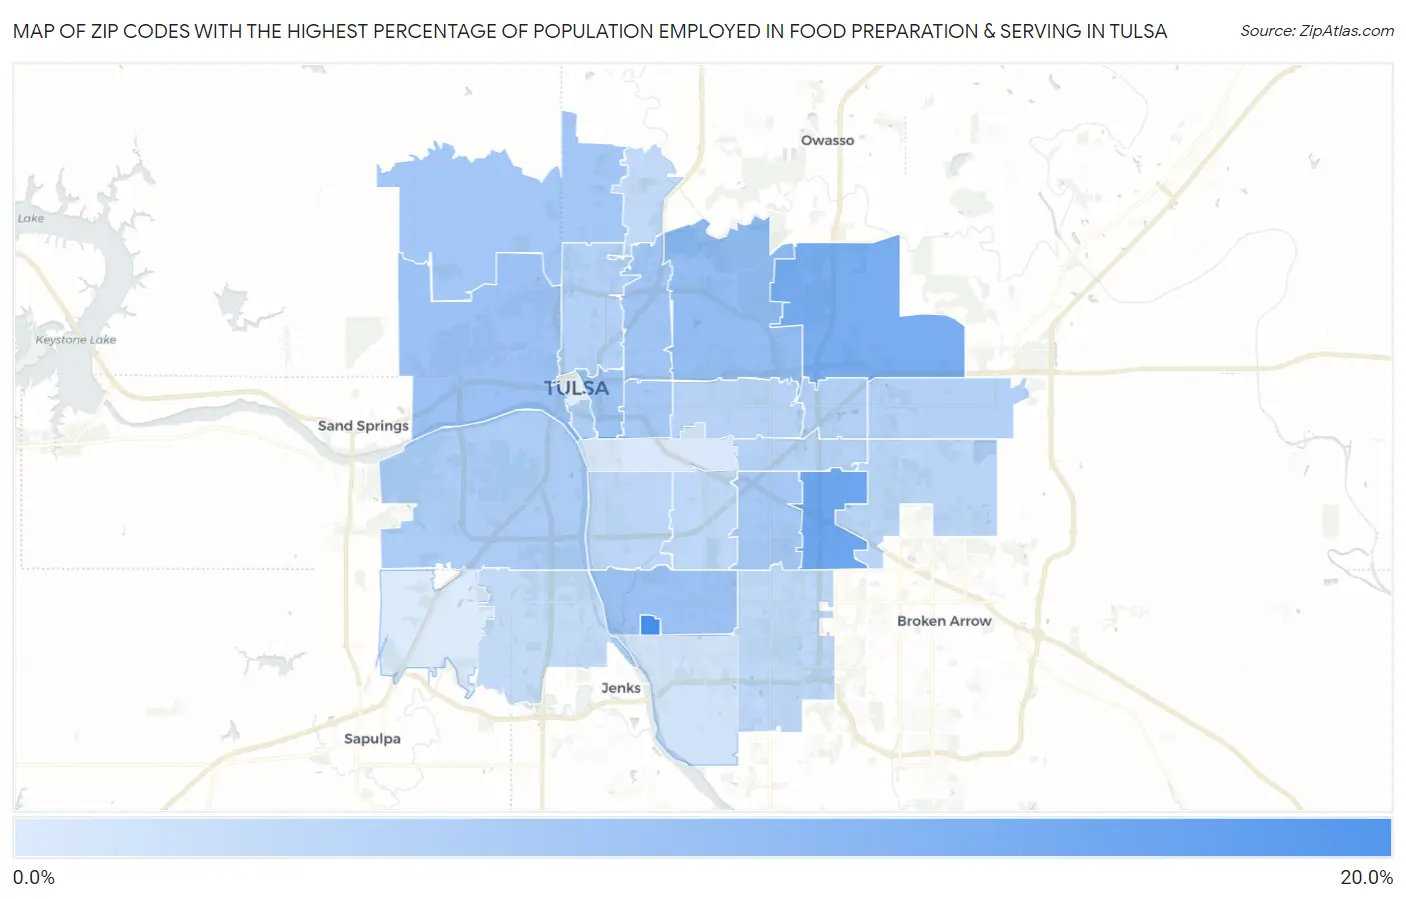
Map of Zip Codes with the Highest Percentage of Population Employed in Food Preparation & Serving in Tulsa

0.0%
20.0%
Zip Codes with the Highest Percentage of Population Employed in Food Preparation & Serving in Tulsa Map

Zip Codes with the Highest Percentage of Population Employed in Food Preparation & Serving in Tulsa, OK

Zip Code % Employed vs State vs National
1.7417118.4%5.6%(+12.8)#65.3%(+13.1)#620
2.7414613.9%5.6%(+8.33)#175.3%(+8.64)#1,180
3.7411612.6%5.6%(+6.98)#215.3%(+7.29)#1,500
4.741159.5%5.6%(+3.95)#595.3%(+4.26)#3,016
5.741368.9%5.6%(+3.32)#795.3%(+3.63)#3,603
6.741278.7%5.6%(+3.09)#895.3%(+3.39)#3,875
7.741208.4%5.6%(+2.77)#935.3%(+3.08)#4,212
8.741108.2%5.6%(+2.57)#995.3%(+2.88)#4,481
9.741267.8%5.6%(+2.23)#1055.3%(+2.54)#5,006
10.741047.7%5.6%(+2.08)#1145.3%(+2.39)#5,250
11.741457.6%5.6%(+2.03)#1165.3%(+2.34)#5,344
12.741196.8%5.6%(+1.20)#1625.3%(+1.51)#7,069
13.741076.8%5.6%(+1.19)#1635.3%(+1.50)#7,104
14.741066.2%5.6%(+0.567)#1955.3%(+0.876)#8,847
15.741086.1%5.6%(+0.500)#2035.3%(+0.809)#9,043
16.741286.0%5.6%(+0.450)#2055.3%(+0.760)#9,186
17.741296.0%5.6%(+0.389)#2095.3%(+0.698)#9,399
18.741125.6%5.6%(-0.032)#2355.3%(+0.278)#10,832
19.741345.4%5.6%(-0.177)#2455.3%(+0.133)#11,342
20.741055.2%5.6%(-0.365)#2595.3%(-0.056)#12,020
21.741355.0%5.6%(-0.599)#2785.3%(-0.289)#12,977
22.741334.9%5.6%(-0.717)#2845.3%(-0.408)#13,446
23.741304.7%5.6%(-0.858)#2965.3%(-0.549)#14,005
24.741324.5%5.6%(-1.09)#3195.3%(-0.776)#14,989
25.741373.0%5.6%(-2.63)#4445.3%(-2.32)#21,392
26.741142.0%5.6%(-3.62)#5175.3%(-3.31)#24,791
27.741311.8%5.6%(-3.80)#5305.3%(-3.49)#25,266

Common Questions

What are the Top 10 Zip Codes with the Highest Percentage of Population Employed in Food Preparation & Serving in Tulsa, OK?
Top 10 Zip Codes with the Highest Percentage of Population Employed in Food Preparation & Serving in Tulsa, OK are:
#1
18.4%
#2
13.9%
#3
12.6%
#4
9.5%
#5
8.9%
#6
8.7%
#7
8.4%
#8
8.2%
#9
7.8%
#10
7.7%
What zip code has the Highest Percentage of Population Employed in Food Preparation & Serving in Tulsa, OK?
74171 has the Highest Percentage of Population Employed in Food Preparation & Serving in Tulsa, OK with 18.4%.
What is the Percentage of Population Employed in Food Preparation & Serving in Tulsa, OK?
Percentage of Population Employed in Food Preparation & Serving in Tulsa is 6.5%.
What is the Percentage of Population Employed in Food Preparation & Serving in Oklahoma?
Percentage of Population Employed in Food Preparation & Serving in Oklahoma is 5.6%.
What is the Percentage of Population Employed in Food Preparation & Serving in the United States?
Percentage of Population Employed in Food Preparation & Serving in the United States is 5.3%.