Zip Codes with the Highest Percentage of Population Employed in Accommodation & Food Services in Tulsa, OK
RELATED REPORTS & OPTIONS
Accommodation & Food Services
Tulsa
Compare Zip Codes
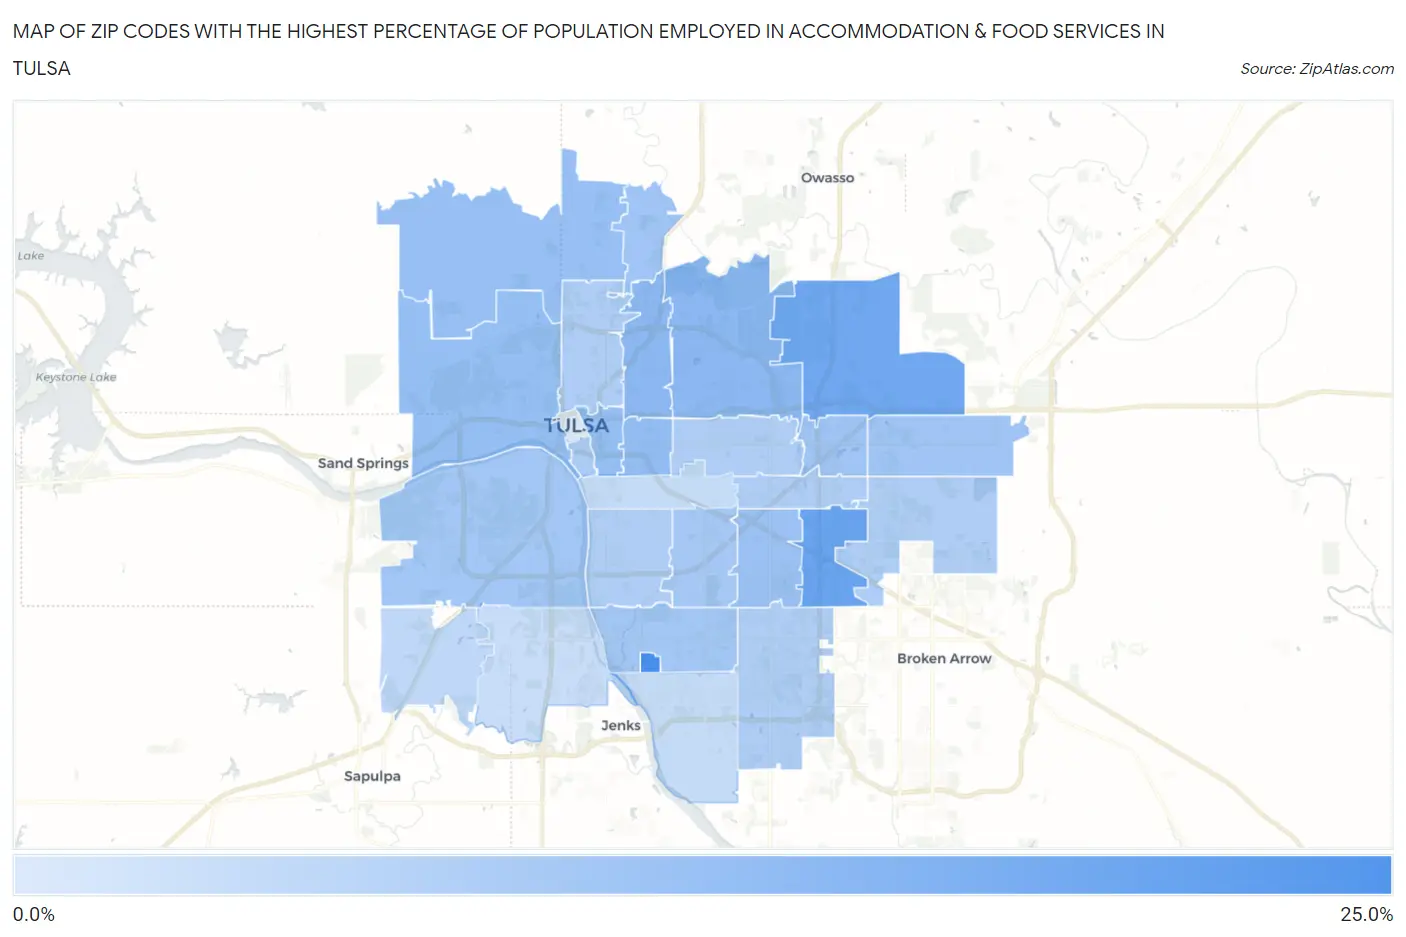
Map of Zip Codes with the Highest Percentage of Population Employed in Accommodation & Food Services in Tulsa
1.5%
20.1%
Zip Codes with the Highest Percentage of Population Employed in Accommodation & Food Services in Tulsa, OK
| Zip Code | % Employed | vs State | vs National | |
| 1. | 74171 | 20.1% | 7.0%(+13.1)#9 | 6.9%(+13.2)#819 |
| 2. | 74146 | 15.6% | 7.0%(+8.56)#19 | 6.9%(+8.67)#1,545 |
| 3. | 74116 | 14.5% | 7.0%(+7.56)#21 | 6.9%(+7.67)#1,806 |
| 4. | 74110 | 11.2% | 7.0%(+4.18)#44 | 6.9%(+4.29)#3,415 |
| 5. | 74115 | 11.1% | 7.0%(+4.09)#48 | 6.9%(+4.20)#3,491 |
| 6. | 74104 | 10.3% | 7.0%(+3.29)#61 | 6.9%(+3.40)#4,214 |
| 7. | 74127 | 10.0% | 7.0%(+3.05)#71 | 6.9%(+3.16)#4,486 |
| 8. | 74120 | 9.9% | 7.0%(+2.91)#75 | 6.9%(+3.02)#4,668 |
| 9. | 74126 | 9.7% | 7.0%(+2.66)#81 | 6.9%(+2.77)#4,991 |
| 10. | 74145 | 9.4% | 7.0%(+2.45)#83 | 6.9%(+2.56)#5,293 |
| 11. | 74130 | 8.6% | 7.0%(+1.59)#105 | 6.9%(+1.70)#6,676 |
| 12. | 74108 | 8.5% | 7.0%(+1.49)#108 | 6.9%(+1.60)#6,858 |
| 13. | 74128 | 8.5% | 7.0%(+1.49)#109 | 6.9%(+1.60)#6,859 |
| 14. | 74107 | 8.4% | 7.0%(+1.41)#112 | 6.9%(+1.52)#7,000 |
| 15. | 74136 | 8.4% | 7.0%(+1.39)#114 | 6.9%(+1.50)#7,031 |
| 16. | 74135 | 8.0% | 7.0%(+0.971)#131 | 6.9%(+1.08)#7,899 |
| 17. | 74119 | 7.4% | 7.0%(+0.438)#166 | 6.9%(+0.546)#9,180 |
| 18. | 74129 | 7.0% | 7.0%(+0.047)#185 | 6.9%(+0.155)#10,210 |
| 19. | 74112 | 7.0% | 7.0%(+0.022)#186 | 6.9%(+0.130)#10,265 |
| 20. | 74106 | 7.0% | 7.0%(+0.021)#187 | 6.9%(+0.129)#10,269 |
| 21. | 74133 | 7.0% | 7.0%(+0.014)#189 | 6.9%(+0.122)#10,293 |
| 22. | 74134 | 6.9% | 7.0%(-0.066)#197 | 6.9%(+0.042)#10,541 |
| 23. | 74105 | 6.8% | 7.0%(-0.160)#201 | 6.9%(-0.052)#10,800 |
| 24. | 74131 | 4.9% | 7.0%(-2.07)#320 | 6.9%(-1.96)#17,097 |
| 25. | 74114 | 4.2% | 7.0%(-2.77)#370 | 6.9%(-2.67)#19,452 |
| 26. | 74137 | 4.2% | 7.0%(-2.84)#374 | 6.9%(-2.73)#19,651 |
| 27. | 74132 | 4.0% | 7.0%(-2.96)#388 | 6.9%(-2.85)#20,075 |
| 28. | 74103 | 1.5% | 7.0%(-5.45)#523 | 6.9%(-5.34)#26,397 |
1
Common Questions
What are the Top 10 Zip Codes with the Highest Percentage of Population Employed in Accommodation & Food Services in Tulsa, OK?
Top 10 Zip Codes with the Highest Percentage of Population Employed in Accommodation & Food Services in Tulsa, OK are:
What zip code has the Highest Percentage of Population Employed in Accommodation & Food Services in Tulsa, OK?
74171 has the Highest Percentage of Population Employed in Accommodation & Food Services in Tulsa, OK with 20.1%.
What is the Percentage of Population Employed in Accommodation & Food Services in Tulsa, OK?
Percentage of Population Employed in Accommodation & Food Services in Tulsa is 8.1%.
What is the Percentage of Population Employed in Accommodation & Food Services in Oklahoma?
Percentage of Population Employed in Accommodation & Food Services in Oklahoma is 7.0%.
What is the Percentage of Population Employed in Accommodation & Food Services in the United States?
Percentage of Population Employed in Accommodation & Food Services in the United States is 6.9%.