Zip Codes with the Highest Percentage of Self-Employed / Not Incorporated in Tulsa, OK

RELATED REPORTS & OPTIONS

Self-Employed / Not Incorporated
Population
Families and Households
Female Fertility
Female Fertility (Unmarried)
Race (Community Size)
Race (Percentage)
Ancestry (Community Size)
AfghanAfricanAleutAmericanApacheArabArapahoArgentineanArmenianAustralianAustrianBahamianBangladeshiBasqueBelgianBelizeanBhutaneseBlackfeetBolivianBrazilianBritishBulgarianBurmeseCajunCanadianCelticCentral AmericanCentral American IndianCherokeeCheyenneChickasawChileanChippewaChoctawColombianComancheCosta RicanCreekCroatianCubanCzechCzechoslovakianDanishDelawareDominicanDutchDutch West IndianEastern EuropeanEcuadorianEgyptianEnglishEstonianEthiopianEuropeanFilipinoFinnishFrenchFrench American IndianFrench CanadianGermanGerman RussianGhanaianGreekGuamanian / ChamorroGuatemalanHaitianHonduranHungarianIcelanderIndian (Asian)IndonesianInupiatIranianIraqiIrishIroquoisIsraeliItalianJamaicanJapaneseJordanianKenyanKiowaKoreanLaotianLatvianLebaneseLiberianLithuanianLumbeeLuxembourgerMalaysianMexicanMexican American IndianMoroccanNative HawaiianNavajoNicaraguanNigerianNorthern EuropeanNorwegianOsageOttawaPakistaniPalestinianPanamanianPennsylvania GermanPeruvianPimaPolishPortuguesePotawatomiPuebloPuerto RicanRomanianRussianSalvadoranSamoanScandinavianScotch-IrishScottishSeminoleSiouxSlavicSlovakSloveneSouth AmericanSouth American IndianSpaniardSpanishSpanish AmericanSri LankanSubsaharan AfricanSudaneseSwedishSwissSyrianThaiTlingit-HaidaTrinidadian and TobagonianTurkishUgandanUkrainianUruguayanVenezuelanVietnameseWelshWest IndianYugoslavian
Ancestry (Percentage)
AfghanAfricanAleutAmericanApacheArabArapahoArgentineanArmenianAustralianAustrianBahamianBangladeshiBasqueBelgianBelizeanBhutaneseBlackfeetBolivianBrazilianBritishBulgarianBurmeseCajunCanadianCelticCentral AmericanCentral American IndianCherokeeCheyenneChickasawChileanChippewaChoctawColombianComancheCosta RicanCreekCroatianCubanCzechCzechoslovakianDanishDelawareDominicanDutchDutch West IndianEastern EuropeanEcuadorianEgyptianEnglishEstonianEthiopianEuropeanFilipinoFinnishFrenchFrench American IndianFrench CanadianGermanGerman RussianGhanaianGreekGuamanian / ChamorroGuatemalanHaitianHonduranHungarianIcelanderIndian (Asian)IndonesianInupiatIranianIraqiIrishIroquoisIsraeliItalianJamaicanJapaneseJordanianKenyanKiowaKoreanLaotianLatvianLebaneseLiberianLithuanianLumbeeLuxembourgerMalaysianMexicanMexican American IndianMoroccanNative HawaiianNavajoNicaraguanNigerianNorthern EuropeanNorwegianOsageOttawaPakistaniPalestinianPanamanianPennsylvania GermanPeruvianPimaPolishPortuguesePotawatomiPuebloPuerto RicanRomanianRussianSalvadoranSamoanScandinavianScotch-IrishScottishSeminoleSiouxSlavicSlovakSloveneSouth AmericanSouth American IndianSpaniardSpanishSpanish AmericanSri LankanSubsaharan AfricanSudaneseSwedishSwissSyrianThaiTlingit-HaidaTrinidadian and TobagonianTurkishUgandanUkrainianUruguayanVenezuelanVietnameseWelshWest IndianYugoslavian
Immigrant Origin (Total)
AfghanistanAfricaArgentinaAsiaAustraliaAustriaBahamasBangladeshBelgiumBelizeBoliviaBrazilBurma / MyanmarCameroonCanadaCaribbeanCentral AmericaChileChinaColombiaCosta RicaCubaDenmarkDominican RepublicEastern AfricaEastern AsiaEastern EuropeEcuadorEgyptEl SalvadorEnglandEritreaEthiopiaEuropeFranceGermanyGhanaGreeceGuatemalaHaitiHondurasHong KongIndiaIndonesiaIranIraqIrelandIsraelItalyJamaicaJapanJordanKazakhstanKenyaKoreaKuwaitLaosLatin AmericaLatviaLebanonLiberiaMalaysiaMexicoMicronesiaMiddle AfricaMoroccoNepalNetherlandsNicaraguaNigeriaNorthern AfricaNorthern EuropeNorwayOceaniaPakistanPanamaPeruPhilippinesPolandPortugalRomaniaRussiaSaudi ArabiaScotlandSouth AfricaSouth AmericaSouth Central AsiaSouth Eastern AsiaSouthern EuropeSpainSwedenSyriaTaiwanThailandTrinidad and TobagoTurkeyUgandaUkraineUruguayVenezuelaVietnamWestern AfricaWestern AsiaWestern EuropeZaireZimbabwe
Immigrant Origin (Percentage)
AfghanistanAfricaArgentinaAsiaAustraliaAustriaBahamasBangladeshBelgiumBelizeBoliviaBrazilBurma / MyanmarCameroonCanadaCaribbeanCentral AmericaChileChinaColombiaCosta RicaCubaDenmarkDominican RepublicEastern AfricaEastern AsiaEastern EuropeEcuadorEgyptEl SalvadorEnglandEritreaEthiopiaEuropeFranceGermanyGhanaGreeceGuatemalaHaitiHondurasHong KongIndiaIndonesiaIranIraqIrelandIsraelItalyJamaicaJapanJordanKazakhstanKenyaKoreaKuwaitLaosLatin AmericaLatviaLebanonLiberiaMalaysiaMexicoMicronesiaMiddle AfricaMoroccoNepalNetherlandsNicaraguaNigeriaNorthern AfricaNorthern EuropeNorwayOceaniaPakistanPanamaPeruPhilippinesPolandPortugalRomaniaRussiaSaudi ArabiaScotlandSouth AfricaSouth AmericaSouth Central AsiaSouth Eastern AsiaSouthern EuropeSpainSwedenSyriaTaiwanThailandTrinidad and TobagoTurkeyUgandaUkraineUruguayVenezuelaVietnamWestern AfricaWestern AsiaWestern EuropeZaireZimbabwe
Income
Income (Families)
Income (Households)
Poverty
Poverty (Families)
Unemployment
Employment Occupations
Employment Industries
Employer Class
Commute Time
Commute Means
School Enrollment
Education by Degree Field
Occupancy
Finances
Physical Characteristics
Tulsa
Compare Zip Codes
Comparison Subject

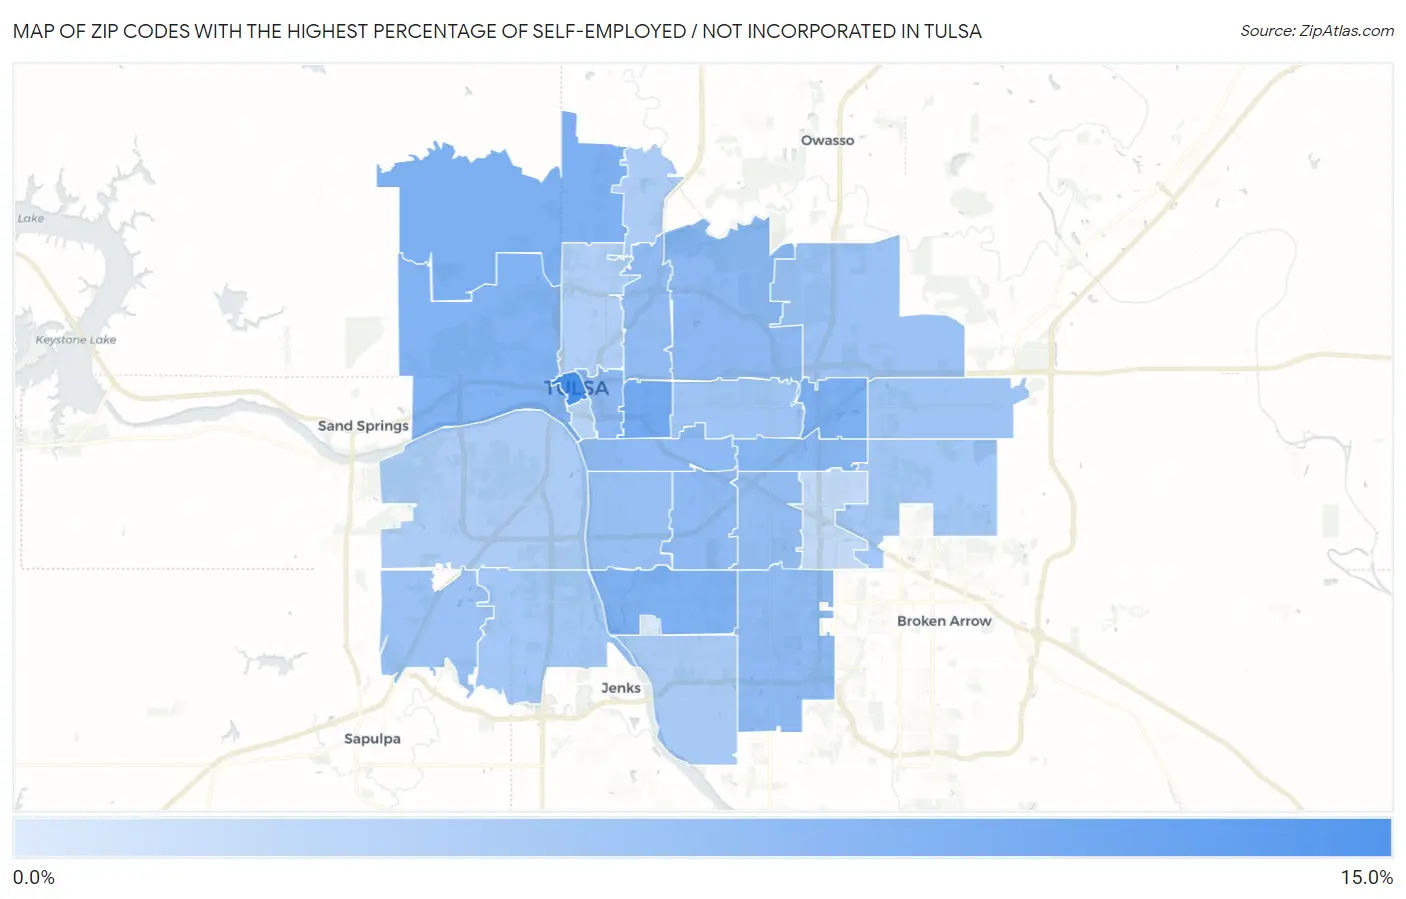
Map of Zip Codes with the Highest Percentage of Self-Employed / Not Incorporated in Tulsa

0.0%
15.0%
Zip Codes with the Highest Percentage of Self-Employed / Not Incorporated in Tulsa Map

Zip Codes with the Highest Percentage of Self-Employed / Not Incorporated in Tulsa, OK

Zip Code % Self-Employed / Not Incorporated vs State vs National
1.7410312.2%6.5%(+5.63)#1225.8%(+6.34)#5,159
2.741048.9%6.5%(+2.34)#2305.8%(+3.06)#9,024
3.741268.2%6.5%(+1.67)#2665.8%(+2.38)#10,257
4.741288.2%6.5%(+1.63)#2695.8%(+2.34)#10,327
5.741367.9%6.5%(+1.42)#2865.8%(+2.13)#10,749
6.741277.8%6.5%(+1.29)#2945.8%(+2.00)#11,043
7.741297.3%6.5%(+0.771)#3295.8%(+1.48)#12,293
8.741156.9%6.5%(+0.423)#3505.8%(+1.13)#13,182
9.741206.9%6.5%(+0.399)#3535.8%(+1.11)#13,252
10.741146.9%6.5%(+0.329)#3595.8%(+1.04)#13,435
11.741356.8%6.5%(+0.314)#3615.8%(+1.02)#13,479
12.741336.8%6.5%(+0.250)#3655.8%(+0.961)#13,653
13.741106.7%6.5%(+0.138)#3765.8%(+0.849)#13,959
14.741456.6%6.5%(+0.044)#3865.8%(+0.755)#14,242
15.741056.1%6.5%(-0.384)#4195.8%(+0.327)#15,610
16.741166.0%6.5%(-0.567)#4295.8%(+0.143)#16,205
17.741315.8%6.5%(-0.755)#4525.8%(-0.045)#16,799
18.741085.7%6.5%(-0.798)#4545.8%(-0.087)#16,929
19.741125.7%6.5%(-0.801)#4555.8%(-0.090)#16,936
20.741345.4%6.5%(-1.13)#4805.8%(-0.424)#18,160
21.741325.4%6.5%(-1.15)#4835.8%(-0.442)#18,231
22.741375.0%6.5%(-1.50)#5065.8%(-0.792)#19,578
23.741074.7%6.5%(-1.80)#5225.8%(-1.09)#20,695
24.741304.7%6.5%(-1.80)#5235.8%(-1.09)#20,698
25.741064.3%6.5%(-2.24)#5485.8%(-1.53)#22,379
26.741194.1%6.5%(-2.45)#5555.8%(-1.74)#23,140
27.741463.2%6.5%(-3.33)#5815.8%(-2.62)#25,897
28.741711.3%6.5%(-5.23)#6175.8%(-4.52)#28,917

Common Questions

What are the Top 10 Zip Codes with the Highest Percentage of Self-Employed / Not Incorporated in Tulsa, OK?
Top 10 Zip Codes with the Highest Percentage of Self-Employed / Not Incorporated in Tulsa, OK are:
#1
12.2%
#2
8.9%
#3
8.2%
#4
8.2%
#5
7.9%
#6
7.8%
#7
7.3%
#8
6.9%
#9
6.9%
#10
6.9%
What zip code has the Highest Percentage of Self-Employed / Not Incorporated in Tulsa, OK?
74103 has the Highest Percentage of Self-Employed / Not Incorporated in Tulsa, OK with 12.2%.
What is the Percentage of Self-Employed / Not Incorporated in Tulsa, OK?
Percentage of Self-Employed / Not Incorporated in Tulsa is 6.3%.
What is the Percentage of Self-Employed / Not Incorporated in Oklahoma?
Percentage of Self-Employed / Not Incorporated in Oklahoma is 6.5%.
What is the Percentage of Self-Employed / Not Incorporated in the United States?
Percentage of Self-Employed / Not Incorporated in the United States is 5.8%.