Zip Codes with the Lowest Poverty Level Among Children Under the Age of 5 in Tulsa, OK

RELATED REPORTS & OPTIONS

Lowest Poverty | Child 0-5
Population
Families and Households
Female Fertility
Female Fertility (Unmarried)
Race (Community Size)
Race (Percentage)
Ancestry (Community Size)
AfghanAfricanAleutAmericanApacheArabArapahoArgentineanArmenianAustralianAustrianBahamianBangladeshiBasqueBelgianBelizeanBhutaneseBlackfeetBolivianBrazilianBritishBulgarianBurmeseCajunCanadianCelticCentral AmericanCentral American IndianCherokeeCheyenneChickasawChileanChippewaChoctawColombianComancheCosta RicanCreekCroatianCubanCzechCzechoslovakianDanishDelawareDominicanDutchDutch West IndianEastern EuropeanEcuadorianEgyptianEnglishEstonianEthiopianEuropeanFilipinoFinnishFrenchFrench American IndianFrench CanadianGermanGerman RussianGhanaianGreekGuamanian / ChamorroGuatemalanHaitianHonduranHungarianIcelanderIndian (Asian)IndonesianInupiatIranianIraqiIrishIroquoisIsraeliItalianJamaicanJapaneseJordanianKenyanKiowaKoreanLaotianLatvianLebaneseLiberianLithuanianLumbeeLuxembourgerMalaysianMexicanMexican American IndianMoroccanNative HawaiianNavajoNicaraguanNigerianNorthern EuropeanNorwegianOsageOttawaPakistaniPalestinianPanamanianPennsylvania GermanPeruvianPimaPolishPortuguesePotawatomiPuebloPuerto RicanRomanianRussianSalvadoranSamoanScandinavianScotch-IrishScottishSeminoleSiouxSlavicSlovakSloveneSouth AmericanSouth American IndianSpaniardSpanishSpanish AmericanSri LankanSubsaharan AfricanSudaneseSwedishSwissSyrianThaiTlingit-HaidaTrinidadian and TobagonianTurkishUgandanUkrainianUruguayanVenezuelanVietnameseWelshWest IndianYugoslavian
Ancestry (Percentage)
AfghanAfricanAleutAmericanApacheArabArapahoArgentineanArmenianAustralianAustrianBahamianBangladeshiBasqueBelgianBelizeanBhutaneseBlackfeetBolivianBrazilianBritishBulgarianBurmeseCajunCanadianCelticCentral AmericanCentral American IndianCherokeeCheyenneChickasawChileanChippewaChoctawColombianComancheCosta RicanCreekCroatianCubanCzechCzechoslovakianDanishDelawareDominicanDutchDutch West IndianEastern EuropeanEcuadorianEgyptianEnglishEstonianEthiopianEuropeanFilipinoFinnishFrenchFrench American IndianFrench CanadianGermanGerman RussianGhanaianGreekGuamanian / ChamorroGuatemalanHaitianHonduranHungarianIcelanderIndian (Asian)IndonesianInupiatIranianIraqiIrishIroquoisIsraeliItalianJamaicanJapaneseJordanianKenyanKiowaKoreanLaotianLatvianLebaneseLiberianLithuanianLumbeeLuxembourgerMalaysianMexicanMexican American IndianMoroccanNative HawaiianNavajoNicaraguanNigerianNorthern EuropeanNorwegianOsageOttawaPakistaniPalestinianPanamanianPennsylvania GermanPeruvianPimaPolishPortuguesePotawatomiPuebloPuerto RicanRomanianRussianSalvadoranSamoanScandinavianScotch-IrishScottishSeminoleSiouxSlavicSlovakSloveneSouth AmericanSouth American IndianSpaniardSpanishSpanish AmericanSri LankanSubsaharan AfricanSudaneseSwedishSwissSyrianThaiTlingit-HaidaTrinidadian and TobagonianTurkishUgandanUkrainianUruguayanVenezuelanVietnameseWelshWest IndianYugoslavian
Immigrant Origin (Total)
AfghanistanAfricaArgentinaAsiaAustraliaAustriaBahamasBangladeshBelgiumBelizeBoliviaBrazilBurma / MyanmarCameroonCanadaCaribbeanCentral AmericaChileChinaColombiaCosta RicaCubaDenmarkDominican RepublicEastern AfricaEastern AsiaEastern EuropeEcuadorEgyptEl SalvadorEnglandEritreaEthiopiaEuropeFranceGermanyGhanaGreeceGuatemalaHaitiHondurasHong KongIndiaIndonesiaIranIraqIrelandIsraelItalyJamaicaJapanJordanKazakhstanKenyaKoreaKuwaitLaosLatin AmericaLatviaLebanonLiberiaMalaysiaMexicoMicronesiaMiddle AfricaMoroccoNepalNetherlandsNicaraguaNigeriaNorthern AfricaNorthern EuropeNorwayOceaniaPakistanPanamaPeruPhilippinesPolandPortugalRomaniaRussiaSaudi ArabiaScotlandSouth AfricaSouth AmericaSouth Central AsiaSouth Eastern AsiaSouthern EuropeSpainSwedenSyriaTaiwanThailandTrinidad and TobagoTurkeyUgandaUkraineUruguayVenezuelaVietnamWestern AfricaWestern AsiaWestern EuropeZaireZimbabwe
Immigrant Origin (Percentage)
AfghanistanAfricaArgentinaAsiaAustraliaAustriaBahamasBangladeshBelgiumBelizeBoliviaBrazilBurma / MyanmarCameroonCanadaCaribbeanCentral AmericaChileChinaColombiaCosta RicaCubaDenmarkDominican RepublicEastern AfricaEastern AsiaEastern EuropeEcuadorEgyptEl SalvadorEnglandEritreaEthiopiaEuropeFranceGermanyGhanaGreeceGuatemalaHaitiHondurasHong KongIndiaIndonesiaIranIraqIrelandIsraelItalyJamaicaJapanJordanKazakhstanKenyaKoreaKuwaitLaosLatin AmericaLatviaLebanonLiberiaMalaysiaMexicoMicronesiaMiddle AfricaMoroccoNepalNetherlandsNicaraguaNigeriaNorthern AfricaNorthern EuropeNorwayOceaniaPakistanPanamaPeruPhilippinesPolandPortugalRomaniaRussiaSaudi ArabiaScotlandSouth AfricaSouth AmericaSouth Central AsiaSouth Eastern AsiaSouthern EuropeSpainSwedenSyriaTaiwanThailandTrinidad and TobagoTurkeyUgandaUkraineUruguayVenezuelaVietnamWestern AfricaWestern AsiaWestern EuropeZaireZimbabwe
Income
Income (Families)
Income (Households)
Poverty
Poverty (Families)
Unemployment
Employment Occupations
Employment Industries
Employer Class
Commute Time
Commute Means
School Enrollment
Education by Degree Field
Occupancy
Finances
Physical Characteristics
Tulsa
Compare Zip Codes
Comparison Subject

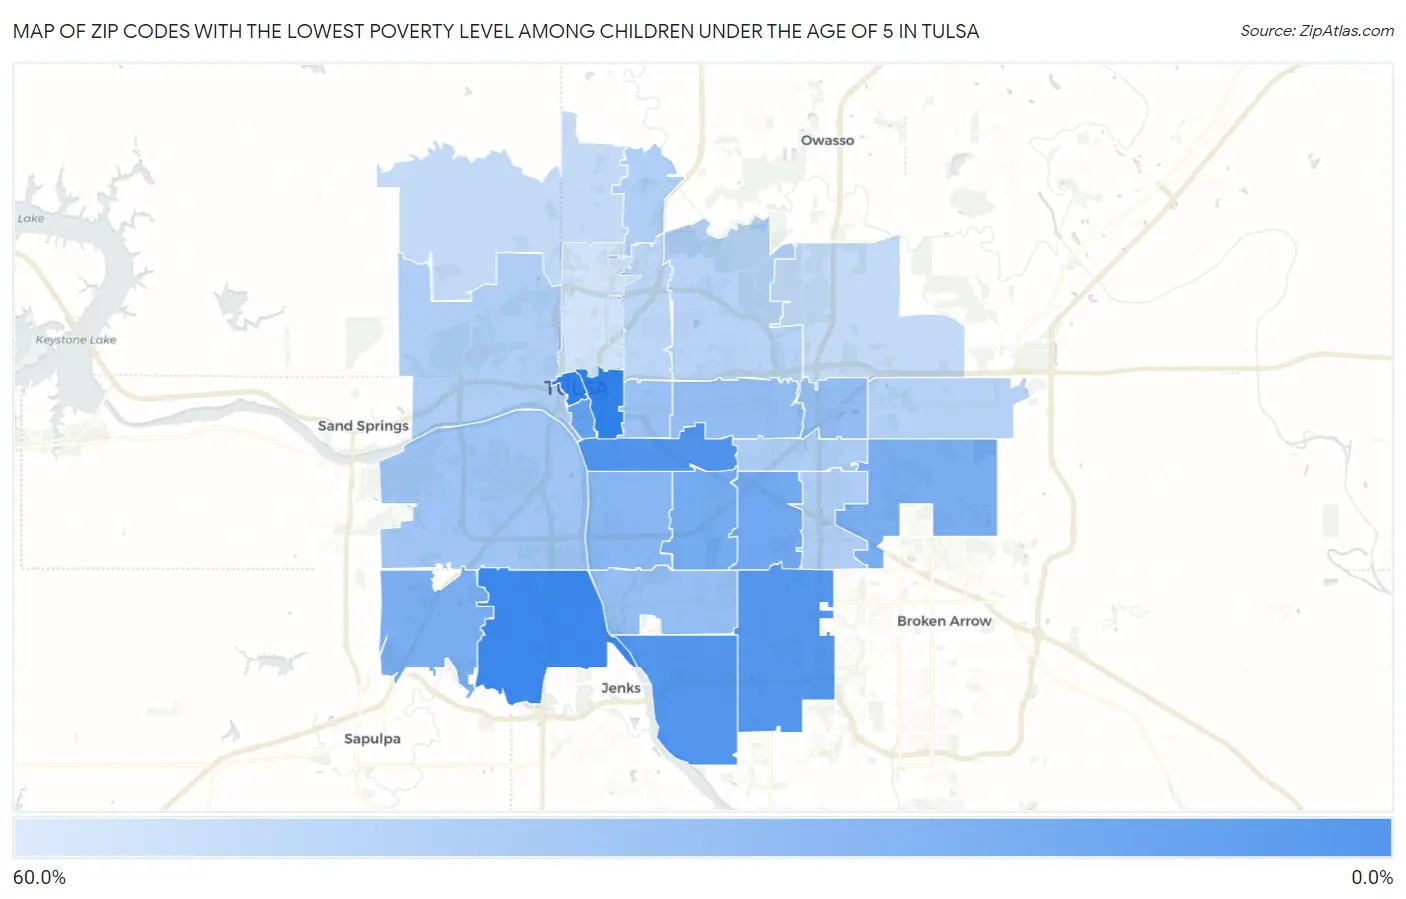
Map of Zip Codes with the Lowest Poverty Level Among Children Under the Age of 5 in Tulsa

60.0%
0.0%
Zip Codes with the Lowest Poverty Level Among Children Under the Age of 5 in Tulsa Map

Zip Codes with the Lowest Poverty Level Among Children Under the Age of 5 in Tulsa, OK

Zip Code Child Poverty vs State vs National
1.741322.5%23.3%(-20.8)#1218.1%(-15.5)#1,183
2.741148.0%23.3%(-15.4)#6318.1%(-10.1)#4,896
3.7413710.0%23.3%(-13.3)#9218.1%(-8.06)#6,284
4.7413310.1%23.3%(-13.2)#9418.1%(-7.94)#6,339
5.7411915.7%23.3%(-7.68)#15718.1%(-2.40)#9,580
6.7414519.9%23.3%(-3.44)#19518.1%(+1.84)#11,570
7.7413521.3%23.3%(-2.04)#21318.1%(+3.24)#12,189
8.7413422.6%23.3%(-0.714)#23418.1%(+4.57)#12,768
9.7413122.6%23.3%(-0.705)#23518.1%(+4.58)#12,771
10.7410528.4%23.3%(+5.09)#29718.1%(+10.4)#14,830
11.7412832.8%23.3%(+9.42)#33518.1%(+14.7)#16,023
12.7411233.0%23.3%(+9.61)#34118.1%(+14.9)#16,075
13.7413633.1%23.3%(+9.79)#34318.1%(+15.1)#16,110
14.7410435.3%23.3%(+12.0)#36518.1%(+17.3)#16,681
15.7410738.3%23.3%(+14.9)#38918.1%(+20.2)#17,326
16.7412943.0%23.3%(+19.7)#41618.1%(+24.9)#18,191
17.7414643.3%23.3%(+20.0)#41718.1%(+25.3)#18,236
18.7412743.9%23.3%(+20.6)#41918.1%(+25.8)#18,323
19.7413044.3%23.3%(+21.0)#42318.1%(+26.3)#18,378
20.7410846.4%23.3%(+23.0)#43618.1%(+28.3)#18,675
21.7411547.9%23.3%(+24.5)#44118.1%(+29.8)#18,851
22.7411050.7%23.3%(+27.4)#45518.1%(+32.7)#19,224
23.7412652.4%23.3%(+29.0)#45718.1%(+34.3)#19,358
24.7411652.7%23.3%(+29.4)#45918.1%(+34.6)#19,393
25.7410659.0%23.3%(+35.7)#47818.1%(+41.0)#19,907

Common Questions

What are the Top 10 Zip Codes with the Lowest Poverty Level Among Children Under the Age of 5 in Tulsa, OK?
Top 10 Zip Codes with the Lowest Poverty Level Among Children Under the Age of 5 in Tulsa, OK are:
#1
0.0%
#2
0.0%
#3
2.5%
#4
8.0%
#5
10.0%
#6
10.1%
#7
15.7%
#8
19.9%
#9
21.3%
#10
22.6%
What zip code has the Lowest Poverty Level Among Children Under the Age of 5 in Tulsa, OK?
74132 has the Lowest Poverty Level Among Children Under the Age of 5 in Tulsa, OK with 2.5%.
What is the Poverty Level Among Children Under the Age of 5 in Tulsa, OK?
Poverty Level Among Children Under the Age of 5 in Tulsa is 31.7%.
What is the Poverty Level Among Children Under the Age of 5 in Oklahoma?
Poverty Level Among Children Under the Age of 5 in Oklahoma is 23.3%.
What is the Poverty Level Among Children Under the Age of 5 in the United States?
Poverty Level Among Children Under the Age of 5 in the United States is 18.1%.