Zip Codes with the Highest Percentage of Families with Income Below $10,000 in Tulsa, OK

RELATED REPORTS & OPTIONS

Family Income | $0-10k
Population
Families and Households
Female Fertility
Female Fertility (Unmarried)
Race (Community Size)
Race (Percentage)
Ancestry (Community Size)
AfghanAfricanAleutAmericanApacheArabArapahoArgentineanArmenianAustralianAustrianBahamianBangladeshiBasqueBelgianBelizeanBhutaneseBlackfeetBolivianBrazilianBritishBulgarianBurmeseCajunCanadianCelticCentral AmericanCentral American IndianCherokeeCheyenneChickasawChileanChippewaChoctawColombianComancheCosta RicanCreekCroatianCubanCzechCzechoslovakianDanishDelawareDominicanDutchDutch West IndianEastern EuropeanEcuadorianEgyptianEnglishEstonianEthiopianEuropeanFilipinoFinnishFrenchFrench American IndianFrench CanadianGermanGerman RussianGhanaianGreekGuamanian / ChamorroGuatemalanHaitianHonduranHungarianIcelanderIndian (Asian)IndonesianInupiatIranianIraqiIrishIroquoisIsraeliItalianJamaicanJapaneseJordanianKenyanKiowaKoreanLaotianLatvianLebaneseLiberianLithuanianLumbeeLuxembourgerMalaysianMexicanMexican American IndianMoroccanNative HawaiianNavajoNicaraguanNigerianNorthern EuropeanNorwegianOsageOttawaPakistaniPalestinianPanamanianPennsylvania GermanPeruvianPimaPolishPortuguesePotawatomiPuebloPuerto RicanRomanianRussianSalvadoranSamoanScandinavianScotch-IrishScottishSeminoleSiouxSlavicSlovakSloveneSouth AmericanSouth American IndianSpaniardSpanishSpanish AmericanSri LankanSubsaharan AfricanSudaneseSwedishSwissSyrianThaiTlingit-HaidaTrinidadian and TobagonianTurkishUgandanUkrainianUruguayanVenezuelanVietnameseWelshWest IndianYugoslavian
Ancestry (Percentage)
AfghanAfricanAleutAmericanApacheArabArapahoArgentineanArmenianAustralianAustrianBahamianBangladeshiBasqueBelgianBelizeanBhutaneseBlackfeetBolivianBrazilianBritishBulgarianBurmeseCajunCanadianCelticCentral AmericanCentral American IndianCherokeeCheyenneChickasawChileanChippewaChoctawColombianComancheCosta RicanCreekCroatianCubanCzechCzechoslovakianDanishDelawareDominicanDutchDutch West IndianEastern EuropeanEcuadorianEgyptianEnglishEstonianEthiopianEuropeanFilipinoFinnishFrenchFrench American IndianFrench CanadianGermanGerman RussianGhanaianGreekGuamanian / ChamorroGuatemalanHaitianHonduranHungarianIcelanderIndian (Asian)IndonesianInupiatIranianIraqiIrishIroquoisIsraeliItalianJamaicanJapaneseJordanianKenyanKiowaKoreanLaotianLatvianLebaneseLiberianLithuanianLumbeeLuxembourgerMalaysianMexicanMexican American IndianMoroccanNative HawaiianNavajoNicaraguanNigerianNorthern EuropeanNorwegianOsageOttawaPakistaniPalestinianPanamanianPennsylvania GermanPeruvianPimaPolishPortuguesePotawatomiPuebloPuerto RicanRomanianRussianSalvadoranSamoanScandinavianScotch-IrishScottishSeminoleSiouxSlavicSlovakSloveneSouth AmericanSouth American IndianSpaniardSpanishSpanish AmericanSri LankanSubsaharan AfricanSudaneseSwedishSwissSyrianThaiTlingit-HaidaTrinidadian and TobagonianTurkishUgandanUkrainianUruguayanVenezuelanVietnameseWelshWest IndianYugoslavian
Immigrant Origin (Total)
AfghanistanAfricaArgentinaAsiaAustraliaAustriaBahamasBangladeshBelgiumBelizeBoliviaBrazilBurma / MyanmarCameroonCanadaCaribbeanCentral AmericaChileChinaColombiaCosta RicaCubaDenmarkDominican RepublicEastern AfricaEastern AsiaEastern EuropeEcuadorEgyptEl SalvadorEnglandEritreaEthiopiaEuropeFranceGermanyGhanaGreeceGuatemalaHaitiHondurasHong KongIndiaIndonesiaIranIraqIrelandIsraelItalyJamaicaJapanJordanKazakhstanKenyaKoreaKuwaitLaosLatin AmericaLatviaLebanonLiberiaMalaysiaMexicoMicronesiaMiddle AfricaMoroccoNepalNetherlandsNicaraguaNigeriaNorthern AfricaNorthern EuropeNorwayOceaniaPakistanPanamaPeruPhilippinesPolandPortugalRomaniaRussiaSaudi ArabiaScotlandSouth AfricaSouth AmericaSouth Central AsiaSouth Eastern AsiaSouthern EuropeSpainSwedenSyriaTaiwanThailandTrinidad and TobagoTurkeyUgandaUkraineUruguayVenezuelaVietnamWestern AfricaWestern AsiaWestern EuropeZaireZimbabwe
Immigrant Origin (Percentage)
AfghanistanAfricaArgentinaAsiaAustraliaAustriaBahamasBangladeshBelgiumBelizeBoliviaBrazilBurma / MyanmarCameroonCanadaCaribbeanCentral AmericaChileChinaColombiaCosta RicaCubaDenmarkDominican RepublicEastern AfricaEastern AsiaEastern EuropeEcuadorEgyptEl SalvadorEnglandEritreaEthiopiaEuropeFranceGermanyGhanaGreeceGuatemalaHaitiHondurasHong KongIndiaIndonesiaIranIraqIrelandIsraelItalyJamaicaJapanJordanKazakhstanKenyaKoreaKuwaitLaosLatin AmericaLatviaLebanonLiberiaMalaysiaMexicoMicronesiaMiddle AfricaMoroccoNepalNetherlandsNicaraguaNigeriaNorthern AfricaNorthern EuropeNorwayOceaniaPakistanPanamaPeruPhilippinesPolandPortugalRomaniaRussiaSaudi ArabiaScotlandSouth AfricaSouth AmericaSouth Central AsiaSouth Eastern AsiaSouthern EuropeSpainSwedenSyriaTaiwanThailandTrinidad and TobagoTurkeyUgandaUkraineUruguayVenezuelaVietnamWestern AfricaWestern AsiaWestern EuropeZaireZimbabwe
Income
Income (Families)
Income (Households)
Poverty
Poverty (Families)
Unemployment
Employment Occupations
Employment Industries
Employer Class
Commute Time
Commute Means
School Enrollment
Education by Degree Field
Occupancy
Finances
Physical Characteristics
Tulsa
Compare Zip Codes
Comparison Subject

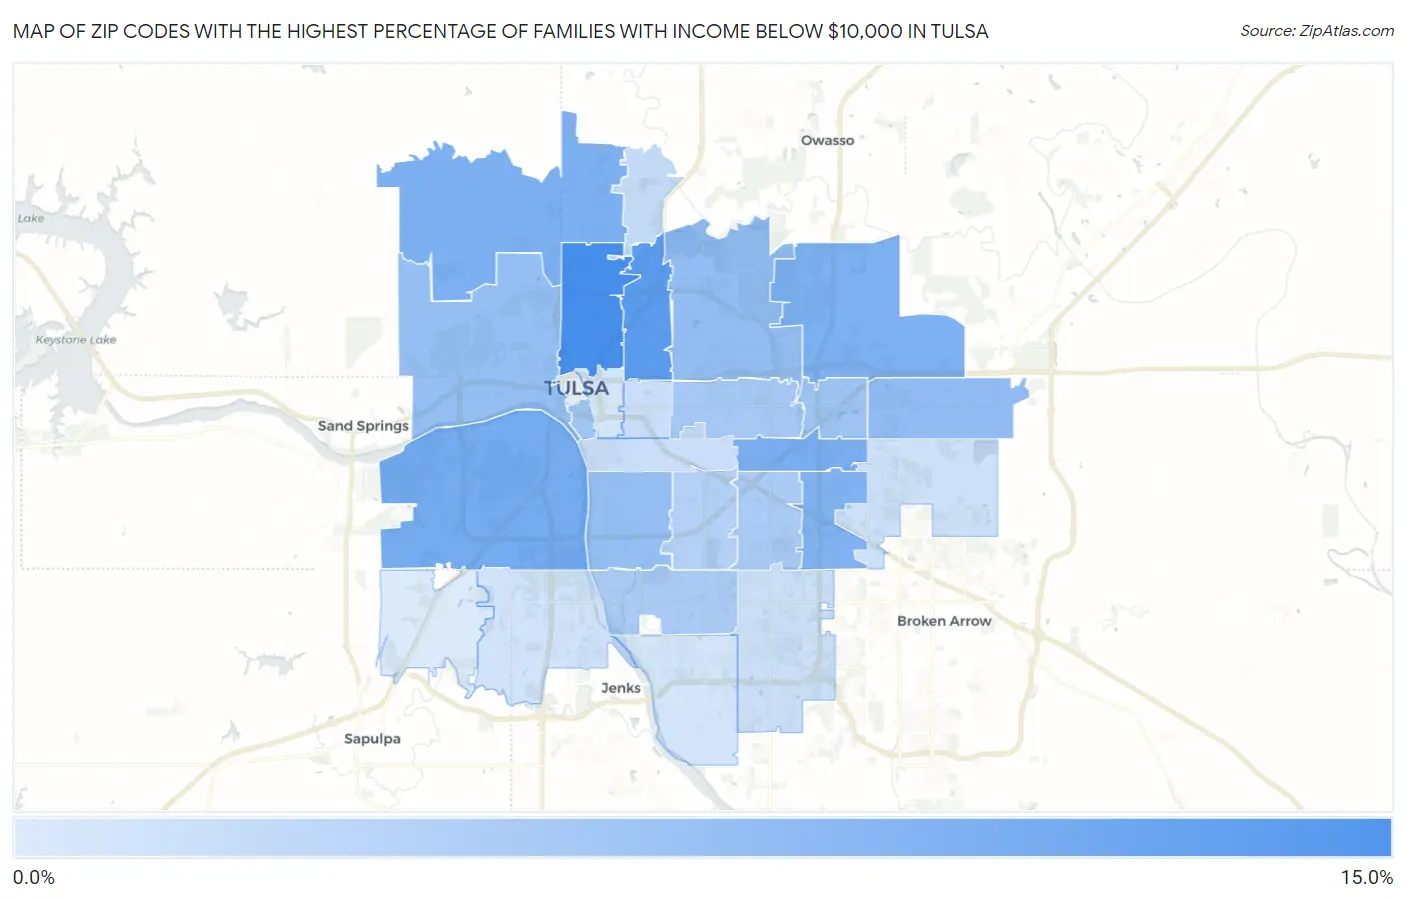
Map of Zip Codes with the Highest Percentage of Families with Income Below $10,000 in Tulsa

0.0%
15.0%
Zip Codes with the Highest Percentage of Families with Income Below $10,000 in Tulsa Map

Zip Codes with the Highest Percentage of Families with Income Below $10,000 in Tulsa, OK

Zip Code Families with Income < $10k vs State vs National
1.7410613.2%3.8%(+9.40)#223.1%(+10.1)#1,087
2.7411011.4%3.8%(+7.60)#293.1%(+8.30)#1,475
3.741079.2%3.8%(+5.40)#443.1%(+6.10)#2,248
4.741298.9%3.8%(+5.10)#483.1%(+5.80)#2,405
5.741268.7%3.8%(+4.90)#523.1%(+5.60)#2,514
6.741168.5%3.8%(+4.70)#583.1%(+5.40)#2,661
7.741468.2%3.8%(+4.40)#653.1%(+5.10)#2,850
8.741086.9%3.8%(+3.10)#883.1%(+3.80)#3,722
9.741156.8%3.8%(+3.00)#893.1%(+3.70)#3,804
10.741276.6%3.8%(+2.80)#953.1%(+3.50)#4,008
11.741056.5%3.8%(+2.70)#983.1%(+3.40)#4,107
12.741285.7%3.8%(+1.90)#1263.1%(+2.60)#5,046
13.741195.5%3.8%(+1.70)#1383.1%(+2.40)#5,374
14.741125.3%3.8%(+1.50)#1443.1%(+2.20)#5,619
15.741364.8%3.8%(+1.00)#1733.1%(+1.70)#6,432
16.741454.8%3.8%(+1.00)#1753.1%(+1.70)#6,469
17.741354.0%3.8%(+0.200)#2343.1%(+0.900)#8,185
18.741302.8%3.8%(-1.00)#3383.1%(-0.300)#12,080
19.741042.3%3.8%(-1.50)#3813.1%(-0.800)#14,050
20.741142.2%3.8%(-1.60)#3883.1%(-0.900)#14,444
21.741332.0%3.8%(-1.80)#4073.1%(-1.10)#15,258
22.741341.9%3.8%(-1.90)#4243.1%(-1.20)#15,842
23.741321.7%3.8%(-2.10)#4373.1%(-1.40)#16,875
24.741371.5%3.8%(-2.30)#4513.1%(-1.60)#17,741
25.741201.3%3.8%(-2.50)#4733.1%(-1.80)#18,963
26.741310.80%3.8%(-3.00)#5033.1%(-2.30)#21,509

Common Questions

What are the Top 10 Zip Codes with the Highest Percentage of Families with Income Below $10,000 in Tulsa, OK?
Top 10 Zip Codes with the Highest Percentage of Families with Income Below $10,000 in Tulsa, OK are:
#1
13.2%
#2
11.4%
#3
9.2%
#4
8.9%
#5
8.7%
#6
8.5%
#7
8.2%
#8
6.9%
#9
6.8%
#10
6.6%
What zip code has the Highest Percentage of Families with Income Below $10,000 in Tulsa, OK?
74106 has the Highest Percentage of Families with Income Below $10,000 in Tulsa, OK with 13.2%.
What is the Percentage of Families with Income Below $10,000 in Tulsa, OK?
Percentage of Families with Income Below $10,000 in Tulsa is 5.4%.
What is the Percentage of Families with Income Below $10,000 in Oklahoma?
Percentage of Families with Income Below $10,000 in Oklahoma is 3.8%.
What is the Percentage of Families with Income Below $10,000 in the United States?
Percentage of Families with Income Below $10,000 in the United States is 3.1%.