Zip Codes with the Highest Percentage of Population Employed in Health Diagnosing & Treating in Tulsa, OK
RELATED REPORTS & OPTIONS
Health Diagnosing & Treating
Tulsa
Compare Zip Codes
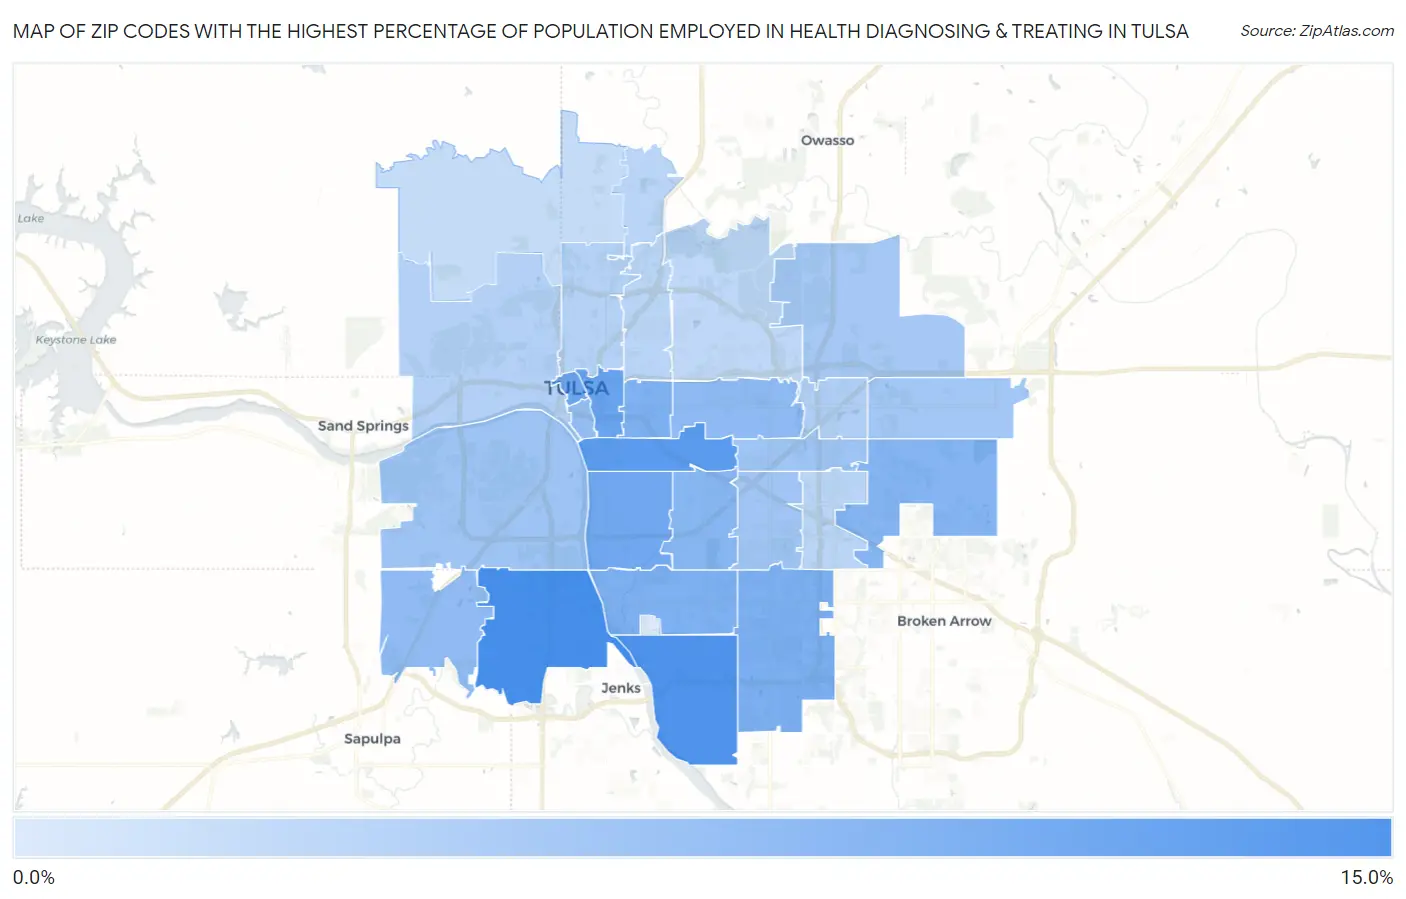
Map of Zip Codes with the Highest Percentage of Population Employed in Health Diagnosing & Treating in Tulsa
0.36%
11.8%
Zip Codes with the Highest Percentage of Population Employed in Health Diagnosing & Treating in Tulsa, OK
| Zip Code | % Employed | vs State | vs National | |
| 1. | 74132 | 11.8% | 6.4%(+5.40)#25 | 6.2%(+5.52)#2,342 |
| 2. | 74137 | 11.2% | 6.4%(+4.81)#30 | 6.2%(+4.94)#2,757 |
| 3. | 74114 | 10.2% | 6.4%(+3.83)#46 | 6.2%(+3.95)#3,645 |
| 4. | 74120 | 9.0% | 6.4%(+2.67)#72 | 6.2%(+2.80)#5,291 |
| 5. | 74103 | 8.7% | 6.4%(+2.36)#82 | 6.2%(+2.49)#5,868 |
| 6. | 74105 | 8.5% | 6.4%(+2.17)#90 | 6.2%(+2.30)#6,259 |
| 7. | 74133 | 7.6% | 6.4%(+1.20)#123 | 6.2%(+1.33)#8,583 |
| 8. | 74136 | 7.5% | 6.4%(+1.09)#128 | 6.2%(+1.22)#8,924 |
| 9. | 74104 | 7.4% | 6.4%(+1.03)#133 | 6.2%(+1.16)#9,106 |
| 10. | 74134 | 6.9% | 6.4%(+0.516)#164 | 6.2%(+0.643)#10,726 |
| 11. | 74135 | 6.7% | 6.4%(+0.304)#173 | 6.2%(+0.430)#11,396 |
| 12. | 74112 | 6.2% | 6.4%(-0.192)#213 | 6.2%(-0.066)#13,233 |
| 13. | 74131 | 6.0% | 6.4%(-0.411)#226 | 6.2%(-0.285)#14,011 |
| 14. | 74119 | 5.9% | 6.4%(-0.497)#234 | 6.2%(-0.371)#14,332 |
| 15. | 74107 | 5.0% | 6.4%(-1.33)#307 | 6.2%(-1.21)#17,551 |
| 16. | 74129 | 4.9% | 6.4%(-1.47)#317 | 6.2%(-1.35)#18,112 |
| 17. | 74145 | 4.7% | 6.4%(-1.67)#336 | 6.2%(-1.55)#18,863 |
| 18. | 74108 | 4.6% | 6.4%(-1.79)#350 | 6.2%(-1.67)#19,337 |
| 19. | 74116 | 4.4% | 6.4%(-1.99)#369 | 6.2%(-1.87)#20,068 |
| 20. | 74128 | 3.6% | 6.4%(-2.79)#442 | 6.2%(-2.67)#22,677 |
| 21. | 74127 | 3.4% | 6.4%(-3.02)#457 | 6.2%(-2.89)#23,309 |
| 22. | 74106 | 3.3% | 6.4%(-3.06)#461 | 6.2%(-2.94)#23,449 |
| 23. | 74130 | 2.9% | 6.4%(-3.43)#487 | 6.2%(-3.30)#24,453 |
| 24. | 74146 | 2.8% | 6.4%(-3.56)#498 | 6.2%(-3.43)#24,790 |
| 25. | 74110 | 2.8% | 6.4%(-3.57)#500 | 6.2%(-3.44)#24,811 |
| 26. | 74115 | 2.5% | 6.4%(-3.90)#517 | 6.2%(-3.77)#25,585 |
| 27. | 74126 | 2.0% | 6.4%(-4.34)#530 | 6.2%(-4.21)#26,406 |
| 28. | 74171 | 0.36% | 6.4%(-6.01)#579 | 6.2%(-5.89)#28,375 |
1
Common Questions
What are the Top 10 Zip Codes with the Highest Percentage of Population Employed in Health Diagnosing & Treating in Tulsa, OK?
Top 10 Zip Codes with the Highest Percentage of Population Employed in Health Diagnosing & Treating in Tulsa, OK are:
What zip code has the Highest Percentage of Population Employed in Health Diagnosing & Treating in Tulsa, OK?
74132 has the Highest Percentage of Population Employed in Health Diagnosing & Treating in Tulsa, OK with 11.8%.
What is the Percentage of Population Employed in Health Diagnosing & Treating in Tulsa, OK?
Percentage of Population Employed in Health Diagnosing & Treating in Tulsa is 6.5%.
What is the Percentage of Population Employed in Health Diagnosing & Treating in Oklahoma?
Percentage of Population Employed in Health Diagnosing & Treating in Oklahoma is 6.4%.
What is the Percentage of Population Employed in Health Diagnosing & Treating in the United States?
Percentage of Population Employed in Health Diagnosing & Treating in the United States is 6.2%.