Zip Codes with the Highest Percentage of Population Employed in Arts, Media & Entertainment in Tulsa, OK

RELATED REPORTS & OPTIONS

Arts, Media & Entertainment
Population
Families and Households
Female Fertility
Female Fertility (Unmarried)
Race (Community Size)
Race (Percentage)
Ancestry (Community Size)
AfghanAfricanAleutAmericanApacheArabArapahoArgentineanArmenianAustralianAustrianBahamianBangladeshiBasqueBelgianBelizeanBhutaneseBlackfeetBolivianBrazilianBritishBulgarianBurmeseCajunCanadianCelticCentral AmericanCentral American IndianCherokeeCheyenneChickasawChileanChippewaChoctawColombianComancheCosta RicanCreekCroatianCubanCzechCzechoslovakianDanishDelawareDominicanDutchDutch West IndianEastern EuropeanEcuadorianEgyptianEnglishEstonianEthiopianEuropeanFilipinoFinnishFrenchFrench American IndianFrench CanadianGermanGerman RussianGhanaianGreekGuamanian / ChamorroGuatemalanHaitianHonduranHungarianIcelanderIndian (Asian)IndonesianInupiatIranianIraqiIrishIroquoisIsraeliItalianJamaicanJapaneseJordanianKenyanKiowaKoreanLaotianLatvianLebaneseLiberianLithuanianLumbeeLuxembourgerMalaysianMexicanMexican American IndianMoroccanNative HawaiianNavajoNicaraguanNigerianNorthern EuropeanNorwegianOsageOttawaPakistaniPalestinianPanamanianPennsylvania GermanPeruvianPimaPolishPortuguesePotawatomiPuebloPuerto RicanRomanianRussianSalvadoranSamoanScandinavianScotch-IrishScottishSeminoleSiouxSlavicSlovakSloveneSouth AmericanSouth American IndianSpaniardSpanishSpanish AmericanSri LankanSubsaharan AfricanSudaneseSwedishSwissSyrianThaiTlingit-HaidaTrinidadian and TobagonianTurkishUgandanUkrainianUruguayanVenezuelanVietnameseWelshWest IndianYugoslavian
Ancestry (Percentage)
AfghanAfricanAleutAmericanApacheArabArapahoArgentineanArmenianAustralianAustrianBahamianBangladeshiBasqueBelgianBelizeanBhutaneseBlackfeetBolivianBrazilianBritishBulgarianBurmeseCajunCanadianCelticCentral AmericanCentral American IndianCherokeeCheyenneChickasawChileanChippewaChoctawColombianComancheCosta RicanCreekCroatianCubanCzechCzechoslovakianDanishDelawareDominicanDutchDutch West IndianEastern EuropeanEcuadorianEgyptianEnglishEstonianEthiopianEuropeanFilipinoFinnishFrenchFrench American IndianFrench CanadianGermanGerman RussianGhanaianGreekGuamanian / ChamorroGuatemalanHaitianHonduranHungarianIcelanderIndian (Asian)IndonesianInupiatIranianIraqiIrishIroquoisIsraeliItalianJamaicanJapaneseJordanianKenyanKiowaKoreanLaotianLatvianLebaneseLiberianLithuanianLumbeeLuxembourgerMalaysianMexicanMexican American IndianMoroccanNative HawaiianNavajoNicaraguanNigerianNorthern EuropeanNorwegianOsageOttawaPakistaniPalestinianPanamanianPennsylvania GermanPeruvianPimaPolishPortuguesePotawatomiPuebloPuerto RicanRomanianRussianSalvadoranSamoanScandinavianScotch-IrishScottishSeminoleSiouxSlavicSlovakSloveneSouth AmericanSouth American IndianSpaniardSpanishSpanish AmericanSri LankanSubsaharan AfricanSudaneseSwedishSwissSyrianThaiTlingit-HaidaTrinidadian and TobagonianTurkishUgandanUkrainianUruguayanVenezuelanVietnameseWelshWest IndianYugoslavian
Immigrant Origin (Total)
AfghanistanAfricaArgentinaAsiaAustraliaAustriaBahamasBangladeshBelgiumBelizeBoliviaBrazilBurma / MyanmarCameroonCanadaCaribbeanCentral AmericaChileChinaColombiaCosta RicaCubaDenmarkDominican RepublicEastern AfricaEastern AsiaEastern EuropeEcuadorEgyptEl SalvadorEnglandEritreaEthiopiaEuropeFranceGermanyGhanaGreeceGuatemalaHaitiHondurasHong KongIndiaIndonesiaIranIraqIrelandIsraelItalyJamaicaJapanJordanKazakhstanKenyaKoreaKuwaitLaosLatin AmericaLatviaLebanonLiberiaMalaysiaMexicoMicronesiaMiddle AfricaMoroccoNepalNetherlandsNicaraguaNigeriaNorthern AfricaNorthern EuropeNorwayOceaniaPakistanPanamaPeruPhilippinesPolandPortugalRomaniaRussiaSaudi ArabiaScotlandSouth AfricaSouth AmericaSouth Central AsiaSouth Eastern AsiaSouthern EuropeSpainSwedenSyriaTaiwanThailandTrinidad and TobagoTurkeyUgandaUkraineUruguayVenezuelaVietnamWestern AfricaWestern AsiaWestern EuropeZaireZimbabwe
Immigrant Origin (Percentage)
AfghanistanAfricaArgentinaAsiaAustraliaAustriaBahamasBangladeshBelgiumBelizeBoliviaBrazilBurma / MyanmarCameroonCanadaCaribbeanCentral AmericaChileChinaColombiaCosta RicaCubaDenmarkDominican RepublicEastern AfricaEastern AsiaEastern EuropeEcuadorEgyptEl SalvadorEnglandEritreaEthiopiaEuropeFranceGermanyGhanaGreeceGuatemalaHaitiHondurasHong KongIndiaIndonesiaIranIraqIrelandIsraelItalyJamaicaJapanJordanKazakhstanKenyaKoreaKuwaitLaosLatin AmericaLatviaLebanonLiberiaMalaysiaMexicoMicronesiaMiddle AfricaMoroccoNepalNetherlandsNicaraguaNigeriaNorthern AfricaNorthern EuropeNorwayOceaniaPakistanPanamaPeruPhilippinesPolandPortugalRomaniaRussiaSaudi ArabiaScotlandSouth AfricaSouth AmericaSouth Central AsiaSouth Eastern AsiaSouthern EuropeSpainSwedenSyriaTaiwanThailandTrinidad and TobagoTurkeyUgandaUkraineUruguayVenezuelaVietnamWestern AfricaWestern AsiaWestern EuropeZaireZimbabwe
Income
Income (Families)
Income (Households)
Poverty
Poverty (Families)
Unemployment
Employment Occupations
Employment Industries
Employer Class
Commute Time
Commute Means
School Enrollment
Education by Degree Field
Occupancy
Finances
Physical Characteristics
Tulsa
Compare Zip Codes
Comparison Subject

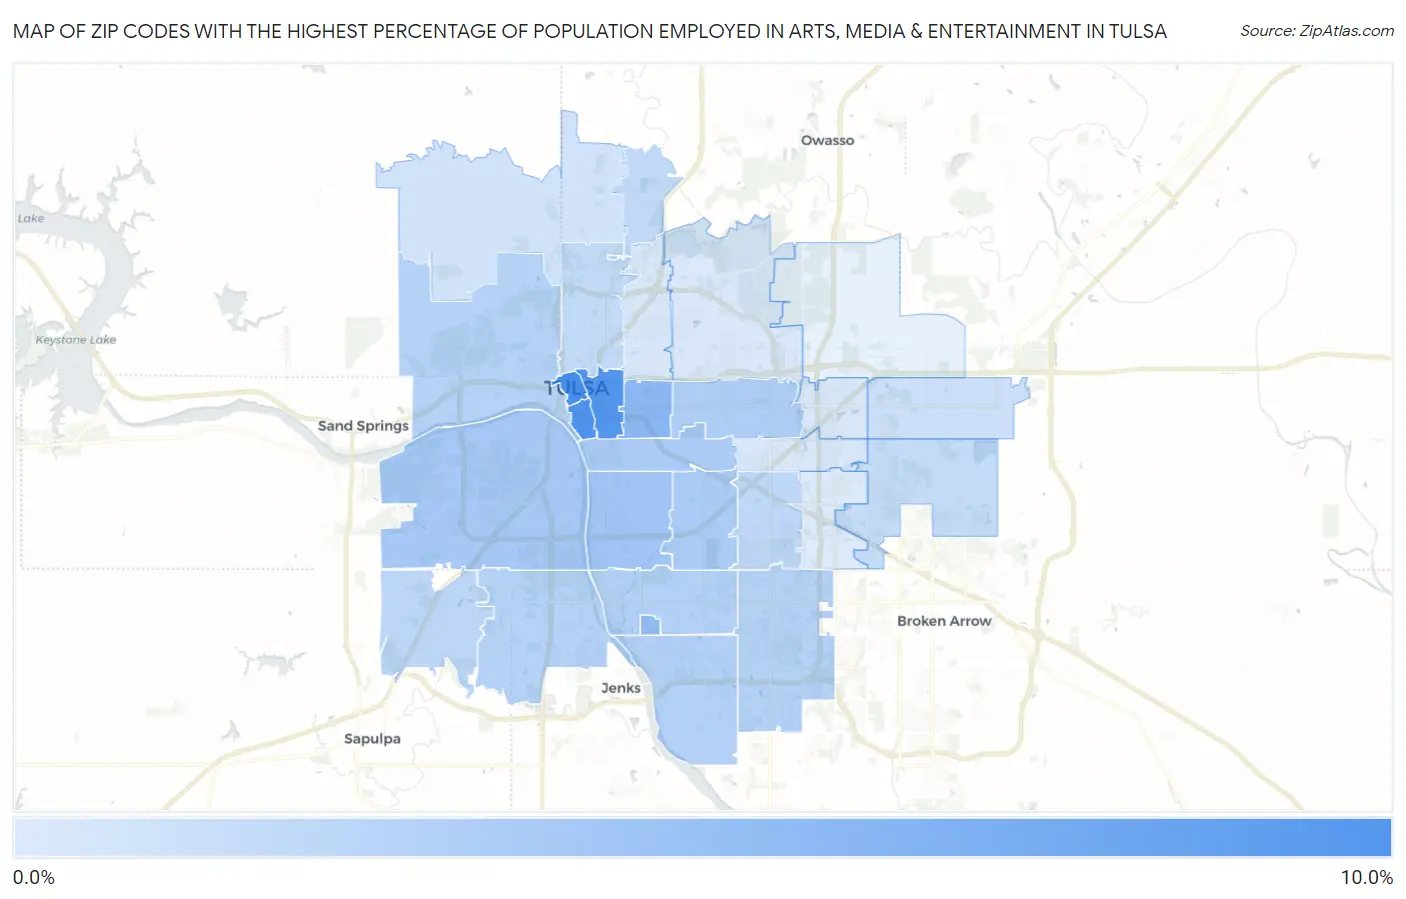
Map of Zip Codes with the Highest Percentage of Population Employed in Arts, Media & Entertainment in Tulsa

0.0%
10.0%
Zip Codes with the Highest Percentage of Population Employed in Arts, Media & Entertainment in Tulsa Map

Zip Codes with the Highest Percentage of Population Employed in Arts, Media & Entertainment in Tulsa, OK

Zip Code % Employed vs State vs National
1.741038.0%1.4%(+6.62)#42.1%(+5.99)#547
2.741197.7%1.4%(+6.29)#52.1%(+5.66)#593
3.741207.4%1.4%(+5.97)#62.1%(+5.34)#668
4.741044.5%1.4%(+3.03)#172.1%(+2.40)#1,886
5.741713.9%1.4%(+2.52)#262.1%(+1.89)#2,433
6.741053.2%1.4%(+1.75)#332.1%(+1.11)#3,673
7.741073.0%1.4%(+1.57)#362.1%(+0.940)#4,073
8.741142.7%1.4%(+1.29)#432.1%(+0.659)#4,853
9.741352.7%1.4%(+1.26)#452.1%(+0.624)#4,956
10.741122.5%1.4%(+1.05)#492.1%(+0.418)#5,625
11.741362.3%1.4%(+0.839)#552.1%(+0.207)#6,517
12.741372.2%1.4%(+0.805)#602.1%(+0.174)#6,667
13.741272.2%1.4%(+0.740)#612.1%(+0.109)#6,959
14.741332.1%1.4%(+0.695)#672.1%(+0.064)#7,148
15.741322.1%1.4%(+0.680)#682.1%(+0.049)#7,213
16.741311.8%1.4%(+0.368)#872.1%(-0.263)#8,989
17.741451.7%1.4%(+0.279)#982.1%(-0.353)#9,560
18.741301.5%1.4%(+0.107)#1142.1%(-0.524)#10,743
19.741061.4%1.4%(-0.060)#1362.1%(-0.691)#11,920
20.741341.4%1.4%(-0.077)#1382.1%(-0.708)#12,066
21.741080.96%1.4%(-0.471)#2102.1%(-1.10)#15,154
22.741260.70%1.4%(-0.728)#2632.1%(-1.36)#17,225
23.741290.37%1.4%(-1.06)#3372.1%(-1.69)#19,827
24.741280.31%1.4%(-1.12)#3462.1%(-1.75)#20,276
25.741100.29%1.4%(-1.14)#3482.1%(-1.77)#20,385
26.741150.22%1.4%(-1.21)#3582.1%(-1.84)#20,829
27.741460.11%1.4%(-1.32)#3742.1%(-1.95)#21,362

Common Questions

What are the Top 10 Zip Codes with the Highest Percentage of Population Employed in Arts, Media & Entertainment in Tulsa, OK?
Top 10 Zip Codes with the Highest Percentage of Population Employed in Arts, Media & Entertainment in Tulsa, OK are:
#1
8.0%
#2
7.7%
#3
7.4%
#4
4.5%
#5
3.9%
#6
3.2%
#7
3.0%
#8
2.7%
#9
2.7%
#10
2.5%
What zip code has the Highest Percentage of Population Employed in Arts, Media & Entertainment in Tulsa, OK?
74103 has the Highest Percentage of Population Employed in Arts, Media & Entertainment in Tulsa, OK with 8.0%.
What is the Percentage of Population Employed in Arts, Media & Entertainment in Tulsa, OK?
Percentage of Population Employed in Arts, Media & Entertainment in Tulsa is 2.1%.
What is the Percentage of Population Employed in Arts, Media & Entertainment in Oklahoma?
Percentage of Population Employed in Arts, Media & Entertainment in Oklahoma is 1.4%.
What is the Percentage of Population Employed in Arts, Media & Entertainment in the United States?
Percentage of Population Employed in Arts, Media & Entertainment in the United States is 2.1%.