Zip Codes with the Highest Percentage of Population Employed in Legal Services & Support in Tulsa, OK

RELATED REPORTS & OPTIONS

Legal Services & Support
Population
Families and Households
Female Fertility
Female Fertility (Unmarried)
Race (Community Size)
Race (Percentage)
Ancestry (Community Size)
AfghanAfricanAleutAmericanApacheArabArapahoArgentineanArmenianAustralianAustrianBahamianBangladeshiBasqueBelgianBelizeanBhutaneseBlackfeetBolivianBrazilianBritishBulgarianBurmeseCajunCanadianCelticCentral AmericanCentral American IndianCherokeeCheyenneChickasawChileanChippewaChoctawColombianComancheCosta RicanCreekCroatianCubanCzechCzechoslovakianDanishDelawareDominicanDutchDutch West IndianEastern EuropeanEcuadorianEgyptianEnglishEstonianEthiopianEuropeanFilipinoFinnishFrenchFrench American IndianFrench CanadianGermanGerman RussianGhanaianGreekGuamanian / ChamorroGuatemalanHaitianHonduranHungarianIcelanderIndian (Asian)IndonesianInupiatIranianIraqiIrishIroquoisIsraeliItalianJamaicanJapaneseJordanianKenyanKiowaKoreanLaotianLatvianLebaneseLiberianLithuanianLumbeeLuxembourgerMalaysianMexicanMexican American IndianMoroccanNative HawaiianNavajoNicaraguanNigerianNorthern EuropeanNorwegianOsageOttawaPakistaniPalestinianPanamanianPennsylvania GermanPeruvianPimaPolishPortuguesePotawatomiPuebloPuerto RicanRomanianRussianSalvadoranSamoanScandinavianScotch-IrishScottishSeminoleSiouxSlavicSlovakSloveneSouth AmericanSouth American IndianSpaniardSpanishSpanish AmericanSri LankanSubsaharan AfricanSudaneseSwedishSwissSyrianThaiTlingit-HaidaTrinidadian and TobagonianTurkishUgandanUkrainianUruguayanVenezuelanVietnameseWelshWest IndianYugoslavian
Ancestry (Percentage)
AfghanAfricanAleutAmericanApacheArabArapahoArgentineanArmenianAustralianAustrianBahamianBangladeshiBasqueBelgianBelizeanBhutaneseBlackfeetBolivianBrazilianBritishBulgarianBurmeseCajunCanadianCelticCentral AmericanCentral American IndianCherokeeCheyenneChickasawChileanChippewaChoctawColombianComancheCosta RicanCreekCroatianCubanCzechCzechoslovakianDanishDelawareDominicanDutchDutch West IndianEastern EuropeanEcuadorianEgyptianEnglishEstonianEthiopianEuropeanFilipinoFinnishFrenchFrench American IndianFrench CanadianGermanGerman RussianGhanaianGreekGuamanian / ChamorroGuatemalanHaitianHonduranHungarianIcelanderIndian (Asian)IndonesianInupiatIranianIraqiIrishIroquoisIsraeliItalianJamaicanJapaneseJordanianKenyanKiowaKoreanLaotianLatvianLebaneseLiberianLithuanianLumbeeLuxembourgerMalaysianMexicanMexican American IndianMoroccanNative HawaiianNavajoNicaraguanNigerianNorthern EuropeanNorwegianOsageOttawaPakistaniPalestinianPanamanianPennsylvania GermanPeruvianPimaPolishPortuguesePotawatomiPuebloPuerto RicanRomanianRussianSalvadoranSamoanScandinavianScotch-IrishScottishSeminoleSiouxSlavicSlovakSloveneSouth AmericanSouth American IndianSpaniardSpanishSpanish AmericanSri LankanSubsaharan AfricanSudaneseSwedishSwissSyrianThaiTlingit-HaidaTrinidadian and TobagonianTurkishUgandanUkrainianUruguayanVenezuelanVietnameseWelshWest IndianYugoslavian
Immigrant Origin (Total)
AfghanistanAfricaArgentinaAsiaAustraliaAustriaBahamasBangladeshBelgiumBelizeBoliviaBrazilBurma / MyanmarCameroonCanadaCaribbeanCentral AmericaChileChinaColombiaCosta RicaCubaDenmarkDominican RepublicEastern AfricaEastern AsiaEastern EuropeEcuadorEgyptEl SalvadorEnglandEritreaEthiopiaEuropeFranceGermanyGhanaGreeceGuatemalaHaitiHondurasHong KongIndiaIndonesiaIranIraqIrelandIsraelItalyJamaicaJapanJordanKazakhstanKenyaKoreaKuwaitLaosLatin AmericaLatviaLebanonLiberiaMalaysiaMexicoMicronesiaMiddle AfricaMoroccoNepalNetherlandsNicaraguaNigeriaNorthern AfricaNorthern EuropeNorwayOceaniaPakistanPanamaPeruPhilippinesPolandPortugalRomaniaRussiaSaudi ArabiaScotlandSouth AfricaSouth AmericaSouth Central AsiaSouth Eastern AsiaSouthern EuropeSpainSwedenSyriaTaiwanThailandTrinidad and TobagoTurkeyUgandaUkraineUruguayVenezuelaVietnamWestern AfricaWestern AsiaWestern EuropeZaireZimbabwe
Immigrant Origin (Percentage)
AfghanistanAfricaArgentinaAsiaAustraliaAustriaBahamasBangladeshBelgiumBelizeBoliviaBrazilBurma / MyanmarCameroonCanadaCaribbeanCentral AmericaChileChinaColombiaCosta RicaCubaDenmarkDominican RepublicEastern AfricaEastern AsiaEastern EuropeEcuadorEgyptEl SalvadorEnglandEritreaEthiopiaEuropeFranceGermanyGhanaGreeceGuatemalaHaitiHondurasHong KongIndiaIndonesiaIranIraqIrelandIsraelItalyJamaicaJapanJordanKazakhstanKenyaKoreaKuwaitLaosLatin AmericaLatviaLebanonLiberiaMalaysiaMexicoMicronesiaMiddle AfricaMoroccoNepalNetherlandsNicaraguaNigeriaNorthern AfricaNorthern EuropeNorwayOceaniaPakistanPanamaPeruPhilippinesPolandPortugalRomaniaRussiaSaudi ArabiaScotlandSouth AfricaSouth AmericaSouth Central AsiaSouth Eastern AsiaSouthern EuropeSpainSwedenSyriaTaiwanThailandTrinidad and TobagoTurkeyUgandaUkraineUruguayVenezuelaVietnamWestern AfricaWestern AsiaWestern EuropeZaireZimbabwe
Income
Income (Families)
Income (Households)
Poverty
Poverty (Families)
Unemployment
Employment Occupations
Employment Industries
Employer Class
Commute Time
Commute Means
School Enrollment
Education by Degree Field
Occupancy
Finances
Physical Characteristics
Tulsa
Compare Zip Codes
Comparison Subject

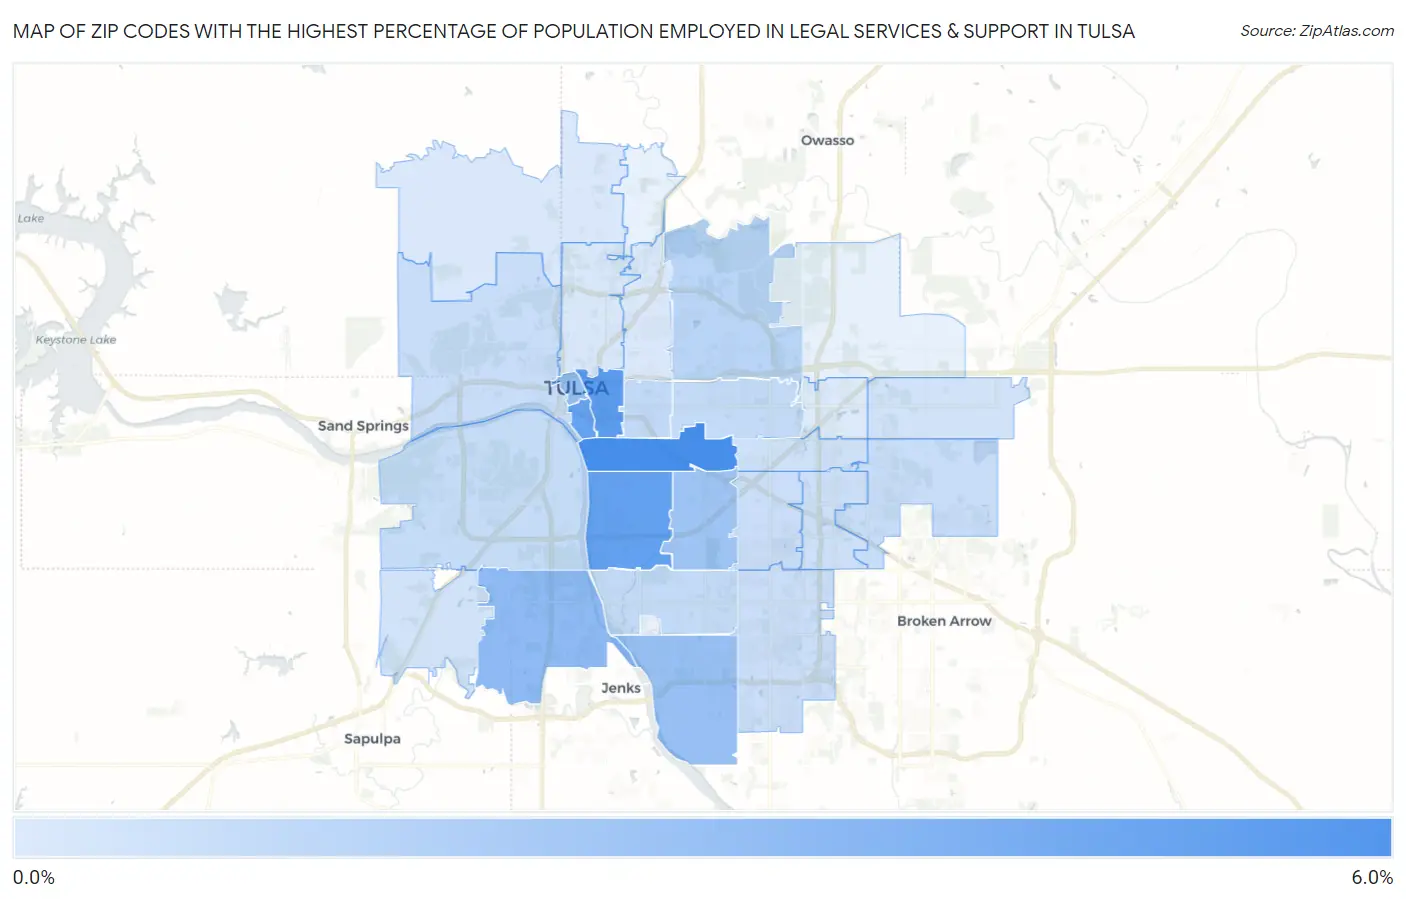
Map of Zip Codes with the Highest Percentage of Population Employed in Legal Services & Support in Tulsa

0.0%
6.0%
Zip Codes with the Highest Percentage of Population Employed in Legal Services & Support in Tulsa Map

Zip Codes with the Highest Percentage of Population Employed in Legal Services & Support in Tulsa, OK

Zip Code % Employed vs State vs National
1.741145.6%1.0%(+4.62)#71.2%(+4.45)#573
2.741204.8%1.0%(+3.81)#91.2%(+3.63)#772
3.741054.6%1.0%(+3.59)#101.2%(+3.41)#858
4.741194.5%1.0%(+3.46)#111.2%(+3.28)#908
5.741323.0%1.0%(+1.97)#201.2%(+1.80)#1,866
6.741032.7%1.0%(+1.73)#291.2%(+1.56)#2,148
7.741372.6%1.0%(+1.61)#301.2%(+1.43)#2,333
8.741352.4%1.0%(+1.35)#351.2%(+1.18)#2,736
9.741151.4%1.0%(+0.359)#811.2%(+0.185)#5,617
10.741041.1%1.0%(+0.118)#971.2%(-0.057)#6,963
11.741361.1%1.0%(+0.052)#1101.2%(-0.123)#7,424
12.741121.0%1.0%(-0.005)#1201.2%(-0.180)#7,798
13.741070.98%1.0%(-0.032)#1221.2%(-0.207)#7,984
14.741270.90%1.0%(-0.110)#1301.2%(-0.284)#8,605
15.741340.82%1.0%(-0.185)#1421.2%(-0.360)#9,248
16.741450.78%1.0%(-0.230)#1511.2%(-0.404)#9,646
17.741330.77%1.0%(-0.241)#1531.2%(-0.416)#9,758
18.741460.74%1.0%(-0.271)#1611.2%(-0.446)#10,028
19.741290.62%1.0%(-0.390)#1841.2%(-0.564)#11,250
20.741310.57%1.0%(-0.442)#1961.2%(-0.616)#11,855
21.741080.53%1.0%(-0.483)#2091.2%(-0.658)#12,300
22.741060.29%1.0%(-0.716)#2761.2%(-0.890)#15,116
23.741260.23%1.0%(-0.784)#2921.2%(-0.958)#15,928
24.741100.16%1.0%(-0.844)#2971.2%(-1.02)#16,541
25.741280.12%1.0%(-0.889)#3061.2%(-1.06)#16,968

Common Questions

What are the Top 10 Zip Codes with the Highest Percentage of Population Employed in Legal Services & Support in Tulsa, OK?
Top 10 Zip Codes with the Highest Percentage of Population Employed in Legal Services & Support in Tulsa, OK are:
#1
5.6%
#2
4.8%
#3
4.6%
#4
4.5%
#5
3.0%
#6
2.7%
#7
2.6%
#8
2.4%
#9
1.4%
#10
1.1%
What zip code has the Highest Percentage of Population Employed in Legal Services & Support in Tulsa, OK?
74114 has the Highest Percentage of Population Employed in Legal Services & Support in Tulsa, OK with 5.6%.
What is the Percentage of Population Employed in Legal Services & Support in Tulsa, OK?
Percentage of Population Employed in Legal Services & Support in Tulsa is 1.7%.
What is the Percentage of Population Employed in Legal Services & Support in Oklahoma?
Percentage of Population Employed in Legal Services & Support in Oklahoma is 1.0%.
What is the Percentage of Population Employed in Legal Services & Support in the United States?
Percentage of Population Employed in Legal Services & Support in the United States is 1.2%.