Zip Codes with the Highest Percentage of Population Employed in Health Diagnosing & Treating in Stillwater, OK
RELATED REPORTS & OPTIONS
Health Diagnosing & Treating
Stillwater
Compare Zip Codes
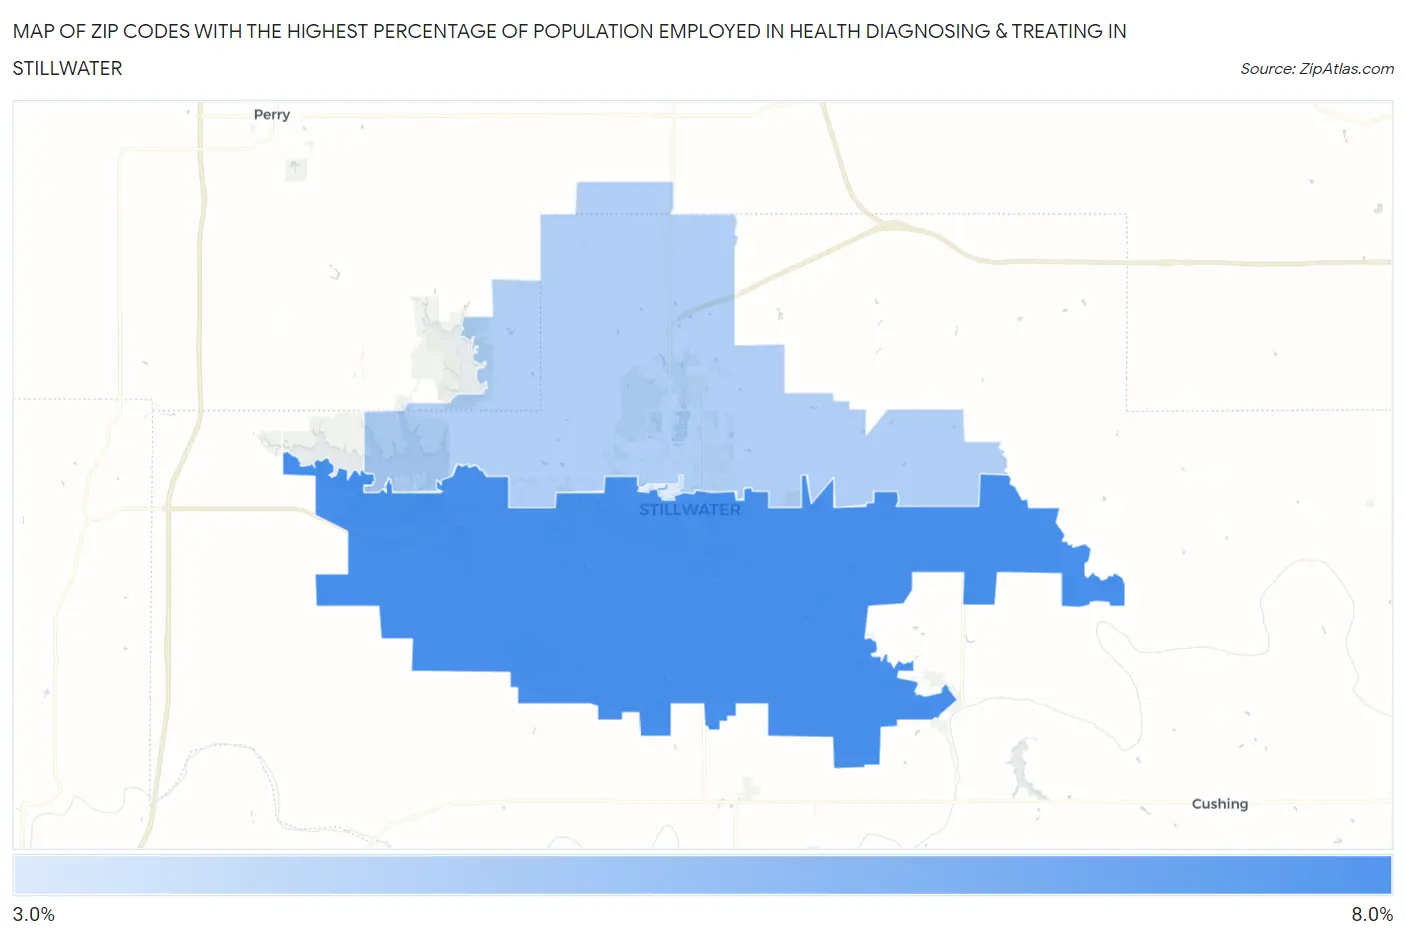
Map of Zip Codes with the Highest Percentage of Population Employed in Health Diagnosing & Treating in Stillwater
3.1%
7.3%
Zip Codes with the Highest Percentage of Population Employed in Health Diagnosing & Treating in Stillwater, OK
| Zip Code | % Employed | vs State | vs National | |
| 1. | 74074 | 7.3% | 6.4%(+0.882)#143 | 6.2%(+1.01)#9,546 |
| 2. | 74075 | 4.3% | 6.4%(-2.09)#381 | 6.2%(-1.96)#20,402 |
| 3. | 74077 | 3.1% | 6.4%(-3.25)#475 | 6.2%(-3.13)#24,008 |
1
Common Questions
What are the Top 3 Zip Codes with the Highest Percentage of Population Employed in Health Diagnosing & Treating in Stillwater, OK?
Top 3 Zip Codes with the Highest Percentage of Population Employed in Health Diagnosing & Treating in Stillwater, OK are:
What zip code has the Highest Percentage of Population Employed in Health Diagnosing & Treating in Stillwater, OK?
74074 has the Highest Percentage of Population Employed in Health Diagnosing & Treating in Stillwater, OK with 7.3%.
What is the Percentage of Population Employed in Health Diagnosing & Treating in Stillwater, OK?
Percentage of Population Employed in Health Diagnosing & Treating in Stillwater is 4.9%.
What is the Percentage of Population Employed in Health Diagnosing & Treating in Oklahoma?
Percentage of Population Employed in Health Diagnosing & Treating in Oklahoma is 6.4%.
What is the Percentage of Population Employed in Health Diagnosing & Treating in the United States?
Percentage of Population Employed in Health Diagnosing & Treating in the United States is 6.2%.