Waterford, OH Map & Demographics
Waterford Map
Waterford Overview
$21,929
PER CAPITA INCOME
$56,477
AVG FAMILY INCOME
$49,271
AVG HOUSEHOLD INCOME
23.5%
WAGE / INCOME GAP [ % ]
76.5¢/ $1
WAGE / INCOME GAP [ $ ]
0.29
INEQUALITY / GINI INDEX
373
TOTAL POPULATION
196
MALE POPULATION
177
FEMALE POPULATION
110.73
MALES / 100 FEMALES
90.31
FEMALES / 100 MALES
44.8
MEDIAN AGE
3.2
AVG FAMILY SIZE
2.9
AVG HOUSEHOLD SIZE
113
LABOR FORCE [ PEOPLE ]
40.2%
PERCENT IN LABOR FORCE
Waterford Zip Codes
Waterford Area Codes
Income in Waterford
Income Overview in Waterford
Per Capita Income in Waterford is $21,929, while median incomes of families and households are $56,477 and $49,271 respectively.
| Characteristic | Number | Measure |
| Per Capita Income | 373 | $21,929 |
| Median Family Income | 103 | $56,477 |
| Mean Family Income | 103 | $68,428 |
| Median Household Income | 130 | $49,271 |
| Mean Household Income | 130 | $59,425 |
| Income Deficit | 103 | $0 |
| Wage / Income Gap (%) | 373 | 23.46% |
| Wage / Income Gap ($) | 373 | 76.54¢ per $1 |
| Gini / Inequality Index | 373 | 0.29 |
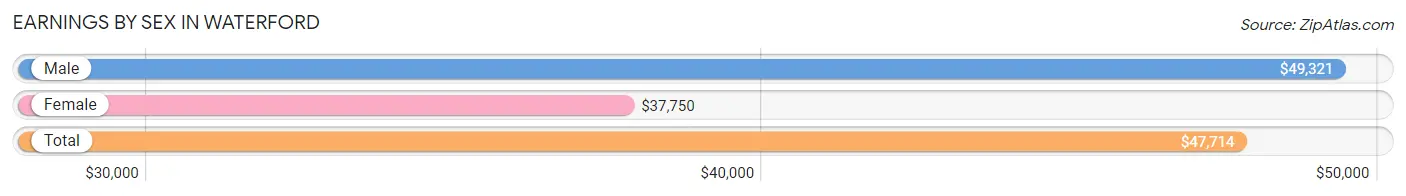
Earnings by Sex in Waterford
Average Earnings in Waterford are $47,714, $49,321 for men and $37,750 for women, a difference of 23.5%.
| Sex | Number | Average Earnings |
| Male | 51 (39.2%) | $49,321 |
| Female | 79 (60.8%) | $37,750 |
| Total | 130 (100.0%) | $47,714 |
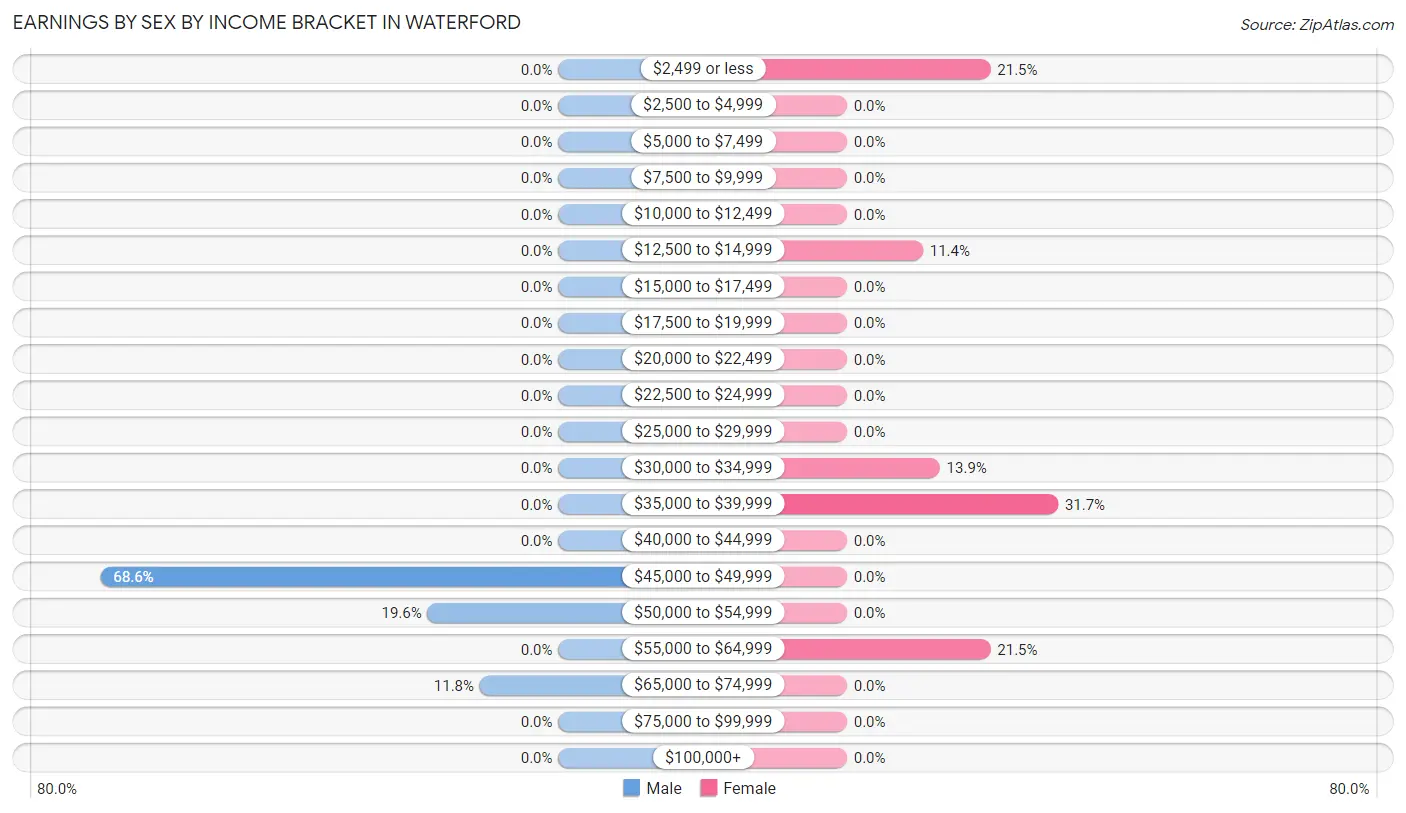
Earnings by Sex by Income Bracket in Waterford
The most common earnings brackets in Waterford are $45,000 to $49,999 for men (35 | 68.6%) and $35,000 to $39,999 for women (25 | 31.7%).
| Income | Male | Female |
| $2,499 or less | 0 (0.0%) | 17 (21.5%) |
| $2,500 to $4,999 | 0 (0.0%) | 0 (0.0%) |
| $5,000 to $7,499 | 0 (0.0%) | 0 (0.0%) |
| $7,500 to $9,999 | 0 (0.0%) | 0 (0.0%) |
| $10,000 to $12,499 | 0 (0.0%) | 0 (0.0%) |
| $12,500 to $14,999 | 0 (0.0%) | 9 (11.4%) |
| $15,000 to $17,499 | 0 (0.0%) | 0 (0.0%) |
| $17,500 to $19,999 | 0 (0.0%) | 0 (0.0%) |
| $20,000 to $22,499 | 0 (0.0%) | 0 (0.0%) |
| $22,500 to $24,999 | 0 (0.0%) | 0 (0.0%) |
| $25,000 to $29,999 | 0 (0.0%) | 0 (0.0%) |
| $30,000 to $34,999 | 0 (0.0%) | 11 (13.9%) |
| $35,000 to $39,999 | 0 (0.0%) | 25 (31.7%) |
| $40,000 to $44,999 | 0 (0.0%) | 0 (0.0%) |
| $45,000 to $49,999 | 35 (68.6%) | 0 (0.0%) |
| $50,000 to $54,999 | 10 (19.6%) | 0 (0.0%) |
| $55,000 to $64,999 | 0 (0.0%) | 17 (21.5%) |
| $65,000 to $74,999 | 6 (11.8%) | 0 (0.0%) |
| $75,000 to $99,999 | 0 (0.0%) | 0 (0.0%) |
| $100,000+ | 0 (0.0%) | 0 (0.0%) |
| Total | 51 (100.0%) | 79 (100.0%) |
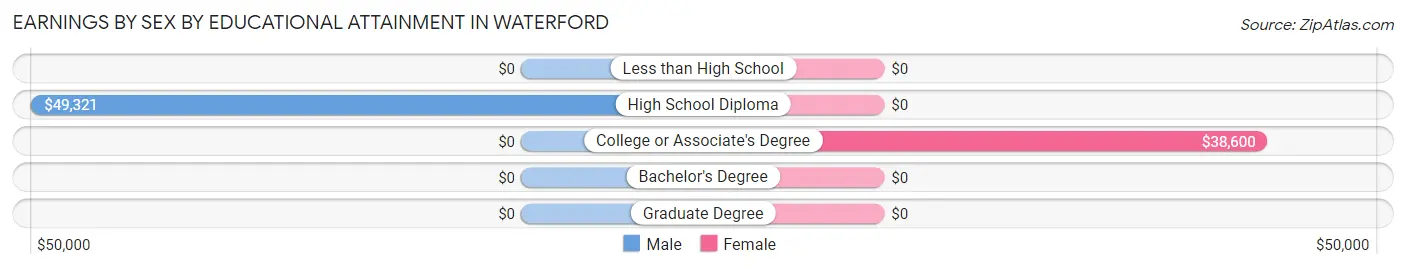
Earnings by Sex by Educational Attainment in Waterford
Average earnings in Waterford are $49,321 for men and $38,600 for women, a difference of 21.7%. Men with an educational attainment of high school diploma enjoy the highest average annual earnings of $49,321, while those with high school diploma education earn the least with $49,321. Women with an educational attainment of college or associate's degree earn the most with the average annual earnings of $38,600, while those with college or associate's degree education have the smallest earnings of $38,600.
| Educational Attainment | Male Income | Female Income |
| Less than High School | - | - |
| High School Diploma | $49,321 | $0 |
| College or Associate's Degree | - | - |
| Bachelor's Degree | - | - |
| Graduate Degree | - | - |
| Total | $49,321 | $38,600 |
Family Income in Waterford
Family Income Brackets in Waterford
According to the Waterford family income data, there are 40 families falling into the $35,000 to $49,999 income range, which is the most common income bracket and makes up 38.8% of all families.
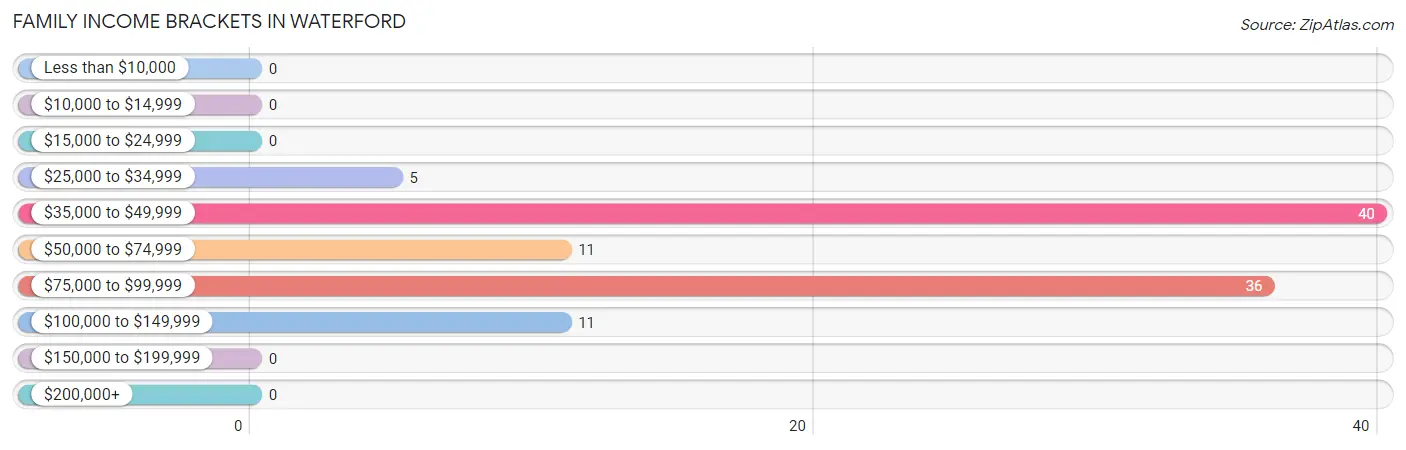
| Income Bracket | # Families | % Families |
| Less than $10,000 | 0 | 0.0% |
| $10,000 to $14,999 | 0 | 0.0% |
| $15,000 to $24,999 | 0 | 0.0% |
| $25,000 to $34,999 | 5 | 4.9% |
| $35,000 to $49,999 | 40 | 38.8% |
| $50,000 to $74,999 | 11 | 10.7% |
| $75,000 to $99,999 | 36 | 35.0% |
| $100,000 to $149,999 | 11 | 10.7% |
| $150,000 to $199,999 | 0 | 0.0% |
| $200,000+ | 0 | 0.0% |
Family Income by Famaliy Size in Waterford
2-person families (52 | 50.5%) account for the highest median family income in Waterford with $48,958 per family, while 2-person families (52 | 50.5%) have the highest median income of $24,479 per family member.
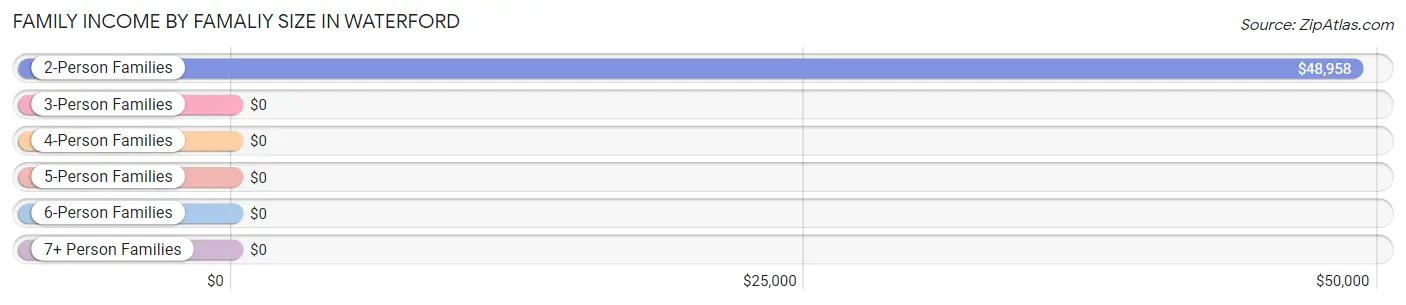
| Income Bracket | # Families | Median Income |
| 2-Person Families | 52 (50.5%) | $48,958 |
| 3-Person Families | 11 (10.7%) | $0 |
| 4-Person Families | 15 (14.6%) | $0 |
| 5-Person Families | 25 (24.3%) | $0 |
| 6-Person Families | 0 (0.0%) | $0 |
| 7+ Person Families | 0 (0.0%) | $0 |
| Total | 103 (100.0%) | $56,477 |
Family Income by Number of Earners in Waterford
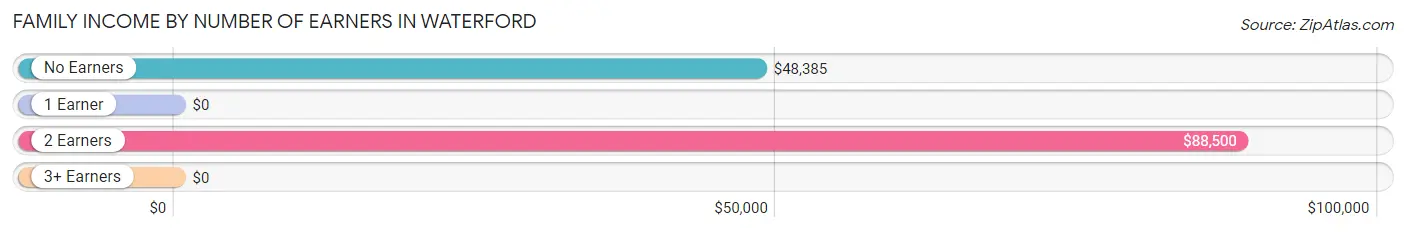
| Number of Earners | # Families | Median Income |
| No Earners | 41 (39.8%) | $48,385 |
| 1 Earner | 11 (10.7%) | $0 |
| 2 Earners | 42 (40.8%) | $88,500 |
| 3+ Earners | 9 (8.7%) | $0 |
| Total | 103 (100.0%) | $56,477 |
Household Income in Waterford
Household Income Brackets in Waterford
With 46 households falling in the category, the $35,000 to $49,999 income range is the most frequent in Waterford, accounting for 35.4% of all households.
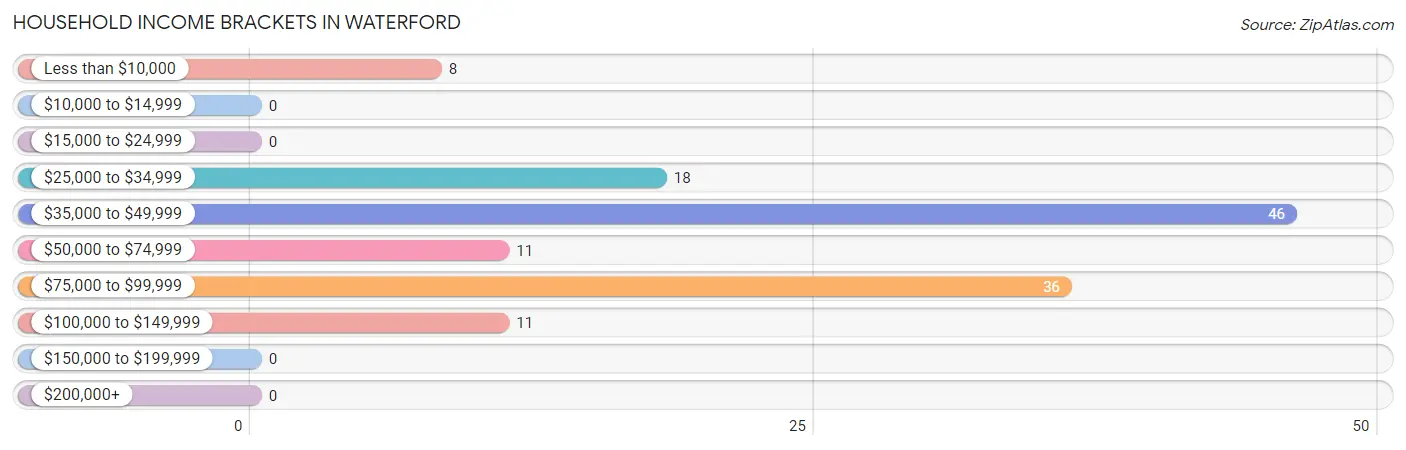
| Income Bracket | # Households | % Households |
| Less than $10,000 | 8 | 6.2% |
| $10,000 to $14,999 | 0 | 0.0% |
| $15,000 to $24,999 | 0 | 0.0% |
| $25,000 to $34,999 | 18 | 13.8% |
| $35,000 to $49,999 | 46 | 35.4% |
| $50,000 to $74,999 | 11 | 8.5% |
| $75,000 to $99,999 | 36 | 27.7% |
| $100,000 to $149,999 | 11 | 8.5% |
| $150,000 to $199,999 | 0 | 0.0% |
| $200,000+ | 0 | 0.0% |
Household Income by Householder Age in Waterford
The median household income in Waterford is $49,271, with the highest median household income of $56,477 found in the 25 to 44 years age bracket for the primary householder. A total of 31 households (23.8%) fall into this category.
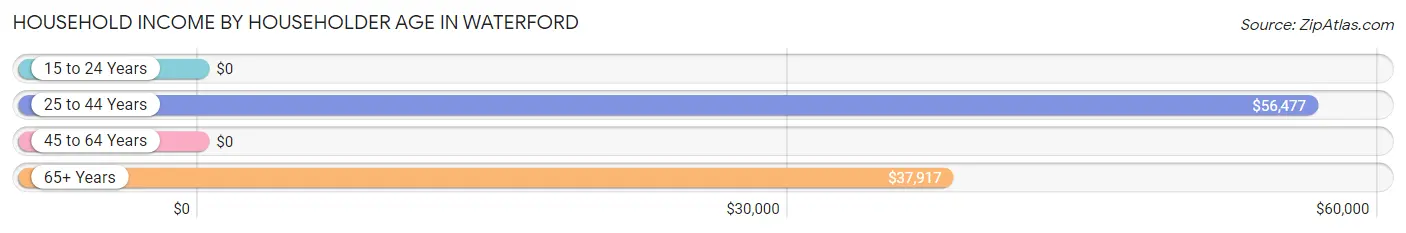
| Income Bracket | # Households | Median Income |
| 15 to 24 Years | 0 (0.0%) | $0 |
| 25 to 44 Years | 31 (23.8%) | $56,477 |
| 45 to 64 Years | 31 (23.8%) | $0 |
| 65+ Years | 68 (52.3%) | $37,917 |
| Total | 130 (100.0%) | $49,271 |
Poverty in Waterford
Income Below Poverty by Sex and Age in Waterford
With 4.1% poverty level for males and 6.2% for females among the residents of Waterford, 75 year old and over males and 35 to 44 year old females are the most vulnerable to poverty, with 8 males (38.1%) and 11 females (26.2%) in their respective age groups living below the poverty level.
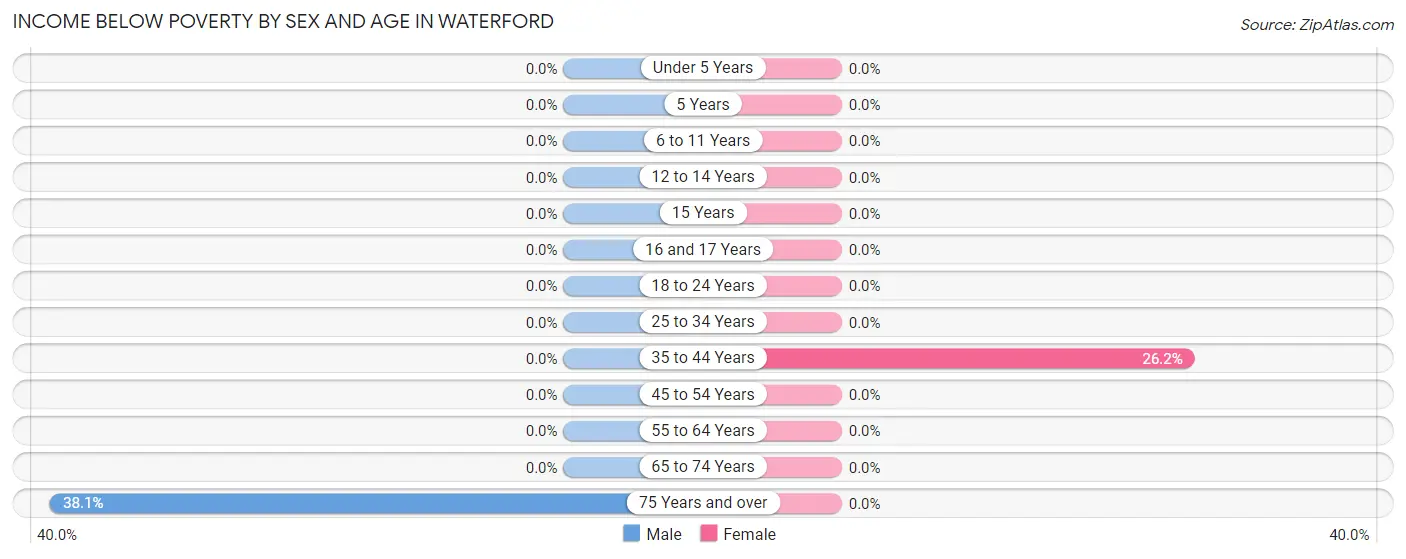
| Age Bracket | Male | Female |
| Under 5 Years | 0 (0.0%) | 0 (0.0%) |
| 5 Years | 0 (0.0%) | 0 (0.0%) |
| 6 to 11 Years | 0 (0.0%) | 0 (0.0%) |
| 12 to 14 Years | 0 (0.0%) | 0 (0.0%) |
| 15 Years | 0 (0.0%) | 0 (0.0%) |
| 16 and 17 Years | 0 (0.0%) | 0 (0.0%) |
| 18 to 24 Years | 0 (0.0%) | 0 (0.0%) |
| 25 to 34 Years | 0 (0.0%) | 0 (0.0%) |
| 35 to 44 Years | 0 (0.0%) | 11 (26.2%) |
| 45 to 54 Years | 0 (0.0%) | 0 (0.0%) |
| 55 to 64 Years | 0 (0.0%) | 0 (0.0%) |
| 65 to 74 Years | 0 (0.0%) | 0 (0.0%) |
| 75 Years and over | 8 (38.1%) | 0 (0.0%) |
| Total | 8 (4.1%) | 11 (6.2%) |
Income Above Poverty by Sex and Age in Waterford
According to the poverty statistics in Waterford, males aged 6 to 11 years and females aged 12 to 14 years are the age groups that are most secure financially, with 100.0% of males and 100.0% of females in these age groups living above the poverty line.
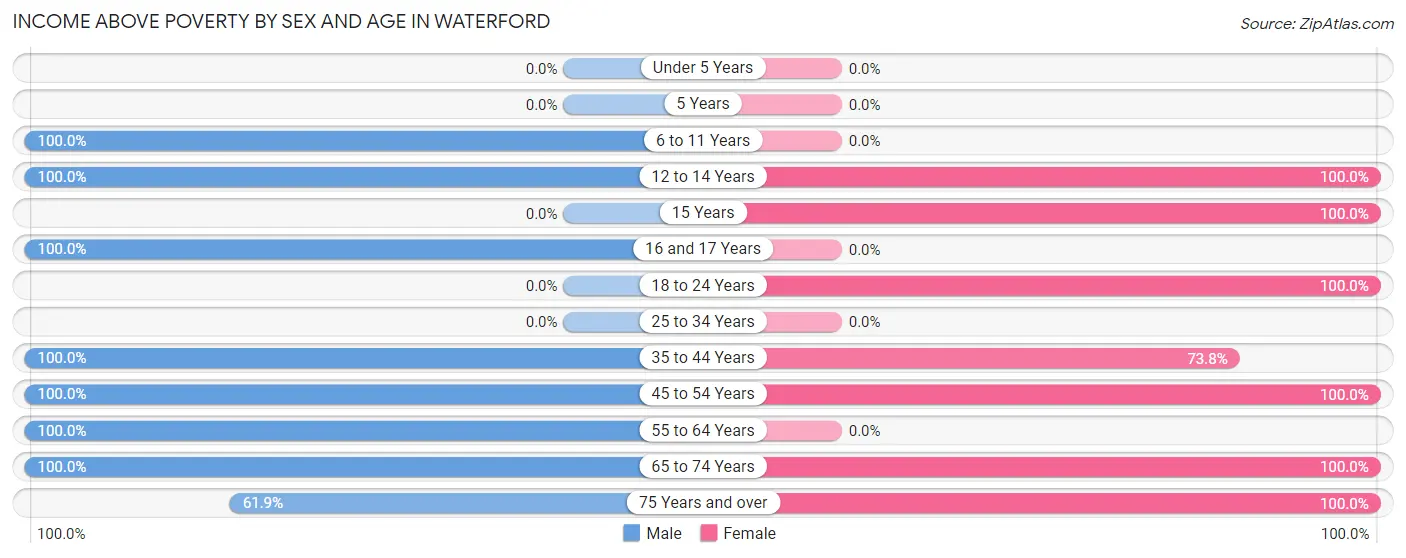
| Age Bracket | Male | Female |
| Under 5 Years | 0 (0.0%) | 0 (0.0%) |
| 5 Years | 0 (0.0%) | 0 (0.0%) |
| 6 to 11 Years | 10 (100.0%) | 0 (0.0%) |
| 12 to 14 Years | 56 (100.0%) | 17 (100.0%) |
| 15 Years | 0 (0.0%) | 9 (100.0%) |
| 16 and 17 Years | 29 (100.0%) | 0 (0.0%) |
| 18 to 24 Years | 0 (0.0%) | 17 (100.0%) |
| 25 to 34 Years | 0 (0.0%) | 0 (0.0%) |
| 35 to 44 Years | 10 (100.0%) | 31 (73.8%) |
| 45 to 54 Years | 6 (100.0%) | 31 (100.0%) |
| 55 to 64 Years | 35 (100.0%) | 0 (0.0%) |
| 65 to 74 Years | 29 (100.0%) | 36 (100.0%) |
| 75 Years and over | 13 (61.9%) | 25 (100.0%) |
| Total | 188 (95.9%) | 166 (93.8%) |
Income Below Poverty Among Married-Couple Families in Waterford
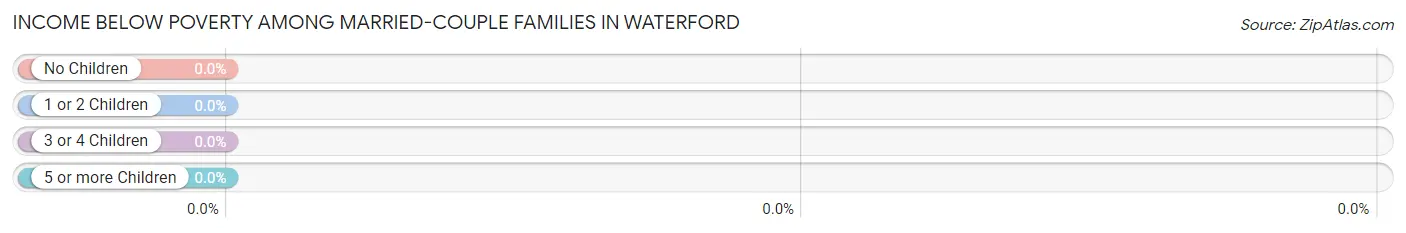
| Children | Above Poverty | Below Poverty |
| No Children | 52 (100.0%) | 0 (0.0%) |
| 1 or 2 Children | 6 (100.0%) | 0 (0.0%) |
| 3 or 4 Children | 25 (100.0%) | 0 (0.0%) |
| 5 or more Children | 0 (0.0%) | 0 (0.0%) |
| Total | 83 (100.0%) | 0 (0.0%) |
Income Below Poverty Among Single-Parent Households in Waterford
| Children | Single Father | Single Mother |
| No Children | 0 (0.0%) | 0 (0.0%) |
| 1 or 2 Children | 0 (0.0%) | 0 (0.0%) |
| 3 or 4 Children | 0 (0.0%) | 0 (0.0%) |
| 5 or more Children | 0 (0.0%) | 0 (0.0%) |
| Total | 0 (0.0%) | 0 (0.0%) |
Income Below Poverty Among Married-Couple vs Single-Parent Households in Waterford
| Children | Married-Couple Families | Single-Parent Households |
| No Children | 0 (0.0%) | 0 (0.0%) |
| 1 or 2 Children | 0 (0.0%) | 0 (0.0%) |
| 3 or 4 Children | 0 (0.0%) | 0 (0.0%) |
| 5 or more Children | 0 (0.0%) | 0 (0.0%) |
| Total | 0 (0.0%) | 0 (0.0%) |
Race in Waterford
The most populous races in Waterford are , and White / Caucasian (373 | 100.0%).
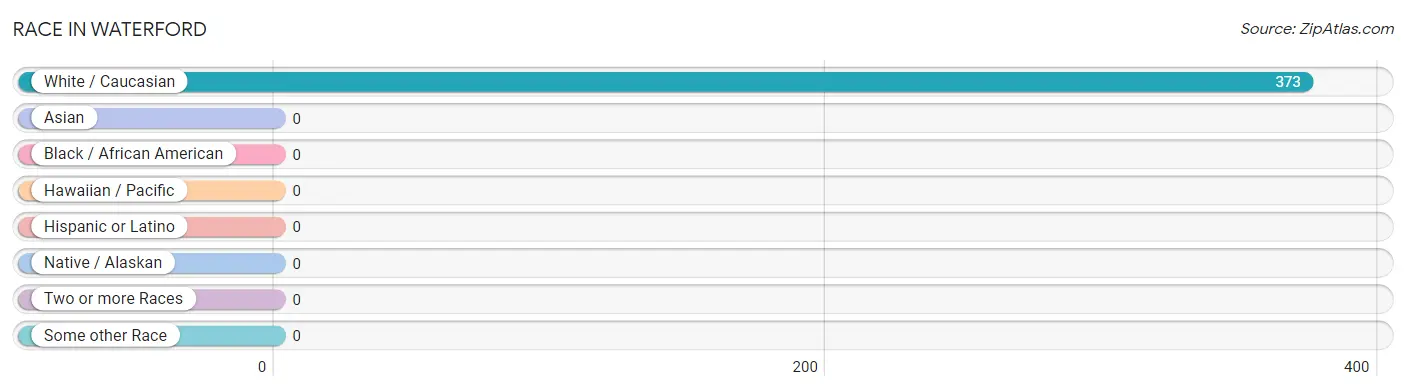
| Race | # Population | % Population |
| Asian | 0 | 0.0% |
| Black / African American | 0 | 0.0% |
| Hawaiian / Pacific | 0 | 0.0% |
| Hispanic or Latino | 0 | 0.0% |
| Native / Alaskan | 0 | 0.0% |
| White / Caucasian | 373 | 100.0% |
| Two or more Races | 0 | 0.0% |
| Some other Race | 0 | 0.0% |
| Total | 373 | 100.0% |
Ancestry in Waterford
The most populous ancestries reported in Waterford are English (131 | 35.1%), Dutch (105 | 28.1%), American (65 | 17.4%), German (38 | 10.2%), and French (11 | 2.9%), together accounting for 93.8% of all Waterford residents.
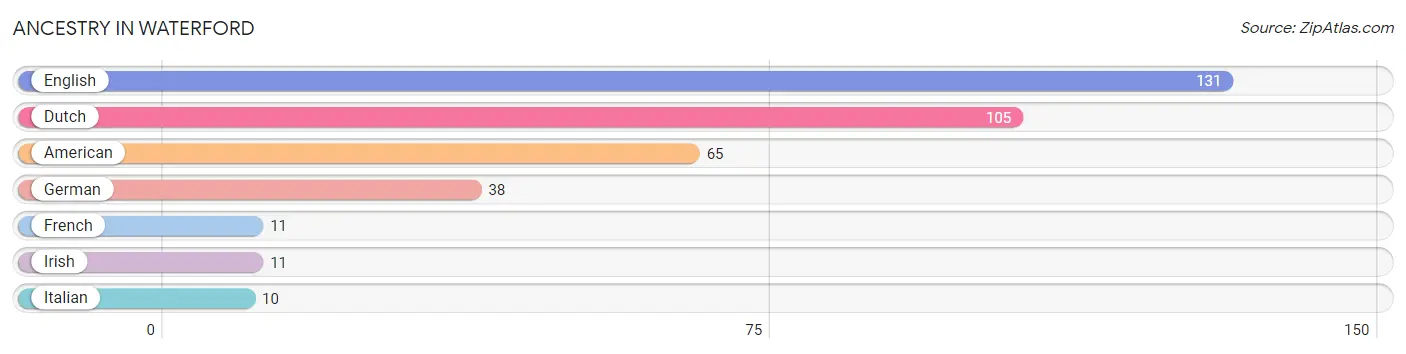
| Ancestry | # Population | % Population |
| American | 65 | 17.4% |
| Dutch | 105 | 28.1% |
| English | 131 | 35.1% |
| French | 11 | 2.9% |
| German | 38 | 10.2% |
| Irish | 11 | 2.9% |
| Italian | 10 | 2.7% | View All 7 Rows |
Immigrants in Waterford

| Immigration Origin | # Population | % Population | View All 0 Rows |
Sex and Age in Waterford
Sex and Age in Waterford
The most populous age groups in Waterford are 10 to 14 Years (66 | 33.7%) for men and 45 to 49 Years (31 | 17.5%) for women.
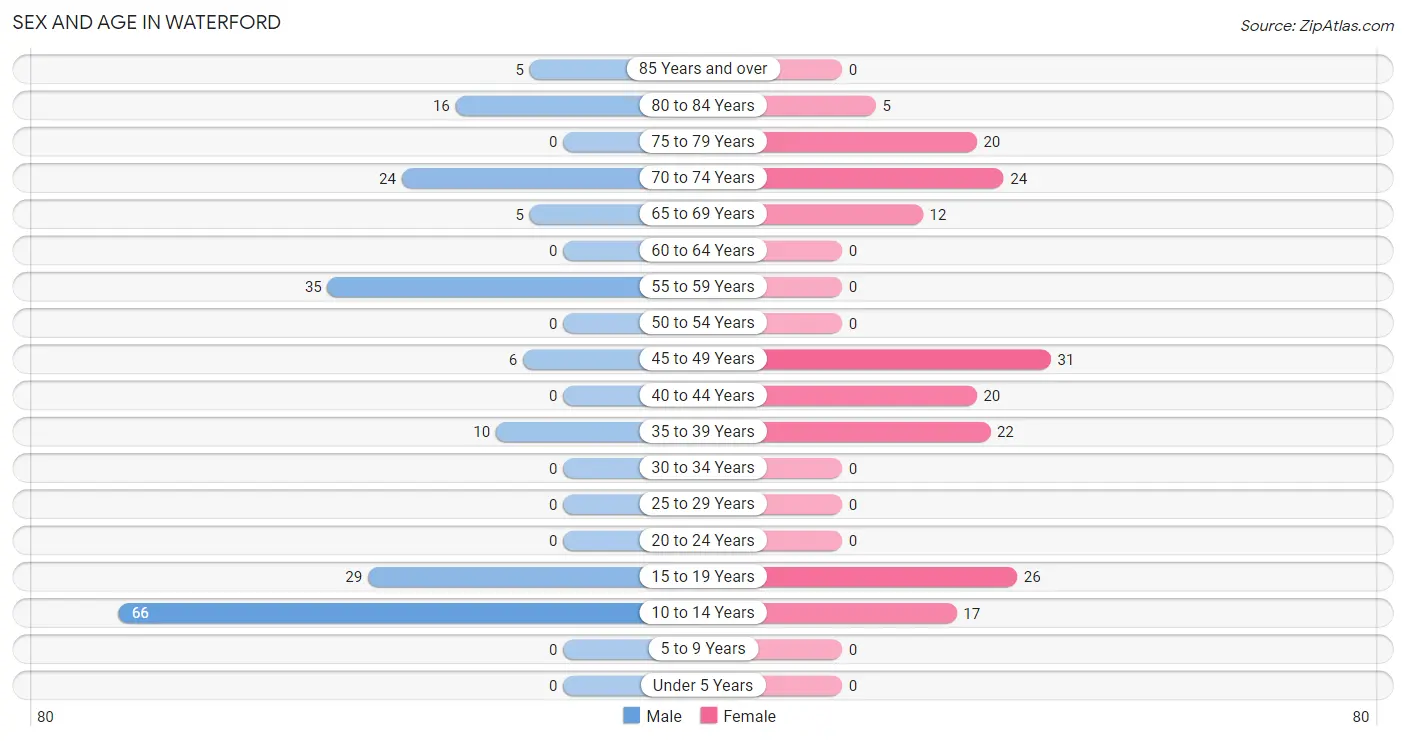
| Age Bracket | Male | Female |
| Under 5 Years | 0 (0.0%) | 0 (0.0%) |
| 5 to 9 Years | 0 (0.0%) | 0 (0.0%) |
| 10 to 14 Years | 66 (33.7%) | 17 (9.6%) |
| 15 to 19 Years | 29 (14.8%) | 26 (14.7%) |
| 20 to 24 Years | 0 (0.0%) | 0 (0.0%) |
| 25 to 29 Years | 0 (0.0%) | 0 (0.0%) |
| 30 to 34 Years | 0 (0.0%) | 0 (0.0%) |
| 35 to 39 Years | 10 (5.1%) | 22 (12.4%) |
| 40 to 44 Years | 0 (0.0%) | 20 (11.3%) |
| 45 to 49 Years | 6 (3.1%) | 31 (17.5%) |
| 50 to 54 Years | 0 (0.0%) | 0 (0.0%) |
| 55 to 59 Years | 35 (17.9%) | 0 (0.0%) |
| 60 to 64 Years | 0 (0.0%) | 0 (0.0%) |
| 65 to 69 Years | 5 (2.5%) | 12 (6.8%) |
| 70 to 74 Years | 24 (12.2%) | 24 (13.6%) |
| 75 to 79 Years | 0 (0.0%) | 20 (11.3%) |
| 80 to 84 Years | 16 (8.2%) | 5 (2.8%) |
| 85 Years and over | 5 (2.5%) | 0 (0.0%) |
| Total | 196 (100.0%) | 177 (100.0%) |
Families and Households in Waterford
Median Family Size in Waterford
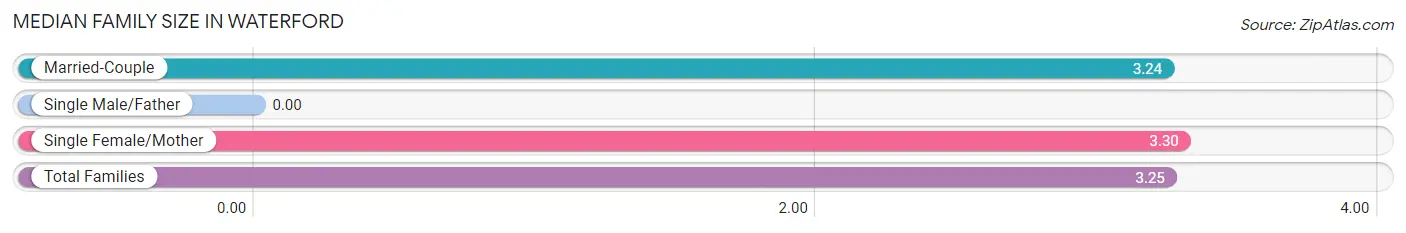
| Family Type | # Families | Family Size |
| Married-Couple | 83 (80.6%) | 3.24 |
| Single Male/Father | 0 (0.0%) | - |
| Single Female/Mother | 20 (19.4%) | 3.30 |
| Total Families | 103 (100.0%) | 3.25 |
Median Household Size in Waterford
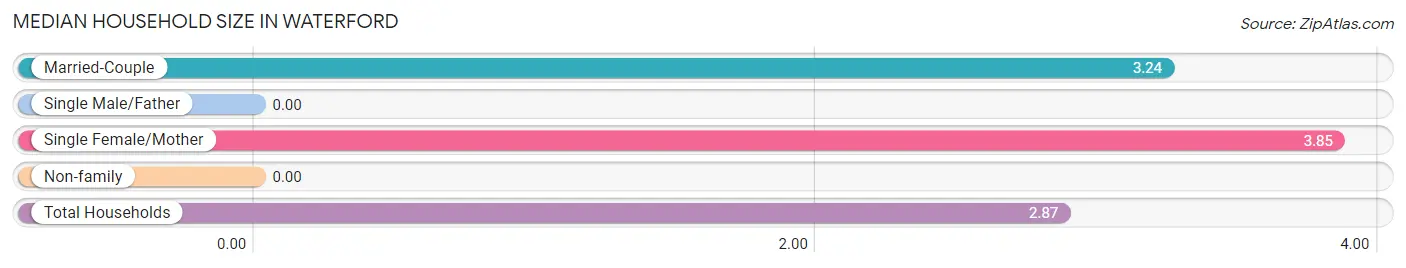
| Household Type | # Households | Household Size |
| Married-Couple | 83 (63.8%) | 3.24 |
| Single Male/Father | 0 (0.0%) | - |
| Single Female/Mother | 20 (15.4%) | 3.85 |
| Non-family | 27 (20.8%) | - |
| Total Households | 130 (100.0%) | 2.87 |
Household Size by Marriage Status in Waterford
Out of a total of 130 households in Waterford, 103 (79.2%) are family households, while 27 (20.8%) are nonfamily households. The most numerous type of family households are 2-person households, comprising 52, and the most common type of nonfamily households are 1-person households, comprising 27.
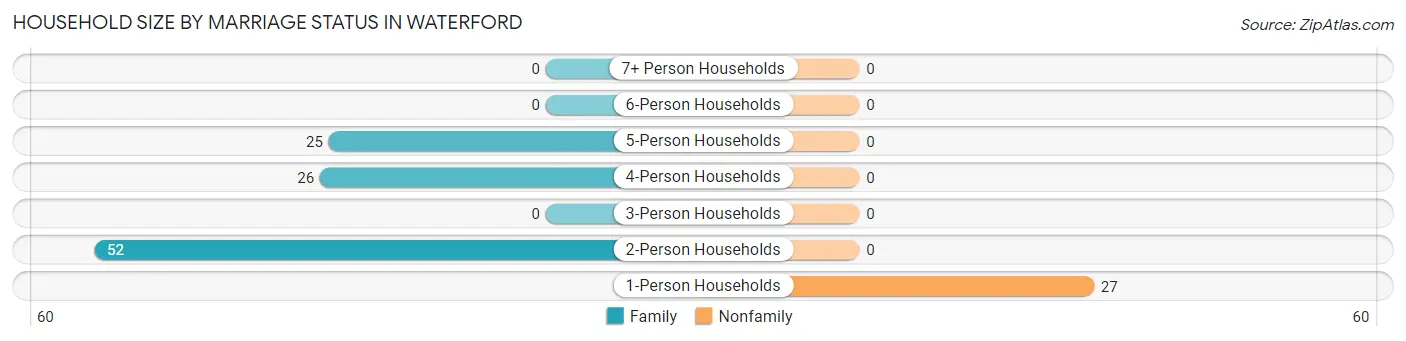
| Household Size | Family Households | Nonfamily Households |
| 1-Person Households | - | 27 (20.8%) |
| 2-Person Households | 52 (40.0%) | 0 (0.0%) |
| 3-Person Households | 0 (0.0%) | 0 (0.0%) |
| 4-Person Households | 26 (20.0%) | 0 (0.0%) |
| 5-Person Households | 25 (19.2%) | 0 (0.0%) |
| 6-Person Households | 0 (0.0%) | 0 (0.0%) |
| 7+ Person Households | 0 (0.0%) | 0 (0.0%) |
| Total | 103 (79.2%) | 27 (20.8%) |
Female Fertility in Waterford
Fertility by Age in Waterford
| Age Bracket | Women with Births | Births / 1,000 Women |
| 15 to 19 years | 0 (0.0%) | 0.0 |
| 20 to 34 years | 0 (0.0%) | 0.0 |
| 35 to 50 years | 0 (0.0%) | 0.0 |
| Total | 0 (0.0%) | 0.0 |
Fertility by Age by Marriage Status in Waterford
| Age Bracket | Married | Unmarried |
| 15 to 19 years | 0 (0.0%) | 0 (0.0%) |
| 20 to 34 years | 0 (0.0%) | 0 (0.0%) |
| 35 to 50 years | 0 (0.0%) | 0 (0.0%) |
| Total | 0 (0.0%) | 0 (0.0%) |
Fertility by Education in Waterford
| Educational Attainment | Women with Births | Births / 1,000 Women |
| Less than High School | 0 (0.0%) | 0.0 |
| High School Diploma | 0 (0.0%) | 0.0 |
| College or Associate's Degree | 0 (0.0%) | 0.0 |
| Bachelor's Degree | 0 (0.0%) | 0.0 |
| Graduate Degree | 0 (0.0%) | 0.0 |
| Total | 0 (0.0%) | 0.0 |
Fertility by Education by Marriage Status in Waterford
| Educational Attainment | Married | Unmarried |
| Less than High School | 0 (0.0%) | 0 (0.0%) |
| High School Diploma | 0 (0.0%) | 0 (0.0%) |
| College or Associate's Degree | 0 (0.0%) | 0 (0.0%) |
| Bachelor's Degree | 0 (0.0%) | 0 (0.0%) |
| Graduate Degree | 0 (0.0%) | 0 (0.0%) |
| Total | 0 (0.0%) | 0 (0.0%) |
Employment Characteristics in Waterford
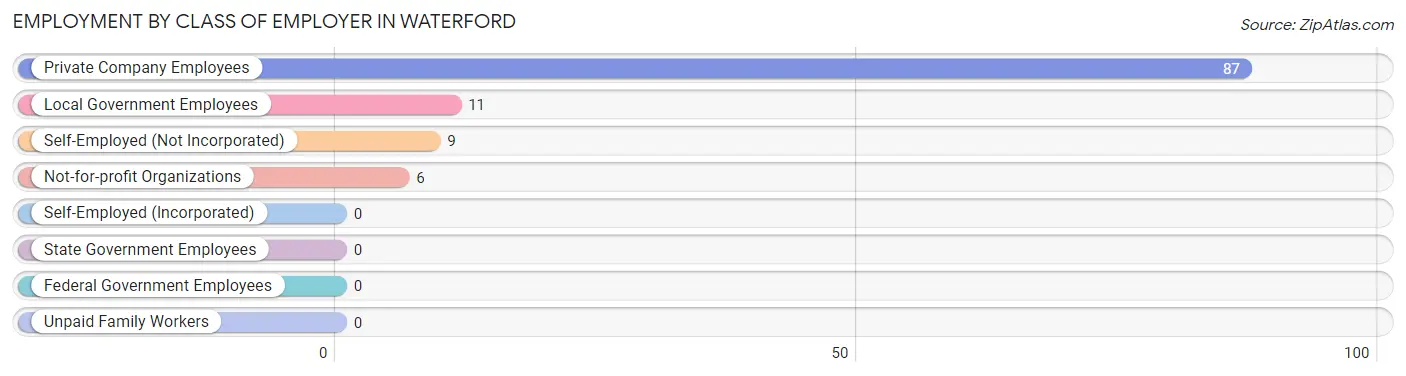
Employment by Class of Employer in Waterford
Among the 113 employed individuals in Waterford, private company employees (87 | 77.0%), local government employees (11 | 9.7%), and self-employed (not incorporated) (9 | 8.0%) make up the most common classes of employment.
| Employer Class | # Employees | % Employees |
| Private Company Employees | 87 | 77.0% |
| Self-Employed (Incorporated) | 0 | 0.0% |
| Self-Employed (Not Incorporated) | 9 | 8.0% |
| Not-for-profit Organizations | 6 | 5.3% |
| Local Government Employees | 11 | 9.7% |
| State Government Employees | 0 | 0.0% |
| Federal Government Employees | 0 | 0.0% |
| Unpaid Family Workers | 0 | 0.0% |
| Total | 113 | 100.0% |
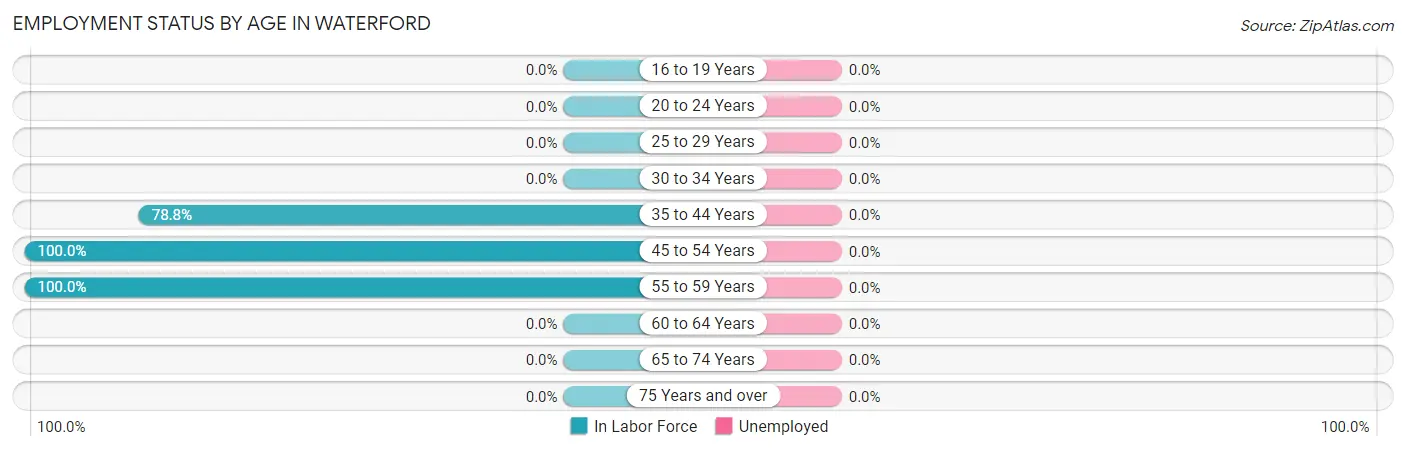
Employment Status by Age in Waterford
| Age Bracket | In Labor Force | Unemployed |
| 16 to 19 Years | 0 (0.0%) | 0 (0.0%) |
| 20 to 24 Years | 0 (0.0%) | 0 (0.0%) |
| 25 to 29 Years | 0 (0.0%) | 0 (0.0%) |
| 30 to 34 Years | 0 (0.0%) | 0 (0.0%) |
| 35 to 44 Years | 41 (78.8%) | 0 (0.0%) |
| 45 to 54 Years | 37 (100.0%) | 0 (0.0%) |
| 55 to 59 Years | 35 (100.0%) | 0 (0.0%) |
| 60 to 64 Years | 0 (0.0%) | 0 (0.0%) |
| 65 to 74 Years | 0 (0.0%) | 0 (0.0%) |
| 75 Years and over | 0 (0.0%) | 0 (0.0%) |
| Total | 113 (40.2%) | 0 (0.0%) |
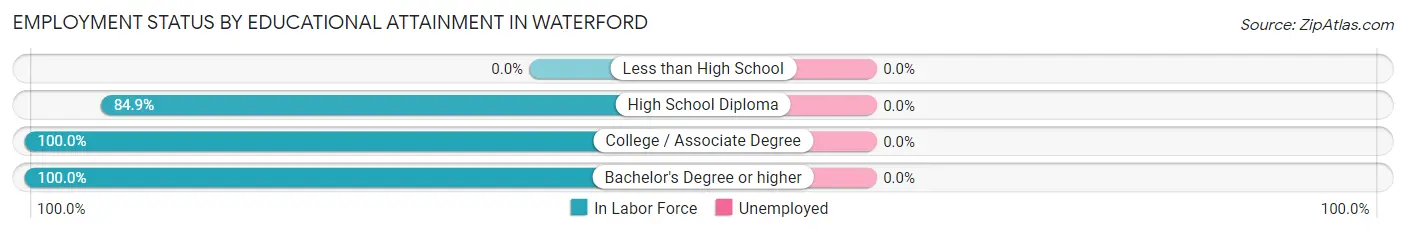
Employment Status by Educational Attainment in Waterford
| Educational Attainment | In Labor Force | Unemployed |
| Less than High School | 0 (0.0%) | 0 (0.0%) |
| High School Diploma | 62 (84.9%) | 0 (0.0%) |
| College / Associate Degree | 40 (100.0%) | 0 (0.0%) |
| Bachelor's Degree or higher | 11 (100.0%) | 0 (0.0%) |
| Total | 113 (91.1%) | 0 (0.0%) |
Employment Occupations by Sex in Waterford
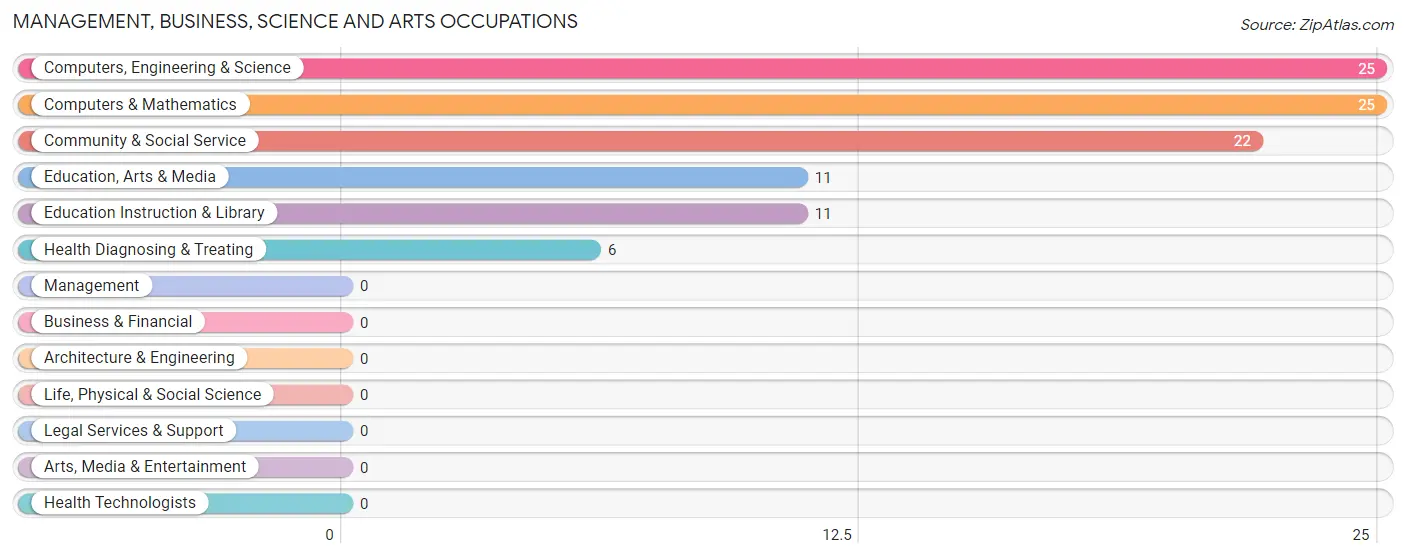
Management, Business, Science and Arts Occupations
The most common Management, Business, Science and Arts occupations in Waterford are Computers, Engineering & Science (25 | 22.1%), Computers & Mathematics (25 | 22.1%), Community & Social Service (22 | 19.5%), Education, Arts & Media (11 | 9.7%), and Education Instruction & Library (11 | 9.7%).
Management, Business, Science and Arts Occupations by Sex
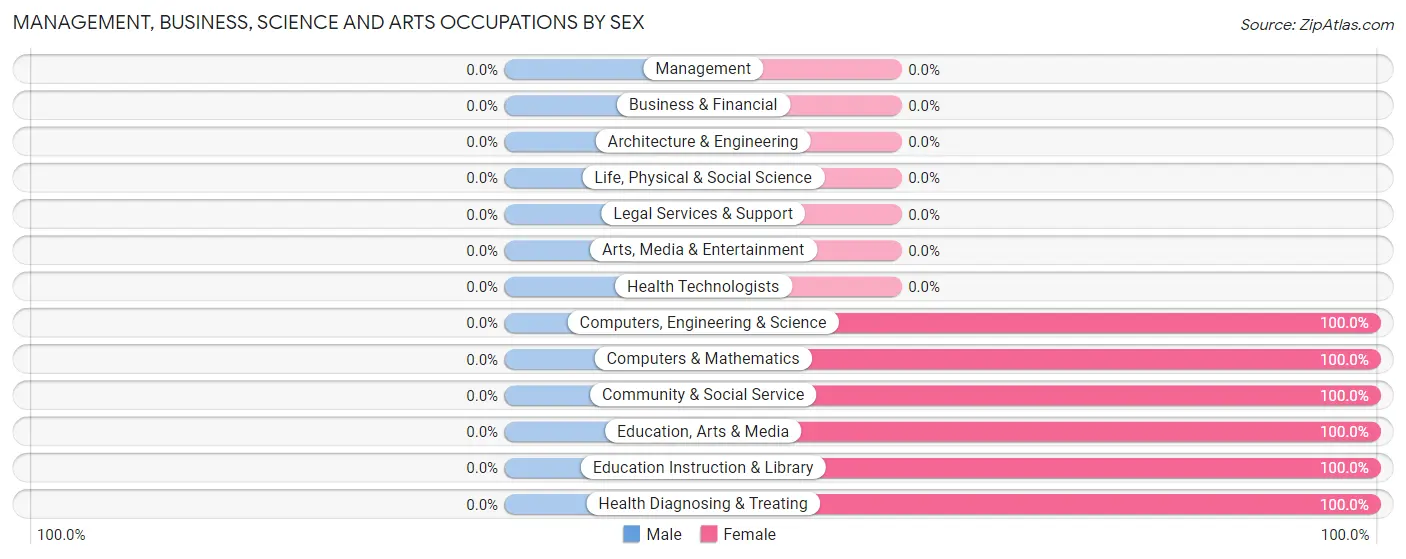
| Occupation | Male | Female |
| Management | 0 (0.0%) | 0 (0.0%) |
| Business & Financial | 0 (0.0%) | 0 (0.0%) |
| Computers, Engineering & Science | 0 (0.0%) | 25 (100.0%) |
| Computers & Mathematics | 0 (0.0%) | 25 (100.0%) |
| Architecture & Engineering | 0 (0.0%) | 0 (0.0%) |
| Life, Physical & Social Science | 0 (0.0%) | 0 (0.0%) |
| Community & Social Service | 0 (0.0%) | 22 (100.0%) |
| Education, Arts & Media | 0 (0.0%) | 11 (100.0%) |
| Legal Services & Support | 0 (0.0%) | 0 (0.0%) |
| Education Instruction & Library | 0 (0.0%) | 11 (100.0%) |
| Arts, Media & Entertainment | 0 (0.0%) | 0 (0.0%) |
| Health Diagnosing & Treating | 0 (0.0%) | 6 (100.0%) |
| Health Technologists | 0 (0.0%) | 0 (0.0%) |
| Total (Category) | 0 (0.0%) | 53 (100.0%) |
| Total (Overall) | 51 (45.1%) | 62 (54.9%) |
Services Occupations
The most common Services occupations in Waterford are , and Healthcare Support (9 | 8.0%).
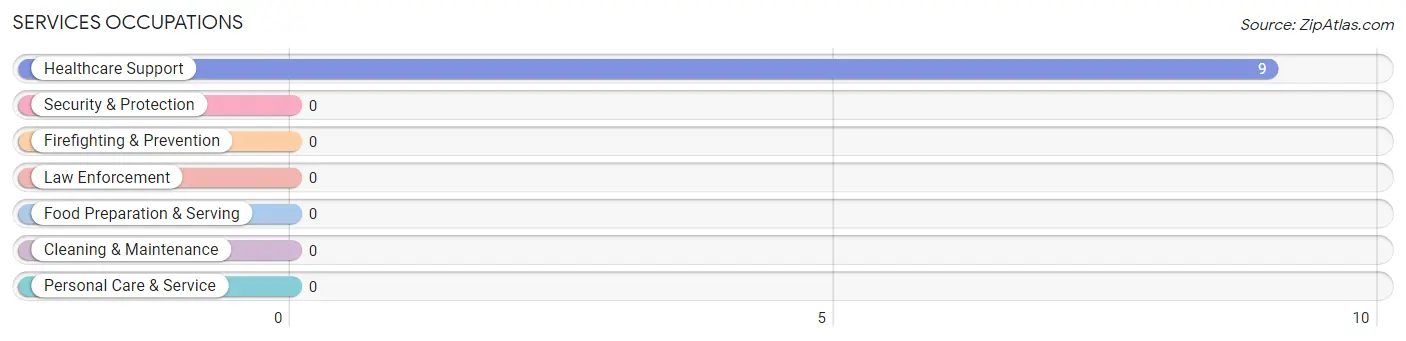
Services Occupations by Sex
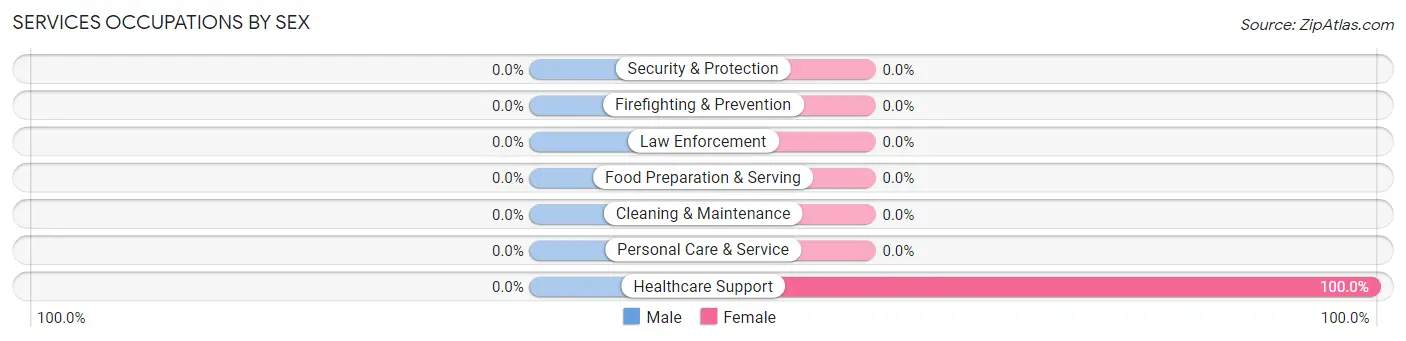
| Occupation | Male | Female |
| Healthcare Support | 0 (0.0%) | 9 (100.0%) |
| Security & Protection | 0 (0.0%) | 0 (0.0%) |
| Firefighting & Prevention | 0 (0.0%) | 0 (0.0%) |
| Law Enforcement | 0 (0.0%) | 0 (0.0%) |
| Food Preparation & Serving | 0 (0.0%) | 0 (0.0%) |
| Cleaning & Maintenance | 0 (0.0%) | 0 (0.0%) |
| Personal Care & Service | 0 (0.0%) | 0 (0.0%) |
| Total (Category) | 0 (0.0%) | 9 (100.0%) |
| Total (Overall) | 51 (45.1%) | 62 (54.9%) |
Sales and Office Occupations
The most common Sales and Office occupations in Waterford are , and Sales & Related (10 | 8.8%).
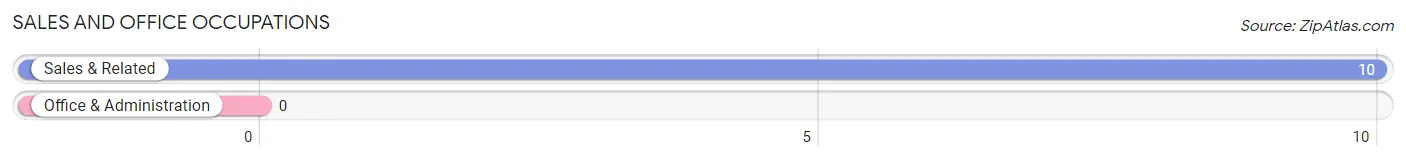
Sales and Office Occupations by Sex

| Occupation | Male | Female |
| Sales & Related | 10 (100.0%) | 0 (0.0%) |
| Office & Administration | 0 (0.0%) | 0 (0.0%) |
| Total (Category) | 10 (100.0%) | 0 (0.0%) |
| Total (Overall) | 51 (45.1%) | 62 (54.9%) |
Natural Resources, Construction and Maintenance Occupations
Natural Resources, Construction and Maintenance Occupations by Sex
| Occupation | Male | Female |
| Farming, Fishing & Forestry | 0 (0.0%) | 0 (0.0%) |
| Construction & Extraction | 0 (0.0%) | 0 (0.0%) |
| Installation, Maintenance & Repair | 0 (0.0%) | 0 (0.0%) |
| Total (Category) | 0 (0.0%) | 0 (0.0%) |
| Total (Overall) | 51 (45.1%) | 62 (54.9%) |
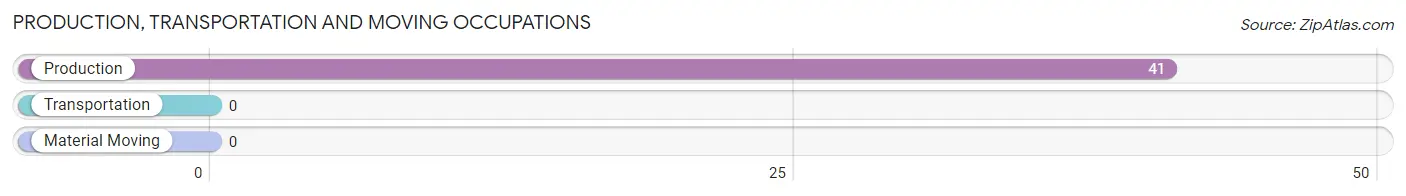
Production, Transportation and Moving Occupations
The most common Production, Transportation and Moving occupations in Waterford are , and Production (41 | 36.3%).
Production, Transportation and Moving Occupations by Sex
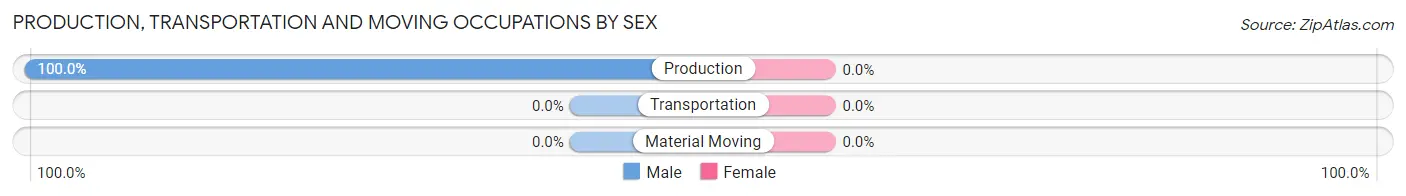
| Occupation | Male | Female |
| Production | 41 (100.0%) | 0 (0.0%) |
| Transportation | 0 (0.0%) | 0 (0.0%) |
| Material Moving | 0 (0.0%) | 0 (0.0%) |
| Total (Category) | 41 (100.0%) | 0 (0.0%) |
| Total (Overall) | 51 (45.1%) | 62 (54.9%) |
Employment Industries by Sex in Waterford
Employment Industries in Waterford
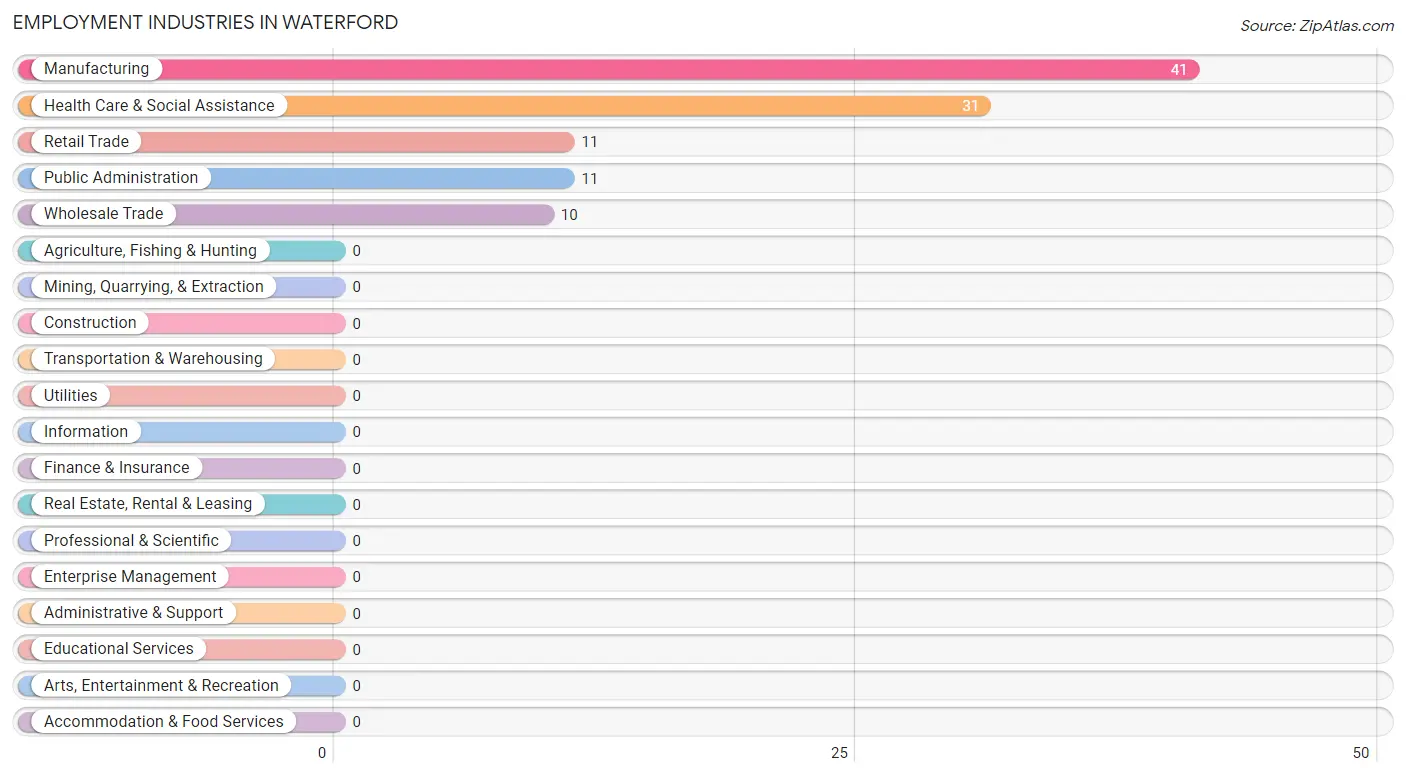
The major employment industries in Waterford include Manufacturing (41 | 36.3%), Health Care & Social Assistance (31 | 27.4%), Retail Trade (11 | 9.7%), Public Administration (11 | 9.7%), and Wholesale Trade (10 | 8.8%).
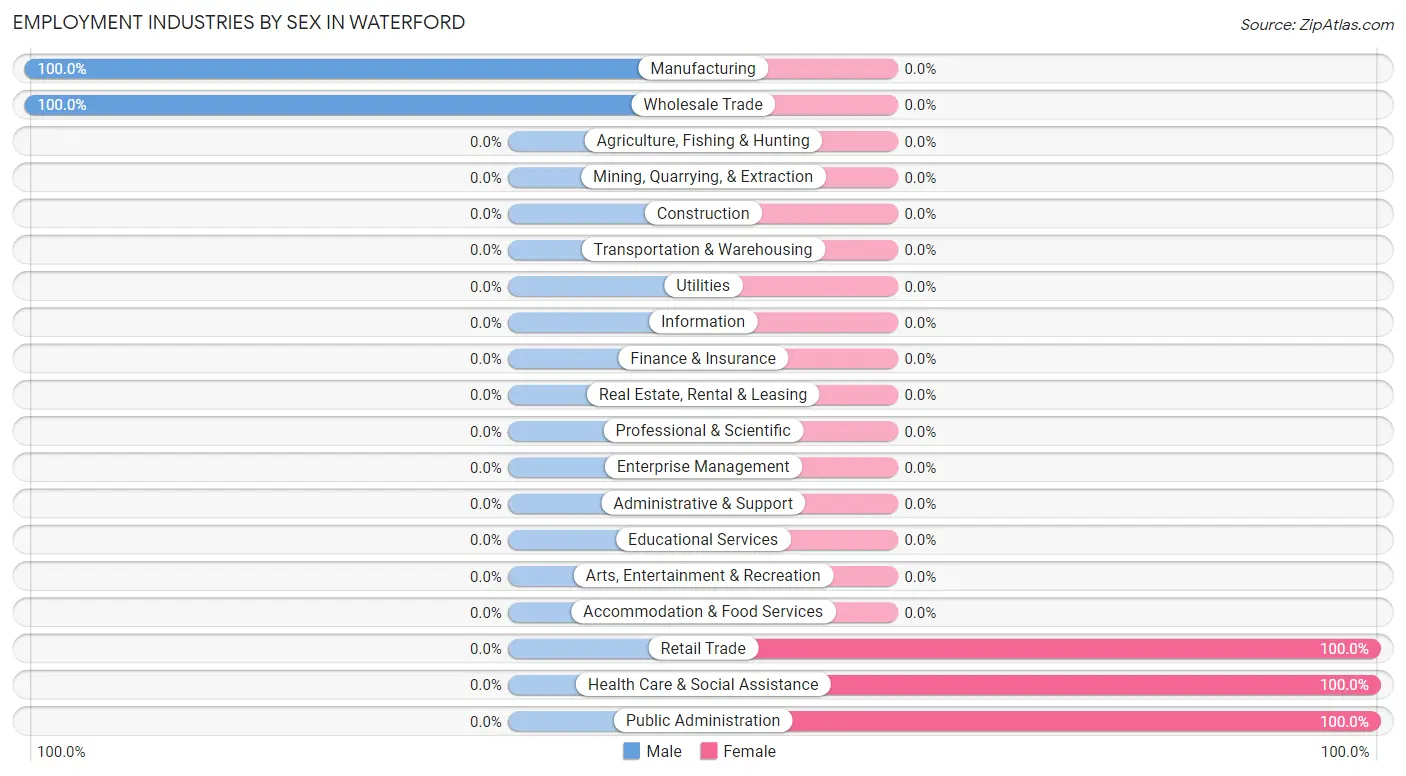
Employment Industries by Sex in Waterford
The Waterford industries that see more men than women are Manufacturing (100.0%), and Wholesale Trade (100.0%), whereas the industries that tend to have a higher number of women are Retail Trade (100.0%), Health Care & Social Assistance (100.0%), and Public Administration (100.0%).
| Industry | Male | Female |
| Agriculture, Fishing & Hunting | 0 (0.0%) | 0 (0.0%) |
| Mining, Quarrying, & Extraction | 0 (0.0%) | 0 (0.0%) |
| Construction | 0 (0.0%) | 0 (0.0%) |
| Manufacturing | 41 (100.0%) | 0 (0.0%) |
| Wholesale Trade | 10 (100.0%) | 0 (0.0%) |
| Retail Trade | 0 (0.0%) | 11 (100.0%) |
| Transportation & Warehousing | 0 (0.0%) | 0 (0.0%) |
| Utilities | 0 (0.0%) | 0 (0.0%) |
| Information | 0 (0.0%) | 0 (0.0%) |
| Finance & Insurance | 0 (0.0%) | 0 (0.0%) |
| Real Estate, Rental & Leasing | 0 (0.0%) | 0 (0.0%) |
| Professional & Scientific | 0 (0.0%) | 0 (0.0%) |
| Enterprise Management | 0 (0.0%) | 0 (0.0%) |
| Administrative & Support | 0 (0.0%) | 0 (0.0%) |
| Educational Services | 0 (0.0%) | 0 (0.0%) |
| Health Care & Social Assistance | 0 (0.0%) | 31 (100.0%) |
| Arts, Entertainment & Recreation | 0 (0.0%) | 0 (0.0%) |
| Accommodation & Food Services | 0 (0.0%) | 0 (0.0%) |
| Public Administration | 0 (0.0%) | 11 (100.0%) |
| Total | 51 (45.1%) | 62 (54.9%) |
Education in Waterford
School Enrollment in Waterford
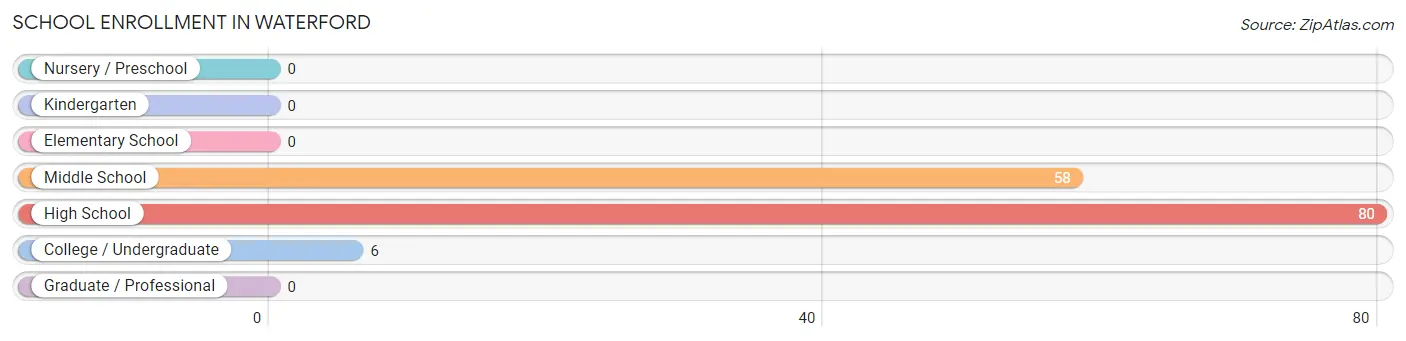
The most common levels of schooling among the 144 students in Waterford are high school (80 | 55.6%), middle school (58 | 40.3%), and college / undergraduate (6 | 4.2%).
| School Level | # Students | % Students |
| Nursery / Preschool | 0 | 0.0% |
| Kindergarten | 0 | 0.0% |
| Elementary School | 0 | 0.0% |
| Middle School | 58 | 40.3% |
| High School | 80 | 55.6% |
| College / Undergraduate | 6 | 4.2% |
| Graduate / Professional | 0 | 0.0% |
| Total | 144 | 100.0% |
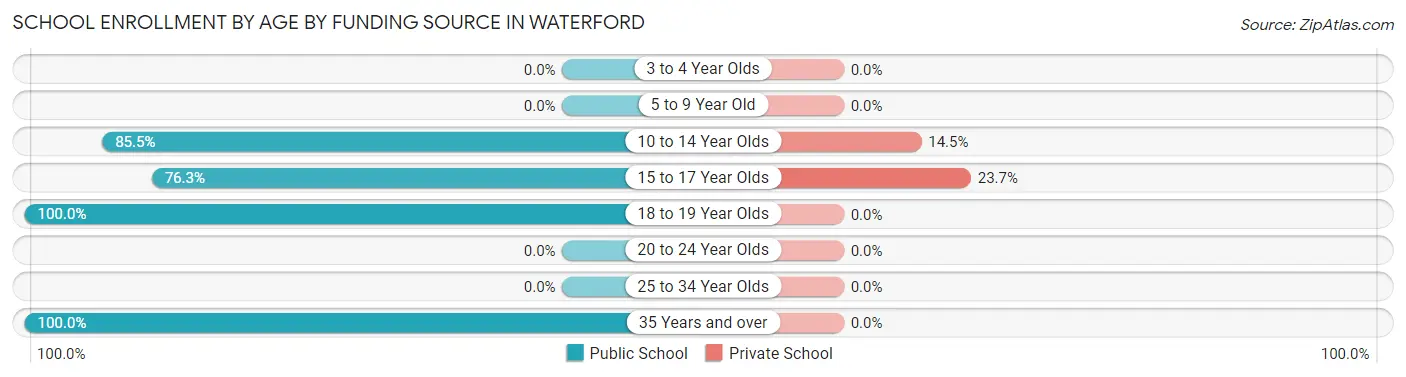
School Enrollment by Age by Funding Source in Waterford
Out of a total of 144 students who are enrolled in schools in Waterford, 21 (14.6%) attend a private institution, while the remaining 123 (85.4%) are enrolled in public schools. The age group of 15 to 17 year olds has the highest likelihood of being enrolled in private schools, with 9 (23.7% in the age bracket) enrolled. Conversely, the age group of 18 to 19 year olds has the lowest likelihood of being enrolled in a private school, with 17 (100.0% in the age bracket) attending a public institution.
| Age Bracket | Public School | Private School |
| 3 to 4 Year Olds | 0 (0.0%) | 0 (0.0%) |
| 5 to 9 Year Old | 0 (0.0%) | 0 (0.0%) |
| 10 to 14 Year Olds | 71 (85.5%) | 12 (14.5%) |
| 15 to 17 Year Olds | 29 (76.3%) | 9 (23.7%) |
| 18 to 19 Year Olds | 17 (100.0%) | 0 (0.0%) |
| 20 to 24 Year Olds | 0 (0.0%) | 0 (0.0%) |
| 25 to 34 Year Olds | 0 (0.0%) | 0 (0.0%) |
| 35 Years and over | 6 (100.0%) | 0 (0.0%) |
| Total | 123 (85.4%) | 21 (14.6%) |
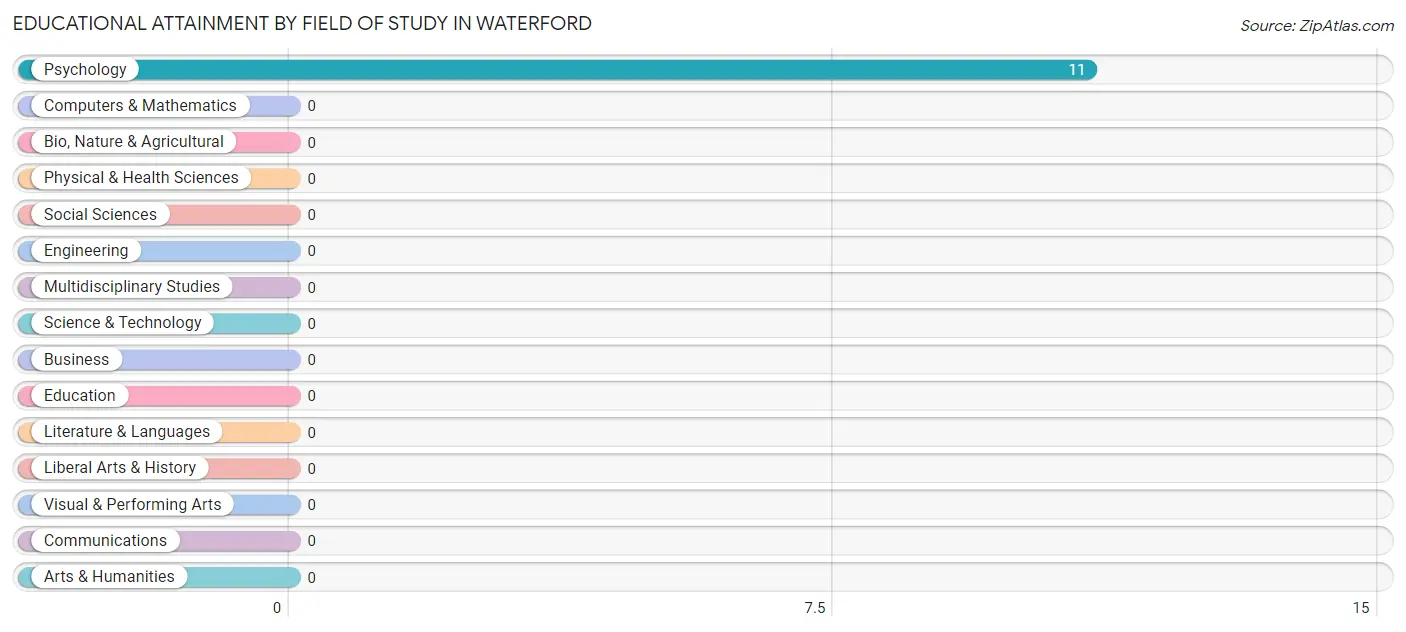
Educational Attainment by Field of Study in Waterford
, and psychology (11 | 100.0%) are the most common fields of study among 11 individuals in Waterford who have obtained a bachelor's degree or higher.
| Field of Study | # Graduates | % Graduates |
| Computers & Mathematics | 0 | 0.0% |
| Bio, Nature & Agricultural | 0 | 0.0% |
| Physical & Health Sciences | 0 | 0.0% |
| Psychology | 11 | 100.0% |
| Social Sciences | 0 | 0.0% |
| Engineering | 0 | 0.0% |
| Multidisciplinary Studies | 0 | 0.0% |
| Science & Technology | 0 | 0.0% |
| Business | 0 | 0.0% |
| Education | 0 | 0.0% |
| Literature & Languages | 0 | 0.0% |
| Liberal Arts & History | 0 | 0.0% |
| Visual & Performing Arts | 0 | 0.0% |
| Communications | 0 | 0.0% |
| Arts & Humanities | 0 | 0.0% |
| Total | 11 | 100.0% |
Transportation & Commute in Waterford
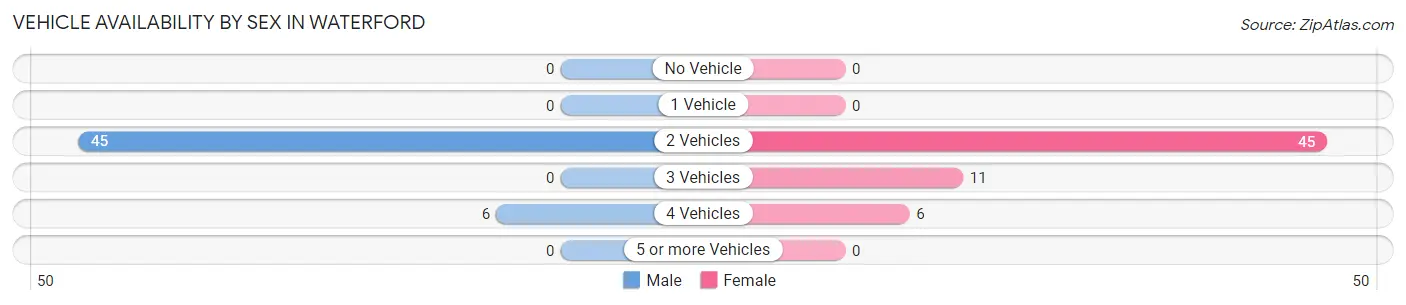
Vehicle Availability by Sex in Waterford
The most prevalent vehicle ownership categories in Waterford are males with 2 vehicles (45, accounting for 88.2%) and females with 2 vehicles (45, making up 72.6%).
| Vehicles Available | Male | Female |
| No Vehicle | 0 (0.0%) | 0 (0.0%) |
| 1 Vehicle | 0 (0.0%) | 0 (0.0%) |
| 2 Vehicles | 45 (88.2%) | 45 (72.6%) |
| 3 Vehicles | 0 (0.0%) | 11 (17.7%) |
| 4 Vehicles | 6 (11.8%) | 6 (9.7%) |
| 5 or more Vehicles | 0 (0.0%) | 0 (0.0%) |
| Total | 51 (100.0%) | 62 (100.0%) |
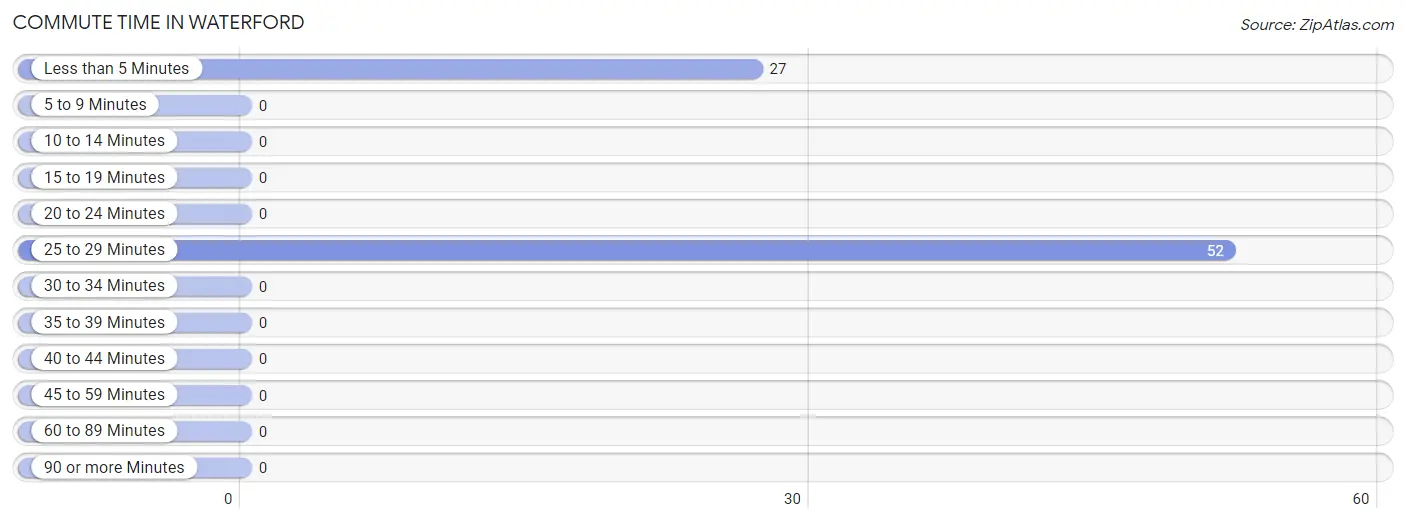
Commute Time in Waterford
The most frequently occuring commute durations in Waterford are 25 to 29 minutes (52 commuters, 65.8%), less than 5 minutes (27 commuters, 34.2%), and 5 to 9 minutes (0 commuters, 0.0%).
| Commute Time | # Commuters | % Commuters |
| Less than 5 Minutes | 27 | 34.2% |
| 5 to 9 Minutes | 0 | 0.0% |
| 10 to 14 Minutes | 0 | 0.0% |
| 15 to 19 Minutes | 0 | 0.0% |
| 20 to 24 Minutes | 0 | 0.0% |
| 25 to 29 Minutes | 52 | 65.8% |
| 30 to 34 Minutes | 0 | 0.0% |
| 35 to 39 Minutes | 0 | 0.0% |
| 40 to 44 Minutes | 0 | 0.0% |
| 45 to 59 Minutes | 0 | 0.0% |
| 60 to 89 Minutes | 0 | 0.0% |
| 90 or more Minutes | 0 | 0.0% |
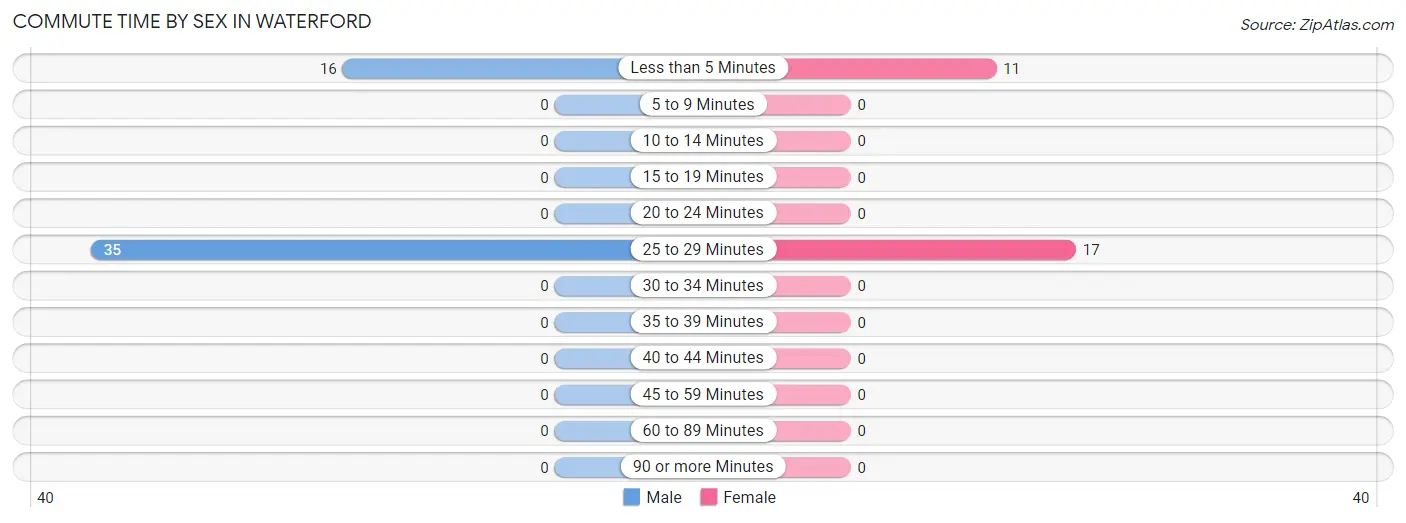
Commute Time by Sex in Waterford
The most common commute times in Waterford are 25 to 29 minutes (35 commuters, 68.6%) for males and 25 to 29 minutes (17 commuters, 60.7%) for females.
| Commute Time | Male | Female |
| Less than 5 Minutes | 16 (31.4%) | 11 (39.3%) |
| 5 to 9 Minutes | 0 (0.0%) | 0 (0.0%) |
| 10 to 14 Minutes | 0 (0.0%) | 0 (0.0%) |
| 15 to 19 Minutes | 0 (0.0%) | 0 (0.0%) |
| 20 to 24 Minutes | 0 (0.0%) | 0 (0.0%) |
| 25 to 29 Minutes | 35 (68.6%) | 17 (60.7%) |
| 30 to 34 Minutes | 0 (0.0%) | 0 (0.0%) |
| 35 to 39 Minutes | 0 (0.0%) | 0 (0.0%) |
| 40 to 44 Minutes | 0 (0.0%) | 0 (0.0%) |
| 45 to 59 Minutes | 0 (0.0%) | 0 (0.0%) |
| 60 to 89 Minutes | 0 (0.0%) | 0 (0.0%) |
| 90 or more Minutes | 0 (0.0%) | 0 (0.0%) |
Time of Departure to Work by Sex in Waterford
The most frequent times of departure to work in Waterford are 4:00 PM to 11:59 PM (35, 68.6%) for males and 7:00 AM to 7:29 AM (17, 60.7%) for females.
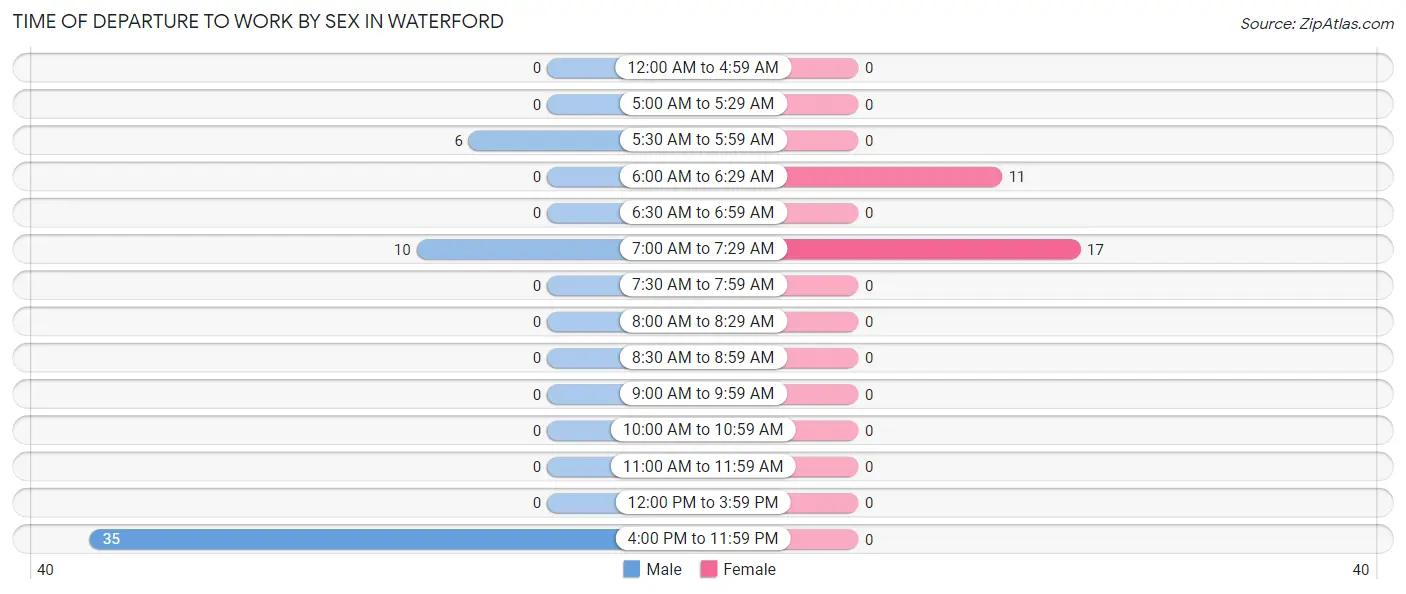
| Time of Departure | Male | Female |
| 12:00 AM to 4:59 AM | 0 (0.0%) | 0 (0.0%) |
| 5:00 AM to 5:29 AM | 0 (0.0%) | 0 (0.0%) |
| 5:30 AM to 5:59 AM | 6 (11.8%) | 0 (0.0%) |
| 6:00 AM to 6:29 AM | 0 (0.0%) | 11 (39.3%) |
| 6:30 AM to 6:59 AM | 0 (0.0%) | 0 (0.0%) |
| 7:00 AM to 7:29 AM | 10 (19.6%) | 17 (60.7%) |
| 7:30 AM to 7:59 AM | 0 (0.0%) | 0 (0.0%) |
| 8:00 AM to 8:29 AM | 0 (0.0%) | 0 (0.0%) |
| 8:30 AM to 8:59 AM | 0 (0.0%) | 0 (0.0%) |
| 9:00 AM to 9:59 AM | 0 (0.0%) | 0 (0.0%) |
| 10:00 AM to 10:59 AM | 0 (0.0%) | 0 (0.0%) |
| 11:00 AM to 11:59 AM | 0 (0.0%) | 0 (0.0%) |
| 12:00 PM to 3:59 PM | 0 (0.0%) | 0 (0.0%) |
| 4:00 PM to 11:59 PM | 35 (68.6%) | 0 (0.0%) |
| Total | 51 (100.0%) | 28 (100.0%) |
Housing Occupancy in Waterford
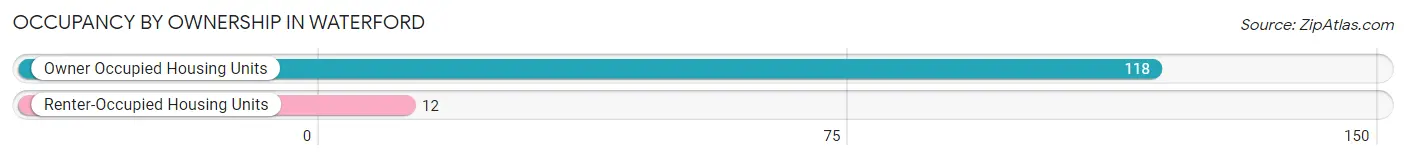
Occupancy by Ownership in Waterford
Of the total 130 dwellings in Waterford, owner-occupied units account for 118 (90.8%), while renter-occupied units make up 12 (9.2%).
| Occupancy | # Housing Units | % Housing Units |
| Owner Occupied Housing Units | 118 | 90.8% |
| Renter-Occupied Housing Units | 12 | 9.2% |
| Total Occupied Housing Units | 130 | 100.0% |
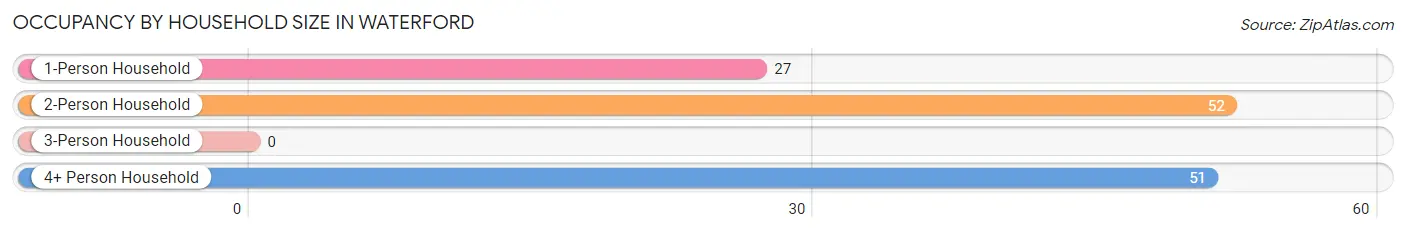
Occupancy by Household Size in Waterford
| Household Size | # Housing Units | % Housing Units |
| 1-Person Household | 27 | 20.8% |
| 2-Person Household | 52 | 40.0% |
| 3-Person Household | 0 | 0.0% |
| 4+ Person Household | 51 | 39.2% |
| Total Housing Units | 130 | 100.0% |
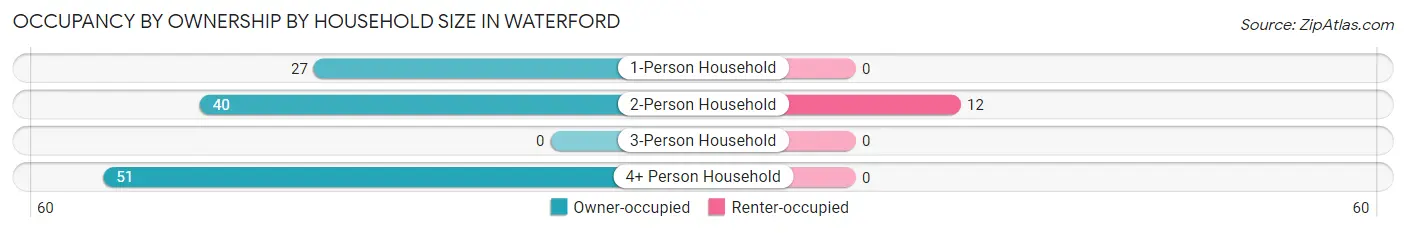
Occupancy by Ownership by Household Size in Waterford
| Household Size | Owner-occupied | Renter-occupied |
| 1-Person Household | 27 (100.0%) | 0 (0.0%) |
| 2-Person Household | 40 (76.9%) | 12 (23.1%) |
| 3-Person Household | 0 (0.0%) | 0 (0.0%) |
| 4+ Person Household | 51 (100.0%) | 0 (0.0%) |
| Total Housing Units | 118 (90.8%) | 12 (9.2%) |
Occupancy by Educational Attainment in Waterford
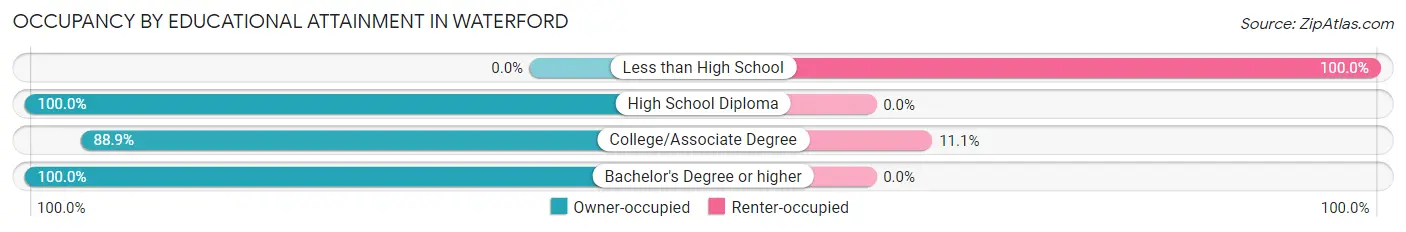
| Household Size | Owner-occupied | Renter-occupied |
| Less than High School | 0 (0.0%) | 7 (100.0%) |
| High School Diploma | 67 (100.0%) | 0 (0.0%) |
| College/Associate Degree | 40 (88.9%) | 5 (11.1%) |
| Bachelor's Degree or higher | 11 (100.0%) | 0 (0.0%) |
Occupancy by Age of Householder in Waterford
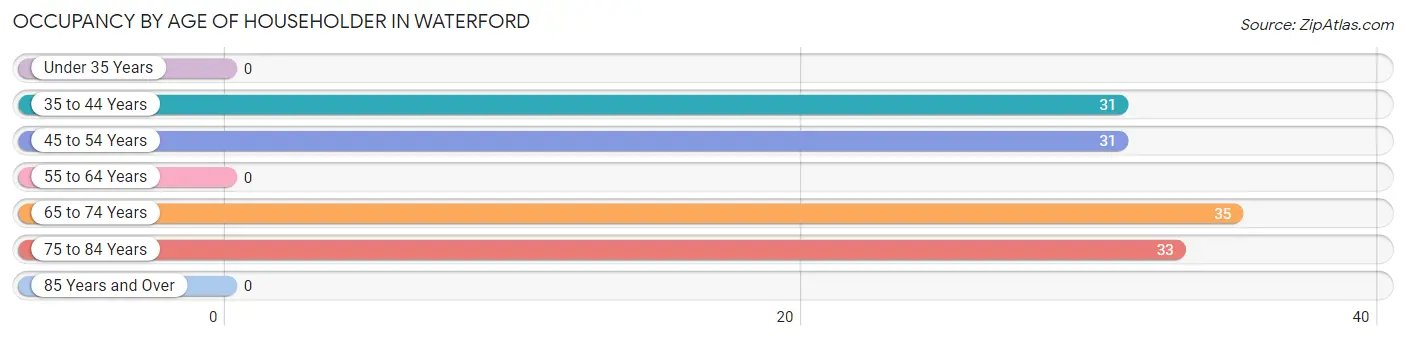
| Age Bracket | # Households | % Households |
| Under 35 Years | 0 | 0.0% |
| 35 to 44 Years | 31 | 23.8% |
| 45 to 54 Years | 31 | 23.8% |
| 55 to 64 Years | 0 | 0.0% |
| 65 to 74 Years | 35 | 26.9% |
| 75 to 84 Years | 33 | 25.4% |
| 85 Years and Over | 0 | 0.0% |
| Total | 130 | 100.0% |
Housing Finances in Waterford
Median Income by Occupancy in Waterford
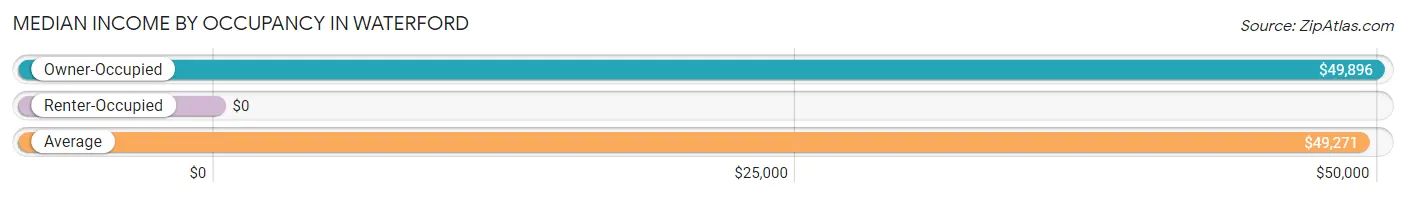
| Occupancy Type | # Households | Median Income |
| Owner-Occupied | 118 (90.8%) | $49,896 |
| Renter-Occupied | 12 (9.2%) | $0 |
| Average | 130 (100.0%) | $49,271 |
Occupancy by Householder Income Bracket in Waterford
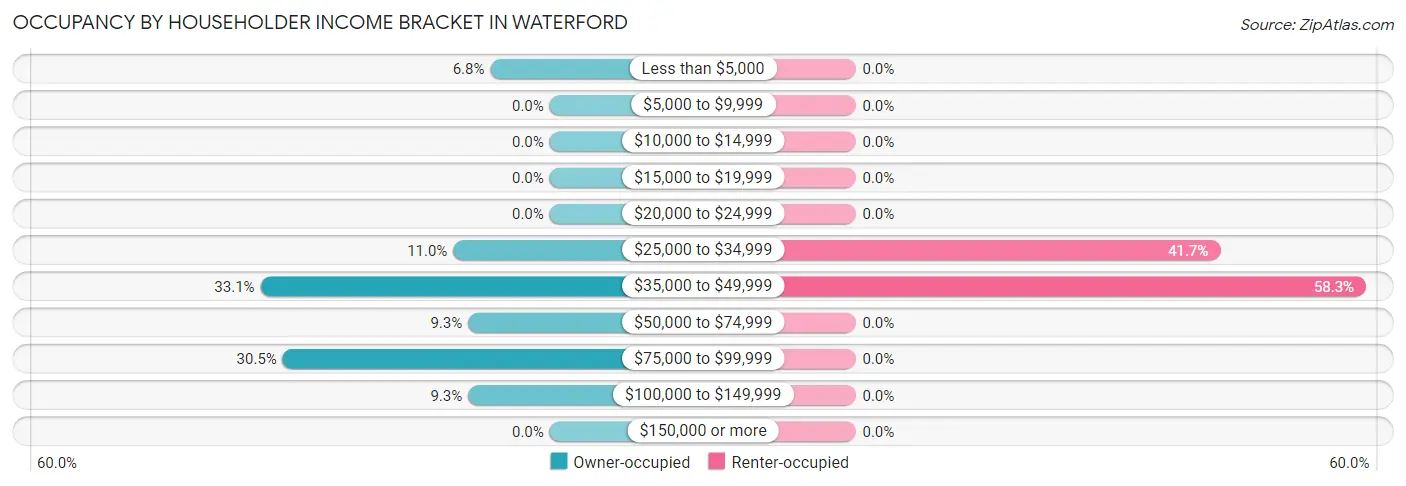
| Income Bracket | Owner-occupied | Renter-occupied |
| Less than $5,000 | 8 (6.8%) | 0 (0.0%) |
| $5,000 to $9,999 | 0 (0.0%) | 0 (0.0%) |
| $10,000 to $14,999 | 0 (0.0%) | 0 (0.0%) |
| $15,000 to $19,999 | 0 (0.0%) | 0 (0.0%) |
| $20,000 to $24,999 | 0 (0.0%) | 0 (0.0%) |
| $25,000 to $34,999 | 13 (11.0%) | 5 (41.7%) |
| $35,000 to $49,999 | 39 (33.1%) | 7 (58.3%) |
| $50,000 to $74,999 | 11 (9.3%) | 0 (0.0%) |
| $75,000 to $99,999 | 36 (30.5%) | 0 (0.0%) |
| $100,000 to $149,999 | 11 (9.3%) | 0 (0.0%) |
| $150,000 or more | 0 (0.0%) | 0 (0.0%) |
| Total | 118 (100.0%) | 12 (100.0%) |
Monthly Housing Cost Tiers in Waterford
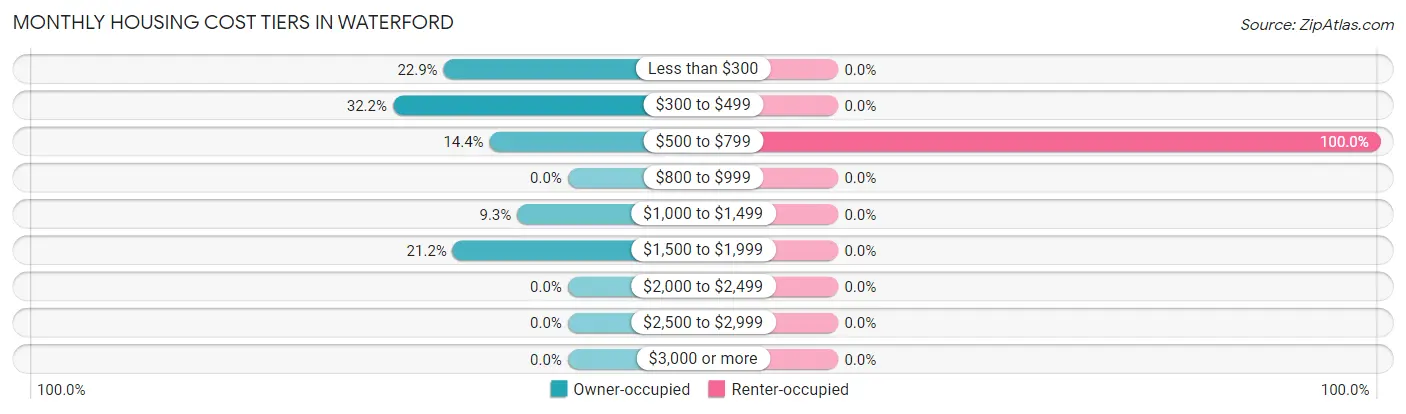
| Monthly Cost | Owner-occupied | Renter-occupied |
| Less than $300 | 27 (22.9%) | 0 (0.0%) |
| $300 to $499 | 38 (32.2%) | 0 (0.0%) |
| $500 to $799 | 17 (14.4%) | 12 (100.0%) |
| $800 to $999 | 0 (0.0%) | 0 (0.0%) |
| $1,000 to $1,499 | 11 (9.3%) | 0 (0.0%) |
| $1,500 to $1,999 | 25 (21.2%) | 0 (0.0%) |
| $2,000 to $2,499 | 0 (0.0%) | 0 (0.0%) |
| $2,500 to $2,999 | 0 (0.0%) | 0 (0.0%) |
| $3,000 or more | 0 (0.0%) | 0 (0.0%) |
| Total | 118 (100.0%) | 12 (100.0%) |
Physical Housing Characteristics in Waterford
Housing Structures in Waterford
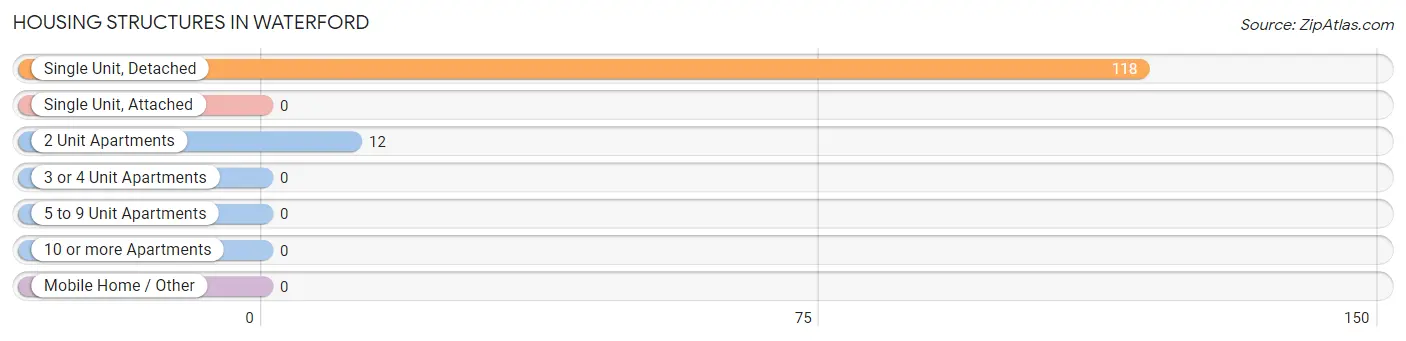
| Structure Type | # Housing Units | % Housing Units |
| Single Unit, Detached | 118 | 90.8% |
| Single Unit, Attached | 0 | 0.0% |
| 2 Unit Apartments | 12 | 9.2% |
| 3 or 4 Unit Apartments | 0 | 0.0% |
| 5 to 9 Unit Apartments | 0 | 0.0% |
| 10 or more Apartments | 0 | 0.0% |
| Mobile Home / Other | 0 | 0.0% |
| Total | 130 | 100.0% |
Housing Structures by Occupancy in Waterford
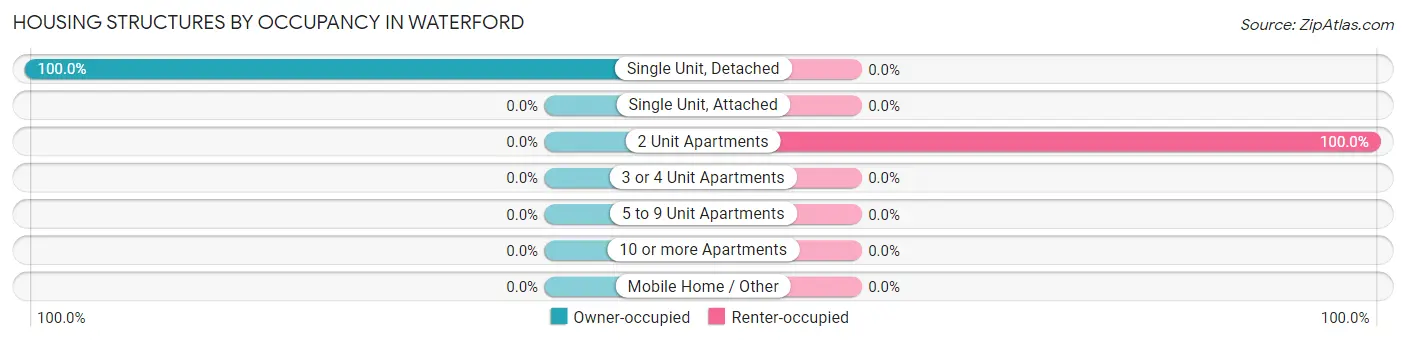
| Structure Type | Owner-occupied | Renter-occupied |
| Single Unit, Detached | 118 (100.0%) | 0 (0.0%) |
| Single Unit, Attached | 0 (0.0%) | 0 (0.0%) |
| 2 Unit Apartments | 0 (0.0%) | 12 (100.0%) |
| 3 or 4 Unit Apartments | 0 (0.0%) | 0 (0.0%) |
| 5 to 9 Unit Apartments | 0 (0.0%) | 0 (0.0%) |
| 10 or more Apartments | 0 (0.0%) | 0 (0.0%) |
| Mobile Home / Other | 0 (0.0%) | 0 (0.0%) |
| Total | 118 (90.8%) | 12 (9.2%) |
Housing Structures by Number of Rooms in Waterford
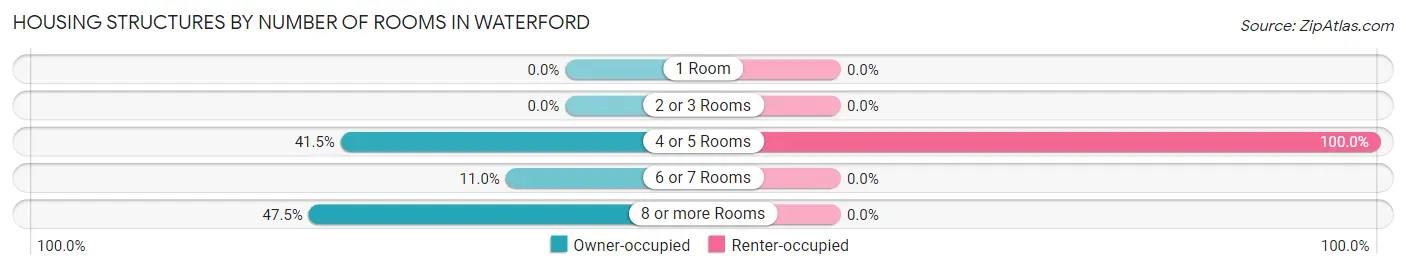
| Number of Rooms | Owner-occupied | Renter-occupied |
| 1 Room | 0 (0.0%) | 0 (0.0%) |
| 2 or 3 Rooms | 0 (0.0%) | 0 (0.0%) |
| 4 or 5 Rooms | 49 (41.5%) | 12 (100.0%) |
| 6 or 7 Rooms | 13 (11.0%) | 0 (0.0%) |
| 8 or more Rooms | 56 (47.5%) | 0 (0.0%) |
| Total | 118 (100.0%) | 12 (100.0%) |
Housing Structure by Heating Type in Waterford
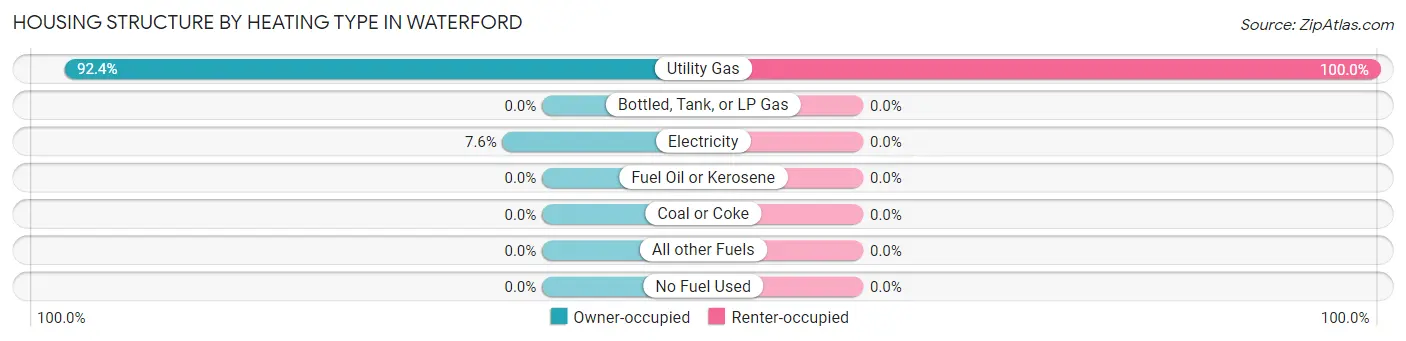
| Heating Type | Owner-occupied | Renter-occupied |
| Utility Gas | 109 (92.4%) | 12 (100.0%) |
| Bottled, Tank, or LP Gas | 0 (0.0%) | 0 (0.0%) |
| Electricity | 9 (7.6%) | 0 (0.0%) |
| Fuel Oil or Kerosene | 0 (0.0%) | 0 (0.0%) |
| Coal or Coke | 0 (0.0%) | 0 (0.0%) |
| All other Fuels | 0 (0.0%) | 0 (0.0%) |
| No Fuel Used | 0 (0.0%) | 0 (0.0%) |
| Total | 118 (100.0%) | 12 (100.0%) |
Household Vehicle Usage in Waterford
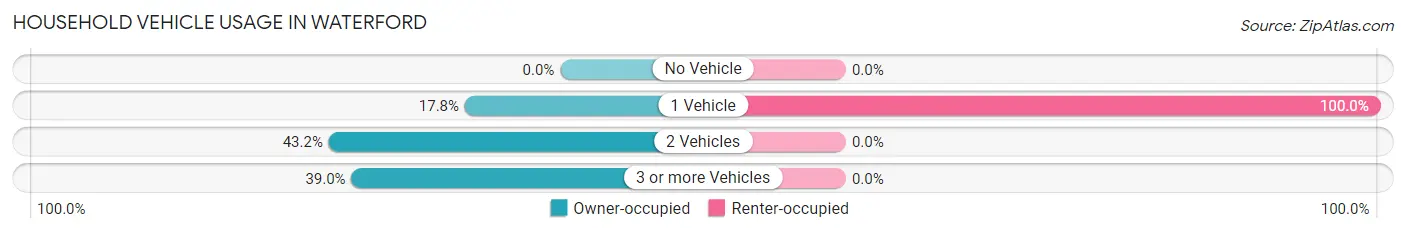
| Vehicles per Household | Owner-occupied | Renter-occupied |
| No Vehicle | 0 (0.0%) | 0 (0.0%) |
| 1 Vehicle | 21 (17.8%) | 12 (100.0%) |
| 2 Vehicles | 51 (43.2%) | 0 (0.0%) |
| 3 or more Vehicles | 46 (39.0%) | 0 (0.0%) |
| Total | 118 (100.0%) | 12 (100.0%) |
Real Estate & Mortgages in Waterford
Real Estate and Mortgage Overview in Waterford
| Characteristic | Without Mortgage | With Mortgage |
| Housing Units | 71 | 47 |
| Median Property Value | $143,500 | $126,500 |
| Median Household Income | $42,361 | $0 |
| Monthly Housing Costs | $347 | $0 |
| Real Estate Taxes | $1,408 | $0 |
Property Value by Mortgage Status in Waterford
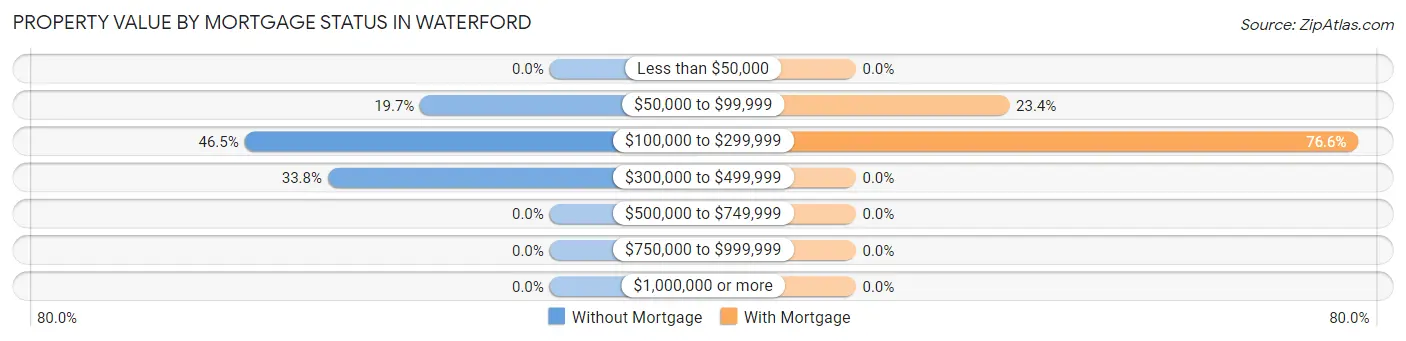
| Property Value | Without Mortgage | With Mortgage |
| Less than $50,000 | 0 (0.0%) | 0 (0.0%) |
| $50,000 to $99,999 | 14 (19.7%) | 11 (23.4%) |
| $100,000 to $299,999 | 33 (46.5%) | 36 (76.6%) |
| $300,000 to $499,999 | 24 (33.8%) | 0 (0.0%) |
| $500,000 to $749,999 | 0 (0.0%) | 0 (0.0%) |
| $750,000 to $999,999 | 0 (0.0%) | 0 (0.0%) |
| $1,000,000 or more | 0 (0.0%) | 0 (0.0%) |
| Total | 71 (100.0%) | 47 (100.0%) |
Household Income by Mortgage Status in Waterford
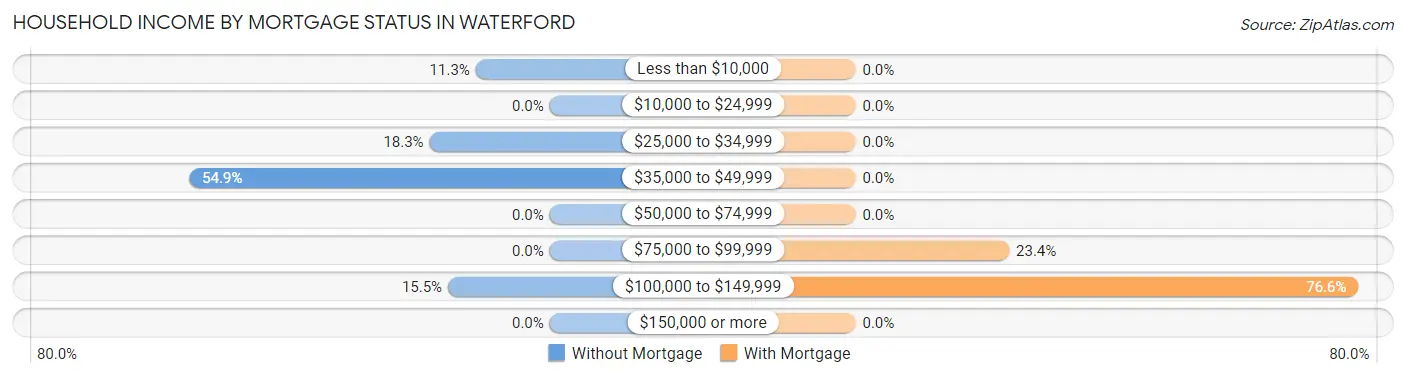
| Household Income | Without Mortgage | With Mortgage |
| Less than $10,000 | 8 (11.3%) | 0 (0.0%) |
| $10,000 to $24,999 | 0 (0.0%) | 0 (0.0%) |
| $25,000 to $34,999 | 13 (18.3%) | 0 (0.0%) |
| $35,000 to $49,999 | 39 (54.9%) | 0 (0.0%) |
| $50,000 to $74,999 | 0 (0.0%) | 0 (0.0%) |
| $75,000 to $99,999 | 0 (0.0%) | 11 (23.4%) |
| $100,000 to $149,999 | 11 (15.5%) | 36 (76.6%) |
| $150,000 or more | 0 (0.0%) | 0 (0.0%) |
| Total | 71 (100.0%) | 47 (100.0%) |
Property Value to Household Income Ratio in Waterford
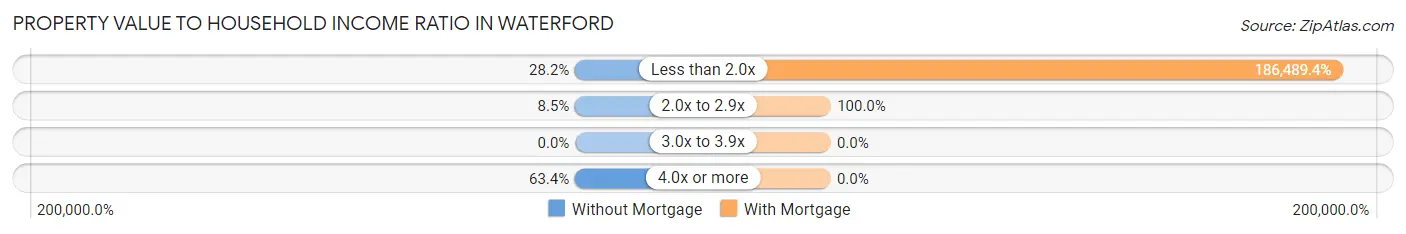
| Value-to-Income Ratio | Without Mortgage | With Mortgage |
| Less than 2.0x | 20 (28.2%) | 87,650 (186,489.4%) |
| 2.0x to 2.9x | 6 (8.5%) | 47 (100.0%) |
| 3.0x to 3.9x | 0 (0.0%) | 0 (0.0%) |
| 4.0x or more | 45 (63.4%) | 0 (0.0%) |
| Total | 71 (100.0%) | 47 (100.0%) |
Real Estate Taxes by Mortgage Status in Waterford
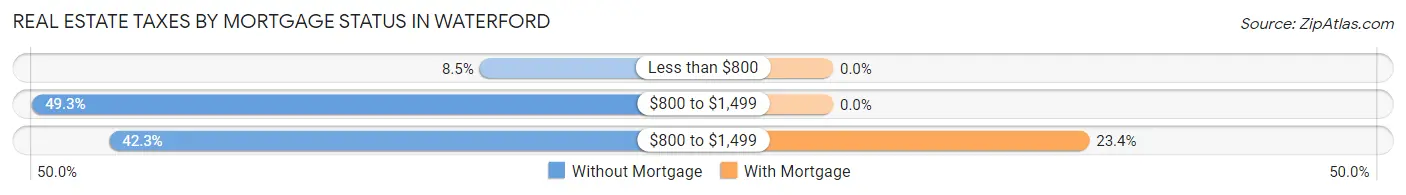
| Property Taxes | Without Mortgage | With Mortgage |
| Less than $800 | 6 (8.5%) | 0 (0.0%) |
| $800 to $1,499 | 35 (49.3%) | 0 (0.0%) |
| $800 to $1,499 | 30 (42.2%) | 11 (23.4%) |
| Total | 71 (100.0%) | 47 (100.0%) |
Health & Disability in Waterford
Health Insurance Coverage by Age in Waterford
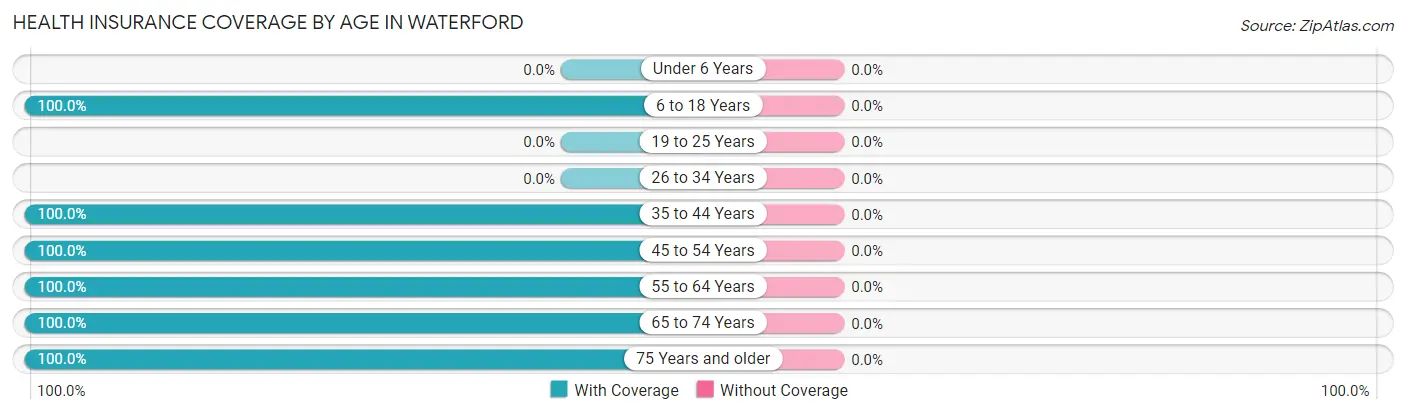
| Age Bracket | With Coverage | Without Coverage |
| Under 6 Years | 0 (0.0%) | 0 (0.0%) |
| 6 to 18 Years | 138 (100.0%) | 0 (0.0%) |
| 19 to 25 Years | 0 (0.0%) | 0 (0.0%) |
| 26 to 34 Years | 0 (0.0%) | 0 (0.0%) |
| 35 to 44 Years | 52 (100.0%) | 0 (0.0%) |
| 45 to 54 Years | 37 (100.0%) | 0 (0.0%) |
| 55 to 64 Years | 35 (100.0%) | 0 (0.0%) |
| 65 to 74 Years | 65 (100.0%) | 0 (0.0%) |
| 75 Years and older | 46 (100.0%) | 0 (0.0%) |
| Total | 373 (100.0%) | 0 (0.0%) |
Health Insurance Coverage by Citizenship Status in Waterford
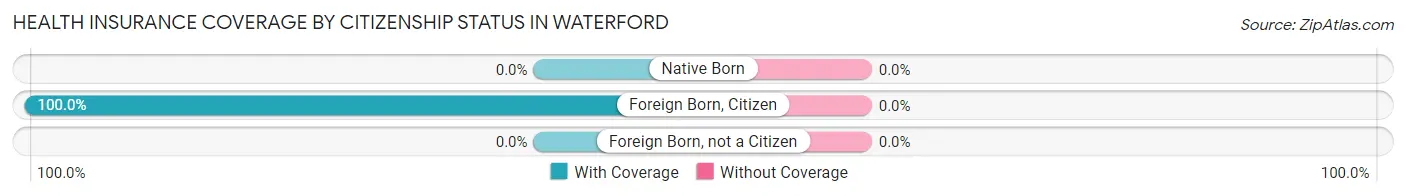
| Citizenship Status | With Coverage | Without Coverage |
| Native Born | 0 (0.0%) | 0 (0.0%) |
| Foreign Born, Citizen | 138 (100.0%) | 0 (0.0%) |
| Foreign Born, not a Citizen | 0 (0.0%) | 0 (0.0%) |
Health Insurance Coverage by Household Income in Waterford
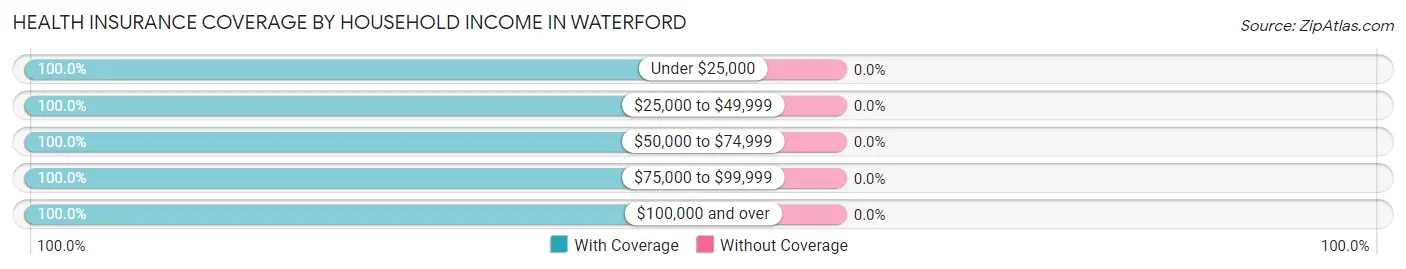
| Household Income | With Coverage | Without Coverage |
| Under $25,000 | 8 (100.0%) | 0 (0.0%) |
| $25,000 to $49,999 | 128 (100.0%) | 0 (0.0%) |
| $50,000 to $74,999 | 41 (100.0%) | 0 (0.0%) |
| $75,000 to $99,999 | 161 (100.0%) | 0 (0.0%) |
| $100,000 and over | 35 (100.0%) | 0 (0.0%) |
Public vs Private Health Insurance Coverage by Age in Waterford
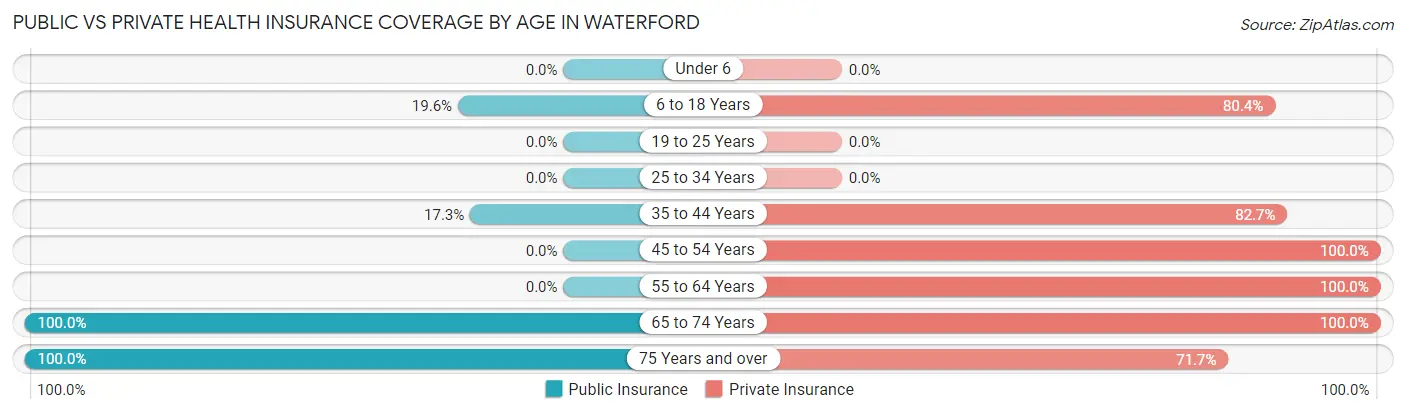
| Age Bracket | Public Insurance | Private Insurance |
| Under 6 | 0 (0.0%) | 0 (0.0%) |
| 6 to 18 Years | 27 (19.6%) | 111 (80.4%) |
| 19 to 25 Years | 0 (0.0%) | 0 (0.0%) |
| 25 to 34 Years | 0 (0.0%) | 0 (0.0%) |
| 35 to 44 Years | 9 (17.3%) | 43 (82.7%) |
| 45 to 54 Years | 0 (0.0%) | 37 (100.0%) |
| 55 to 64 Years | 0 (0.0%) | 35 (100.0%) |
| 65 to 74 Years | 65 (100.0%) | 65 (100.0%) |
| 75 Years and over | 46 (100.0%) | 33 (71.7%) |
| Total | 147 (39.4%) | 324 (86.9%) |
Disability Status by Sex by Age in Waterford
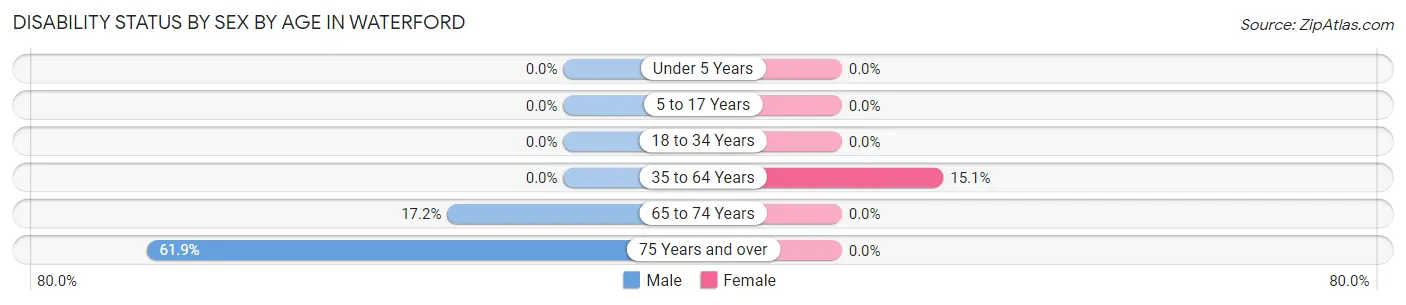
| Age Bracket | Male | Female |
| Under 5 Years | 0 (0.0%) | 0 (0.0%) |
| 5 to 17 Years | 0 (0.0%) | 0 (0.0%) |
| 18 to 34 Years | 0 (0.0%) | 0 (0.0%) |
| 35 to 64 Years | 0 (0.0%) | 11 (15.1%) |
| 65 to 74 Years | 5 (17.2%) | 0 (0.0%) |
| 75 Years and over | 13 (61.9%) | 0 (0.0%) |
Disability Class by Sex by Age in Waterford
Disability Class: Hearing Difficulty
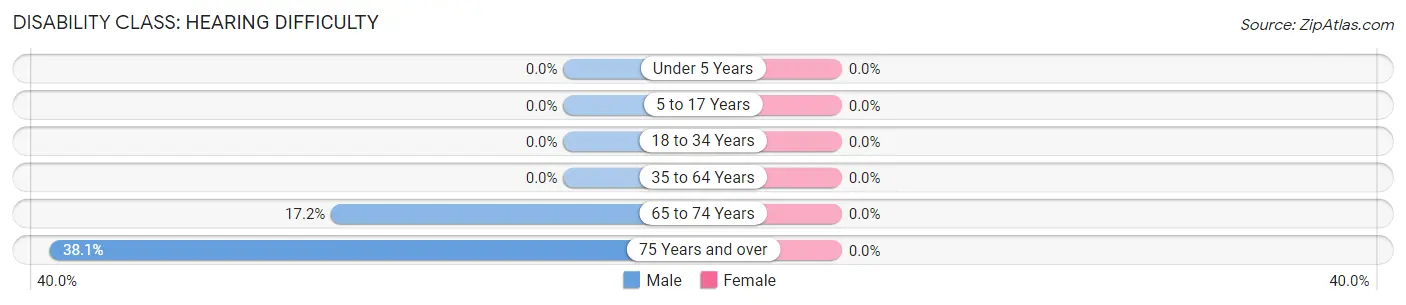
| Age Bracket | Male | Female |
| Under 5 Years | 0 (0.0%) | 0 (0.0%) |
| 5 to 17 Years | 0 (0.0%) | 0 (0.0%) |
| 18 to 34 Years | 0 (0.0%) | 0 (0.0%) |
| 35 to 64 Years | 0 (0.0%) | 0 (0.0%) |
| 65 to 74 Years | 5 (17.2%) | 0 (0.0%) |
| 75 Years and over | 8 (38.1%) | 0 (0.0%) |
Disability Class: Vision Difficulty
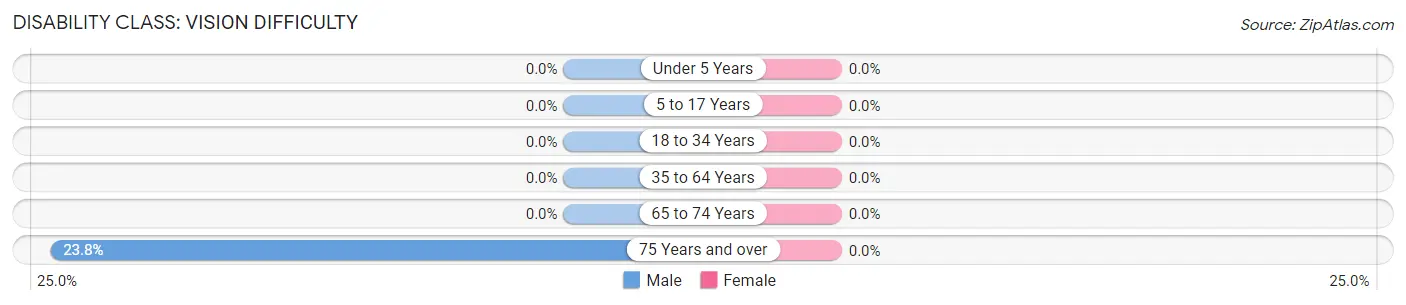
| Age Bracket | Male | Female |
| Under 5 Years | 0 (0.0%) | 0 (0.0%) |
| 5 to 17 Years | 0 (0.0%) | 0 (0.0%) |
| 18 to 34 Years | 0 (0.0%) | 0 (0.0%) |
| 35 to 64 Years | 0 (0.0%) | 0 (0.0%) |
| 65 to 74 Years | 0 (0.0%) | 0 (0.0%) |
| 75 Years and over | 5 (23.8%) | 0 (0.0%) |
Disability Class: Cognitive Difficulty
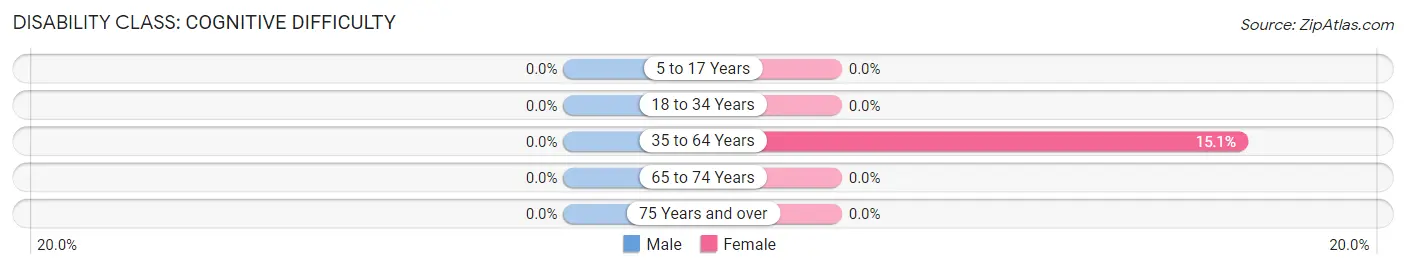
| Age Bracket | Male | Female |
| 5 to 17 Years | 0 (0.0%) | 0 (0.0%) |
| 18 to 34 Years | 0 (0.0%) | 0 (0.0%) |
| 35 to 64 Years | 0 (0.0%) | 11 (15.1%) |
| 65 to 74 Years | 0 (0.0%) | 0 (0.0%) |
| 75 Years and over | 0 (0.0%) | 0 (0.0%) |
Disability Class: Ambulatory Difficulty
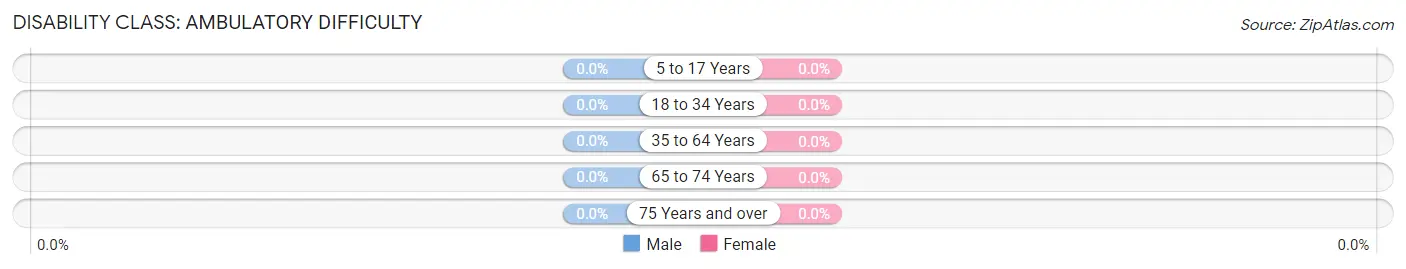
| Age Bracket | Male | Female |
| 5 to 17 Years | 0 (0.0%) | 0 (0.0%) |
| 18 to 34 Years | 0 (0.0%) | 0 (0.0%) |
| 35 to 64 Years | 0 (0.0%) | 0 (0.0%) |
| 65 to 74 Years | 0 (0.0%) | 0 (0.0%) |
| 75 Years and over | 0 (0.0%) | 0 (0.0%) |
Disability Class: Self-Care Difficulty
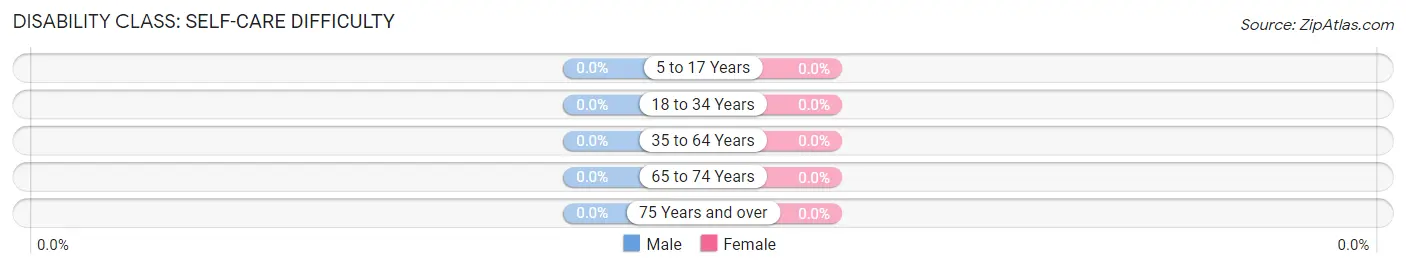
| Age Bracket | Male | Female |
| 5 to 17 Years | 0 (0.0%) | 0 (0.0%) |
| 18 to 34 Years | 0 (0.0%) | 0 (0.0%) |
| 35 to 64 Years | 0 (0.0%) | 0 (0.0%) |
| 65 to 74 Years | 0 (0.0%) | 0 (0.0%) |
| 75 Years and over | 0 (0.0%) | 0 (0.0%) |
Technology Access in Waterford
Computing Device Access in Waterford
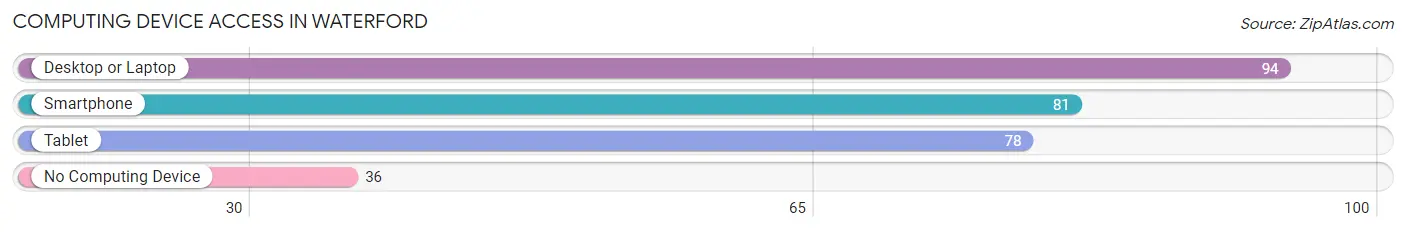
| Device Type | # Households | % Households |
| Desktop or Laptop | 94 | 72.3% |
| Smartphone | 81 | 62.3% |
| Tablet | 78 | 60.0% |
| No Computing Device | 36 | 27.7% |
| Total | 130 | 100.0% |
Internet Access in Waterford
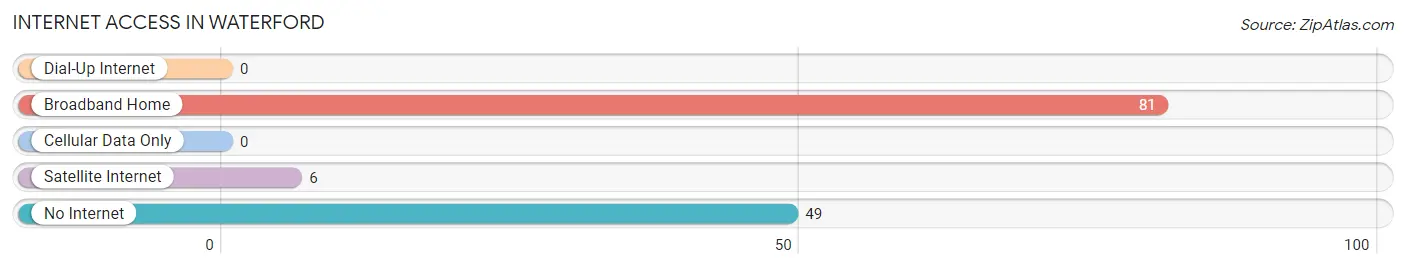
| Internet Type | # Households | % Households |
| Dial-Up Internet | 0 | 0.0% |
| Broadband Home | 81 | 62.3% |
| Cellular Data Only | 0 | 0.0% |
| Satellite Internet | 6 | 4.6% |
| No Internet | 49 | 37.7% |
| Total | 130 | 100.0% |
Waterford Summary
Waterford, Ohio is a small village located in Washington County, Ohio. It is situated on the banks of the Muskingum River, approximately 25 miles east of Marietta. The village has a population of approximately 1,000 people and is part of the Marietta-Belpre Metropolitan Statistical Area.
History
Waterford was founded in 1802 by a group of settlers from Pennsylvania. The village was originally known as “Waterford Crossroads” due to its location at the intersection of two major roads. The village was officially incorporated in 1817 and was named after Waterford, Ireland.
In the early 19th century, Waterford was a thriving agricultural community. The village was home to several mills, including a grist mill, a saw mill, and a woolen mill. The village also had a blacksmith shop, a tannery, and a general store.
In the late 19th century, the village began to decline due to the decline of the agricultural industry. The village was also affected by the Great Depression and World War II.
Geography
Waterford is located in southeastern Ohio, approximately 25 miles east of Marietta. The village is situated on the banks of the Muskingum River. The village is surrounded by rolling hills and farmland.
The village has a total area of 0.6 square miles, all of which is land. The village is located in the Eastern Time Zone and observes Daylight Saving Time.
Economy
The economy of Waterford is largely based on agriculture. The village is home to several farms, including dairy farms, beef farms, and vegetable farms. The village also has several small businesses, including a grocery store, a hardware store, and a restaurant.
The village is also home to several manufacturing companies, including a plastics manufacturer and a metal fabrication company.
Demographics
As of the 2010 census, the population of Waterford was 1,000 people. The racial makeup of the village was 97.2% White, 0.7% African American, 0.2% Native American, 0.2% Asian, 0.2% from other races, and 1.7% from two or more races. Hispanic or Latino of any race were 0.7% of the population.
The median income for a household in the village was $37,500, and the median income for a family was $41,250. The per capita income for the village was $17,845. About 11.2% of families and 13.2% of the population were below the poverty line, including 16.7% of those under age 18 and 8.3% of those age 65 or over.
Common Questions
What is Per Capita Income in Waterford?
Per Capita income in Waterford is $21,929.
What is the Median Family Income in Waterford?
Median Family Income in Waterford is $56,477.
What is the Median Household income in Waterford?
Median Household Income in Waterford is $49,271.
What is Income or Wage Gap in Waterford?
Income or Wage Gap in Waterford is 23.5%.
Women in Waterford earn 76.5 cents for every dollar earned by a man.
What is Inequality or Gini Index in Waterford?
Inequality or Gini Index in Waterford is 0.29.
What is the Total Population of Waterford?
Total Population of Waterford is 373.
What is the Total Male Population of Waterford?
Total Male Population of Waterford is 196.
What is the Total Female Population of Waterford?
Total Female Population of Waterford is 177.
What is the Ratio of Males per 100 Females in Waterford?
There are 110.73 Males per 100 Females in Waterford.
What is the Ratio of Females per 100 Males in Waterford?
There are 90.31 Females per 100 Males in Waterford.
What is the Median Population Age in Waterford?
Median Population Age in Waterford is 44.8 Years.
What is the Average Family Size in Waterford
Average Family Size in Waterford is 3.2 People.
What is the Average Household Size in Waterford
Average Household Size in Waterford is 2.9 People.
How Large is the Labor Force in Waterford?
There are 113 People in the Labor Forcein in Waterford.
What is the Percentage of People in the Labor Force in Waterford?
40.2% of People are in the Labor Force in Waterford.