Flat Rock, OH Map & Demographics
Flat Rock Map
Flat Rock Overview
$23,710
PER CAPITA INCOME
$26,215
AVG HOUSEHOLD INCOME
0.45
INEQUALITY / GINI INDEX
293
TOTAL POPULATION
79
MALE POPULATION
214
FEMALE POPULATION
36.92
MALES / 100 FEMALES
270.89
FEMALES / 100 MALES
50.4
MEDIAN AGE
3.5
AVG FAMILY SIZE
2.4
AVG HOUSEHOLD SIZE
160
LABOR FORCE [ PEOPLE ]
57.8%
PERCENT IN LABOR FORCE
Flat Rock Zip Codes
Flat Rock Area Codes
Income in Flat Rock
Income Overview in Flat Rock
| Characteristic | Number | Measure |
| Per Capita Income | 293 | $23,710 |
| Median Family Income | 55 | $0 |
| Mean Family Income | 55 | $69,271 |
| Median Household Income | 107 | $26,215 |
| Mean Household Income | 107 | $55,095 |
| Income Deficit | 55 | $0 |
| Wage / Income Gap (%) | 293 | 0.00% |
| Wage / Income Gap ($) | 293 | 100.00¢ per $1 |
| Gini / Inequality Index | 293 | 0.45 |
Earnings by Sex in Flat Rock
| Sex | Number | Average Earnings |
| Male | 38 (19.4%) | $0 |
| Female | 158 (80.6%) | $0 |
| Total | 196 (100.0%) | $0 |
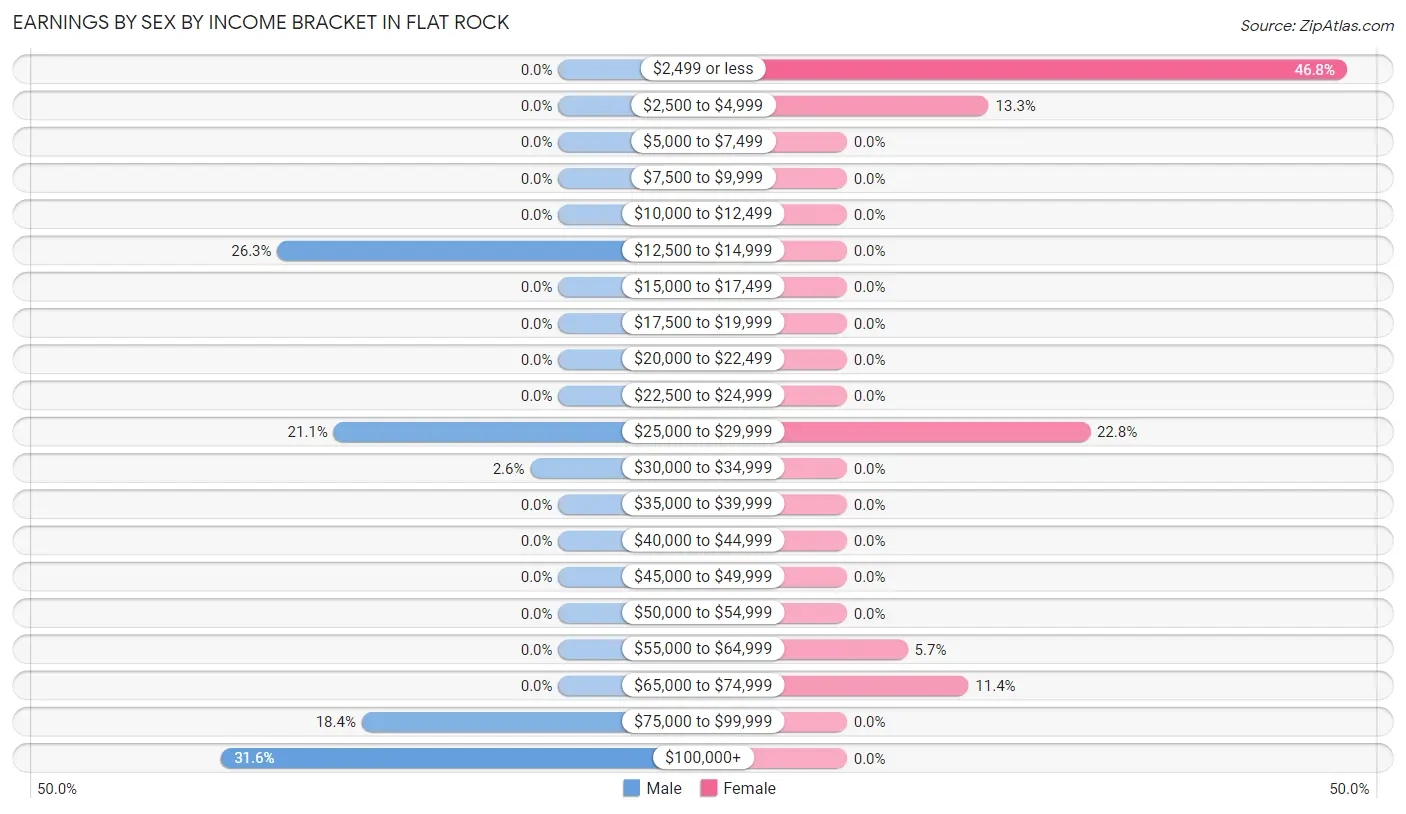
Earnings by Sex by Income Bracket in Flat Rock
The most common earnings brackets in Flat Rock are $100,000+ for men (12 | 31.6%) and $2,499 or less for women (74 | 46.8%).
| Income | Male | Female |
| $2,499 or less | 0 (0.0%) | 74 (46.8%) |
| $2,500 to $4,999 | 0 (0.0%) | 21 (13.3%) |
| $5,000 to $7,499 | 0 (0.0%) | 0 (0.0%) |
| $7,500 to $9,999 | 0 (0.0%) | 0 (0.0%) |
| $10,000 to $12,499 | 0 (0.0%) | 0 (0.0%) |
| $12,500 to $14,999 | 10 (26.3%) | 0 (0.0%) |
| $15,000 to $17,499 | 0 (0.0%) | 0 (0.0%) |
| $17,500 to $19,999 | 0 (0.0%) | 0 (0.0%) |
| $20,000 to $22,499 | 0 (0.0%) | 0 (0.0%) |
| $22,500 to $24,999 | 0 (0.0%) | 0 (0.0%) |
| $25,000 to $29,999 | 8 (21.0%) | 36 (22.8%) |
| $30,000 to $34,999 | 1 (2.6%) | 0 (0.0%) |
| $35,000 to $39,999 | 0 (0.0%) | 0 (0.0%) |
| $40,000 to $44,999 | 0 (0.0%) | 0 (0.0%) |
| $45,000 to $49,999 | 0 (0.0%) | 0 (0.0%) |
| $50,000 to $54,999 | 0 (0.0%) | 0 (0.0%) |
| $55,000 to $64,999 | 0 (0.0%) | 9 (5.7%) |
| $65,000 to $74,999 | 0 (0.0%) | 18 (11.4%) |
| $75,000 to $99,999 | 7 (18.4%) | 0 (0.0%) |
| $100,000+ | 12 (31.6%) | 0 (0.0%) |
| Total | 38 (100.0%) | 158 (100.0%) |
Earnings by Sex by Educational Attainment in Flat Rock
| Educational Attainment | Male Income | Female Income |
| Less than High School | - | - |
| High School Diploma | - | - |
| College or Associate's Degree | - | - |
| Bachelor's Degree | - | - |
| Graduate Degree | - | - |
| Total | - | - |
Family Income in Flat Rock
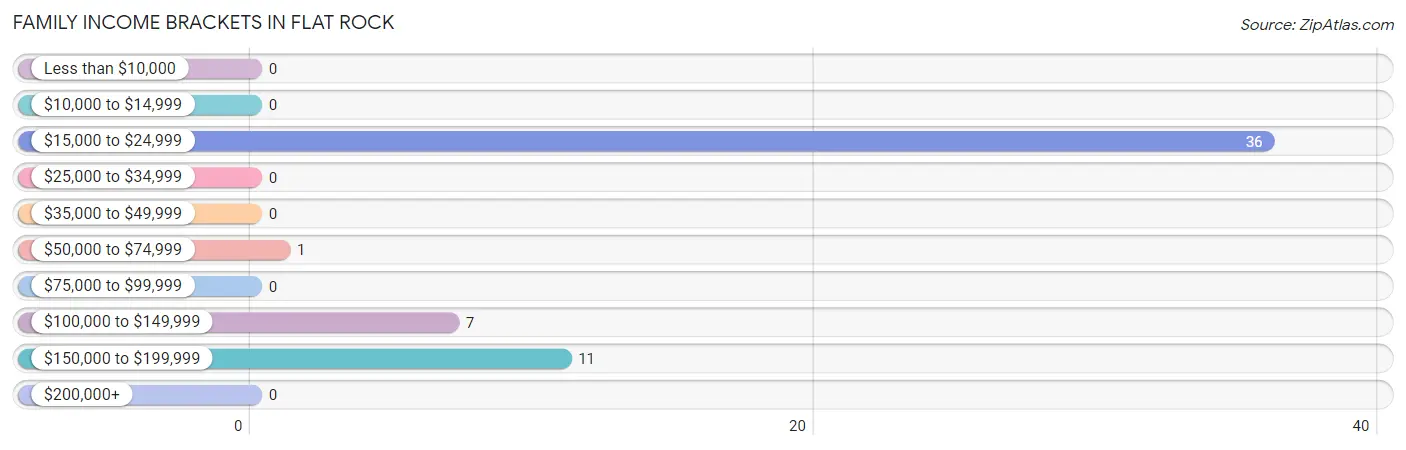
Family Income Brackets in Flat Rock
According to the Flat Rock family income data, there are 36 families falling into the $15,000 to $24,999 income range, which is the most common income bracket and makes up 65.4% of all families.
| Income Bracket | # Families | % Families |
| Less than $10,000 | 0 | 0.0% |
| $10,000 to $14,999 | 0 | 0.0% |
| $15,000 to $24,999 | 36 | 65.5% |
| $25,000 to $34,999 | 0 | 0.0% |
| $35,000 to $49,999 | 0 | 0.0% |
| $50,000 to $74,999 | 1 | 1.8% |
| $75,000 to $99,999 | 0 | 0.0% |
| $100,000 to $149,999 | 7 | 12.7% |
| $150,000 to $199,999 | 11 | 20.0% |
| $200,000+ | 0 | 0.0% |
Family Income by Famaliy Size in Flat Rock
| Income Bracket | # Families | Median Income |
| 2-Person Families | 1 (1.8%) | $0 |
| 3-Person Families | 54 (98.2%) | $0 |
| 4-Person Families | 0 (0.0%) | $0 |
| 5-Person Families | 0 (0.0%) | $0 |
| 6-Person Families | 0 (0.0%) | $0 |
| 7+ Person Families | 0 (0.0%) | $0 |
| Total | 55 (100.0%) | $0 |
Family Income by Number of Earners in Flat Rock
| Number of Earners | # Families | Median Income |
| No Earners | 0 (0.0%) | $0 |
| 1 Earner | 1 (1.8%) | $0 |
| 2 Earners | 43 (78.2%) | $0 |
| 3+ Earners | 11 (20.0%) | $0 |
| Total | 55 (100.0%) | $0 |
Household Income in Flat Rock
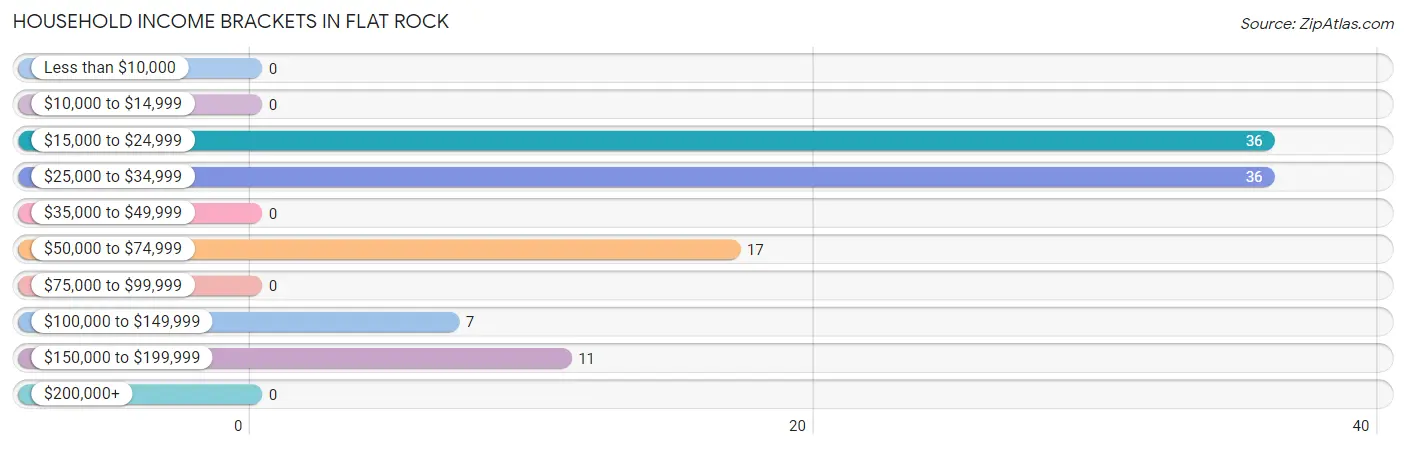
Household Income Brackets in Flat Rock
With 36 households falling in the category, the $15,000 to $24,999 income range is the most frequent in Flat Rock, accounting for 33.6% of all households.
| Income Bracket | # Households | % Households |
| Less than $10,000 | 0 | 0.0% |
| $10,000 to $14,999 | 0 | 0.0% |
| $15,000 to $24,999 | 36 | 33.6% |
| $25,000 to $34,999 | 36 | 33.6% |
| $35,000 to $49,999 | 0 | 0.0% |
| $50,000 to $74,999 | 17 | 15.9% |
| $75,000 to $99,999 | 0 | 0.0% |
| $100,000 to $149,999 | 7 | 6.5% |
| $150,000 to $199,999 | 11 | 10.3% |
| $200,000+ | 0 | 0.0% |
Household Income by Householder Age in Flat Rock
| Income Bracket | # Households | Median Income |
| 15 to 24 Years | 17 (15.9%) | $0 |
| 25 to 44 Years | 36 (33.6%) | $0 |
| 45 to 64 Years | 53 (49.5%) | $0 |
| 65+ Years | 1 (0.9%) | $0 |
| Total | 107 (100.0%) | $26,215 |
Poverty in Flat Rock
Income Below Poverty by Sex and Age in Flat Rock
With 27.5% poverty level for males and 42.1% for females among the residents of Flat Rock, 55 to 64 year old males and under 5 year old females are the most vulnerable to poverty, with 10 males (100.0%) and 16 females (100.0%) in their respective age groups living below the poverty level.
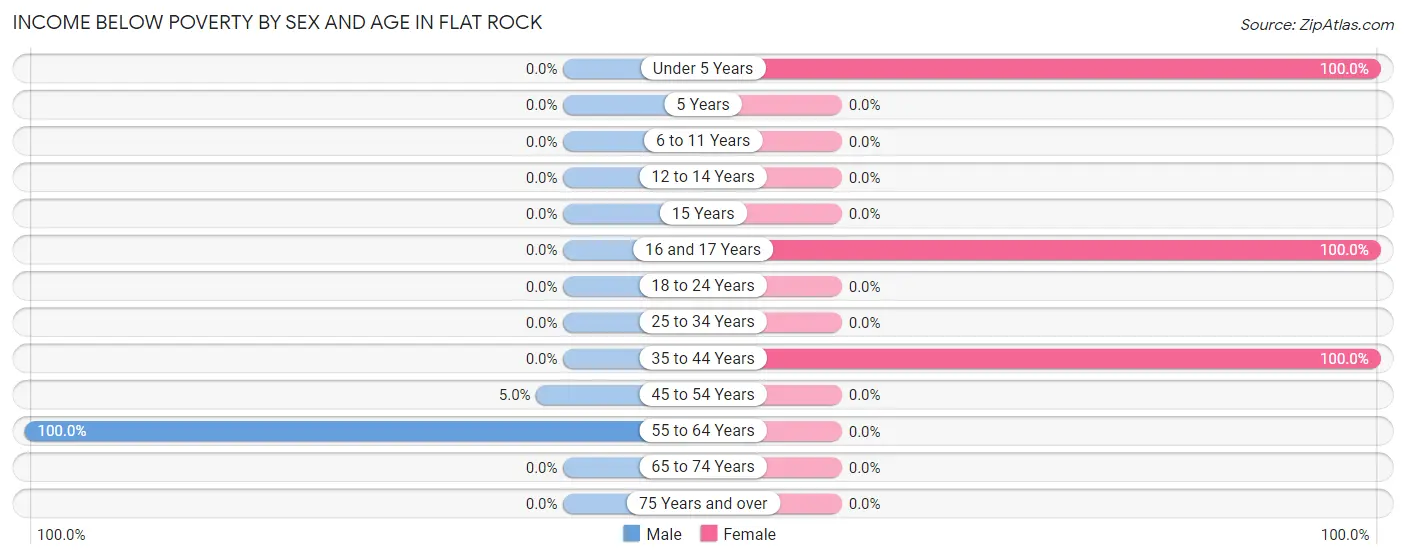
| Age Bracket | Male | Female |
| Under 5 Years | 0 (0.0%) | 16 (100.0%) |
| 5 Years | 0 (0.0%) | 0 (0.0%) |
| 6 to 11 Years | 0 (0.0%) | 0 (0.0%) |
| 12 to 14 Years | 0 (0.0%) | 0 (0.0%) |
| 15 Years | 0 (0.0%) | 0 (0.0%) |
| 16 and 17 Years | 0 (0.0%) | 38 (100.0%) |
| 18 to 24 Years | 0 (0.0%) | 0 (0.0%) |
| 25 to 34 Years | 0 (0.0%) | 0 (0.0%) |
| 35 to 44 Years | 0 (0.0%) | 36 (100.0%) |
| 45 to 54 Years | 1 (5.0%) | 0 (0.0%) |
| 55 to 64 Years | 10 (100.0%) | 0 (0.0%) |
| 65 to 74 Years | 0 (0.0%) | 0 (0.0%) |
| 75 Years and over | 0 (0.0%) | 0 (0.0%) |
| Total | 11 (27.5%) | 90 (42.1%) |
Income Above Poverty by Sex and Age in Flat Rock
According to the poverty statistics in Flat Rock, males aged 25 to 34 years and females aged 18 to 24 years are the age groups that are most secure financially, with 100.0% of males and 100.0% of females in these age groups living above the poverty line.
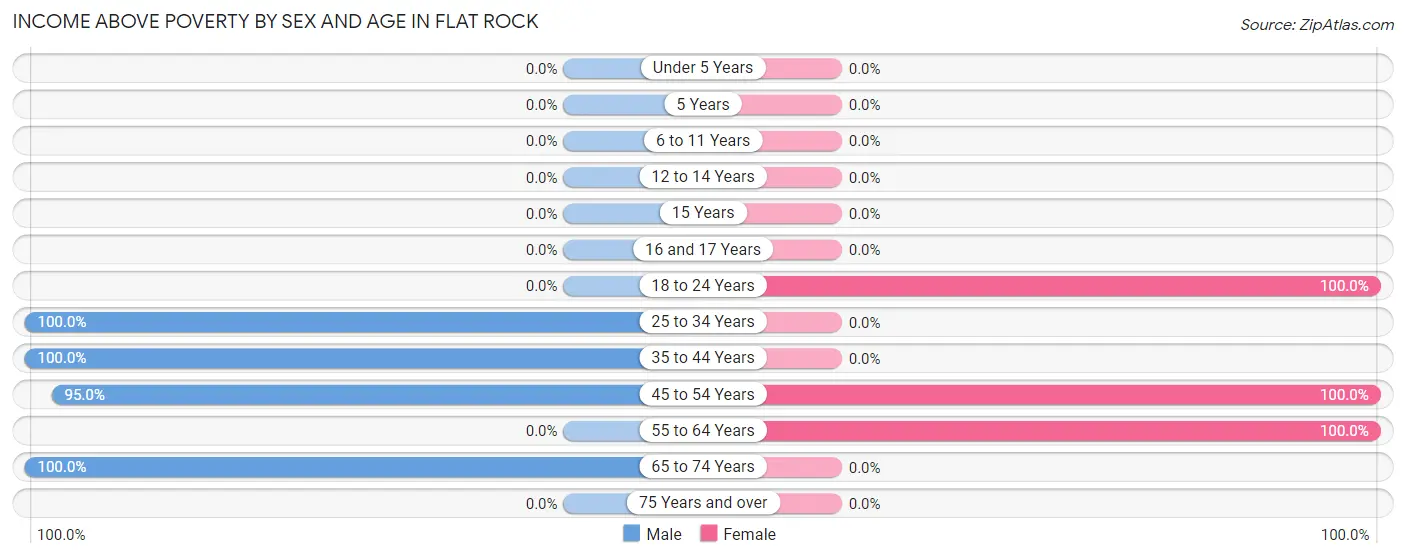
| Age Bracket | Male | Female |
| Under 5 Years | 0 (0.0%) | 0 (0.0%) |
| 5 Years | 0 (0.0%) | 0 (0.0%) |
| 6 to 11 Years | 0 (0.0%) | 0 (0.0%) |
| 12 to 14 Years | 0 (0.0%) | 0 (0.0%) |
| 15 Years | 0 (0.0%) | 0 (0.0%) |
| 16 and 17 Years | 0 (0.0%) | 0 (0.0%) |
| 18 to 24 Years | 0 (0.0%) | 38 (100.0%) |
| 25 to 34 Years | 8 (100.0%) | 0 (0.0%) |
| 35 to 44 Years | 1 (100.0%) | 0 (0.0%) |
| 45 to 54 Years | 19 (95.0%) | 16 (100.0%) |
| 55 to 64 Years | 0 (0.0%) | 70 (100.0%) |
| 65 to 74 Years | 1 (100.0%) | 0 (0.0%) |
| 75 Years and over | 0 (0.0%) | 0 (0.0%) |
| Total | 29 (72.5%) | 124 (57.9%) |
Income Below Poverty Among Married-Couple Families in Flat Rock
| Children | Above Poverty | Below Poverty |
| No Children | 19 (100.0%) | 0 (0.0%) |
| 1 or 2 Children | 0 (0.0%) | 0 (0.0%) |
| 3 or 4 Children | 0 (0.0%) | 0 (0.0%) |
| 5 or more Children | 0 (0.0%) | 0 (0.0%) |
| Total | 19 (100.0%) | 0 (0.0%) |
Income Below Poverty Among Single-Parent Households in Flat Rock
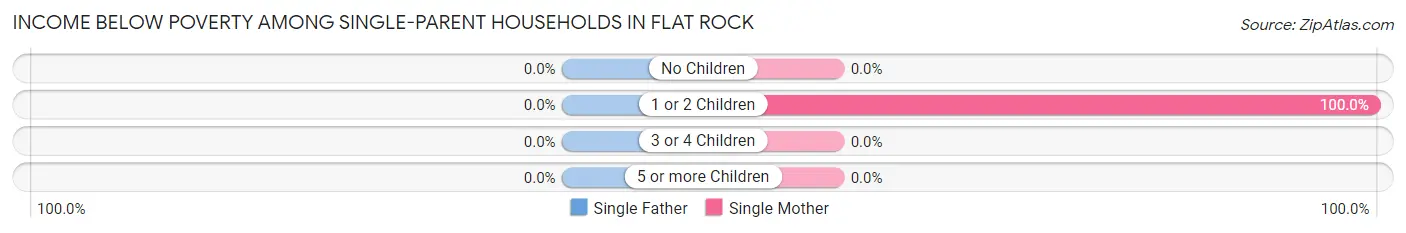
| Children | Single Father | Single Mother |
| No Children | 0 (0.0%) | 0 (0.0%) |
| 1 or 2 Children | 0 (0.0%) | 36 (100.0%) |
| 3 or 4 Children | 0 (0.0%) | 0 (0.0%) |
| 5 or more Children | 0 (0.0%) | 0 (0.0%) |
| Total | 0 (0.0%) | 36 (100.0%) |
Income Below Poverty Among Married-Couple vs Single-Parent Households in Flat Rock
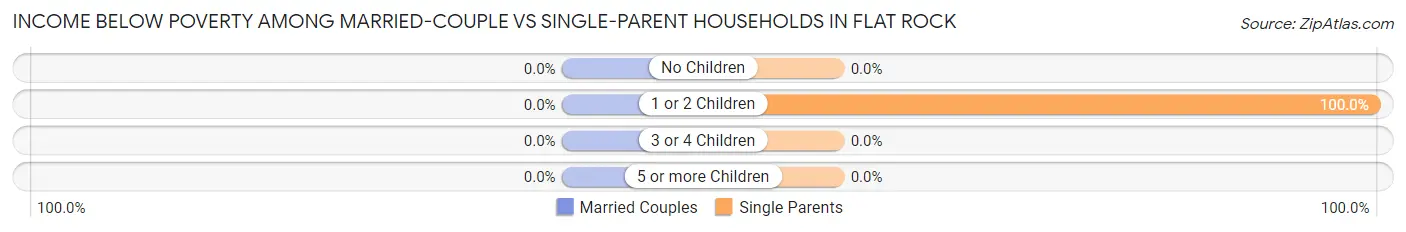
| Children | Married-Couple Families | Single-Parent Households |
| No Children | 0 (0.0%) | 0 (0.0%) |
| 1 or 2 Children | 0 (0.0%) | 36 (100.0%) |
| 3 or 4 Children | 0 (0.0%) | 0 (0.0%) |
| 5 or more Children | 0 (0.0%) | 0 (0.0%) |
| Total | 0 (0.0%) | 36 (100.0%) |
Race in Flat Rock
The most populous races in Flat Rock are White / Caucasian (229 | 78.2%), Hispanic or Latino (36 | 12.3%), and Some other Race (35 | 11.9%).
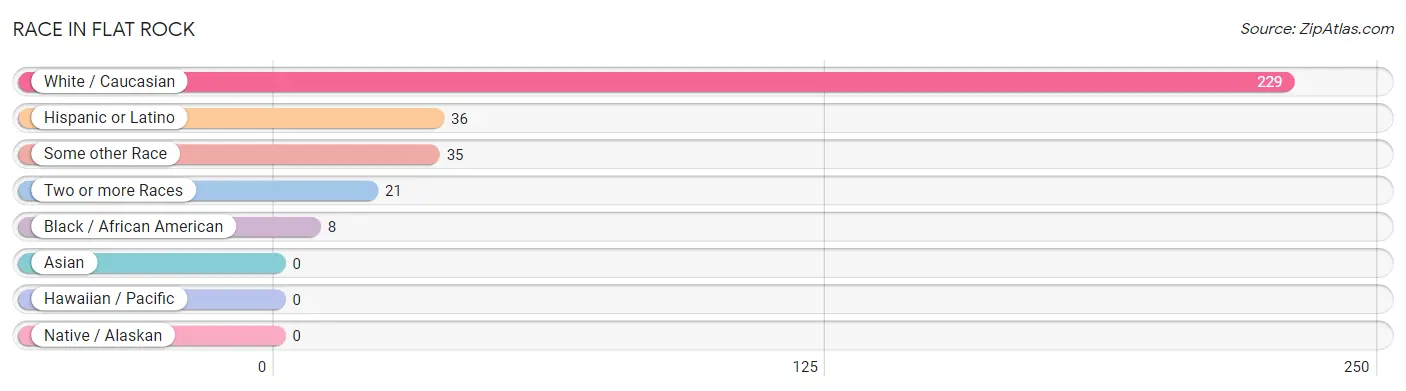
| Race | # Population | % Population |
| Asian | 0 | 0.0% |
| Black / African American | 8 | 2.7% |
| Hawaiian / Pacific | 0 | 0.0% |
| Hispanic or Latino | 36 | 12.3% |
| Native / Alaskan | 0 | 0.0% |
| White / Caucasian | 229 | 78.2% |
| Two or more Races | 21 | 7.2% |
| Some other Race | 35 | 11.9% |
| Total | 293 | 100.0% |
Ancestry in Flat Rock
The most populous ancestries reported in Flat Rock are German (82 | 28.0%), American (49 | 16.7%), European (38 | 13.0%), Mexican (36 | 12.3%), and British (32 | 10.9%), together accounting for 80.9% of all Flat Rock residents.
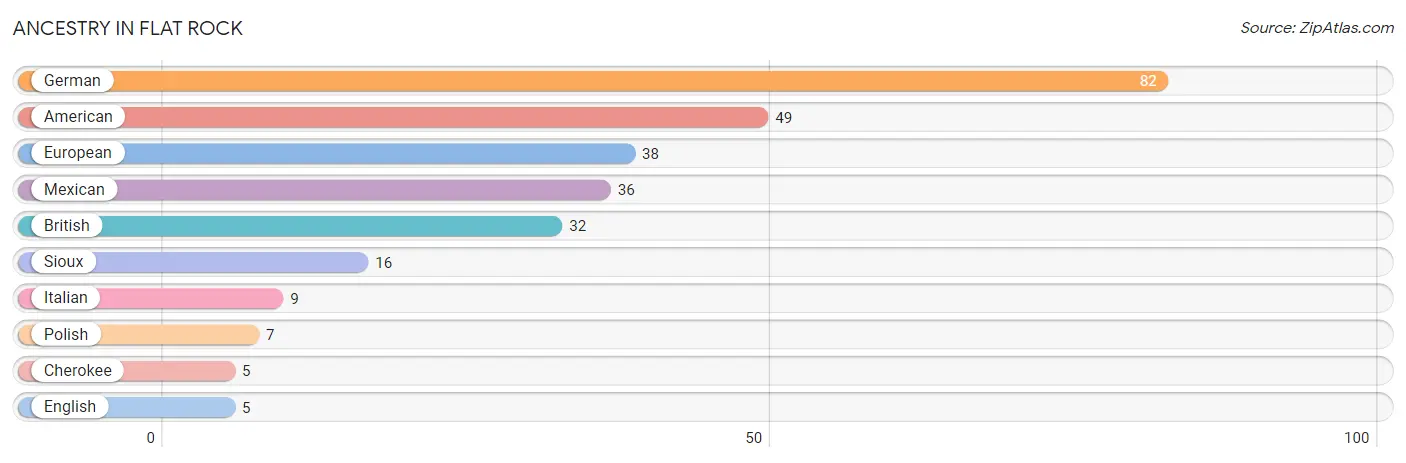
| Ancestry | # Population | % Population |
| American | 49 | 16.7% |
| British | 32 | 10.9% |
| Cherokee | 5 | 1.7% |
| English | 5 | 1.7% |
| European | 38 | 13.0% |
| German | 82 | 28.0% |
| Italian | 9 | 3.1% |
| Mexican | 36 | 12.3% |
| Polish | 7 | 2.4% |
| Sioux | 16 | 5.5% | View All 10 Rows |
Immigrants in Flat Rock
The most numerous immigrant groups reported in Flat Rock came from Central America (35 | 11.9%), Latin America (35 | 11.9%), and Mexico (35 | 11.9%), together accounting for 35.8% of all Flat Rock residents.
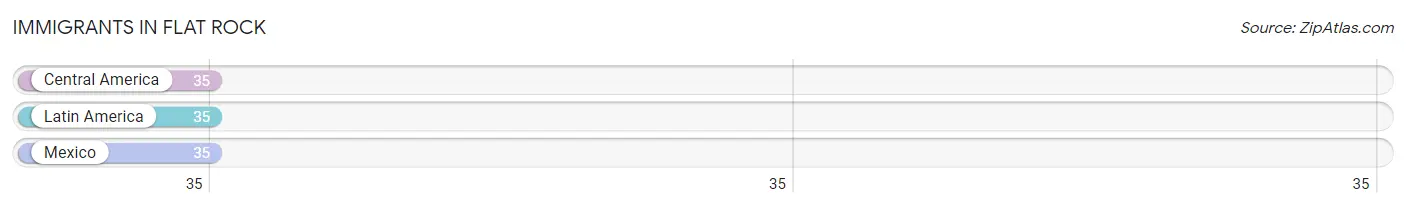
| Immigration Origin | # Population | % Population |
| Central America | 35 | 11.9% |
| Latin America | 35 | 11.9% |
| Mexico | 35 | 11.9% | View All 3 Rows |
Sex and Age in Flat Rock
Sex and Age in Flat Rock
The most populous age groups in Flat Rock are 50 to 54 Years (19 | 24.0%) for men and 55 to 59 Years (44 | 20.6%) for women.
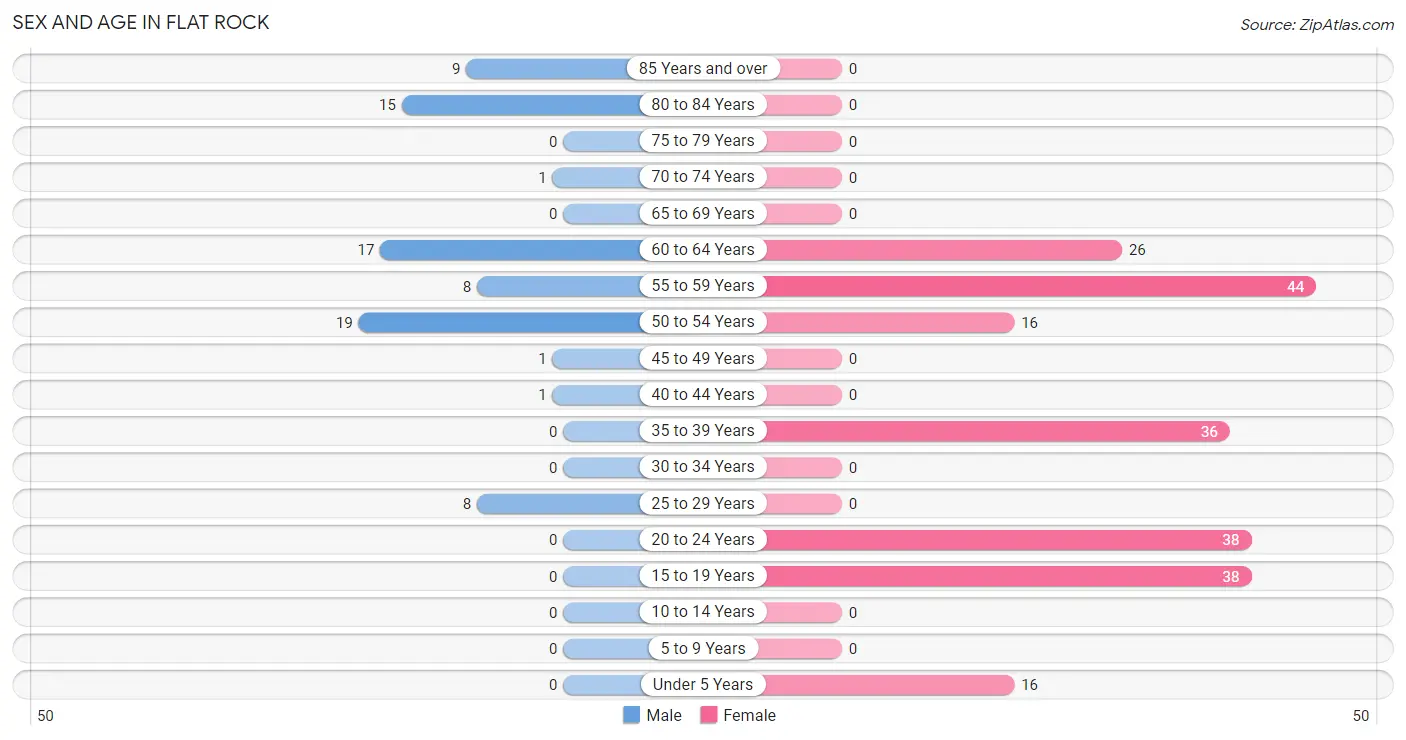
| Age Bracket | Male | Female |
| Under 5 Years | 0 (0.0%) | 16 (7.5%) |
| 5 to 9 Years | 0 (0.0%) | 0 (0.0%) |
| 10 to 14 Years | 0 (0.0%) | 0 (0.0%) |
| 15 to 19 Years | 0 (0.0%) | 38 (17.8%) |
| 20 to 24 Years | 0 (0.0%) | 38 (17.8%) |
| 25 to 29 Years | 8 (10.1%) | 0 (0.0%) |
| 30 to 34 Years | 0 (0.0%) | 0 (0.0%) |
| 35 to 39 Years | 0 (0.0%) | 36 (16.8%) |
| 40 to 44 Years | 1 (1.3%) | 0 (0.0%) |
| 45 to 49 Years | 1 (1.3%) | 0 (0.0%) |
| 50 to 54 Years | 19 (24.0%) | 16 (7.5%) |
| 55 to 59 Years | 8 (10.1%) | 44 (20.6%) |
| 60 to 64 Years | 17 (21.5%) | 26 (12.1%) |
| 65 to 69 Years | 0 (0.0%) | 0 (0.0%) |
| 70 to 74 Years | 1 (1.3%) | 0 (0.0%) |
| 75 to 79 Years | 0 (0.0%) | 0 (0.0%) |
| 80 to 84 Years | 15 (19.0%) | 0 (0.0%) |
| 85 Years and over | 9 (11.4%) | 0 (0.0%) |
| Total | 79 (100.0%) | 214 (100.0%) |
Families and Households in Flat Rock
Median Family Size in Flat Rock
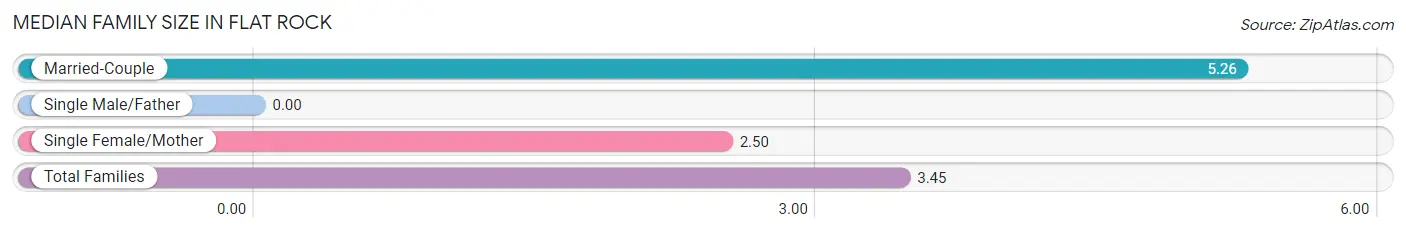
| Family Type | # Families | Family Size |
| Married-Couple | 19 (34.5%) | 5.26 |
| Single Male/Father | 0 (0.0%) | - |
| Single Female/Mother | 36 (65.4%) | 2.50 |
| Total Families | 55 (100.0%) | 3.45 |
Median Household Size in Flat Rock
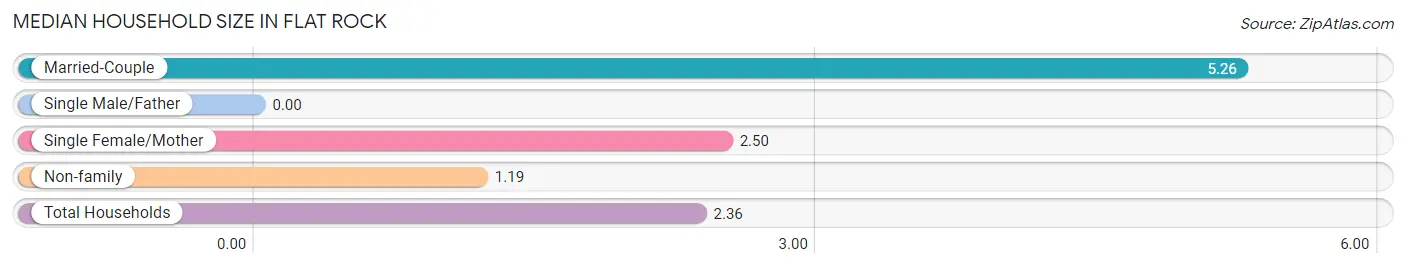
| Household Type | # Households | Household Size |
| Married-Couple | 19 (17.8%) | 5.26 |
| Single Male/Father | 0 (0.0%) | - |
| Single Female/Mother | 36 (33.6%) | 2.50 |
| Non-family | 52 (48.6%) | 1.19 |
| Total Households | 107 (100.0%) | 2.36 |
Household Size by Marriage Status in Flat Rock
Out of a total of 107 households in Flat Rock, 55 (51.4%) are family households, while 52 (48.6%) are nonfamily households. The most numerous type of family households are 3-person households, comprising 54, and the most common type of nonfamily households are 1-person households, comprising 43.
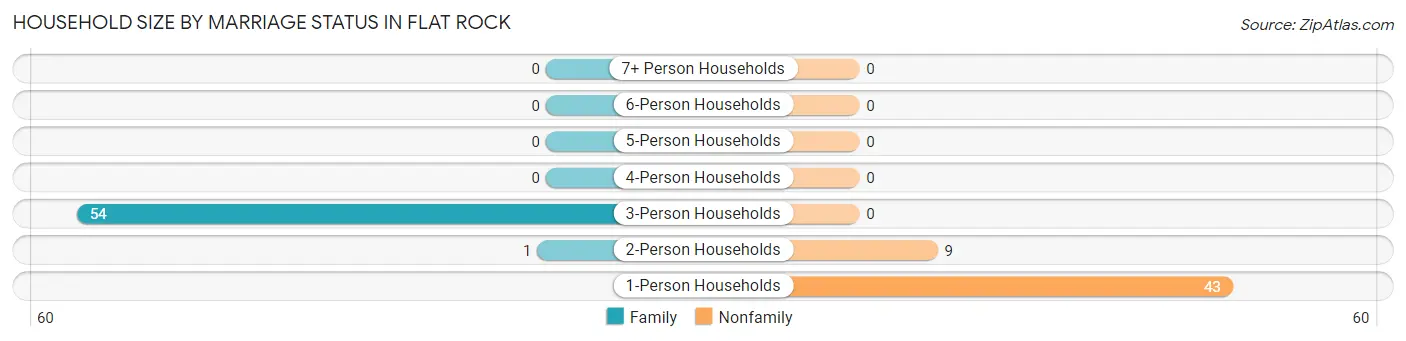
| Household Size | Family Households | Nonfamily Households |
| 1-Person Households | - | 43 (40.2%) |
| 2-Person Households | 1 (0.9%) | 9 (8.4%) |
| 3-Person Households | 54 (50.5%) | 0 (0.0%) |
| 4-Person Households | 0 (0.0%) | 0 (0.0%) |
| 5-Person Households | 0 (0.0%) | 0 (0.0%) |
| 6-Person Households | 0 (0.0%) | 0 (0.0%) |
| 7+ Person Households | 0 (0.0%) | 0 (0.0%) |
| Total | 55 (51.4%) | 52 (48.6%) |
Female Fertility in Flat Rock
Fertility by Age in Flat Rock
| Age Bracket | Women with Births | Births / 1,000 Women |
| 15 to 19 years | 0 (0.0%) | 0.0 |
| 20 to 34 years | 0 (0.0%) | 0.0 |
| 35 to 50 years | 0 (0.0%) | 0.0 |
| Total | 0 (0.0%) | 0.0 |
Fertility by Age by Marriage Status in Flat Rock
| Age Bracket | Married | Unmarried |
| 15 to 19 years | 0 (0.0%) | 0 (0.0%) |
| 20 to 34 years | 0 (0.0%) | 0 (0.0%) |
| 35 to 50 years | 0 (0.0%) | 0 (0.0%) |
| Total | 0 (0.0%) | 0 (0.0%) |
Fertility by Education in Flat Rock
| Educational Attainment | Women with Births | Births / 1,000 Women |
| Less than High School | 0 (0.0%) | 0.0 |
| High School Diploma | 0 (0.0%) | 0.0 |
| College or Associate's Degree | 0 (0.0%) | 0.0 |
| Bachelor's Degree | 0 (0.0%) | 0.0 |
| Graduate Degree | 0 (0.0%) | 0.0 |
| Total | 0 (0.0%) | 0.0 |
Fertility by Education by Marriage Status in Flat Rock
| Educational Attainment | Married | Unmarried |
| Less than High School | 0 (0.0%) | 0 (0.0%) |
| High School Diploma | 0 (0.0%) | 0 (0.0%) |
| College or Associate's Degree | 0 (0.0%) | 0 (0.0%) |
| Bachelor's Degree | 0 (0.0%) | 0 (0.0%) |
| Graduate Degree | 0 (0.0%) | 0 (0.0%) |
| Total | 0 (0.0%) | 0 (0.0%) |
Employment Characteristics in Flat Rock
Employment by Class of Employer in Flat Rock
Among the 160 employed individuals in Flat Rock, private company employees (149 | 93.1%), and not-for-profit organizations (11 | 6.9%) make up the most common classes of employment.
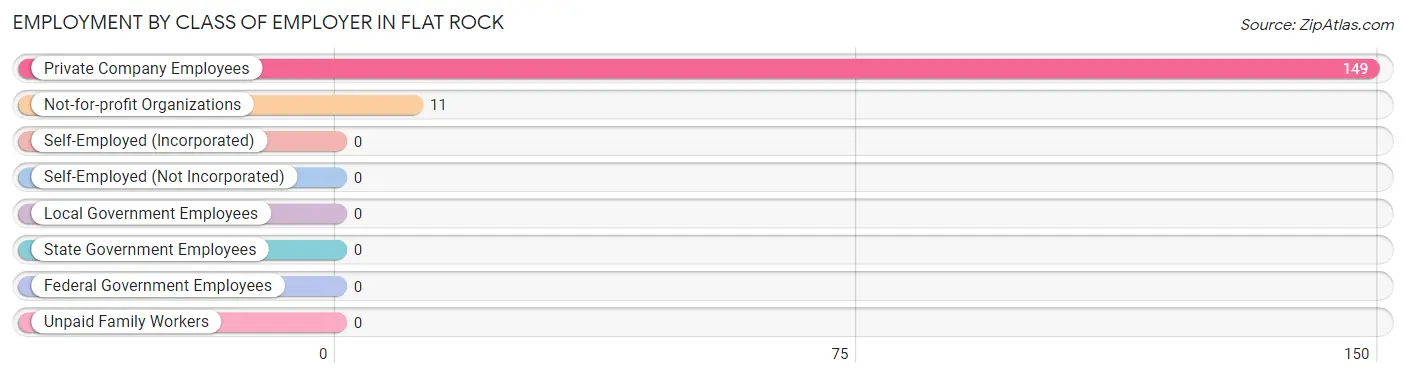
| Employer Class | # Employees | % Employees |
| Private Company Employees | 149 | 93.1% |
| Self-Employed (Incorporated) | 0 | 0.0% |
| Self-Employed (Not Incorporated) | 0 | 0.0% |
| Not-for-profit Organizations | 11 | 6.9% |
| Local Government Employees | 0 | 0.0% |
| State Government Employees | 0 | 0.0% |
| Federal Government Employees | 0 | 0.0% |
| Unpaid Family Workers | 0 | 0.0% |
| Total | 160 | 100.0% |
Employment Status by Age in Flat Rock
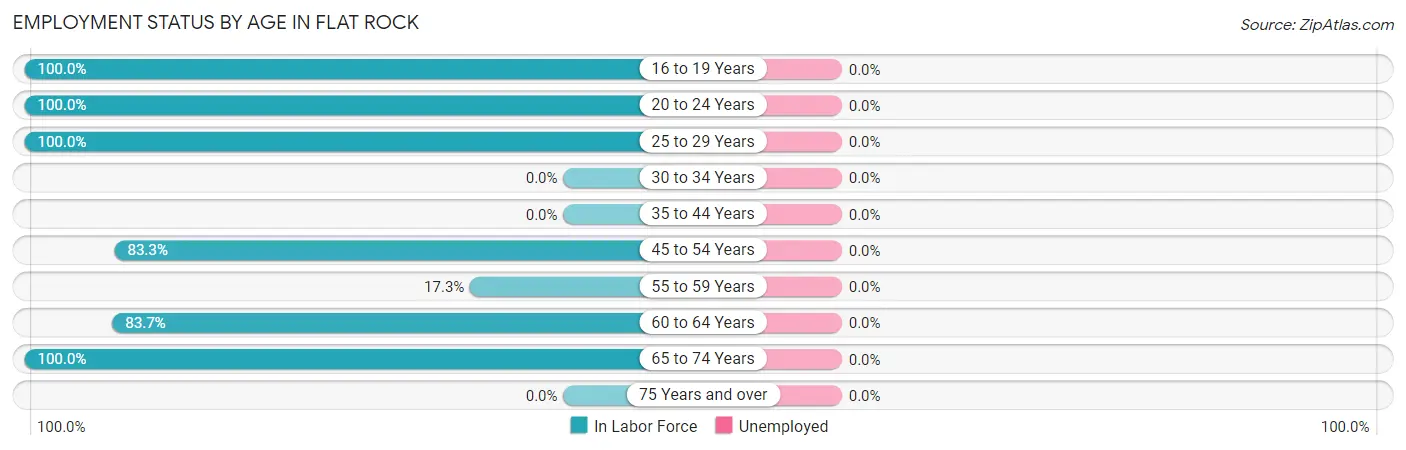
| Age Bracket | In Labor Force | Unemployed |
| 16 to 19 Years | 38 (100.0%) | 0 (0.0%) |
| 20 to 24 Years | 38 (100.0%) | 0 (0.0%) |
| 25 to 29 Years | 8 (100.0%) | 0 (0.0%) |
| 30 to 34 Years | 0 (0.0%) | 0 (0.0%) |
| 35 to 44 Years | 0 (0.0%) | 0 (0.0%) |
| 45 to 54 Years | 30 (83.3%) | 0 (0.0%) |
| 55 to 59 Years | 9 (17.3%) | 0 (0.0%) |
| 60 to 64 Years | 36 (83.7%) | 0 (0.0%) |
| 65 to 74 Years | 1 (100.0%) | 0 (0.0%) |
| 75 Years and over | 0 (0.0%) | 0 (0.0%) |
| Total | 160 (57.8%) | 0 (0.0%) |
Employment Status by Educational Attainment in Flat Rock
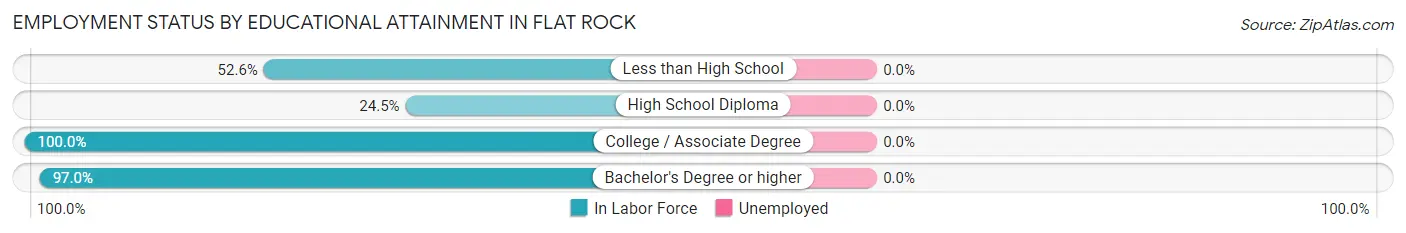
| Educational Attainment | In Labor Force | Unemployed |
| Less than High School | 10 (52.6%) | 0 (0.0%) |
| High School Diploma | 27 (24.5%) | 0 (0.0%) |
| College / Associate Degree | 14 (100.0%) | 0 (0.0%) |
| Bachelor's Degree or higher | 32 (97.0%) | 0 (0.0%) |
| Total | 83 (47.2%) | 0 (0.0%) |
Employment Occupations by Sex in Flat Rock
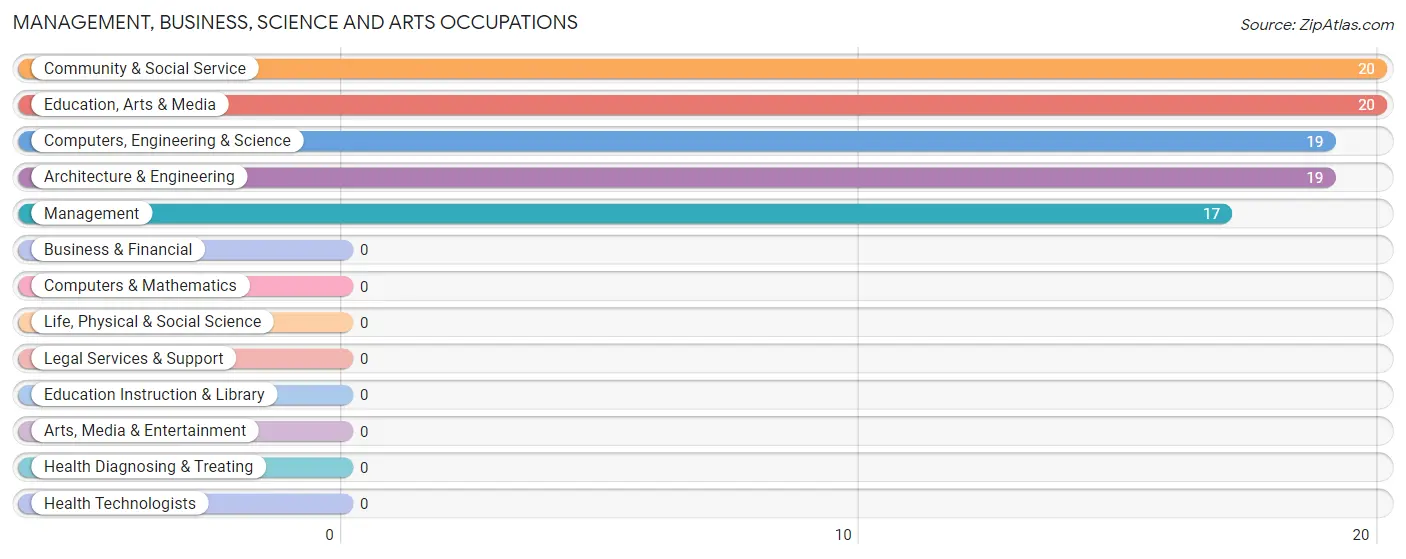
Management, Business, Science and Arts Occupations
The most common Management, Business, Science and Arts occupations in Flat Rock are Community & Social Service (20 | 12.5%), Education, Arts & Media (20 | 12.5%), Computers, Engineering & Science (19 | 11.9%), Architecture & Engineering (19 | 11.9%), and Management (17 | 10.6%).
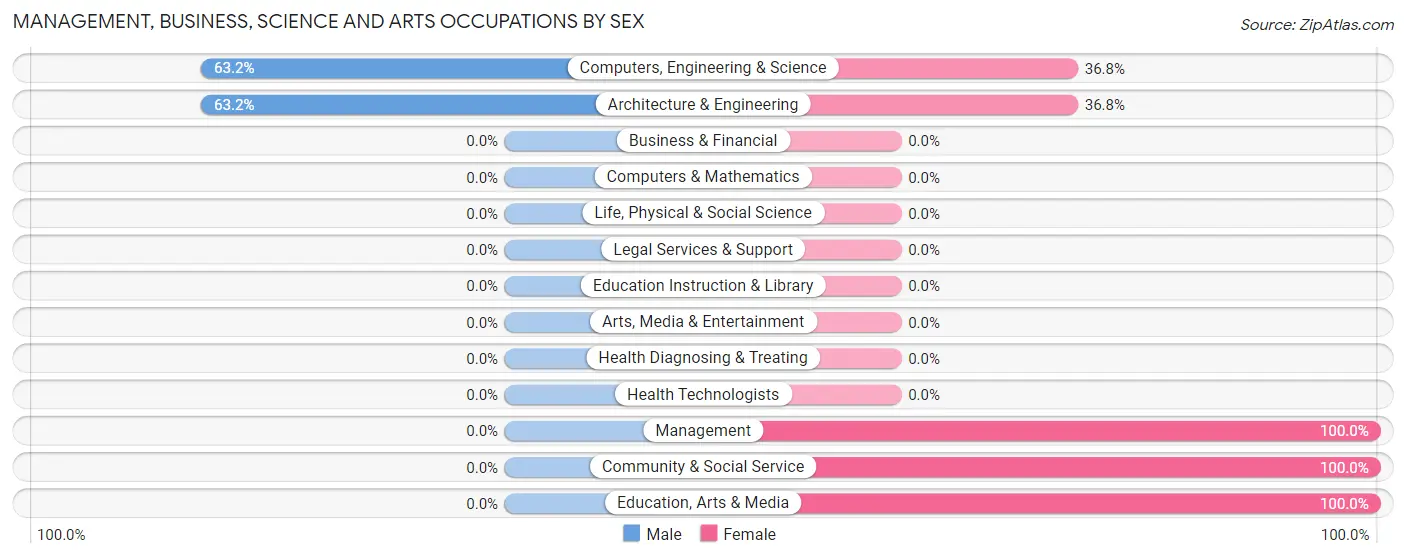
Management, Business, Science and Arts Occupations by Sex
Within the Management, Business, Science and Arts occupations in Flat Rock, the most male-oriented occupations are Computers, Engineering & Science (63.2%), and Architecture & Engineering (63.2%), while the most female-oriented occupations are Management (100.0%), Community & Social Service (100.0%), and Education, Arts & Media (100.0%).
| Occupation | Male | Female |
| Management | 0 (0.0%) | 17 (100.0%) |
| Business & Financial | 0 (0.0%) | 0 (0.0%) |
| Computers, Engineering & Science | 12 (63.2%) | 7 (36.8%) |
| Computers & Mathematics | 0 (0.0%) | 0 (0.0%) |
| Architecture & Engineering | 12 (63.2%) | 7 (36.8%) |
| Life, Physical & Social Science | 0 (0.0%) | 0 (0.0%) |
| Community & Social Service | 0 (0.0%) | 20 (100.0%) |
| Education, Arts & Media | 0 (0.0%) | 20 (100.0%) |
| Legal Services & Support | 0 (0.0%) | 0 (0.0%) |
| Education Instruction & Library | 0 (0.0%) | 0 (0.0%) |
| Arts, Media & Entertainment | 0 (0.0%) | 0 (0.0%) |
| Health Diagnosing & Treating | 0 (0.0%) | 0 (0.0%) |
| Health Technologists | 0 (0.0%) | 0 (0.0%) |
| Total (Category) | 12 (21.4%) | 44 (78.6%) |
| Total (Overall) | 38 (23.7%) | 122 (76.2%) |
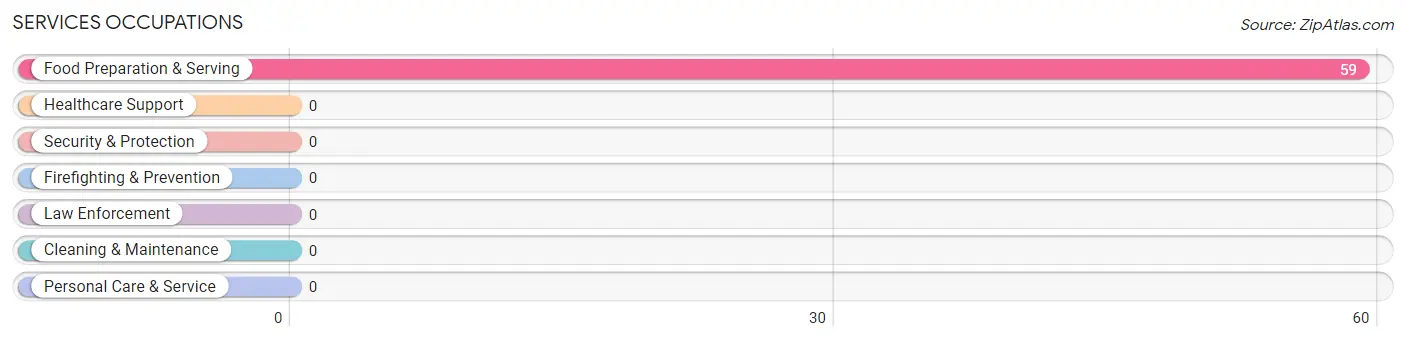
Services Occupations
The most common Services occupations in Flat Rock are , and Food Preparation & Serving (59 | 36.9%).
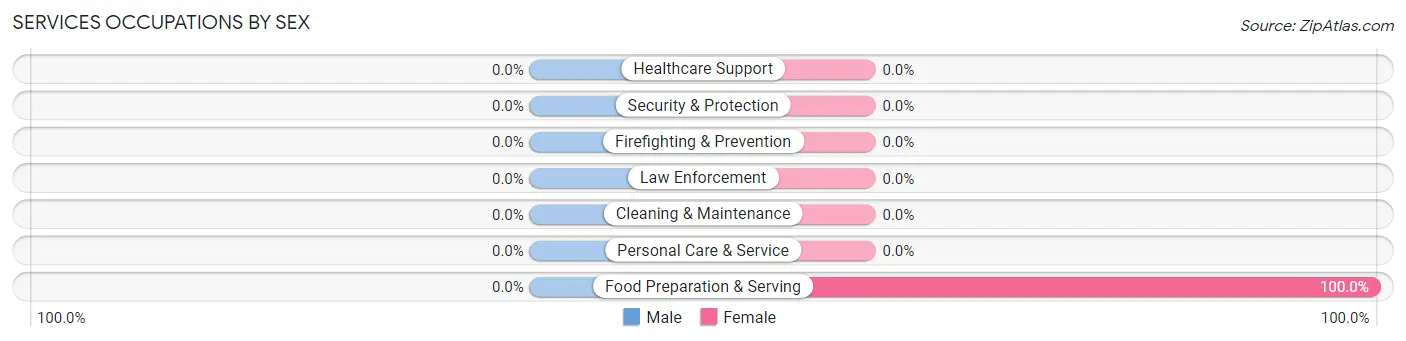
Services Occupations by Sex
| Occupation | Male | Female |
| Healthcare Support | 0 (0.0%) | 0 (0.0%) |
| Security & Protection | 0 (0.0%) | 0 (0.0%) |
| Firefighting & Prevention | 0 (0.0%) | 0 (0.0%) |
| Law Enforcement | 0 (0.0%) | 0 (0.0%) |
| Food Preparation & Serving | 0 (0.0%) | 59 (100.0%) |
| Cleaning & Maintenance | 0 (0.0%) | 0 (0.0%) |
| Personal Care & Service | 0 (0.0%) | 0 (0.0%) |
| Total (Category) | 0 (0.0%) | 59 (100.0%) |
| Total (Overall) | 38 (23.7%) | 122 (76.2%) |
Sales and Office Occupations
Sales and Office Occupations by Sex
| Occupation | Male | Female |
| Sales & Related | 0 (0.0%) | 0 (0.0%) |
| Office & Administration | 0 (0.0%) | 0 (0.0%) |
| Total (Category) | 0 (0.0%) | 0 (0.0%) |
| Total (Overall) | 38 (23.7%) | 122 (76.2%) |
Natural Resources, Construction and Maintenance Occupations
The most common Natural Resources, Construction and Maintenance occupations in Flat Rock are , and Installation, Maintenance & Repair (8 | 5.0%).
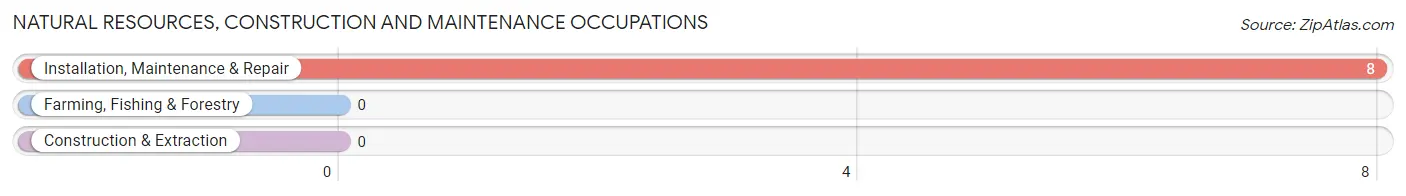
Natural Resources, Construction and Maintenance Occupations by Sex
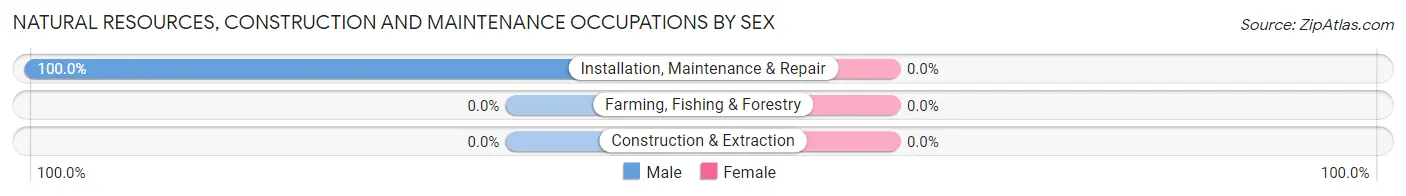
| Occupation | Male | Female |
| Farming, Fishing & Forestry | 0 (0.0%) | 0 (0.0%) |
| Construction & Extraction | 0 (0.0%) | 0 (0.0%) |
| Installation, Maintenance & Repair | 8 (100.0%) | 0 (0.0%) |
| Total (Category) | 8 (100.0%) | 0 (0.0%) |
| Total (Overall) | 38 (23.7%) | 122 (76.2%) |
Production, Transportation and Moving Occupations
The most common Production, Transportation and Moving occupations in Flat Rock are Production (26 | 16.3%), and Material Moving (11 | 6.9%).
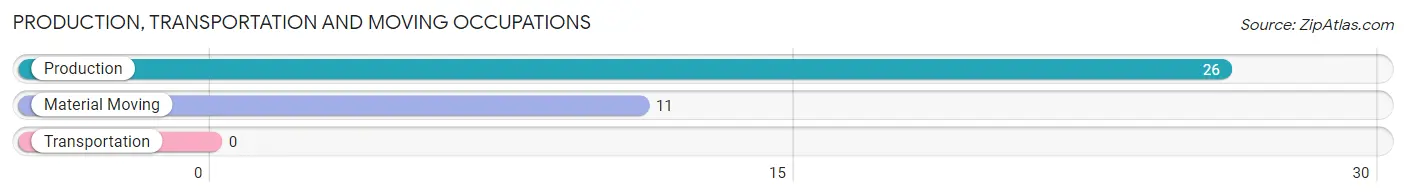
Production, Transportation and Moving Occupations by Sex
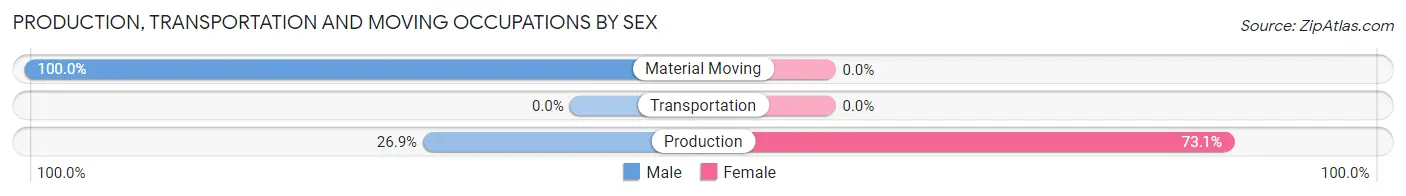
| Occupation | Male | Female |
| Production | 7 (26.9%) | 19 (73.1%) |
| Transportation | 0 (0.0%) | 0 (0.0%) |
| Material Moving | 11 (100.0%) | 0 (0.0%) |
| Total (Category) | 18 (48.6%) | 19 (51.3%) |
| Total (Overall) | 38 (23.7%) | 122 (76.2%) |
Employment Industries by Sex in Flat Rock
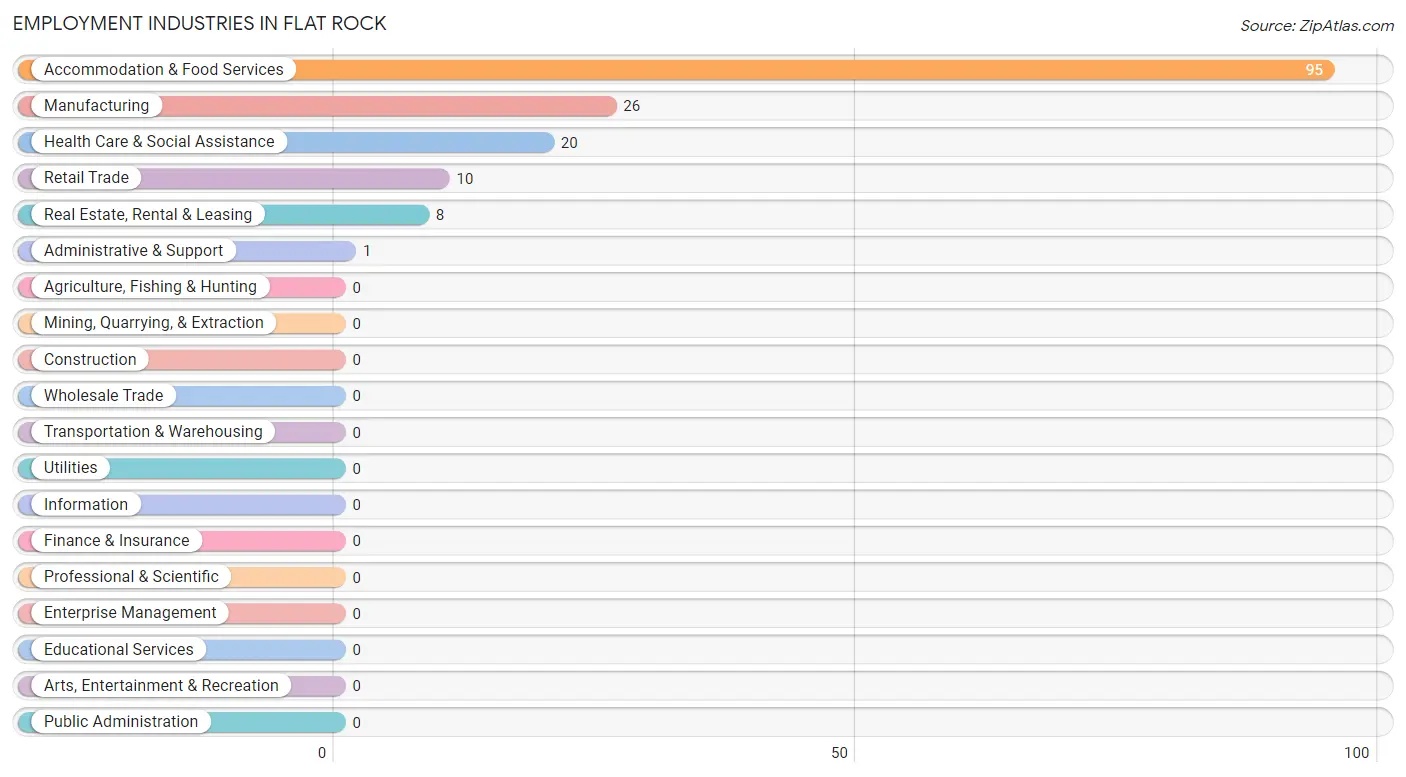
Employment Industries in Flat Rock
The major employment industries in Flat Rock include Accommodation & Food Services (95 | 59.4%), Manufacturing (26 | 16.3%), Health Care & Social Assistance (20 | 12.5%), Retail Trade (10 | 6.2%), and Real Estate, Rental & Leasing (8 | 5.0%).
Employment Industries by Sex in Flat Rock
The Flat Rock industries that see more men than women are Retail Trade (100.0%), Real Estate, Rental & Leasing (100.0%), and Administrative & Support (100.0%), whereas the industries that tend to have a higher number of women are Health Care & Social Assistance (100.0%), Accommodation & Food Services (100.0%), and Manufacturing (26.9%).
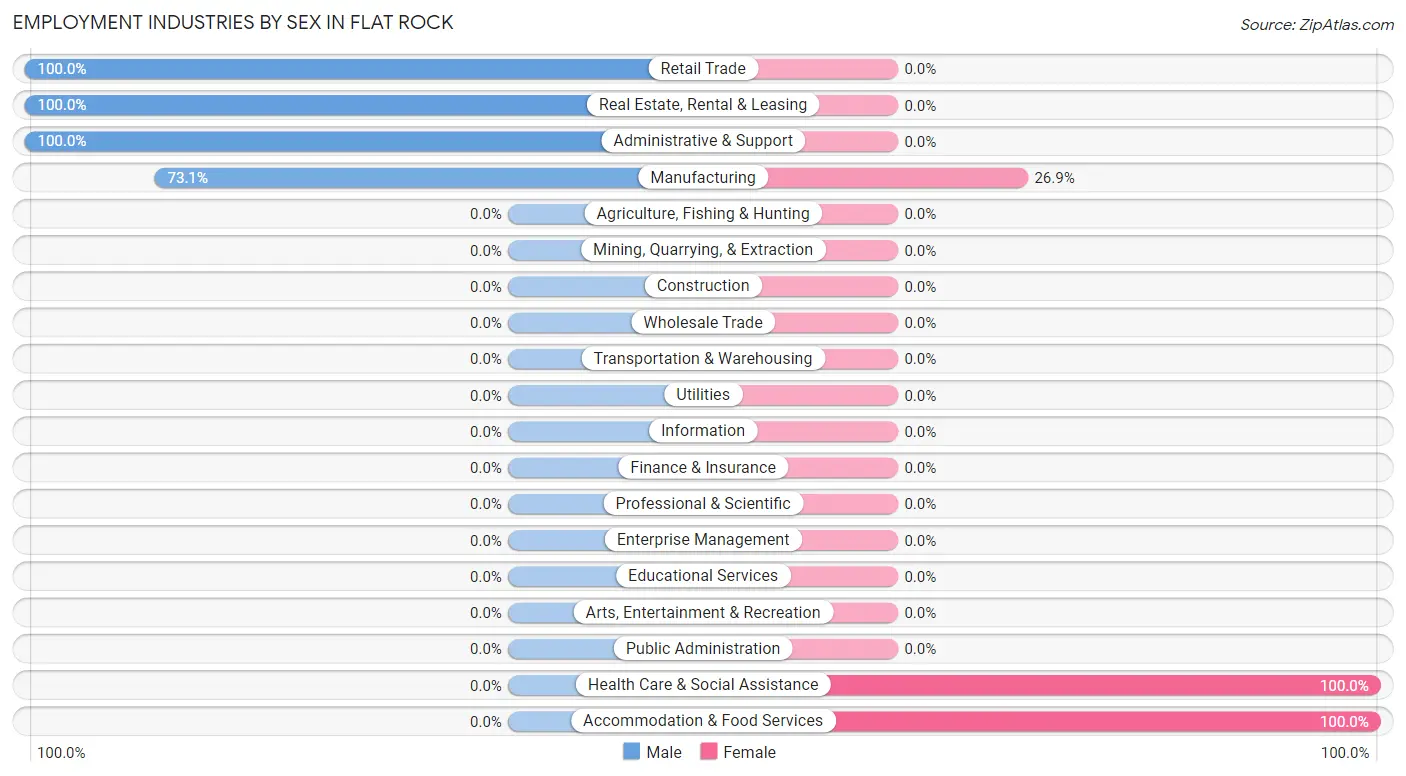
| Industry | Male | Female |
| Agriculture, Fishing & Hunting | 0 (0.0%) | 0 (0.0%) |
| Mining, Quarrying, & Extraction | 0 (0.0%) | 0 (0.0%) |
| Construction | 0 (0.0%) | 0 (0.0%) |
| Manufacturing | 19 (73.1%) | 7 (26.9%) |
| Wholesale Trade | 0 (0.0%) | 0 (0.0%) |
| Retail Trade | 10 (100.0%) | 0 (0.0%) |
| Transportation & Warehousing | 0 (0.0%) | 0 (0.0%) |
| Utilities | 0 (0.0%) | 0 (0.0%) |
| Information | 0 (0.0%) | 0 (0.0%) |
| Finance & Insurance | 0 (0.0%) | 0 (0.0%) |
| Real Estate, Rental & Leasing | 8 (100.0%) | 0 (0.0%) |
| Professional & Scientific | 0 (0.0%) | 0 (0.0%) |
| Enterprise Management | 0 (0.0%) | 0 (0.0%) |
| Administrative & Support | 1 (100.0%) | 0 (0.0%) |
| Educational Services | 0 (0.0%) | 0 (0.0%) |
| Health Care & Social Assistance | 0 (0.0%) | 20 (100.0%) |
| Arts, Entertainment & Recreation | 0 (0.0%) | 0 (0.0%) |
| Accommodation & Food Services | 0 (0.0%) | 95 (100.0%) |
| Public Administration | 0 (0.0%) | 0 (0.0%) |
| Total | 38 (23.7%) | 122 (76.2%) |
Education in Flat Rock
School Enrollment in Flat Rock
The most common levels of schooling among the 59 students in Flat Rock are high school (38 | 64.4%), and college / undergraduate (21 | 35.6%).
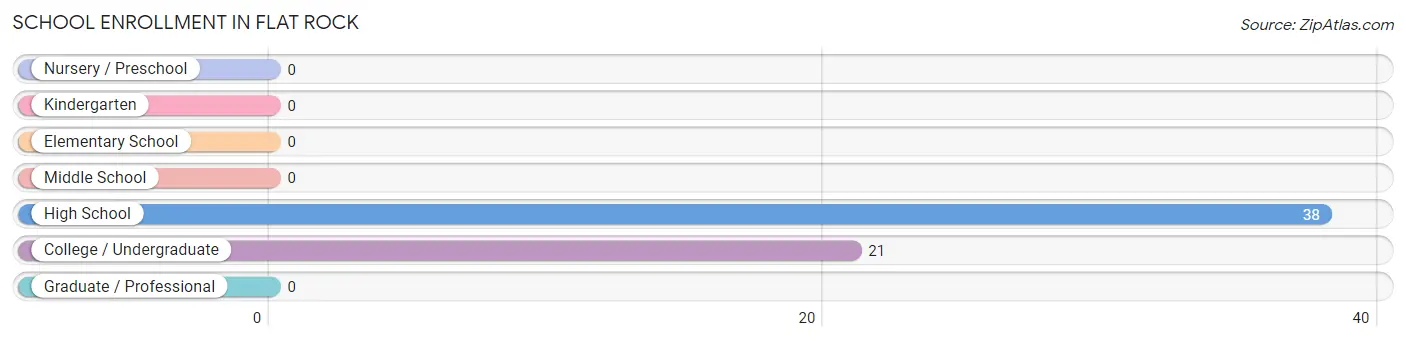
| School Level | # Students | % Students |
| Nursery / Preschool | 0 | 0.0% |
| Kindergarten | 0 | 0.0% |
| Elementary School | 0 | 0.0% |
| Middle School | 0 | 0.0% |
| High School | 38 | 64.4% |
| College / Undergraduate | 21 | 35.6% |
| Graduate / Professional | 0 | 0.0% |
| Total | 59 | 100.0% |
School Enrollment by Age by Funding Source in Flat Rock
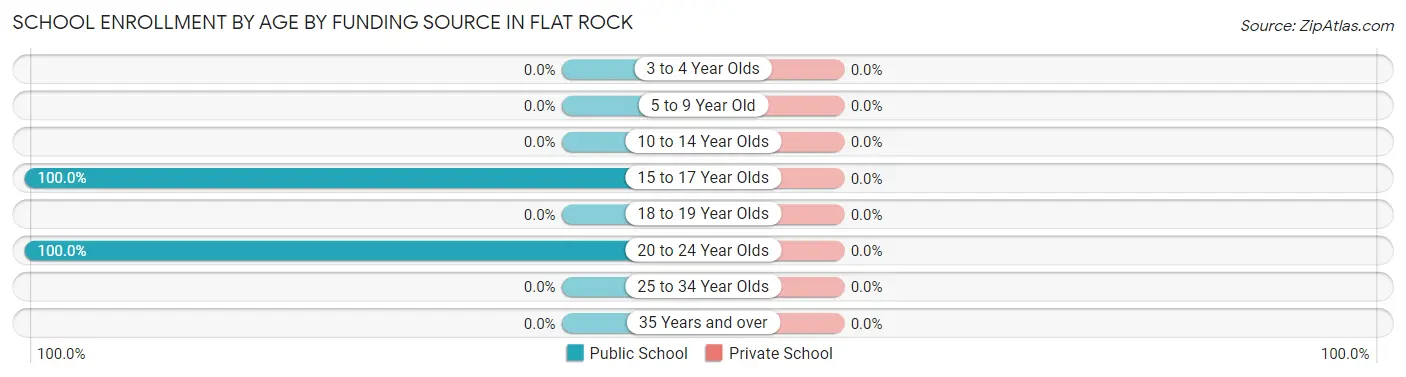
| Age Bracket | Public School | Private School |
| 3 to 4 Year Olds | 0 (0.0%) | 0 (0.0%) |
| 5 to 9 Year Old | 0 (0.0%) | 0 (0.0%) |
| 10 to 14 Year Olds | 0 (0.0%) | 0 (0.0%) |
| 15 to 17 Year Olds | 38 (100.0%) | 0 (0.0%) |
| 18 to 19 Year Olds | 0 (0.0%) | 0 (0.0%) |
| 20 to 24 Year Olds | 21 (100.0%) | 0 (0.0%) |
| 25 to 34 Year Olds | 0 (0.0%) | 0 (0.0%) |
| 35 Years and over | 0 (0.0%) | 0 (0.0%) |
| Total | 59 (100.0%) | 0 (0.0%) |
Educational Attainment by Field of Study in Flat Rock
Engineering (12 | 28.6%), science & technology (11 | 26.2%), psychology (9 | 21.4%), bio, nature & agricultural (8 | 19.1%), and social sciences (1 | 2.4%) are the most common fields of study among 42 individuals in Flat Rock who have obtained a bachelor's degree or higher.
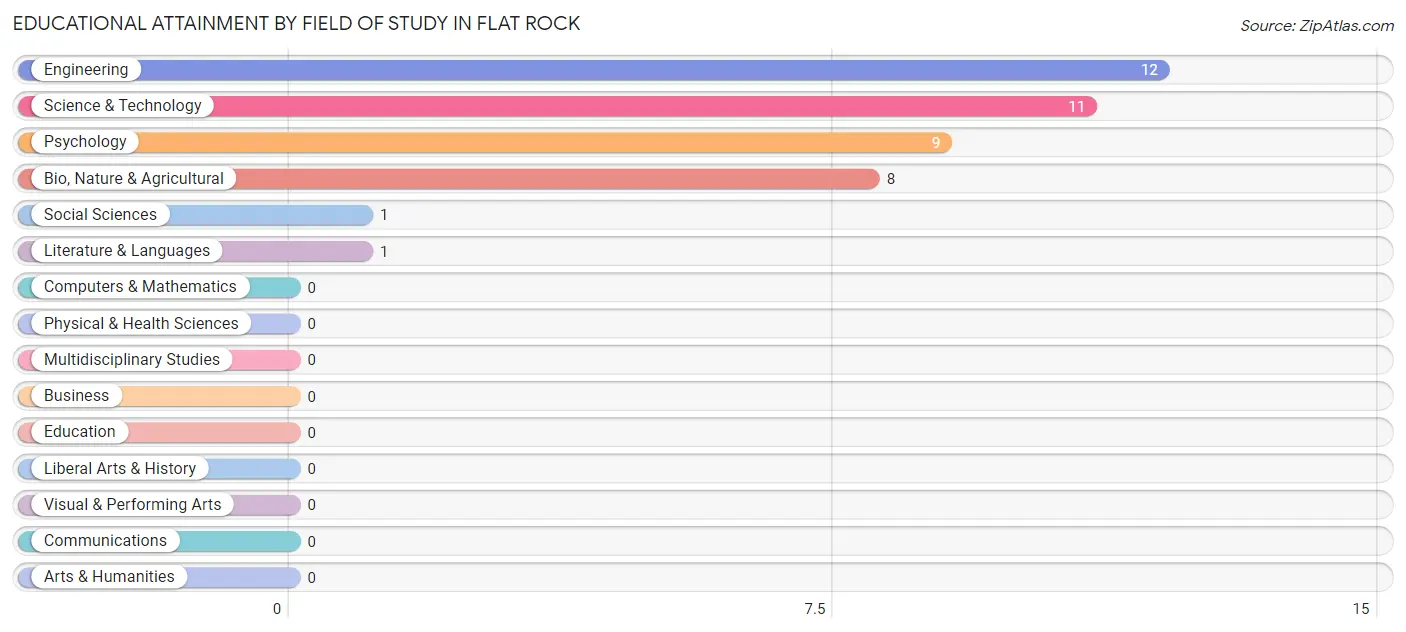
| Field of Study | # Graduates | % Graduates |
| Computers & Mathematics | 0 | 0.0% |
| Bio, Nature & Agricultural | 8 | 19.1% |
| Physical & Health Sciences | 0 | 0.0% |
| Psychology | 9 | 21.4% |
| Social Sciences | 1 | 2.4% |
| Engineering | 12 | 28.6% |
| Multidisciplinary Studies | 0 | 0.0% |
| Science & Technology | 11 | 26.2% |
| Business | 0 | 0.0% |
| Education | 0 | 0.0% |
| Literature & Languages | 1 | 2.4% |
| Liberal Arts & History | 0 | 0.0% |
| Visual & Performing Arts | 0 | 0.0% |
| Communications | 0 | 0.0% |
| Arts & Humanities | 0 | 0.0% |
| Total | 42 | 100.0% |
Transportation & Commute in Flat Rock
Vehicle Availability by Sex in Flat Rock
The most prevalent vehicle ownership categories in Flat Rock are males with 4 vehicles (15, accounting for 39.5%) and females with 4 vehicles (0, making up 12.3%).
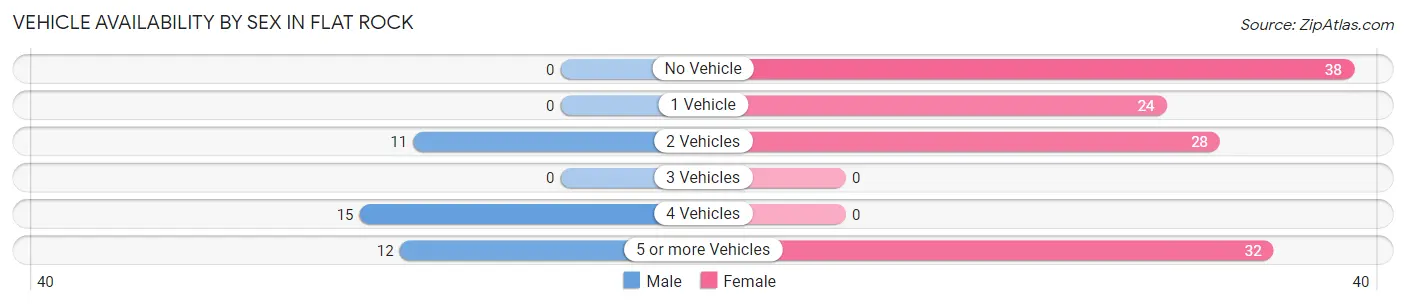
| Vehicles Available | Male | Female |
| No Vehicle | 0 (0.0%) | 38 (31.1%) |
| 1 Vehicle | 0 (0.0%) | 24 (19.7%) |
| 2 Vehicles | 11 (28.9%) | 28 (23.0%) |
| 3 Vehicles | 0 (0.0%) | 0 (0.0%) |
| 4 Vehicles | 15 (39.5%) | 0 (0.0%) |
| 5 or more Vehicles | 12 (31.6%) | 32 (26.2%) |
| Total | 38 (100.0%) | 122 (100.0%) |
Commute Time in Flat Rock
The most frequently occuring commute durations in Flat Rock are 10 to 14 minutes (42 commuters, 26.3%), 15 to 19 minutes (38 commuters, 23.7%), and 30 to 34 minutes (35 commuters, 21.9%).
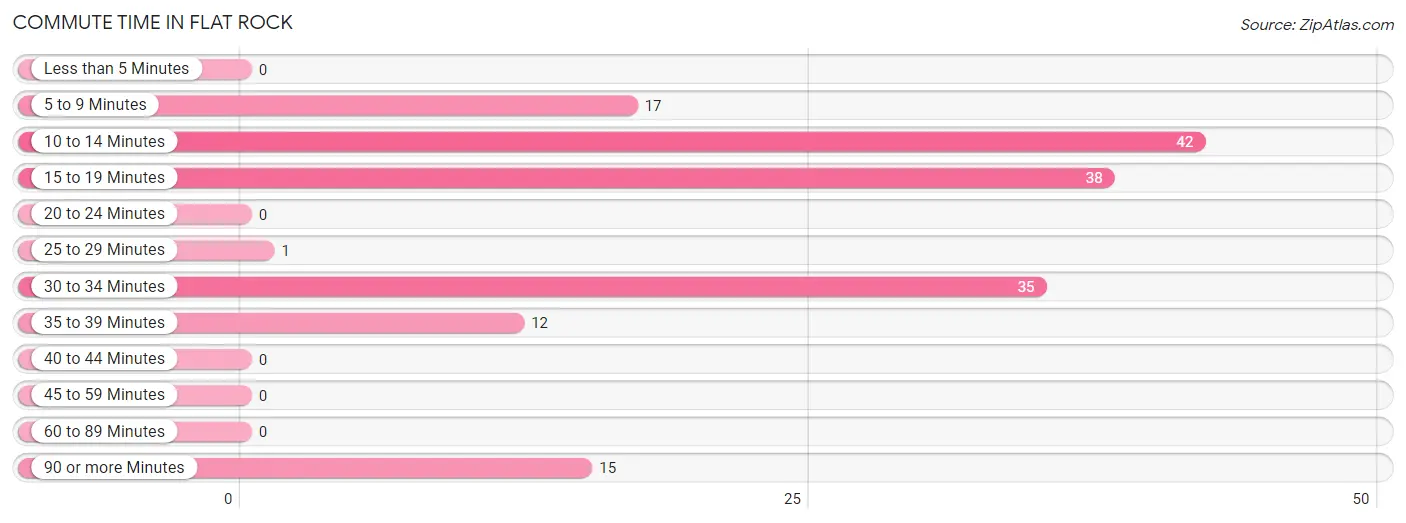
| Commute Time | # Commuters | % Commuters |
| Less than 5 Minutes | 0 | 0.0% |
| 5 to 9 Minutes | 17 | 10.6% |
| 10 to 14 Minutes | 42 | 26.3% |
| 15 to 19 Minutes | 38 | 23.7% |
| 20 to 24 Minutes | 0 | 0.0% |
| 25 to 29 Minutes | 1 | 0.6% |
| 30 to 34 Minutes | 35 | 21.9% |
| 35 to 39 Minutes | 12 | 7.5% |
| 40 to 44 Minutes | 0 | 0.0% |
| 45 to 59 Minutes | 0 | 0.0% |
| 60 to 89 Minutes | 0 | 0.0% |
| 90 or more Minutes | 15 | 9.4% |
Commute Time by Sex in Flat Rock
The most common commute times in Flat Rock are 90 or more minutes (15 commuters, 39.5%) for males and 15 to 19 minutes (38 commuters, 31.1%) for females.
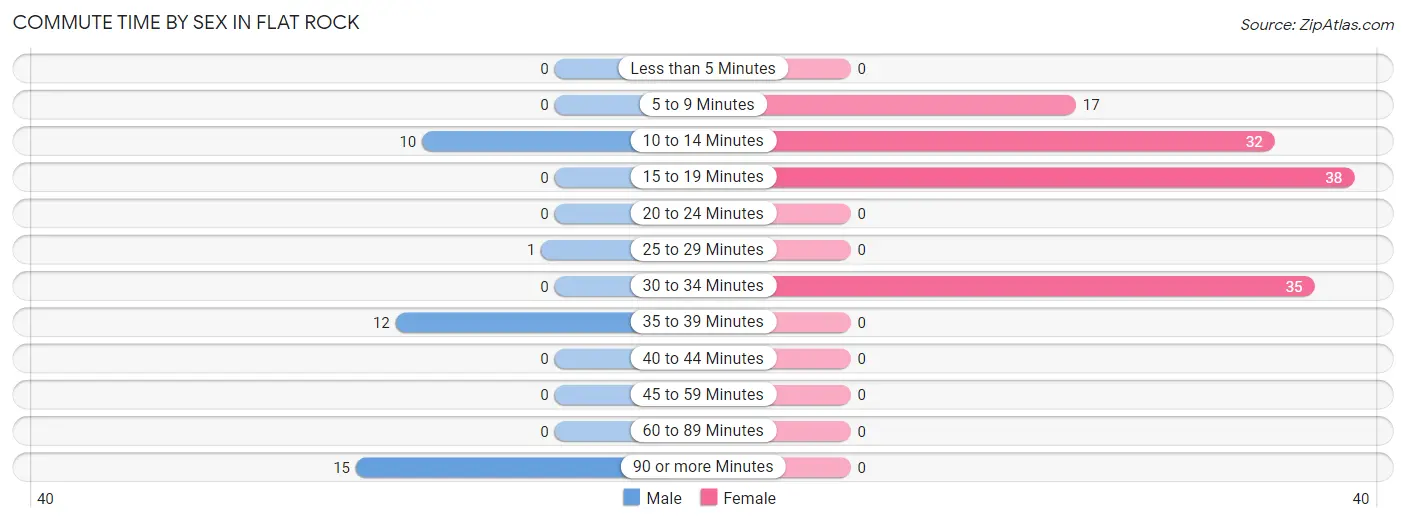
| Commute Time | Male | Female |
| Less than 5 Minutes | 0 (0.0%) | 0 (0.0%) |
| 5 to 9 Minutes | 0 (0.0%) | 17 (13.9%) |
| 10 to 14 Minutes | 10 (26.3%) | 32 (26.2%) |
| 15 to 19 Minutes | 0 (0.0%) | 38 (31.1%) |
| 20 to 24 Minutes | 0 (0.0%) | 0 (0.0%) |
| 25 to 29 Minutes | 1 (2.6%) | 0 (0.0%) |
| 30 to 34 Minutes | 0 (0.0%) | 35 (28.7%) |
| 35 to 39 Minutes | 12 (31.6%) | 0 (0.0%) |
| 40 to 44 Minutes | 0 (0.0%) | 0 (0.0%) |
| 45 to 59 Minutes | 0 (0.0%) | 0 (0.0%) |
| 60 to 89 Minutes | 0 (0.0%) | 0 (0.0%) |
| 90 or more Minutes | 15 (39.5%) | 0 (0.0%) |
Time of Departure to Work by Sex in Flat Rock
The most frequent times of departure to work in Flat Rock are 4:00 PM to 11:59 PM (15, 39.5%) for males and 12:00 PM to 3:59 PM (38, 31.1%) for females.
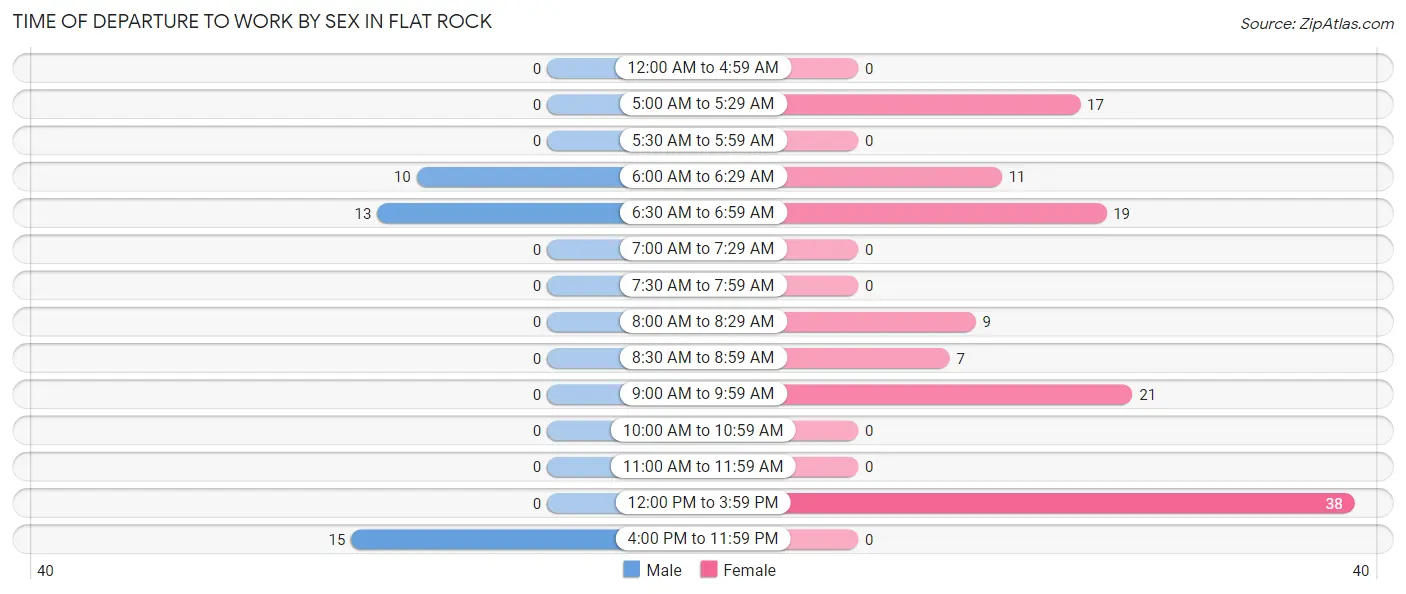
| Time of Departure | Male | Female |
| 12:00 AM to 4:59 AM | 0 (0.0%) | 0 (0.0%) |
| 5:00 AM to 5:29 AM | 0 (0.0%) | 17 (13.9%) |
| 5:30 AM to 5:59 AM | 0 (0.0%) | 0 (0.0%) |
| 6:00 AM to 6:29 AM | 10 (26.3%) | 11 (9.0%) |
| 6:30 AM to 6:59 AM | 13 (34.2%) | 19 (15.6%) |
| 7:00 AM to 7:29 AM | 0 (0.0%) | 0 (0.0%) |
| 7:30 AM to 7:59 AM | 0 (0.0%) | 0 (0.0%) |
| 8:00 AM to 8:29 AM | 0 (0.0%) | 9 (7.4%) |
| 8:30 AM to 8:59 AM | 0 (0.0%) | 7 (5.7%) |
| 9:00 AM to 9:59 AM | 0 (0.0%) | 21 (17.2%) |
| 10:00 AM to 10:59 AM | 0 (0.0%) | 0 (0.0%) |
| 11:00 AM to 11:59 AM | 0 (0.0%) | 0 (0.0%) |
| 12:00 PM to 3:59 PM | 0 (0.0%) | 38 (31.1%) |
| 4:00 PM to 11:59 PM | 15 (39.5%) | 0 (0.0%) |
| Total | 38 (100.0%) | 122 (100.0%) |
Housing Occupancy in Flat Rock
Occupancy by Ownership in Flat Rock
Of the total 107 dwellings in Flat Rock, owner-occupied units account for 45 (42.1%), while renter-occupied units make up 62 (57.9%).
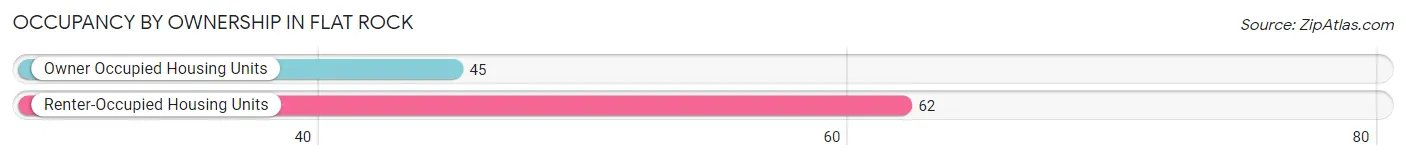
| Occupancy | # Housing Units | % Housing Units |
| Owner Occupied Housing Units | 45 | 42.1% |
| Renter-Occupied Housing Units | 62 | 57.9% |
| Total Occupied Housing Units | 107 | 100.0% |
Occupancy by Household Size in Flat Rock
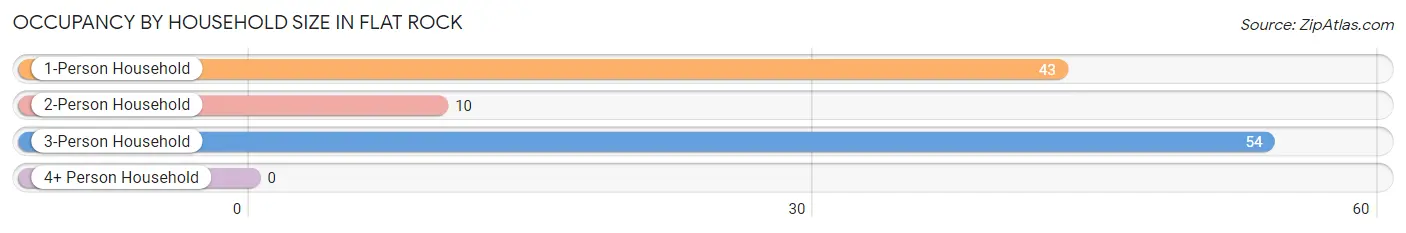
| Household Size | # Housing Units | % Housing Units |
| 1-Person Household | 43 | 40.2% |
| 2-Person Household | 10 | 9.3% |
| 3-Person Household | 54 | 50.5% |
| 4+ Person Household | 0 | 0.0% |
| Total Housing Units | 107 | 100.0% |
Occupancy by Ownership by Household Size in Flat Rock
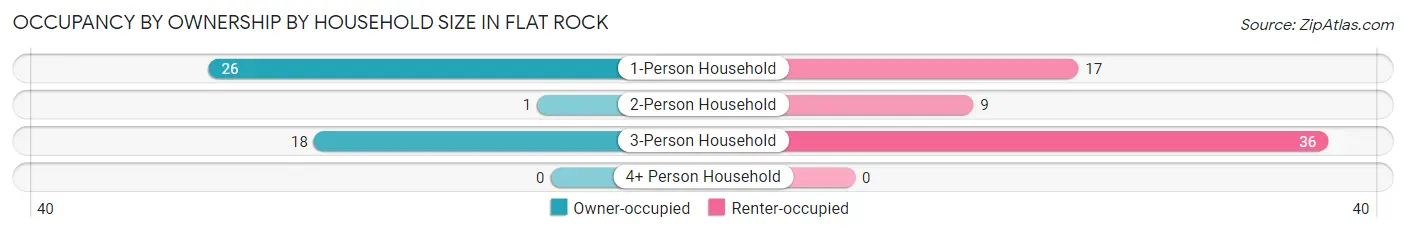
| Household Size | Owner-occupied | Renter-occupied |
| 1-Person Household | 26 (60.5%) | 17 (39.5%) |
| 2-Person Household | 1 (10.0%) | 9 (90.0%) |
| 3-Person Household | 18 (33.3%) | 36 (66.7%) |
| 4+ Person Household | 0 (0.0%) | 0 (0.0%) |
| Total Housing Units | 45 (42.1%) | 62 (57.9%) |
Occupancy by Educational Attainment in Flat Rock
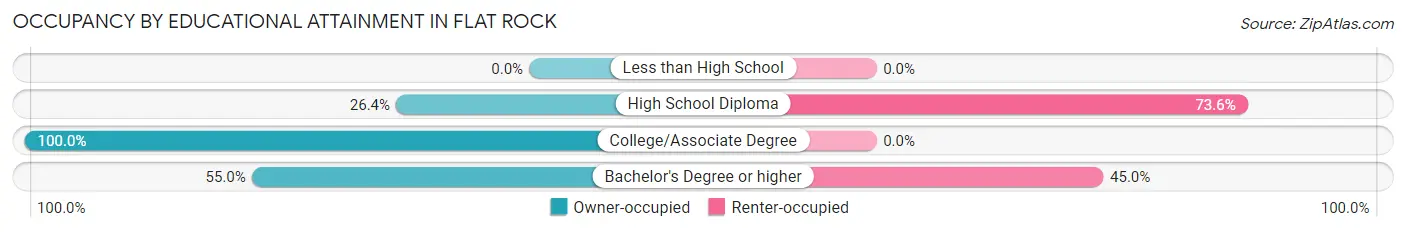
| Household Size | Owner-occupied | Renter-occupied |
| Less than High School | 0 (0.0%) | 0 (0.0%) |
| High School Diploma | 19 (26.4%) | 53 (73.6%) |
| College/Associate Degree | 15 (100.0%) | 0 (0.0%) |
| Bachelor's Degree or higher | 11 (55.0%) | 9 (45.0%) |
Occupancy by Age of Householder in Flat Rock
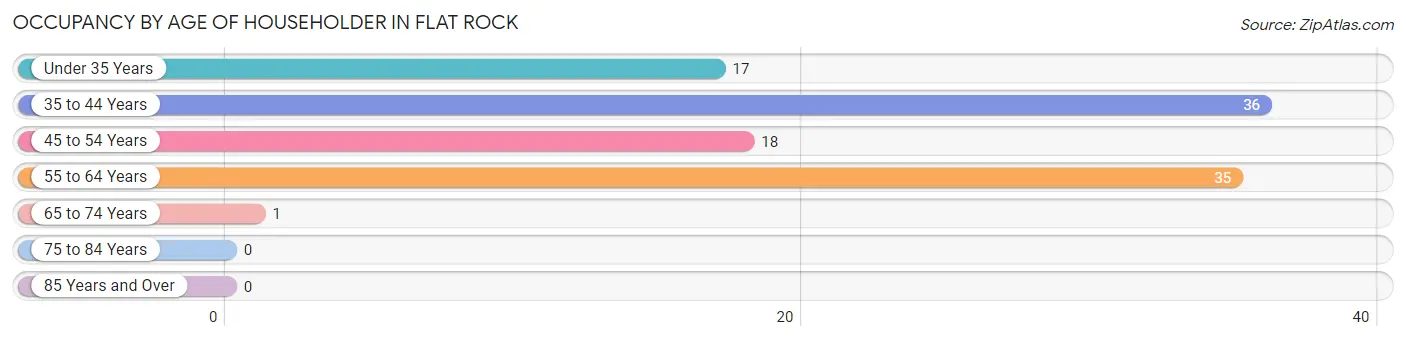
| Age Bracket | # Households | % Households |
| Under 35 Years | 17 | 15.9% |
| 35 to 44 Years | 36 | 33.6% |
| 45 to 54 Years | 18 | 16.8% |
| 55 to 64 Years | 35 | 32.7% |
| 65 to 74 Years | 1 | 0.9% |
| 75 to 84 Years | 0 | 0.0% |
| 85 Years and Over | 0 | 0.0% |
| Total | 107 | 100.0% |
Housing Finances in Flat Rock
Median Income by Occupancy in Flat Rock
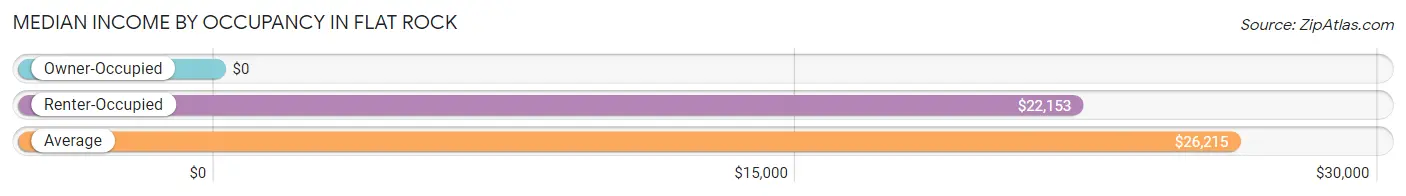
| Occupancy Type | # Households | Median Income |
| Owner-Occupied | 45 (42.1%) | $0 |
| Renter-Occupied | 62 (57.9%) | $22,153 |
| Average | 107 (100.0%) | $26,215 |
Occupancy by Householder Income Bracket in Flat Rock
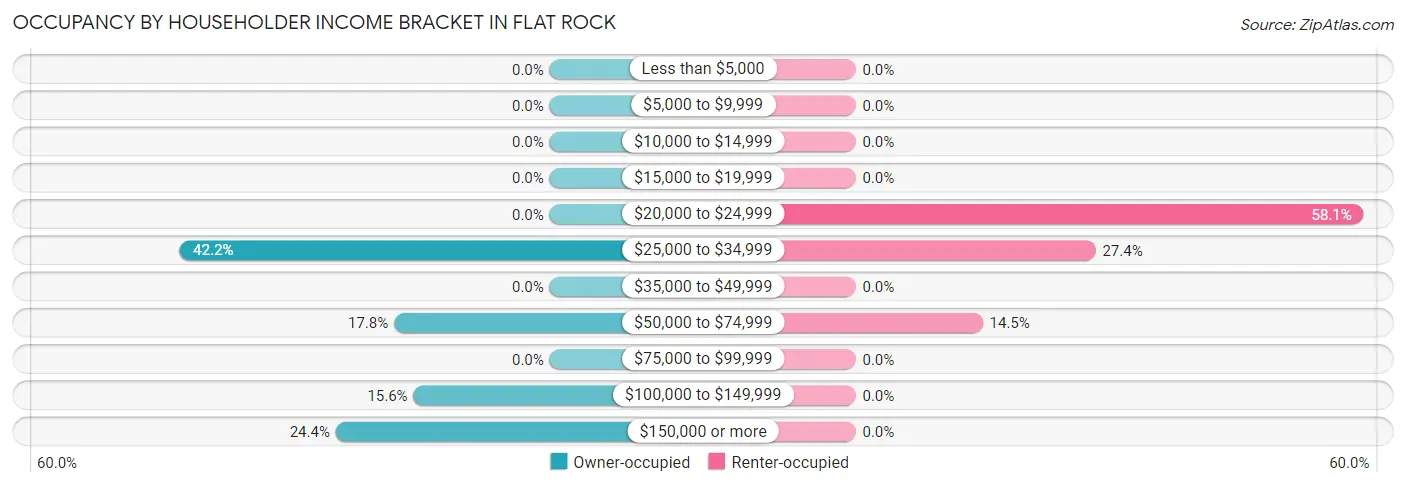
| Income Bracket | Owner-occupied | Renter-occupied |
| Less than $5,000 | 0 (0.0%) | 0 (0.0%) |
| $5,000 to $9,999 | 0 (0.0%) | 0 (0.0%) |
| $10,000 to $14,999 | 0 (0.0%) | 0 (0.0%) |
| $15,000 to $19,999 | 0 (0.0%) | 0 (0.0%) |
| $20,000 to $24,999 | 0 (0.0%) | 36 (58.1%) |
| $25,000 to $34,999 | 19 (42.2%) | 17 (27.4%) |
| $35,000 to $49,999 | 0 (0.0%) | 0 (0.0%) |
| $50,000 to $74,999 | 8 (17.8%) | 9 (14.5%) |
| $75,000 to $99,999 | 0 (0.0%) | 0 (0.0%) |
| $100,000 to $149,999 | 7 (15.6%) | 0 (0.0%) |
| $150,000 or more | 11 (24.4%) | 0 (0.0%) |
| Total | 45 (100.0%) | 62 (100.0%) |
Monthly Housing Cost Tiers in Flat Rock
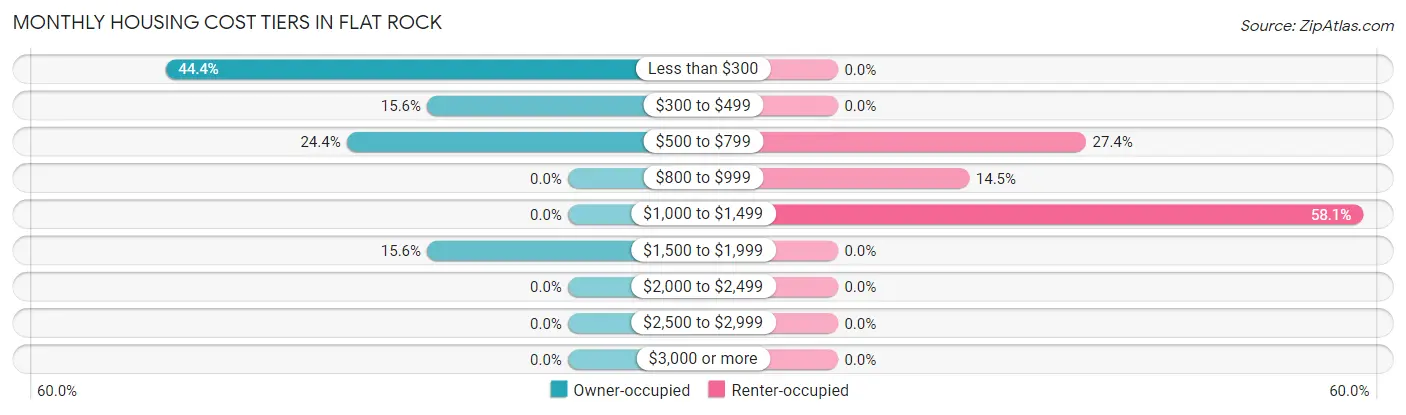
| Monthly Cost | Owner-occupied | Renter-occupied |
| Less than $300 | 20 (44.4%) | 0 (0.0%) |
| $300 to $499 | 7 (15.6%) | 0 (0.0%) |
| $500 to $799 | 11 (24.4%) | 17 (27.4%) |
| $800 to $999 | 0 (0.0%) | 9 (14.5%) |
| $1,000 to $1,499 | 0 (0.0%) | 36 (58.1%) |
| $1,500 to $1,999 | 7 (15.6%) | 0 (0.0%) |
| $2,000 to $2,499 | 0 (0.0%) | 0 (0.0%) |
| $2,500 to $2,999 | 0 (0.0%) | 0 (0.0%) |
| $3,000 or more | 0 (0.0%) | 0 (0.0%) |
| Total | 45 (100.0%) | 62 (100.0%) |
Physical Housing Characteristics in Flat Rock
Housing Structures in Flat Rock
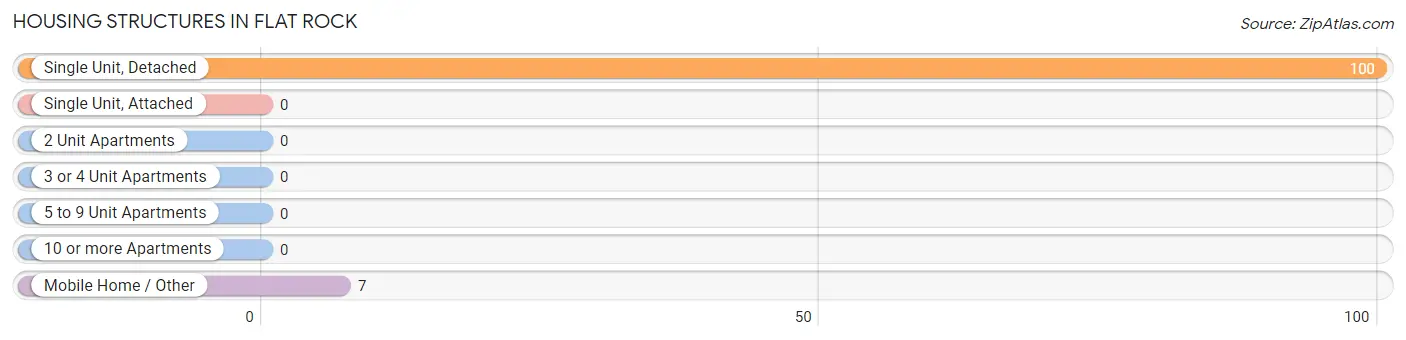
| Structure Type | # Housing Units | % Housing Units |
| Single Unit, Detached | 100 | 93.5% |
| Single Unit, Attached | 0 | 0.0% |
| 2 Unit Apartments | 0 | 0.0% |
| 3 or 4 Unit Apartments | 0 | 0.0% |
| 5 to 9 Unit Apartments | 0 | 0.0% |
| 10 or more Apartments | 0 | 0.0% |
| Mobile Home / Other | 7 | 6.5% |
| Total | 107 | 100.0% |
Housing Structures by Occupancy in Flat Rock
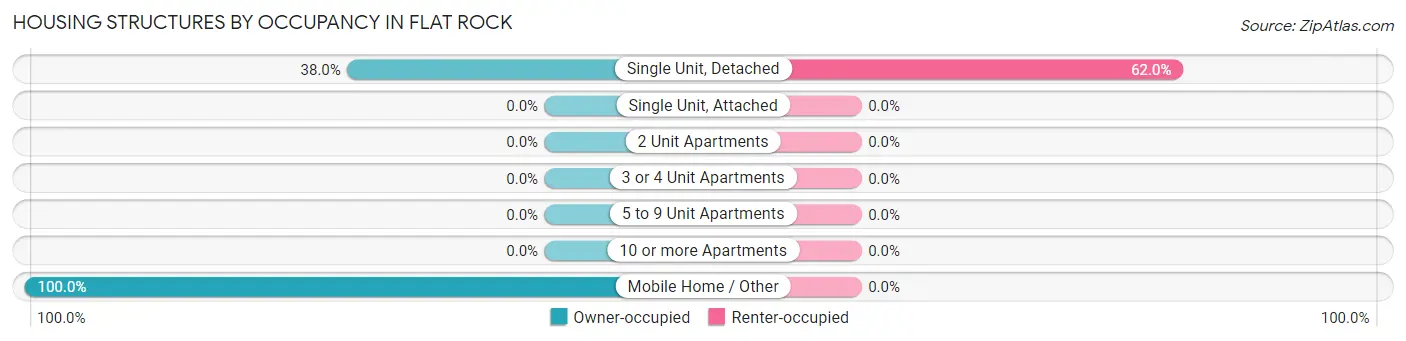
| Structure Type | Owner-occupied | Renter-occupied |
| Single Unit, Detached | 38 (38.0%) | 62 (62.0%) |
| Single Unit, Attached | 0 (0.0%) | 0 (0.0%) |
| 2 Unit Apartments | 0 (0.0%) | 0 (0.0%) |
| 3 or 4 Unit Apartments | 0 (0.0%) | 0 (0.0%) |
| 5 to 9 Unit Apartments | 0 (0.0%) | 0 (0.0%) |
| 10 or more Apartments | 0 (0.0%) | 0 (0.0%) |
| Mobile Home / Other | 7 (100.0%) | 0 (0.0%) |
| Total | 45 (42.1%) | 62 (57.9%) |
Housing Structures by Number of Rooms in Flat Rock
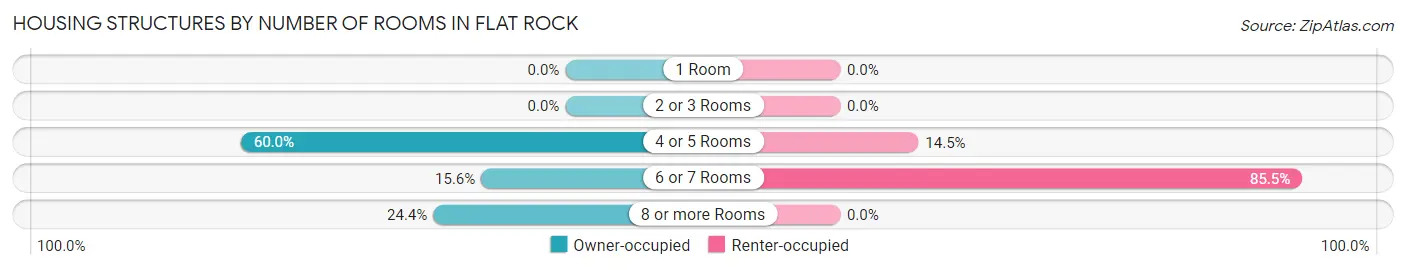
| Number of Rooms | Owner-occupied | Renter-occupied |
| 1 Room | 0 (0.0%) | 0 (0.0%) |
| 2 or 3 Rooms | 0 (0.0%) | 0 (0.0%) |
| 4 or 5 Rooms | 27 (60.0%) | 9 (14.5%) |
| 6 or 7 Rooms | 7 (15.6%) | 53 (85.5%) |
| 8 or more Rooms | 11 (24.4%) | 0 (0.0%) |
| Total | 45 (100.0%) | 62 (100.0%) |
Housing Structure by Heating Type in Flat Rock
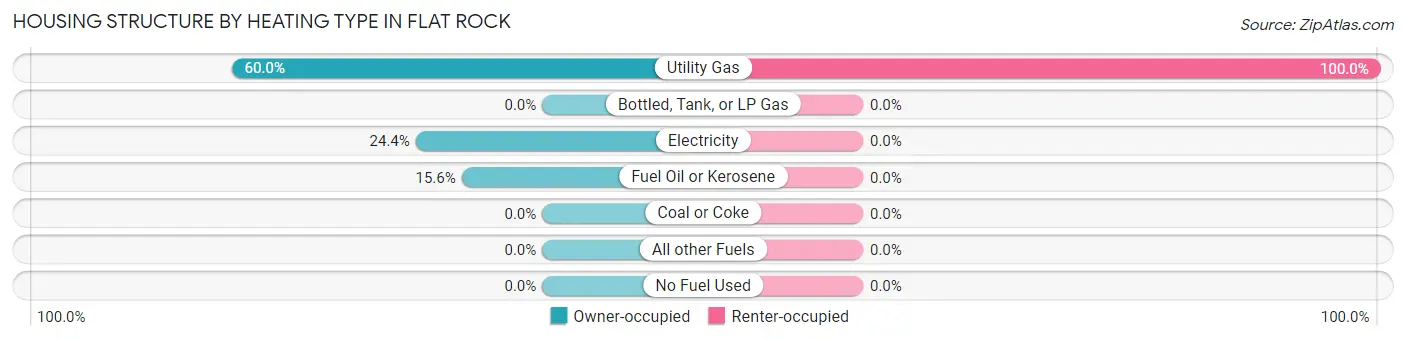
| Heating Type | Owner-occupied | Renter-occupied |
| Utility Gas | 27 (60.0%) | 62 (100.0%) |
| Bottled, Tank, or LP Gas | 0 (0.0%) | 0 (0.0%) |
| Electricity | 11 (24.4%) | 0 (0.0%) |
| Fuel Oil or Kerosene | 7 (15.6%) | 0 (0.0%) |
| Coal or Coke | 0 (0.0%) | 0 (0.0%) |
| All other Fuels | 0 (0.0%) | 0 (0.0%) |
| No Fuel Used | 0 (0.0%) | 0 (0.0%) |
| Total | 45 (100.0%) | 62 (100.0%) |
Household Vehicle Usage in Flat Rock
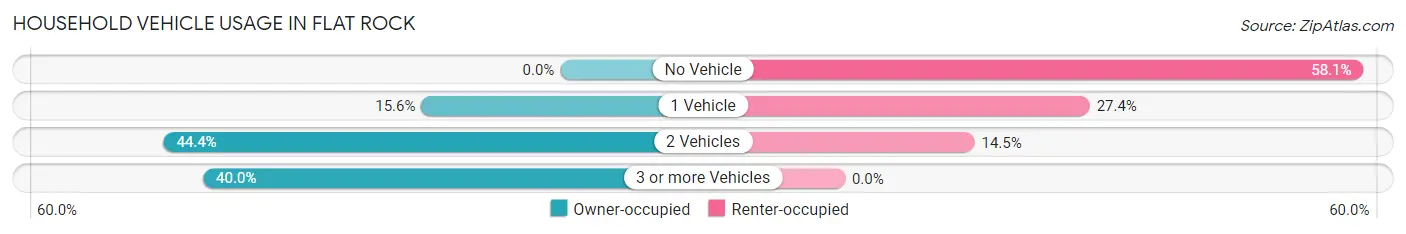
| Vehicles per Household | Owner-occupied | Renter-occupied |
| No Vehicle | 0 (0.0%) | 36 (58.1%) |
| 1 Vehicle | 7 (15.6%) | 17 (27.4%) |
| 2 Vehicles | 20 (44.4%) | 9 (14.5%) |
| 3 or more Vehicles | 18 (40.0%) | 0 (0.0%) |
| Total | 45 (100.0%) | 62 (100.0%) |
Real Estate & Mortgages in Flat Rock
Real Estate and Mortgage Overview in Flat Rock
| Characteristic | Without Mortgage | With Mortgage |
| Housing Units | 38 | 7 |
| Median Property Value | - | - |
| Median Household Income | - | - |
| Monthly Housing Costs | - | - |
| Real Estate Taxes | - | - |
Property Value by Mortgage Status in Flat Rock
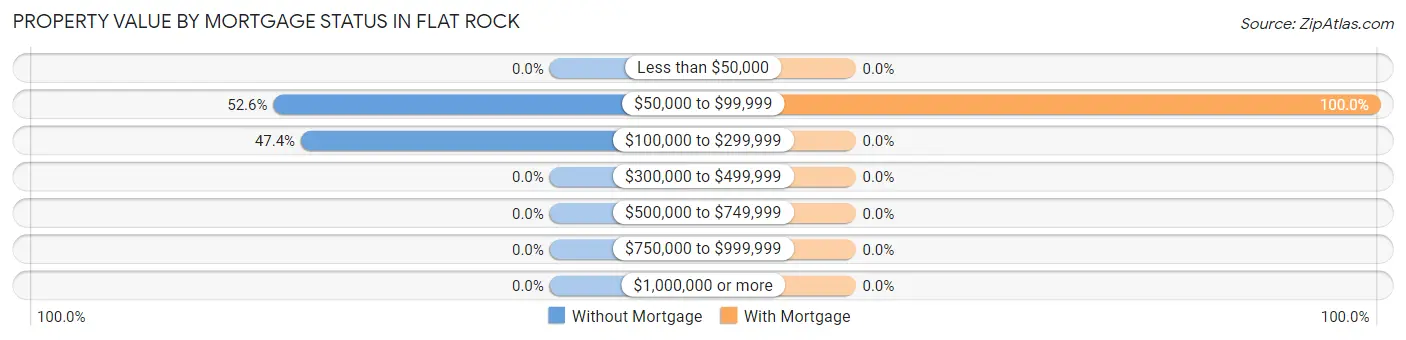
| Property Value | Without Mortgage | With Mortgage |
| Less than $50,000 | 0 (0.0%) | 0 (0.0%) |
| $50,000 to $99,999 | 20 (52.6%) | 7 (100.0%) |
| $100,000 to $299,999 | 18 (47.4%) | 0 (0.0%) |
| $300,000 to $499,999 | 0 (0.0%) | 0 (0.0%) |
| $500,000 to $749,999 | 0 (0.0%) | 0 (0.0%) |
| $750,000 to $999,999 | 0 (0.0%) | 0 (0.0%) |
| $1,000,000 or more | 0 (0.0%) | 0 (0.0%) |
| Total | 38 (100.0%) | 7 (100.0%) |
Household Income by Mortgage Status in Flat Rock
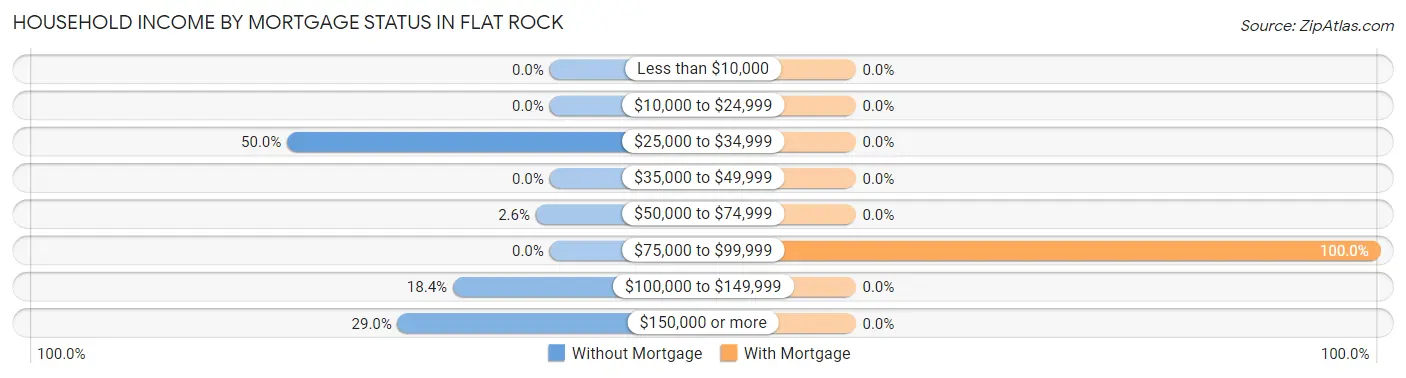
| Household Income | Without Mortgage | With Mortgage |
| Less than $10,000 | 0 (0.0%) | 0 (0.0%) |
| $10,000 to $24,999 | 0 (0.0%) | 0 (0.0%) |
| $25,000 to $34,999 | 19 (50.0%) | 0 (0.0%) |
| $35,000 to $49,999 | 0 (0.0%) | 0 (0.0%) |
| $50,000 to $74,999 | 1 (2.6%) | 0 (0.0%) |
| $75,000 to $99,999 | 0 (0.0%) | 7 (100.0%) |
| $100,000 to $149,999 | 7 (18.4%) | 0 (0.0%) |
| $150,000 or more | 11 (28.9%) | 0 (0.0%) |
| Total | 38 (100.0%) | 7 (100.0%) |
Property Value to Household Income Ratio in Flat Rock
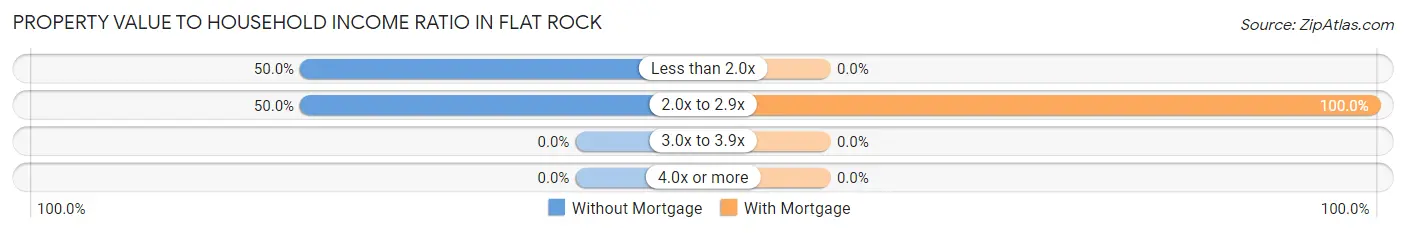
| Value-to-Income Ratio | Without Mortgage | With Mortgage |
| Less than 2.0x | 19 (50.0%) | 0 (0.0%) |
| 2.0x to 2.9x | 19 (50.0%) | 7 (100.0%) |
| 3.0x to 3.9x | 0 (0.0%) | 0 (0.0%) |
| 4.0x or more | 0 (0.0%) | 0 (0.0%) |
| Total | 38 (100.0%) | 7 (100.0%) |
Real Estate Taxes by Mortgage Status in Flat Rock
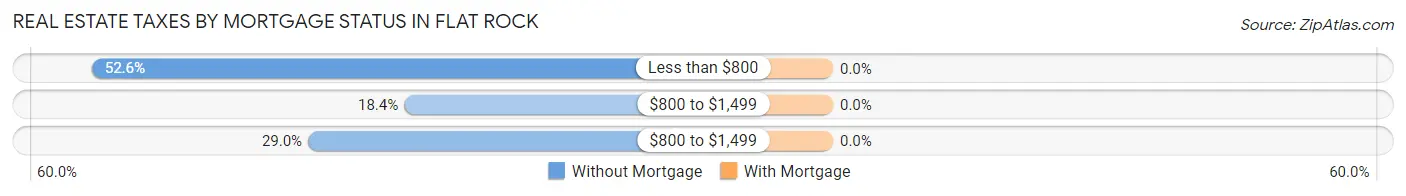
| Property Taxes | Without Mortgage | With Mortgage |
| Less than $800 | 20 (52.6%) | 0 (0.0%) |
| $800 to $1,499 | 7 (18.4%) | 0 (0.0%) |
| $800 to $1,499 | 11 (28.9%) | 0 (0.0%) |
| Total | 38 (100.0%) | 7 (100.0%) |
Health & Disability in Flat Rock
Health Insurance Coverage by Age in Flat Rock
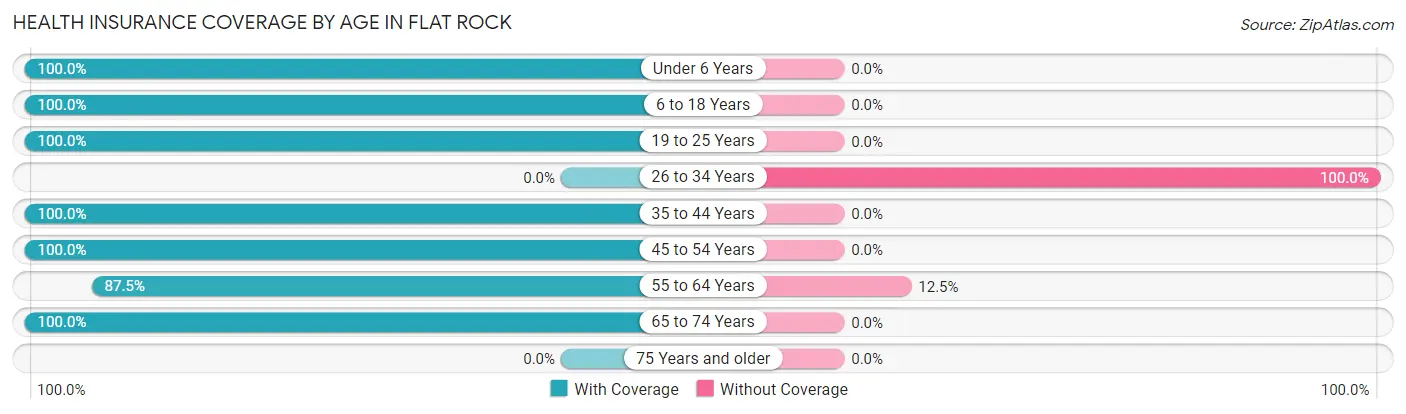
| Age Bracket | With Coverage | Without Coverage |
| Under 6 Years | 16 (100.0%) | 0 (0.0%) |
| 6 to 18 Years | 38 (100.0%) | 0 (0.0%) |
| 19 to 25 Years | 38 (100.0%) | 0 (0.0%) |
| 26 to 34 Years | 0 (0.0%) | 8 (100.0%) |
| 35 to 44 Years | 37 (100.0%) | 0 (0.0%) |
| 45 to 54 Years | 36 (100.0%) | 0 (0.0%) |
| 55 to 64 Years | 70 (87.5%) | 10 (12.5%) |
| 65 to 74 Years | 1 (100.0%) | 0 (0.0%) |
| 75 Years and older | 0 (0.0%) | 0 (0.0%) |
| Total | 236 (92.9%) | 18 (7.1%) |
Health Insurance Coverage by Citizenship Status in Flat Rock
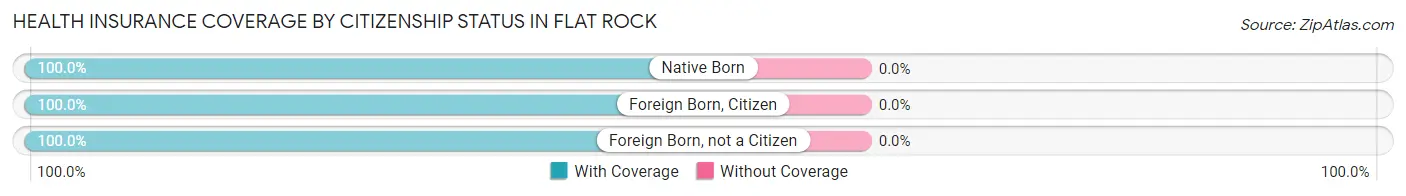
| Citizenship Status | With Coverage | Without Coverage |
| Native Born | 16 (100.0%) | 0 (0.0%) |
| Foreign Born, Citizen | 38 (100.0%) | 0 (0.0%) |
| Foreign Born, not a Citizen | 38 (100.0%) | 0 (0.0%) |
Health Insurance Coverage by Household Income in Flat Rock
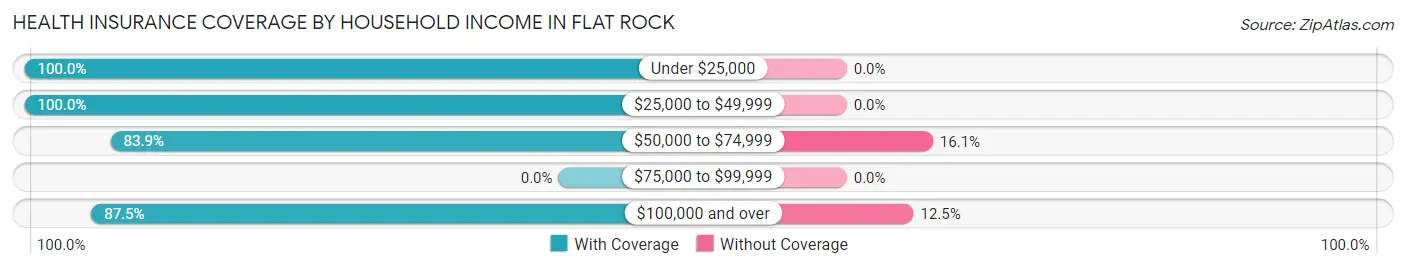
| Household Income | With Coverage | Without Coverage |
| Under $25,000 | 90 (100.0%) | 0 (0.0%) |
| $25,000 to $49,999 | 36 (100.0%) | 0 (0.0%) |
| $50,000 to $74,999 | 52 (83.9%) | 10 (16.1%) |
| $75,000 to $99,999 | 0 (0.0%) | 0 (0.0%) |
| $100,000 and over | 56 (87.5%) | 8 (12.5%) |
Public vs Private Health Insurance Coverage by Age in Flat Rock
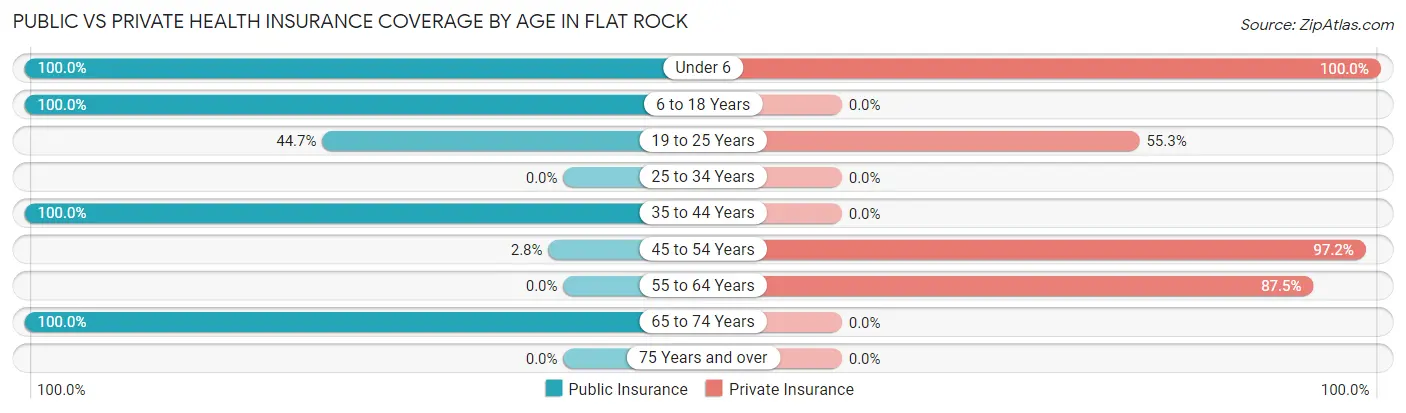
| Age Bracket | Public Insurance | Private Insurance |
| Under 6 | 16 (100.0%) | 16 (100.0%) |
| 6 to 18 Years | 38 (100.0%) | 0 (0.0%) |
| 19 to 25 Years | 17 (44.7%) | 21 (55.3%) |
| 25 to 34 Years | 0 (0.0%) | 0 (0.0%) |
| 35 to 44 Years | 37 (100.0%) | 0 (0.0%) |
| 45 to 54 Years | 1 (2.8%) | 35 (97.2%) |
| 55 to 64 Years | 0 (0.0%) | 70 (87.5%) |
| 65 to 74 Years | 1 (100.0%) | 0 (0.0%) |
| 75 Years and over | 0 (0.0%) | 0 (0.0%) |
| Total | 110 (43.3%) | 142 (55.9%) |
Disability Status by Sex by Age in Flat Rock
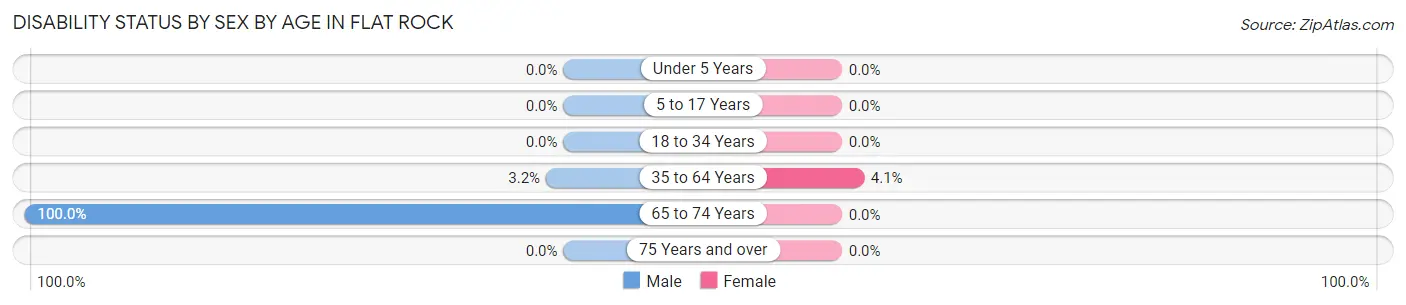
| Age Bracket | Male | Female |
| Under 5 Years | 0 (0.0%) | 0 (0.0%) |
| 5 to 17 Years | 0 (0.0%) | 0 (0.0%) |
| 18 to 34 Years | 0 (0.0%) | 0 (0.0%) |
| 35 to 64 Years | 1 (3.2%) | 5 (4.1%) |
| 65 to 74 Years | 1 (100.0%) | 0 (0.0%) |
| 75 Years and over | 0 (0.0%) | 0 (0.0%) |
Disability Class by Sex by Age in Flat Rock
Disability Class: Hearing Difficulty
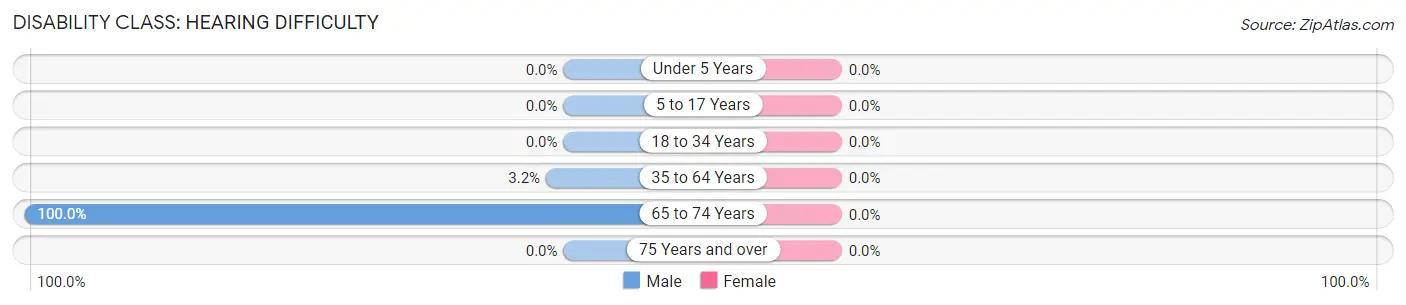
| Age Bracket | Male | Female |
| Under 5 Years | 0 (0.0%) | 0 (0.0%) |
| 5 to 17 Years | 0 (0.0%) | 0 (0.0%) |
| 18 to 34 Years | 0 (0.0%) | 0 (0.0%) |
| 35 to 64 Years | 1 (3.2%) | 0 (0.0%) |
| 65 to 74 Years | 1 (100.0%) | 0 (0.0%) |
| 75 Years and over | 0 (0.0%) | 0 (0.0%) |
Disability Class: Vision Difficulty
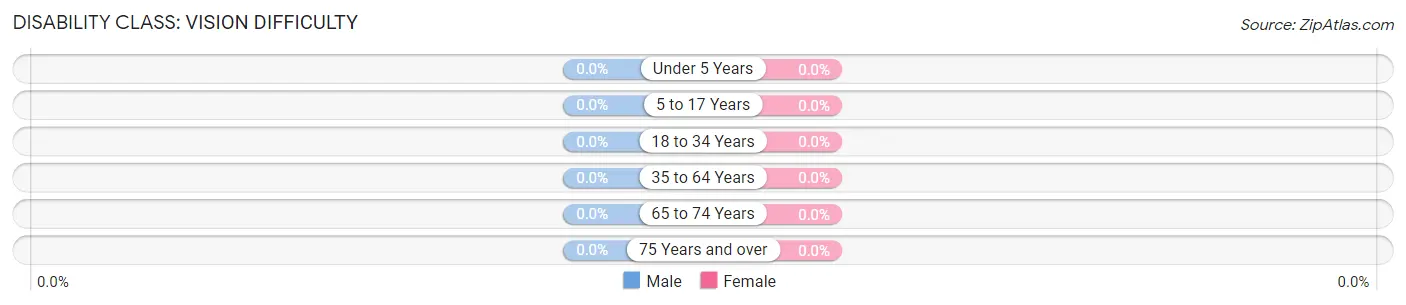
| Age Bracket | Male | Female |
| Under 5 Years | 0 (0.0%) | 0 (0.0%) |
| 5 to 17 Years | 0 (0.0%) | 0 (0.0%) |
| 18 to 34 Years | 0 (0.0%) | 0 (0.0%) |
| 35 to 64 Years | 0 (0.0%) | 0 (0.0%) |
| 65 to 74 Years | 0 (0.0%) | 0 (0.0%) |
| 75 Years and over | 0 (0.0%) | 0 (0.0%) |
Disability Class: Cognitive Difficulty
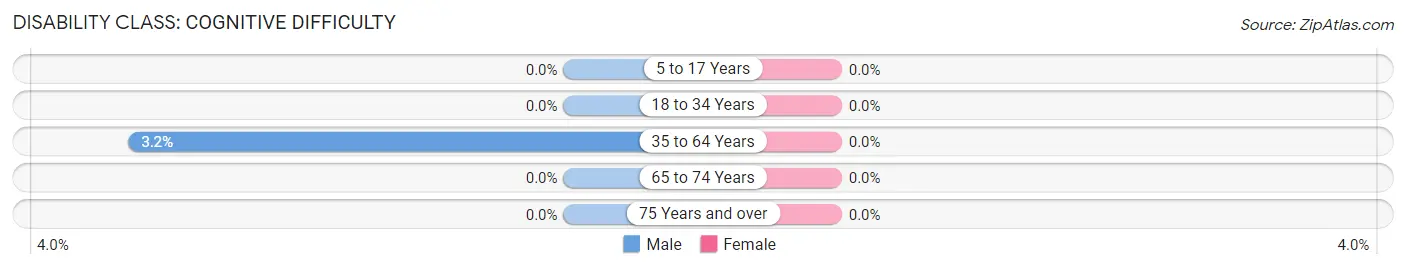
| Age Bracket | Male | Female |
| 5 to 17 Years | 0 (0.0%) | 0 (0.0%) |
| 18 to 34 Years | 0 (0.0%) | 0 (0.0%) |
| 35 to 64 Years | 1 (3.2%) | 0 (0.0%) |
| 65 to 74 Years | 0 (0.0%) | 0 (0.0%) |
| 75 Years and over | 0 (0.0%) | 0 (0.0%) |
Disability Class: Ambulatory Difficulty
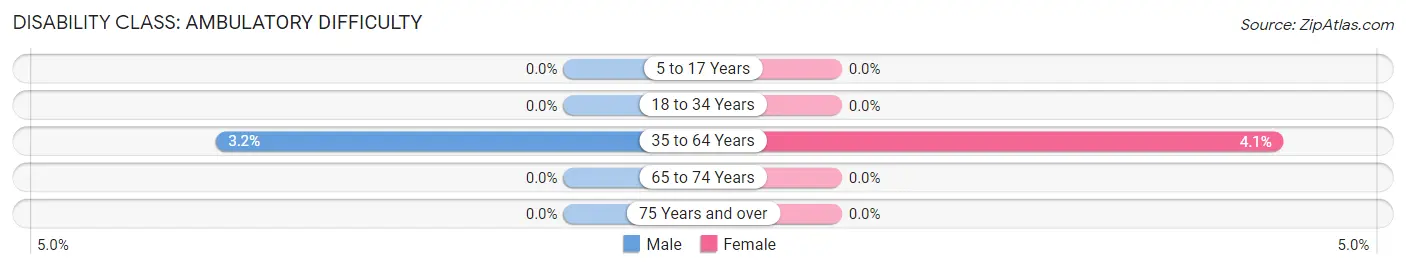
| Age Bracket | Male | Female |
| 5 to 17 Years | 0 (0.0%) | 0 (0.0%) |
| 18 to 34 Years | 0 (0.0%) | 0 (0.0%) |
| 35 to 64 Years | 1 (3.2%) | 5 (4.1%) |
| 65 to 74 Years | 0 (0.0%) | 0 (0.0%) |
| 75 Years and over | 0 (0.0%) | 0 (0.0%) |
Disability Class: Self-Care Difficulty
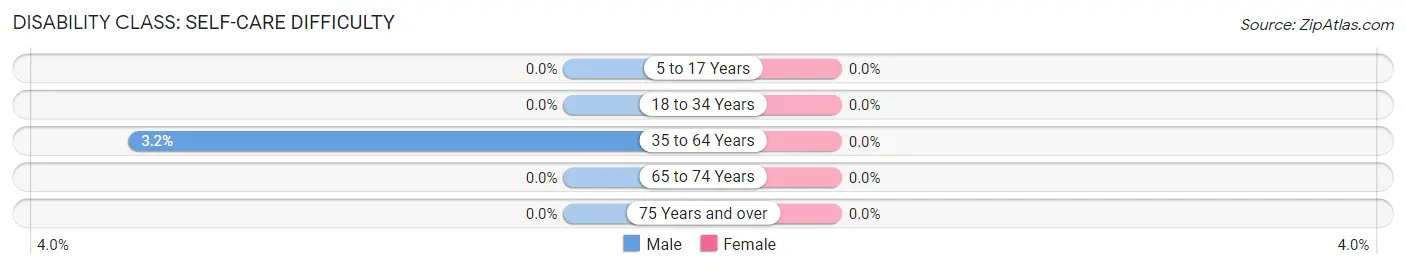
| Age Bracket | Male | Female |
| 5 to 17 Years | 0 (0.0%) | 0 (0.0%) |
| 18 to 34 Years | 0 (0.0%) | 0 (0.0%) |
| 35 to 64 Years | 1 (3.2%) | 0 (0.0%) |
| 65 to 74 Years | 0 (0.0%) | 0 (0.0%) |
| 75 Years and over | 0 (0.0%) | 0 (0.0%) |
Technology Access in Flat Rock
Computing Device Access in Flat Rock
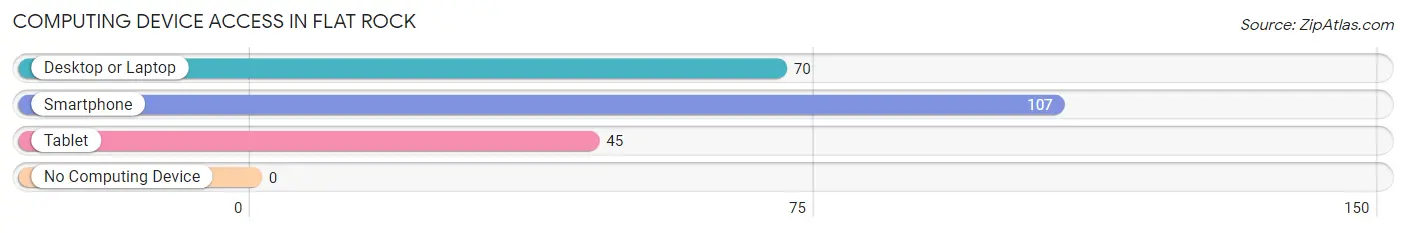
| Device Type | # Households | % Households |
| Desktop or Laptop | 70 | 65.4% |
| Smartphone | 107 | 100.0% |
| Tablet | 45 | 42.1% |
| No Computing Device | 0 | 0.0% |
| Total | 107 | 100.0% |
Internet Access in Flat Rock
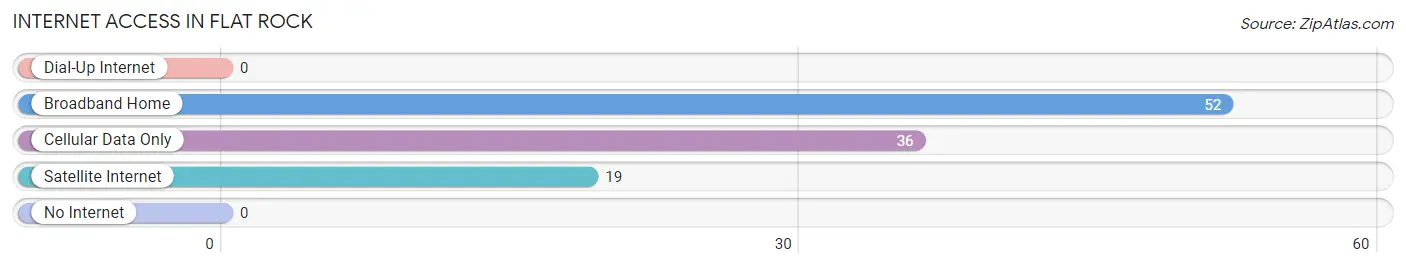
| Internet Type | # Households | % Households |
| Dial-Up Internet | 0 | 0.0% |
| Broadband Home | 52 | 48.6% |
| Cellular Data Only | 36 | 33.6% |
| Satellite Internet | 19 | 17.8% |
| No Internet | 0 | 0.0% |
| Total | 107 | 100.0% |
Flat Rock Summary
Flat Rock is a small village located in the state of Ohio, in the United States. It is situated in the southeastern part of the state, in the county of Seneca. The village is located on the banks of the Sandusky River, and is part of the Tiffin Micropolitan Statistical Area. As of the 2010 census, the population of Flat Rock was 1,845.
History
Flat Rock was first settled in 1817 by a group of settlers from Pennsylvania. The village was originally known as “Flat Rock Settlement”, and was named after the flat rocks that were found in the area. The village was officially incorporated in 1837.
In the early years of the village, the economy was largely based on agriculture. The village was also home to several mills, which were powered by the Sandusky River. The village was also home to a number of small businesses, such as blacksmiths, carpenters, and general stores.
In the late 19th century, the village began to experience a period of growth. The population of the village increased from just over 500 in 1880 to nearly 1,000 in 1900. This growth was largely due to the construction of the Toledo and Ohio Central Railroad, which ran through the village.
Geography
Flat Rock is located at 40°45'N, 83°14'W (40.75, -83.23). The village is situated on the banks of the Sandusky River, and is part of the Tiffin Micropolitan Statistical Area. The village has a total area of 1.2 square miles, all of which is land.
The village is located in a rural area, and is surrounded by farmland. The nearest major city is Toledo, which is located about 40 miles to the north.
Economy
The economy of Flat Rock is largely based on agriculture. The village is home to several farms, which produce a variety of crops, including corn, soybeans, and wheat. The village is also home to several small businesses, such as restaurants, convenience stores, and auto repair shops.
Demographics
As of the 2010 census, the population of Flat Rock was 1,845. The racial makeup of the village was 97.2% White, 0.7% African American, 0.2% Native American, 0.2% Asian, 0.1% Pacific Islander, 0.3% from other races, and 1.3% from two or more races. Hispanic or Latino of any race were 1.2% of the population.
The median income for a household in the village was $41,250, and the median income for a family was $48,750. The per capita income for the village was $19,945. About 8.2% of families and 10.2% of the population were below the poverty line, including 14.2% of those under age 18 and 5.2% of those age 65 or over.
Common Questions
What is Per Capita Income in Flat Rock?
Per Capita income in Flat Rock is $23,710.
What is the Median Household income in Flat Rock?
Median Household Income in Flat Rock is $26,215.
What is Inequality or Gini Index in Flat Rock?
Inequality or Gini Index in Flat Rock is 0.45.
What is the Total Population of Flat Rock?
Total Population of Flat Rock is 293.
What is the Total Male Population of Flat Rock?
Total Male Population of Flat Rock is 79.
What is the Total Female Population of Flat Rock?
Total Female Population of Flat Rock is 214.
What is the Ratio of Males per 100 Females in Flat Rock?
There are 36.92 Males per 100 Females in Flat Rock.
What is the Ratio of Females per 100 Males in Flat Rock?
There are 270.89 Females per 100 Males in Flat Rock.
What is the Median Population Age in Flat Rock?
Median Population Age in Flat Rock is 50.4 Years.
What is the Average Family Size in Flat Rock
Average Family Size in Flat Rock is 3.5 People.
What is the Average Household Size in Flat Rock
Average Household Size in Flat Rock is 2.4 People.
How Large is the Labor Force in Flat Rock?
There are 160 People in the Labor Forcein in Flat Rock.
What is the Percentage of People in the Labor Force in Flat Rock?
57.8% of People are in the Labor Force in Flat Rock.