Zip Codes with the Highest Percentage of Population Employed in Computer, Engineering & Science in Dayton, OH
RELATED REPORTS & OPTIONS
Computer, Engineering & Science
Dayton
Compare Zip Codes
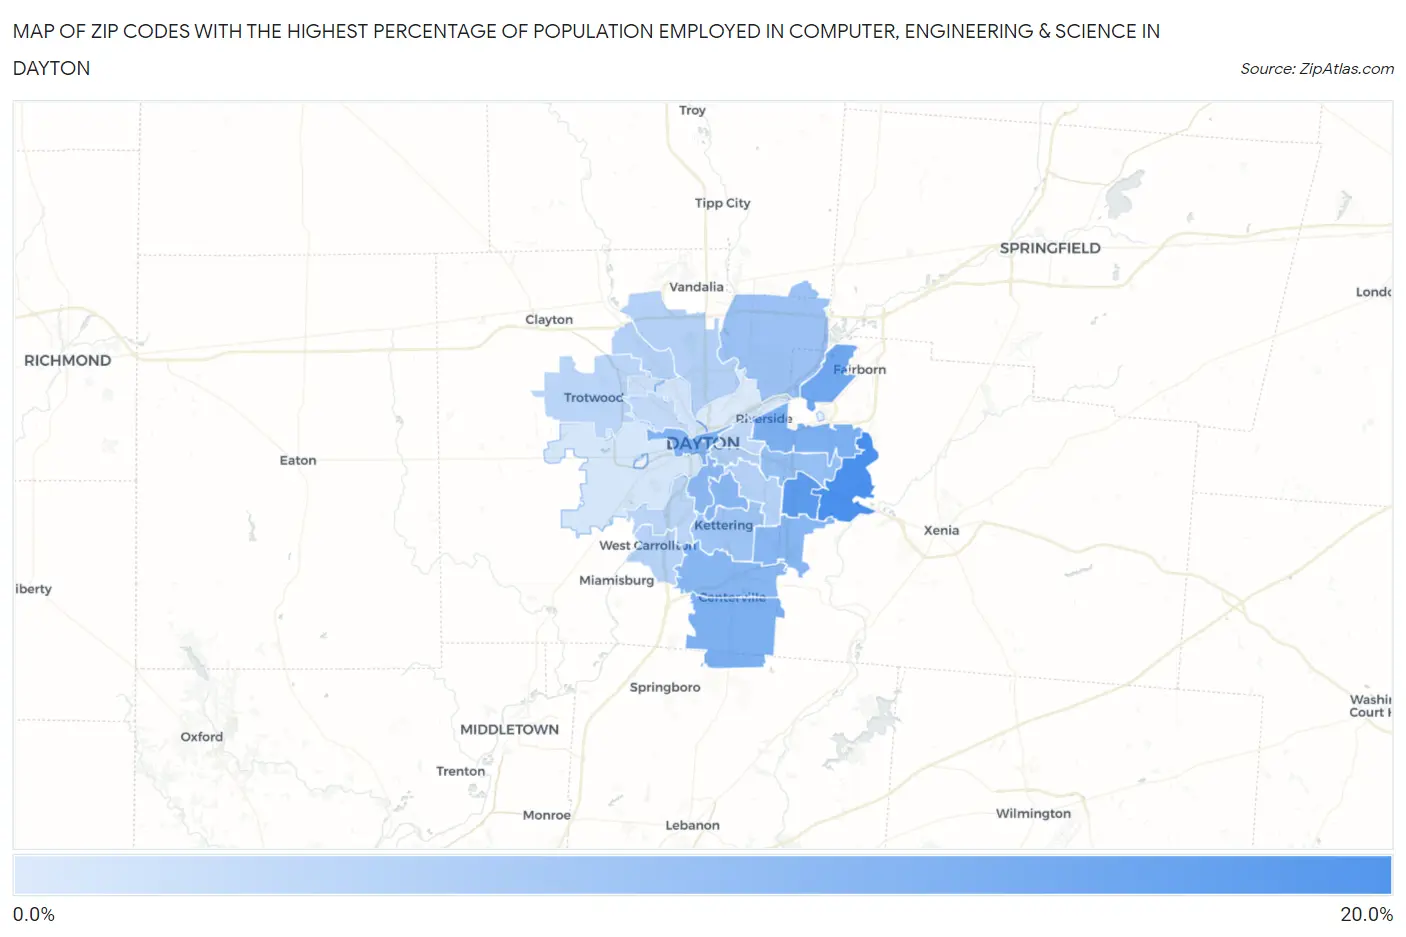
Map of Zip Codes with the Highest Percentage of Population Employed in Computer, Engineering & Science in Dayton
0.90%
18.6%
Zip Codes with the Highest Percentage of Population Employed in Computer, Engineering & Science in Dayton, OH
| Zip Code | % Employed | vs State | vs National | |
| 1. | 45469 | 18.6% | 6.1%(+12.6)#13 | 6.8%(+11.9)#624 |
| 2. | 45434 | 18.3% | 6.1%(+12.2)#14 | 6.8%(+11.5)#654 |
| 3. | 45430 | 16.0% | 6.1%(+9.91)#20 | 6.8%(+9.21)#961 |
| 4. | 45433 | 13.4% | 6.1%(+7.37)#32 | 6.8%(+6.67)#1,500 |
| 5. | 45431 | 12.0% | 6.1%(+5.92)#48 | 6.8%(+5.22)#2,044 |
| 6. | 45458 | 11.9% | 6.1%(+5.84)#51 | 6.8%(+5.14)#2,080 |
| 7. | 45402 | 11.5% | 6.1%(+5.39)#58 | 6.8%(+4.69)#2,321 |
| 8. | 45440 | 10.6% | 6.1%(+4.57)#74 | 6.8%(+3.87)#2,775 |
| 9. | 45419 | 10.6% | 6.1%(+4.51)#77 | 6.8%(+3.81)#2,815 |
| 10. | 45459 | 10.5% | 6.1%(+4.47)#78 | 6.8%(+3.77)#2,845 |
| 11. | 45409 | 10.0% | 6.1%(+3.93)#92 | 6.8%(+3.23)#3,226 |
| 12. | 45432 | 9.1% | 6.1%(+3.01)#118 | 6.8%(+2.31)#3,996 |
| 13. | 45424 | 8.3% | 6.1%(+2.19)#147 | 6.8%(+1.49)#4,929 |
| 14. | 45429 | 8.0% | 6.1%(+1.95)#169 | 6.8%(+1.25)#5,255 |
| 15. | 45410 | 6.0% | 6.1%(-0.049)#315 | 6.8%(-0.749)#8,797 |
| 16. | 45414 | 5.6% | 6.1%(-0.441)#353 | 6.8%(-1.14)#9,743 |
| 17. | 45415 | 5.6% | 6.1%(-0.475)#361 | 6.8%(-1.18)#9,834 |
| 18. | 45420 | 5.4% | 6.1%(-0.659)#381 | 6.8%(-1.36)#10,304 |
| 19. | 45449 | 5.2% | 6.1%(-0.828)#398 | 6.8%(-1.53)#10,729 |
| 20. | 45439 | 4.8% | 6.1%(-1.25)#438 | 6.8%(-1.95)#11,900 |
| 21. | 45426 | 4.6% | 6.1%(-1.42)#460 | 6.8%(-2.12)#12,365 |
| 22. | 45403 | 4.3% | 6.1%(-1.80)#517 | 6.8%(-2.50)#13,610 |
| 23. | 45406 | 4.0% | 6.1%(-2.05)#544 | 6.8%(-2.75)#14,423 |
| 24. | 45416 | 2.8% | 6.1%(-3.27)#728 | 6.8%(-3.97)#18,885 |
| 25. | 45405 | 2.0% | 6.1%(-4.02)#849 | 6.8%(-4.72)#21,694 |
| 26. | 45417 | 1.6% | 6.1%(-4.48)#900 | 6.8%(-5.18)#23,314 |
| 27. | 45404 | 0.90% | 6.1%(-5.16)#977 | 6.8%(-5.86)#25,307 |
1
Common Questions
What are the Top 10 Zip Codes with the Highest Percentage of Population Employed in Computer, Engineering & Science in Dayton, OH?
Top 10 Zip Codes with the Highest Percentage of Population Employed in Computer, Engineering & Science in Dayton, OH are:
What zip code has the Highest Percentage of Population Employed in Computer, Engineering & Science in Dayton, OH?
45469 has the Highest Percentage of Population Employed in Computer, Engineering & Science in Dayton, OH with 18.6%.
What is the Percentage of Population Employed in Computer, Engineering & Science in Dayton, OH?
Percentage of Population Employed in Computer, Engineering & Science in Dayton is 5.4%.
What is the Percentage of Population Employed in Computer, Engineering & Science in Ohio?
Percentage of Population Employed in Computer, Engineering & Science in Ohio is 6.1%.
What is the Percentage of Population Employed in Computer, Engineering & Science in the United States?
Percentage of Population Employed in Computer, Engineering & Science in the United States is 6.8%.