Proctorville, OH Map & Demographics
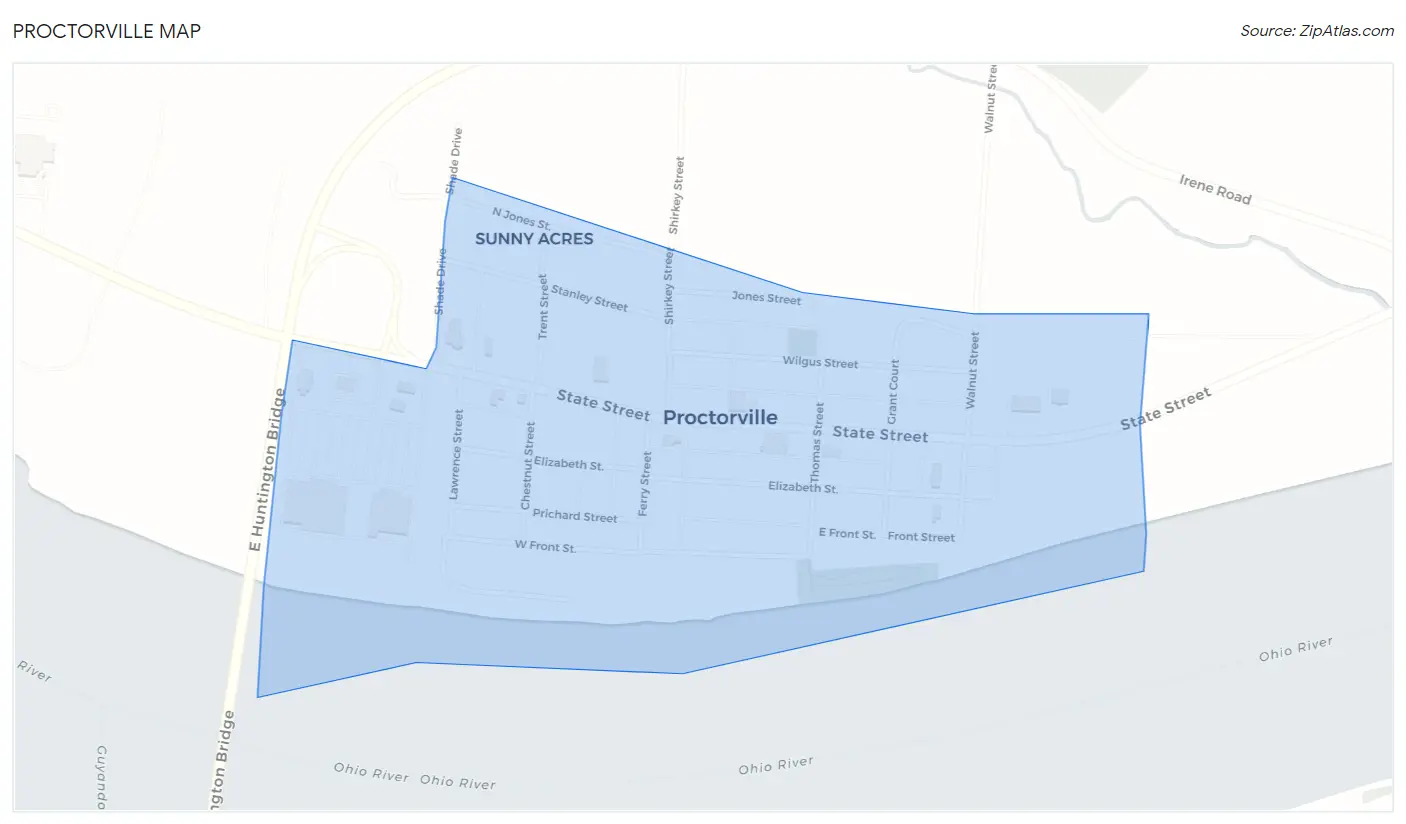
Proctorville Map
Proctorville Overview
$23,212
PER CAPITA INCOME
$54,375
AVG FAMILY INCOME
$33,310
AVG HOUSEHOLD INCOME
21.8%
WAGE / INCOME GAP [ % ]
78.2¢/ $1
WAGE / INCOME GAP [ $ ]
0.38
INEQUALITY / GINI INDEX
558
TOTAL POPULATION
233
MALE POPULATION
325
FEMALE POPULATION
71.69
MALES / 100 FEMALES
139.48
FEMALES / 100 MALES
55.8
MEDIAN AGE
2.7
AVG FAMILY SIZE
1.7
AVG HOUSEHOLD SIZE
194
LABOR FORCE [ PEOPLE ]
37.5%
PERCENT IN LABOR FORCE
2.1%
UNEMPLOYMENT RATE
Proctorville Zip Codes
Proctorville Area Codes
Income in Proctorville
Income Overview in Proctorville
Per Capita Income in Proctorville is $23,212, while median incomes of families and households are $54,375 and $33,310 respectively.
| Characteristic | Number | Measure |
| Per Capita Income | 558 | $23,212 |
| Median Family Income | 107 | $54,375 |
| Mean Family Income | 107 | $59,598 |
| Median Household Income | 325 | $33,310 |
| Mean Household Income | 325 | $39,020 |
| Income Deficit | 107 | $0 |
| Wage / Income Gap (%) | 558 | 21.81% |
| Wage / Income Gap ($) | 558 | 78.19¢ per $1 |
| Gini / Inequality Index | 558 | 0.38 |
Earnings by Sex in Proctorville
Average Earnings in Proctorville are $25,625, $30,536 for men and $23,875 for women, a difference of 21.8%.
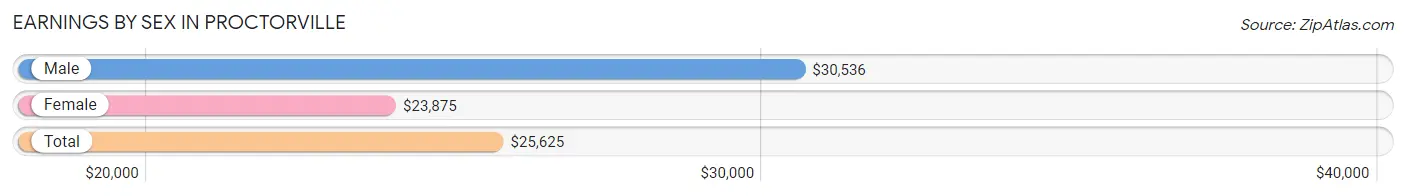
| Sex | Number | Average Earnings |
| Male | 97 (47.1%) | $30,536 |
| Female | 109 (52.9%) | $23,875 |
| Total | 206 (100.0%) | $25,625 |
Earnings by Sex by Income Bracket in Proctorville
The most common earnings brackets in Proctorville are $35,000 to $39,999 for men (18 | 18.6%) and $35,000 to $39,999 for women (24 | 22.0%).
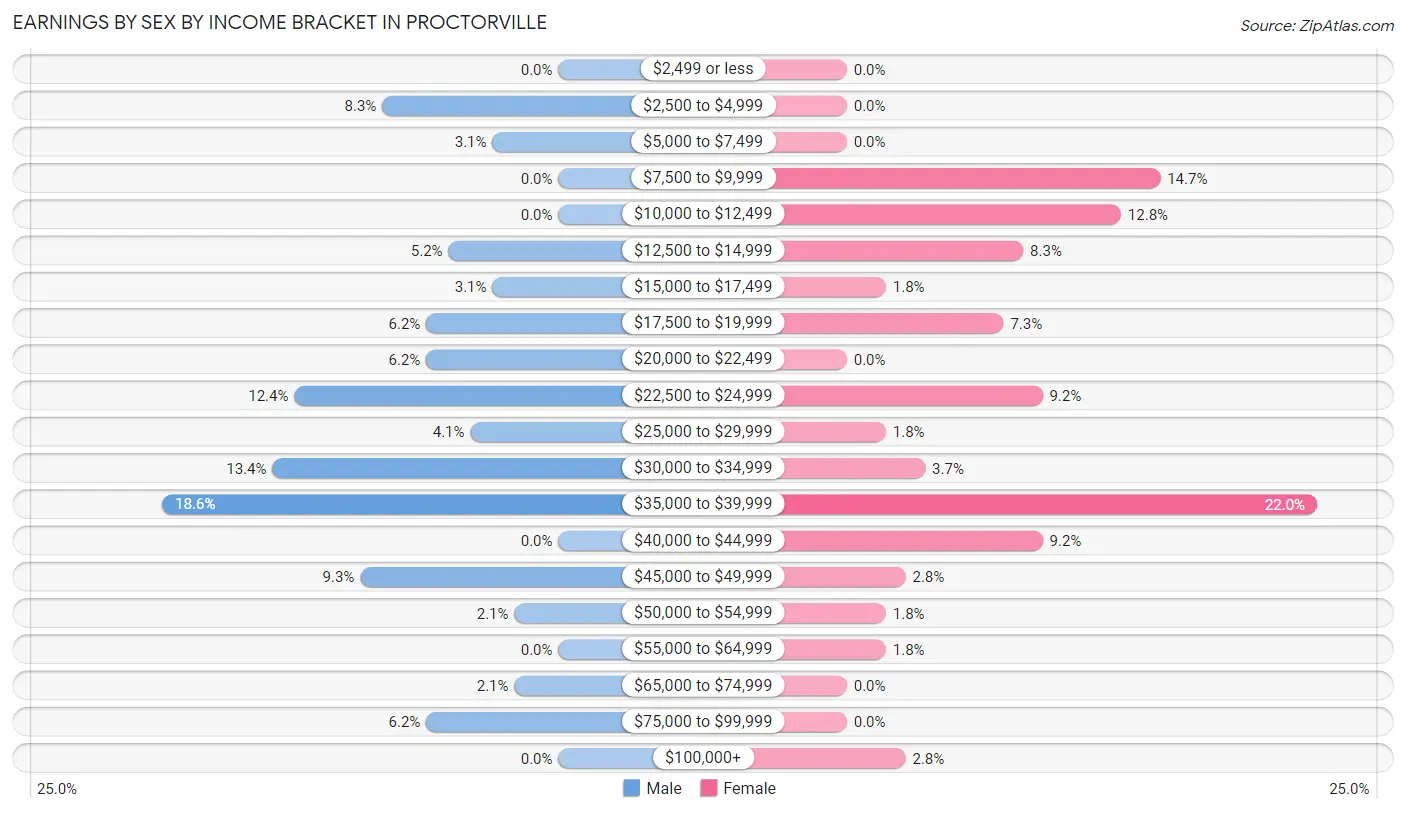
| Income | Male | Female |
| $2,499 or less | 0 (0.0%) | 0 (0.0%) |
| $2,500 to $4,999 | 8 (8.3%) | 0 (0.0%) |
| $5,000 to $7,499 | 3 (3.1%) | 0 (0.0%) |
| $7,500 to $9,999 | 0 (0.0%) | 16 (14.7%) |
| $10,000 to $12,499 | 0 (0.0%) | 14 (12.8%) |
| $12,500 to $14,999 | 5 (5.1%) | 9 (8.3%) |
| $15,000 to $17,499 | 3 (3.1%) | 2 (1.8%) |
| $17,500 to $19,999 | 6 (6.2%) | 8 (7.3%) |
| $20,000 to $22,499 | 6 (6.2%) | 0 (0.0%) |
| $22,500 to $24,999 | 12 (12.4%) | 10 (9.2%) |
| $25,000 to $29,999 | 4 (4.1%) | 2 (1.8%) |
| $30,000 to $34,999 | 13 (13.4%) | 4 (3.7%) |
| $35,000 to $39,999 | 18 (18.6%) | 24 (22.0%) |
| $40,000 to $44,999 | 0 (0.0%) | 10 (9.2%) |
| $45,000 to $49,999 | 9 (9.3%) | 3 (2.8%) |
| $50,000 to $54,999 | 2 (2.1%) | 2 (1.8%) |
| $55,000 to $64,999 | 0 (0.0%) | 2 (1.8%) |
| $65,000 to $74,999 | 2 (2.1%) | 0 (0.0%) |
| $75,000 to $99,999 | 6 (6.2%) | 0 (0.0%) |
| $100,000+ | 0 (0.0%) | 3 (2.8%) |
| Total | 97 (100.0%) | 109 (100.0%) |
Earnings by Sex by Educational Attainment in Proctorville
Average earnings in Proctorville are $33,333 for men and $35,438 for women, a difference of 5.9%. Men with an educational attainment of bachelor's degree enjoy the highest average annual earnings of $41,250, while those with high school diploma education earn the least with $31,607. Women with an educational attainment of bachelor's degree earn the most with the average annual earnings of $47,917, while those with high school diploma education have the smallest earnings of $35,125.
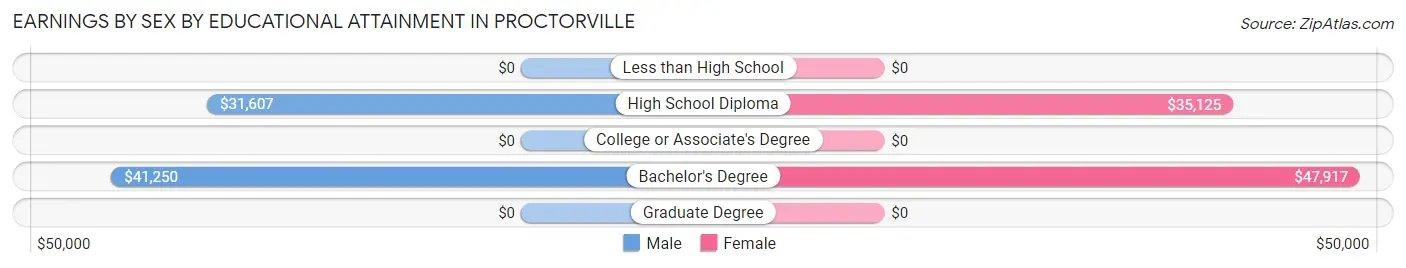
| Educational Attainment | Male Income | Female Income |
| Less than High School | - | - |
| High School Diploma | $31,607 | $35,125 |
| College or Associate's Degree | - | - |
| Bachelor's Degree | $41,250 | $47,917 |
| Graduate Degree | - | - |
| Total | $33,333 | $35,438 |
Family Income in Proctorville
Family Income Brackets in Proctorville
According to the Proctorville family income data, there are 33 families falling into the $50,000 to $74,999 income range, which is the most common income bracket and makes up 30.8% of all families.
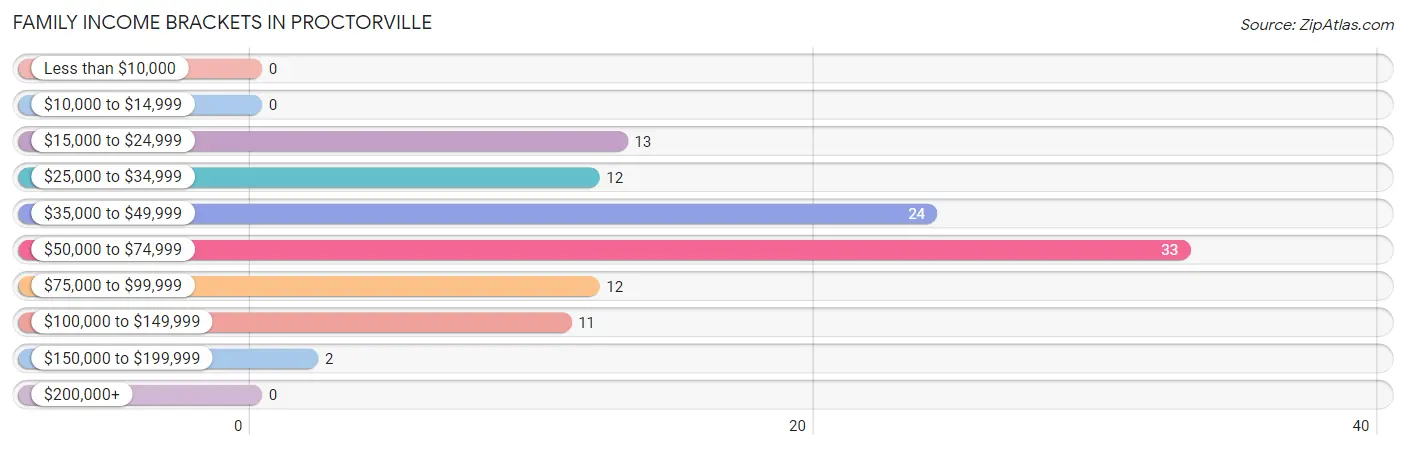
| Income Bracket | # Families | % Families |
| Less than $10,000 | 0 | 0.0% |
| $10,000 to $14,999 | 0 | 0.0% |
| $15,000 to $24,999 | 13 | 12.1% |
| $25,000 to $34,999 | 12 | 11.2% |
| $35,000 to $49,999 | 24 | 22.4% |
| $50,000 to $74,999 | 33 | 30.8% |
| $75,000 to $99,999 | 12 | 11.2% |
| $100,000 to $149,999 | 11 | 10.3% |
| $150,000 to $199,999 | 2 | 1.9% |
| $200,000+ | 0 | 0.0% |
Family Income by Famaliy Size in Proctorville
3-person families (32 | 29.9%) account for the highest median family income in Proctorville with $73,125 per family, while 3-person families (32 | 29.9%) have the highest median income of $24,375 per family member.
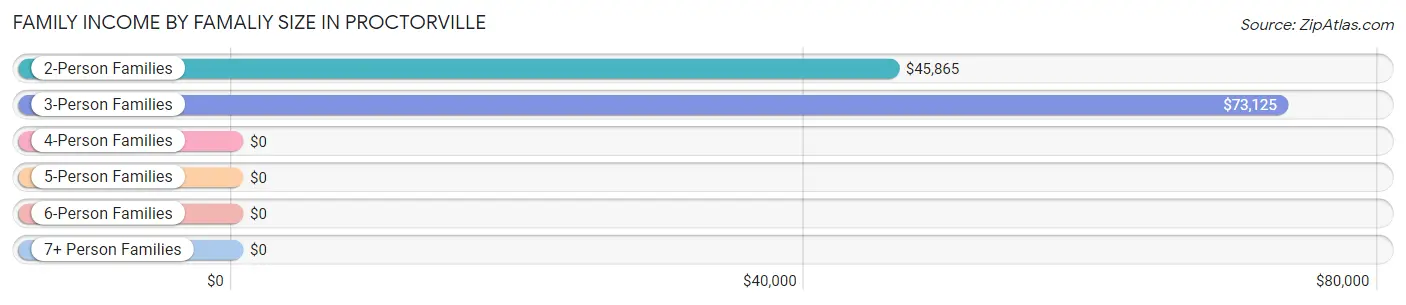
| Income Bracket | # Families | Median Income |
| 2-Person Families | 71 (66.4%) | $45,865 |
| 3-Person Families | 32 (29.9%) | $73,125 |
| 4-Person Families | 4 (3.7%) | $0 |
| 5-Person Families | 0 (0.0%) | $0 |
| 6-Person Families | 0 (0.0%) | $0 |
| 7+ Person Families | 0 (0.0%) | $0 |
| Total | 107 (100.0%) | $54,375 |
Family Income by Number of Earners in Proctorville
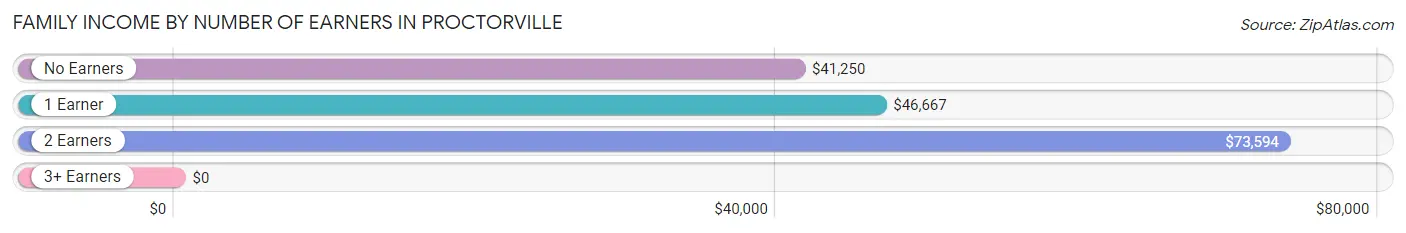
| Number of Earners | # Families | Median Income |
| No Earners | 44 (41.1%) | $41,250 |
| 1 Earner | 30 (28.0%) | $46,667 |
| 2 Earners | 31 (29.0%) | $73,594 |
| 3+ Earners | 2 (1.9%) | $0 |
| Total | 107 (100.0%) | $54,375 |
Household Income in Proctorville
Household Income Brackets in Proctorville
With 82 households falling in the category, the $15,000 to $24,999 income range is the most frequent in Proctorville, accounting for 25.2% of all households.
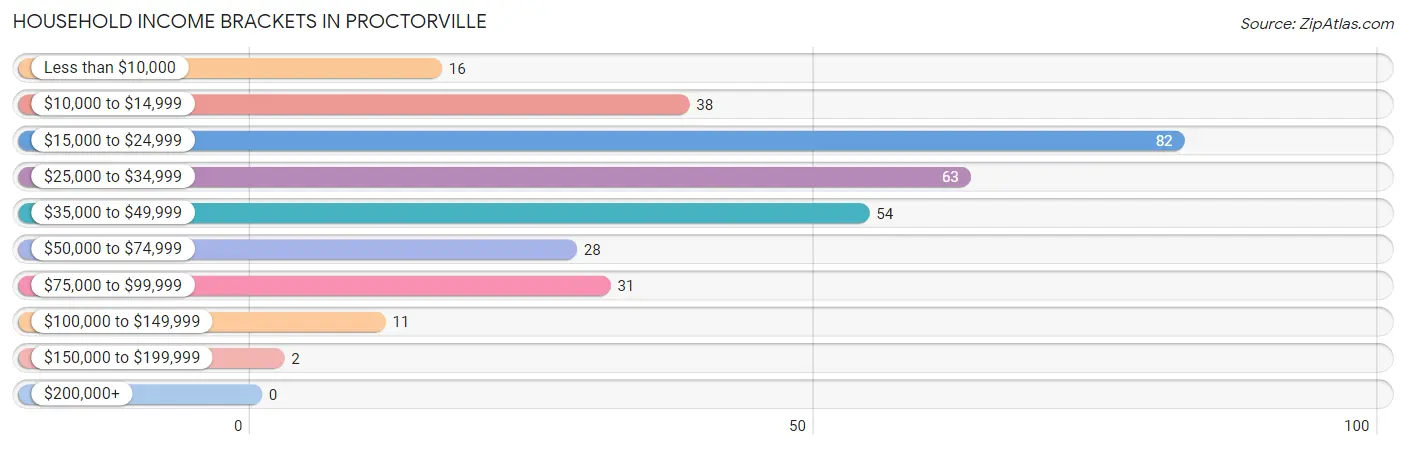
| Income Bracket | # Households | % Households |
| Less than $10,000 | 16 | 4.9% |
| $10,000 to $14,999 | 38 | 11.7% |
| $15,000 to $24,999 | 82 | 25.2% |
| $25,000 to $34,999 | 63 | 19.4% |
| $35,000 to $49,999 | 54 | 16.6% |
| $50,000 to $74,999 | 28 | 8.6% |
| $75,000 to $99,999 | 31 | 9.5% |
| $100,000 to $149,999 | 11 | 3.4% |
| $150,000 to $199,999 | 2 | 0.6% |
| $200,000+ | 0 | 0.0% |
Household Income by Householder Age in Proctorville
The median household income in Proctorville is $33,310, with the highest median household income of $40,000 found in the 45 to 64 years age bracket for the primary householder. A total of 86 households (26.5%) fall into this category. Meanwhile, the 15 to 24 years age bracket for the primary householder has the lowest median household income of $0, with 15 households (4.6%) in this group.
| Income Bracket | # Households | Median Income |
| 15 to 24 Years | 15 (4.6%) | $0 |
| 25 to 44 Years | 58 (17.8%) | $36,442 |
| 45 to 64 Years | 86 (26.5%) | $40,000 |
| 65+ Years | 166 (51.1%) | $32,708 |
| Total | 325 (100.0%) | $33,310 |
Poverty in Proctorville
Income Below Poverty by Sex and Age in Proctorville
With 17.2% poverty level for males and 24.3% for females among the residents of Proctorville, 45 to 54 year old males and under 5 year old females are the most vulnerable to poverty, with 13 males (40.6%) and 3 females (100.0%) in their respective age groups living below the poverty level.
| Age Bracket | Male | Female |
| Under 5 Years | 0 (0.0%) | 3 (100.0%) |
| 5 Years | 0 (0.0%) | 0 (0.0%) |
| 6 to 11 Years | 0 (0.0%) | 0 (0.0%) |
| 12 to 14 Years | 0 (0.0%) | 0 (0.0%) |
| 15 Years | 0 (0.0%) | 0 (0.0%) |
| 16 and 17 Years | 0 (0.0%) | 0 (0.0%) |
| 18 to 24 Years | 0 (0.0%) | 48 (81.4%) |
| 25 to 34 Years | 0 (0.0%) | 5 (16.1%) |
| 35 to 44 Years | 8 (28.6%) | 0 (0.0%) |
| 45 to 54 Years | 13 (40.6%) | 12 (27.3%) |
| 55 to 64 Years | 13 (29.5%) | 6 (18.8%) |
| 65 to 74 Years | 0 (0.0%) | 3 (4.1%) |
| 75 Years and over | 6 (8.2%) | 2 (4.1%) |
| Total | 40 (17.2%) | 79 (24.3%) |
Income Above Poverty by Sex and Age in Proctorville
According to the poverty statistics in Proctorville, males aged 6 to 11 years and females aged 6 to 11 years are the age groups that are most secure financially, with 100.0% of males and 100.0% of females in these age groups living above the poverty line.
| Age Bracket | Male | Female |
| Under 5 Years | 0 (0.0%) | 0 (0.0%) |
| 5 Years | 0 (0.0%) | 0 (0.0%) |
| 6 to 11 Years | 7 (100.0%) | 4 (100.0%) |
| 12 to 14 Years | 1 (100.0%) | 18 (100.0%) |
| 15 Years | 7 (100.0%) | 0 (0.0%) |
| 16 and 17 Years | 4 (100.0%) | 0 (0.0%) |
| 18 to 24 Years | 15 (100.0%) | 11 (18.6%) |
| 25 to 34 Years | 10 (100.0%) | 26 (83.9%) |
| 35 to 44 Years | 20 (71.4%) | 12 (100.0%) |
| 45 to 54 Years | 19 (59.4%) | 32 (72.7%) |
| 55 to 64 Years | 31 (70.5%) | 26 (81.2%) |
| 65 to 74 Years | 12 (100.0%) | 70 (95.9%) |
| 75 Years and over | 67 (91.8%) | 47 (95.9%) |
| Total | 193 (82.8%) | 246 (75.7%) |
Income Below Poverty Among Married-Couple Families in Proctorville
The poverty statistics for married-couple families in Proctorville show that 12.0% or 9 of the total 75 families live below the poverty line. Families with no children have the highest poverty rate of 14.5%, comprising of 9 families. On the other hand, families with 1 or 2 children have the lowest poverty rate of 0.0%, which includes 0 families.
| Children | Above Poverty | Below Poverty |
| No Children | 53 (85.5%) | 9 (14.5%) |
| 1 or 2 Children | 13 (100.0%) | 0 (0.0%) |
| 3 or 4 Children | 0 (0.0%) | 0 (0.0%) |
| 5 or more Children | 0 (0.0%) | 0 (0.0%) |
| Total | 66 (88.0%) | 9 (12.0%) |
Income Below Poverty Among Single-Parent Households in Proctorville
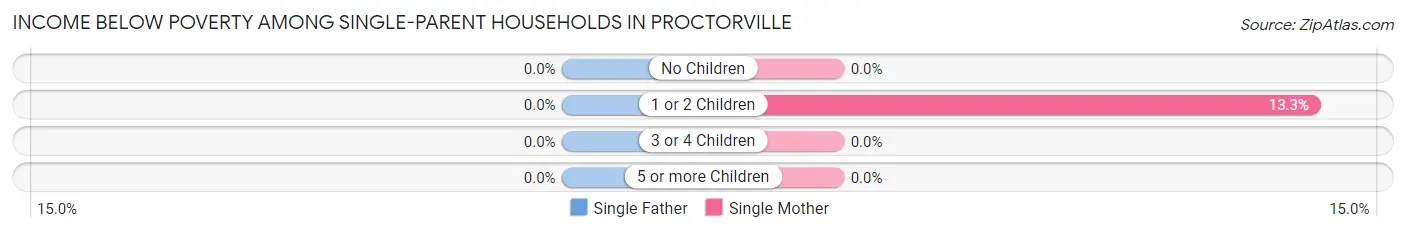
| Children | Single Father | Single Mother |
| No Children | 0 (0.0%) | 0 (0.0%) |
| 1 or 2 Children | 0 (0.0%) | 2 (13.3%) |
| 3 or 4 Children | 0 (0.0%) | 0 (0.0%) |
| 5 or more Children | 0 (0.0%) | 0 (0.0%) |
| Total | 0 (0.0%) | 2 (6.9%) |
Income Below Poverty Among Married-Couple vs Single-Parent Households in Proctorville
The poverty data for Proctorville shows that 9 of the married-couple family households (12.0%) and 2 of the single-parent households (6.2%) are living below the poverty level. Within the married-couple family households, those with no children have the highest poverty rate, with 9 households (14.5%) falling below the poverty line. Among the single-parent households, those with 1 or 2 children have the highest poverty rate, with 2 household (11.1%) living below poverty.
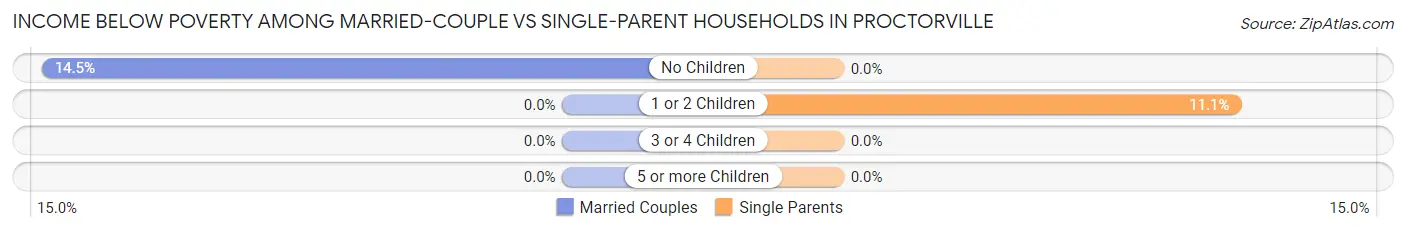
| Children | Married-Couple Families | Single-Parent Households |
| No Children | 9 (14.5%) | 0 (0.0%) |
| 1 or 2 Children | 0 (0.0%) | 2 (11.1%) |
| 3 or 4 Children | 0 (0.0%) | 0 (0.0%) |
| 5 or more Children | 0 (0.0%) | 0 (0.0%) |
| Total | 9 (12.0%) | 2 (6.2%) |
Race in Proctorville
The most populous races in Proctorville are White / Caucasian (536 | 96.1%), Black / African American (12 | 2.1%), and Two or more Races (10 | 1.8%).
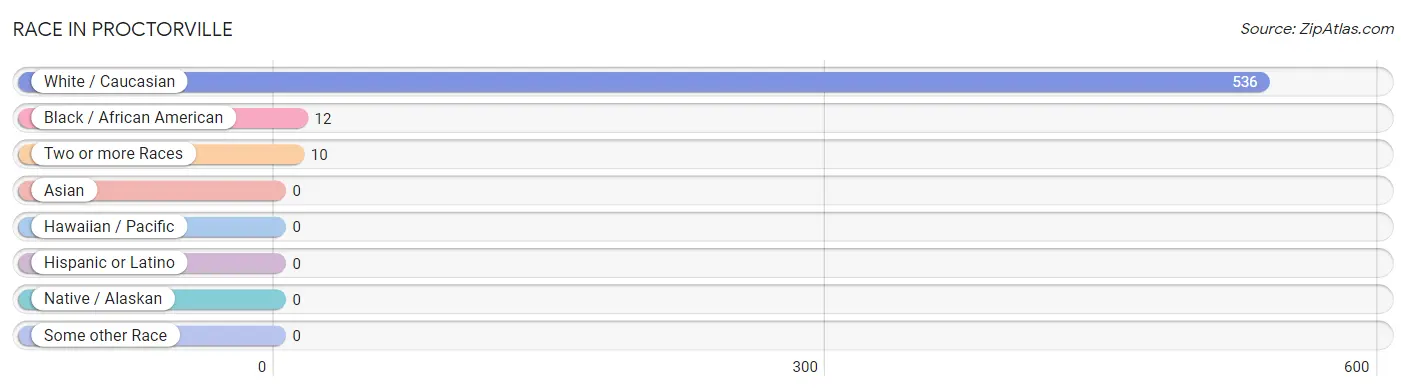
| Race | # Population | % Population |
| Asian | 0 | 0.0% |
| Black / African American | 12 | 2.1% |
| Hawaiian / Pacific | 0 | 0.0% |
| Hispanic or Latino | 0 | 0.0% |
| Native / Alaskan | 0 | 0.0% |
| White / Caucasian | 536 | 96.1% |
| Two or more Races | 10 | 1.8% |
| Some other Race | 0 | 0.0% |
| Total | 558 | 100.0% |
Ancestry in Proctorville
The most populous ancestries reported in Proctorville are German (103 | 18.5%), American (81 | 14.5%), Irish (61 | 10.9%), Russian (46 | 8.2%), and English (41 | 7.3%), together accounting for 59.5% of all Proctorville residents.
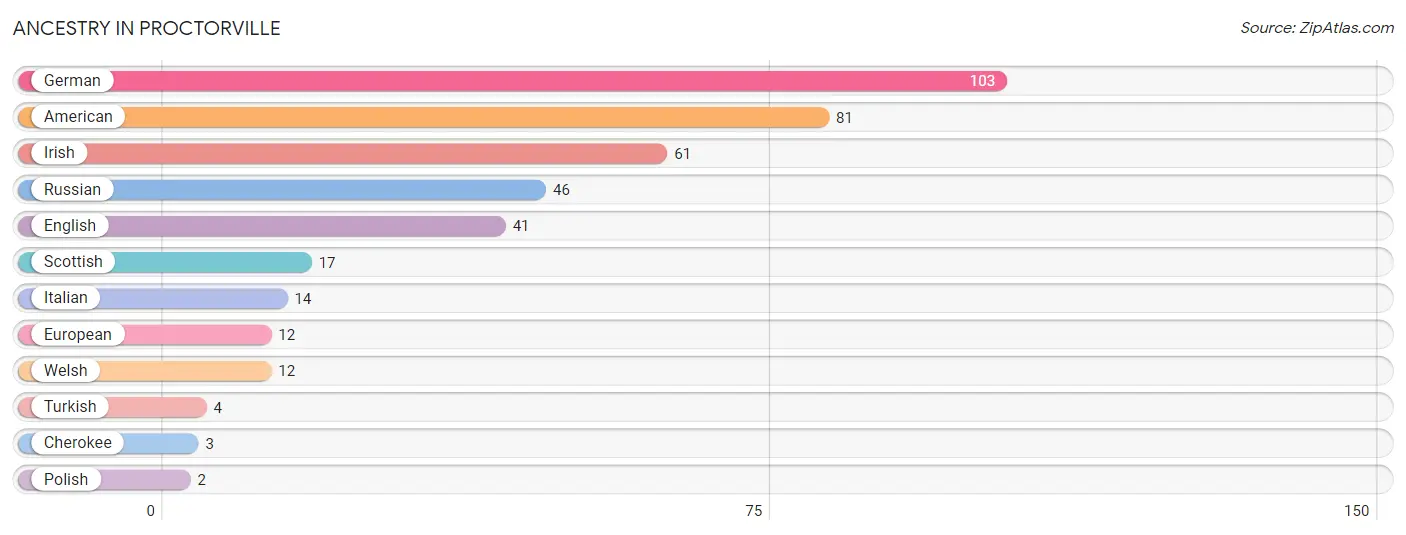
| Ancestry | # Population | % Population |
| American | 81 | 14.5% |
| Cherokee | 3 | 0.5% |
| English | 41 | 7.3% |
| European | 12 | 2.1% |
| German | 103 | 18.5% |
| Irish | 61 | 10.9% |
| Italian | 14 | 2.5% |
| Polish | 2 | 0.4% |
| Russian | 46 | 8.2% |
| Scottish | 17 | 3.0% |
| Turkish | 4 | 0.7% |
| Welsh | 12 | 2.1% | View All 12 Rows |
Immigrants in Proctorville

| Immigration Origin | # Population | % Population | View All 0 Rows |
Sex and Age in Proctorville
Sex and Age in Proctorville
The most populous age groups in Proctorville are 85 Years and over (48 | 20.6%) for men and 70 to 74 Years (67 | 20.6%) for women.
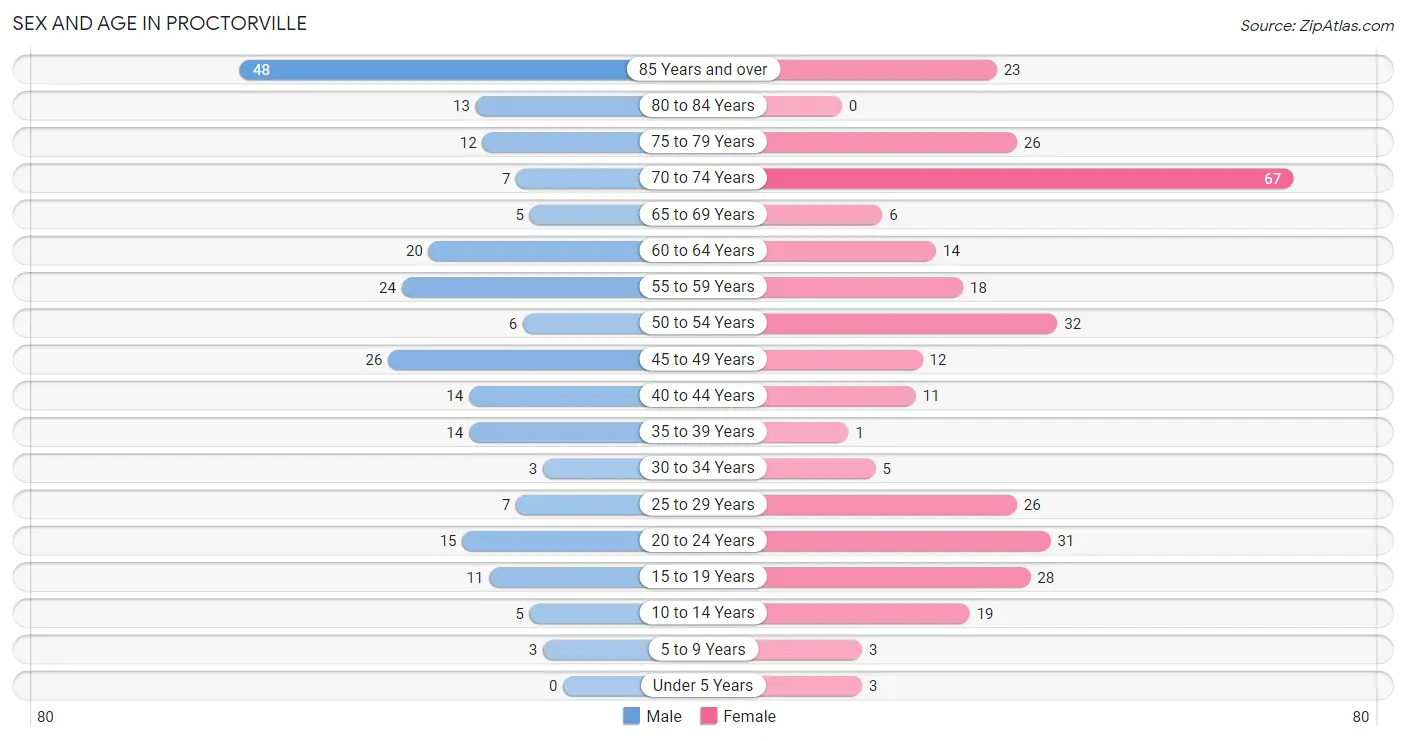
| Age Bracket | Male | Female |
| Under 5 Years | 0 (0.0%) | 3 (0.9%) |
| 5 to 9 Years | 3 (1.3%) | 3 (0.9%) |
| 10 to 14 Years | 5 (2.1%) | 19 (5.9%) |
| 15 to 19 Years | 11 (4.7%) | 28 (8.6%) |
| 20 to 24 Years | 15 (6.4%) | 31 (9.5%) |
| 25 to 29 Years | 7 (3.0%) | 26 (8.0%) |
| 30 to 34 Years | 3 (1.3%) | 5 (1.5%) |
| 35 to 39 Years | 14 (6.0%) | 1 (0.3%) |
| 40 to 44 Years | 14 (6.0%) | 11 (3.4%) |
| 45 to 49 Years | 26 (11.2%) | 12 (3.7%) |
| 50 to 54 Years | 6 (2.6%) | 32 (9.9%) |
| 55 to 59 Years | 24 (10.3%) | 18 (5.5%) |
| 60 to 64 Years | 20 (8.6%) | 14 (4.3%) |
| 65 to 69 Years | 5 (2.1%) | 6 (1.8%) |
| 70 to 74 Years | 7 (3.0%) | 67 (20.6%) |
| 75 to 79 Years | 12 (5.1%) | 26 (8.0%) |
| 80 to 84 Years | 13 (5.6%) | 0 (0.0%) |
| 85 Years and over | 48 (20.6%) | 23 (7.1%) |
| Total | 233 (100.0%) | 325 (100.0%) |
Families and Households in Proctorville
Median Family Size in Proctorville
The median family size in Proctorville is 2.67 persons per family, with single female/mother families (29 | 27.1%) accounting for the largest median family size of 3.21 persons per family. On the other hand, married-couple families (75 | 70.1%) represent the smallest median family size with 2.45 persons per family.
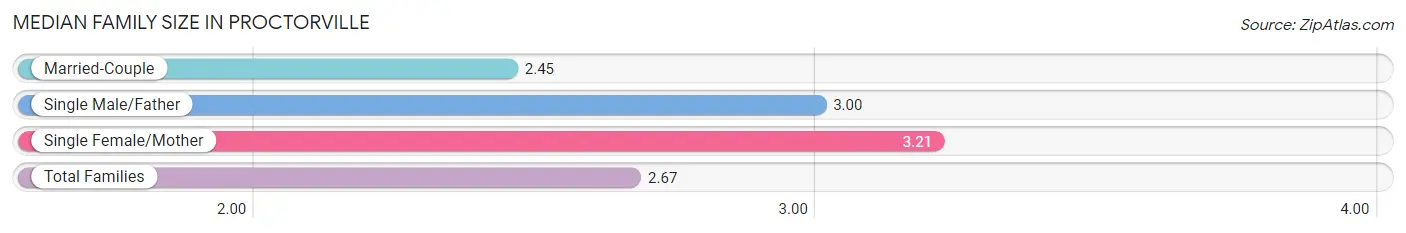
| Family Type | # Families | Family Size |
| Married-Couple | 75 (70.1%) | 2.45 |
| Single Male/Father | 3 (2.8%) | 3.00 |
| Single Female/Mother | 29 (27.1%) | 3.21 |
| Total Families | 107 (100.0%) | 2.67 |
Median Household Size in Proctorville
The median household size in Proctorville is 1.72 persons per household, with single female/mother households (29 | 8.9%) accounting for the largest median household size of 3.48 persons per household. non-family households (218 | 67.1%) represent the smallest median household size with 1.21 persons per household.
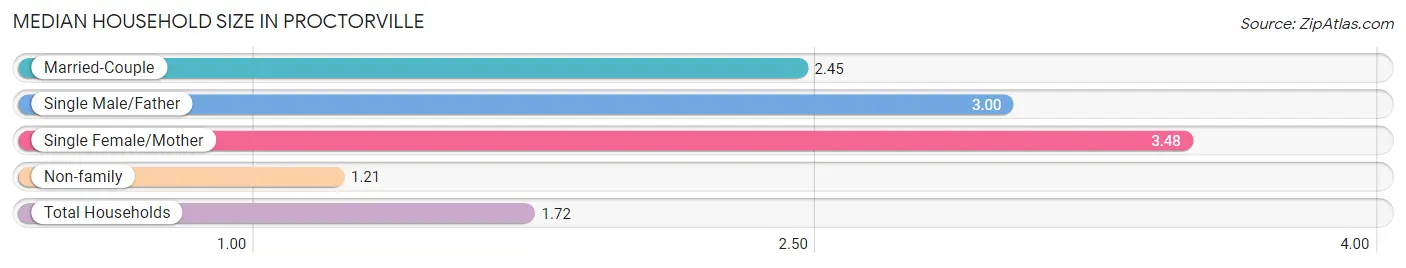
| Household Type | # Households | Household Size |
| Married-Couple | 75 (23.1%) | 2.45 |
| Single Male/Father | 3 (0.9%) | 3.00 |
| Single Female/Mother | 29 (8.9%) | 3.48 |
| Non-family | 218 (67.1%) | 1.21 |
| Total Households | 325 (100.0%) | 1.72 |
Household Size by Marriage Status in Proctorville
Out of a total of 325 households in Proctorville, 107 (32.9%) are family households, while 218 (67.1%) are nonfamily households. The most numerous type of family households are 2-person households, comprising 69, and the most common type of nonfamily households are 1-person households, comprising 184.
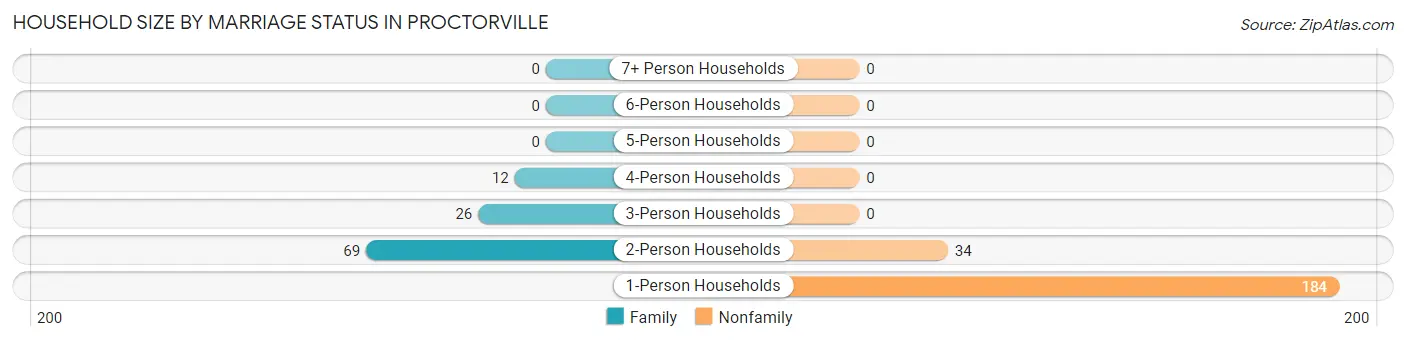
| Household Size | Family Households | Nonfamily Households |
| 1-Person Households | - | 184 (56.6%) |
| 2-Person Households | 69 (21.2%) | 34 (10.5%) |
| 3-Person Households | 26 (8.0%) | 0 (0.0%) |
| 4-Person Households | 12 (3.7%) | 0 (0.0%) |
| 5-Person Households | 0 (0.0%) | 0 (0.0%) |
| 6-Person Households | 0 (0.0%) | 0 (0.0%) |
| 7+ Person Households | 0 (0.0%) | 0 (0.0%) |
| Total | 107 (32.9%) | 218 (67.1%) |
Female Fertility in Proctorville
Fertility by Age in Proctorville
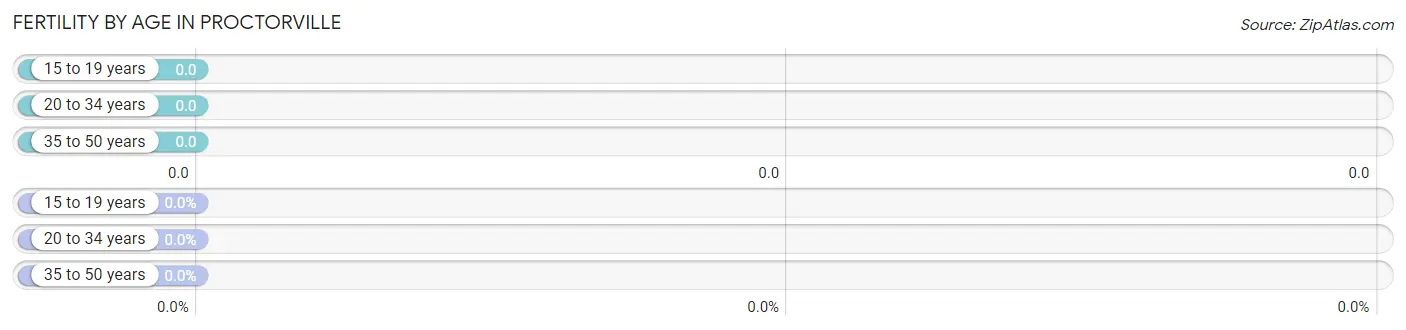
| Age Bracket | Women with Births | Births / 1,000 Women |
| 15 to 19 years | 0 (0.0%) | 0.0 |
| 20 to 34 years | 0 (0.0%) | 0.0 |
| 35 to 50 years | 0 (0.0%) | 0.0 |
| Total | 0 (0.0%) | 0.0 |
Fertility by Age by Marriage Status in Proctorville
| Age Bracket | Married | Unmarried |
| 15 to 19 years | 0 (0.0%) | 0 (0.0%) |
| 20 to 34 years | 0 (0.0%) | 0 (0.0%) |
| 35 to 50 years | 0 (0.0%) | 0 (0.0%) |
| Total | 0 (0.0%) | 0 (0.0%) |
Fertility by Education in Proctorville
| Educational Attainment | Women with Births | Births / 1,000 Women |
| Less than High School | 0 (0.0%) | 0.0 |
| High School Diploma | 0 (0.0%) | 0.0 |
| College or Associate's Degree | 0 (0.0%) | 0.0 |
| Bachelor's Degree | 0 (0.0%) | 0.0 |
| Graduate Degree | 0 (0.0%) | 0.0 |
| Total | 0 (0.0%) | 0.0 |
Fertility by Education by Marriage Status in Proctorville
| Educational Attainment | Married | Unmarried |
| Less than High School | 0 (0.0%) | 0 (0.0%) |
| High School Diploma | 0 (0.0%) | 0 (0.0%) |
| College or Associate's Degree | 0 (0.0%) | 0 (0.0%) |
| Bachelor's Degree | 0 (0.0%) | 0 (0.0%) |
| Graduate Degree | 0 (0.0%) | 0 (0.0%) |
| Total | 0 (0.0%) | 0 (0.0%) |
Employment Characteristics in Proctorville
Employment by Class of Employer in Proctorville
Among the 187 employed individuals in Proctorville, private company employees (129 | 69.0%), not-for-profit organizations (20 | 10.7%), and self-employed (incorporated) (15 | 8.0%) make up the most common classes of employment.
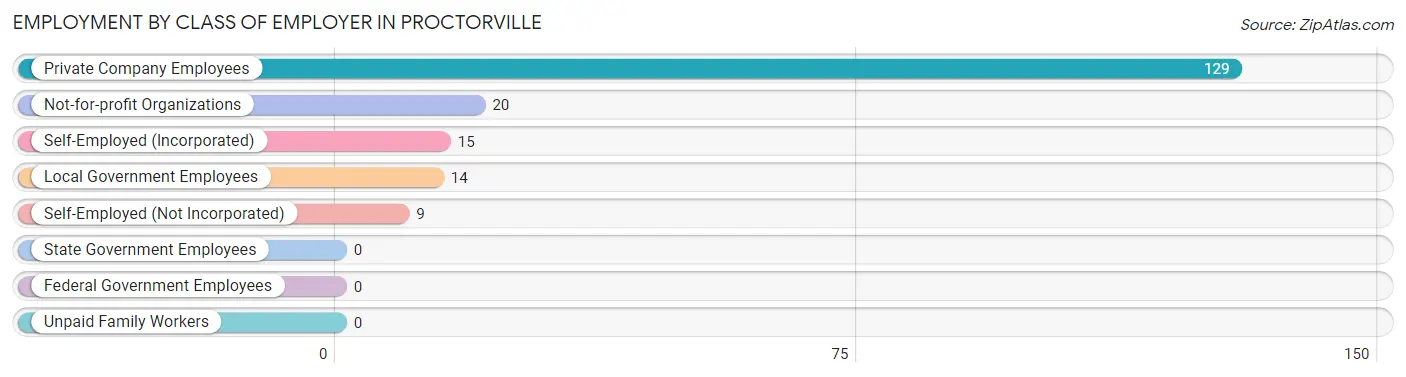
| Employer Class | # Employees | % Employees |
| Private Company Employees | 129 | 69.0% |
| Self-Employed (Incorporated) | 15 | 8.0% |
| Self-Employed (Not Incorporated) | 9 | 4.8% |
| Not-for-profit Organizations | 20 | 10.7% |
| Local Government Employees | 14 | 7.5% |
| State Government Employees | 0 | 0.0% |
| Federal Government Employees | 0 | 0.0% |
| Unpaid Family Workers | 0 | 0.0% |
| Total | 187 | 100.0% |
Employment Status by Age in Proctorville
According to the labor force statistics for Proctorville, out of the total population over 16 years of age (518), 37.5% or 194 individuals are in the labor force, with 2.1% or 4 of them unemployed. The age group with the highest labor force participation rate is 25 to 29 years, with 100.0% or 33 individuals in the labor force. Within the labor force, the 20 to 24 years age range has the highest percentage of unemployed individuals, with 21.1% or 4 of them being unemployed.
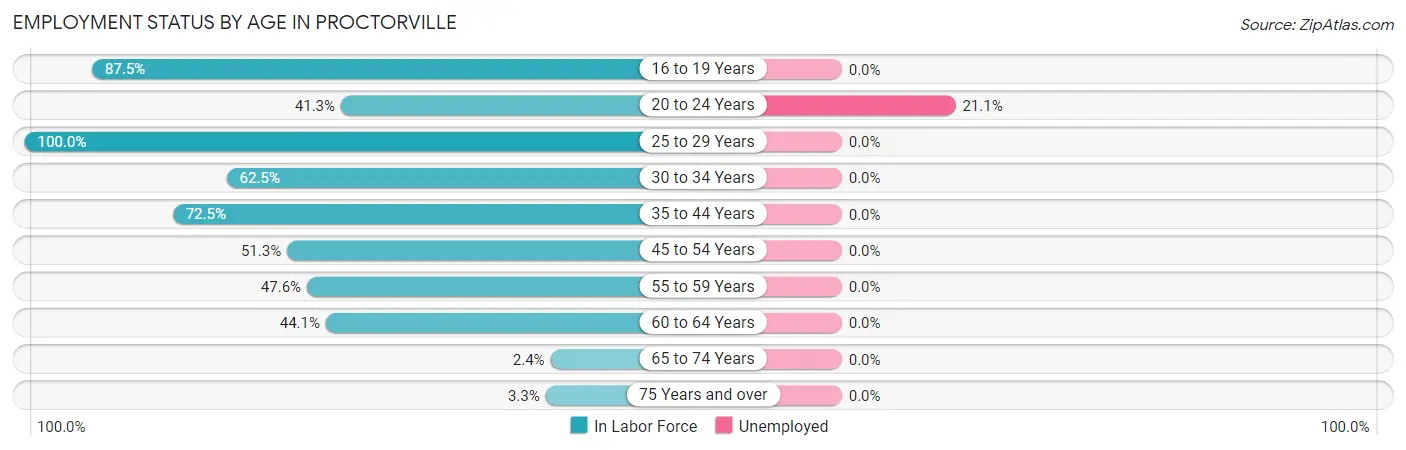
| Age Bracket | In Labor Force | Unemployed |
| 16 to 19 Years | 28 (87.5%) | 0 (0.0%) |
| 20 to 24 Years | 19 (41.3%) | 4 (21.1%) |
| 25 to 29 Years | 33 (100.0%) | 0 (0.0%) |
| 30 to 34 Years | 5 (62.5%) | 0 (0.0%) |
| 35 to 44 Years | 29 (72.5%) | 0 (0.0%) |
| 45 to 54 Years | 39 (51.3%) | 0 (0.0%) |
| 55 to 59 Years | 20 (47.6%) | 0 (0.0%) |
| 60 to 64 Years | 15 (44.1%) | 0 (0.0%) |
| 65 to 74 Years | 2 (2.4%) | 0 (0.0%) |
| 75 Years and over | 4 (3.3%) | 0 (0.0%) |
| Total | 194 (37.5%) | 4 (2.1%) |
Employment Status by Educational Attainment in Proctorville
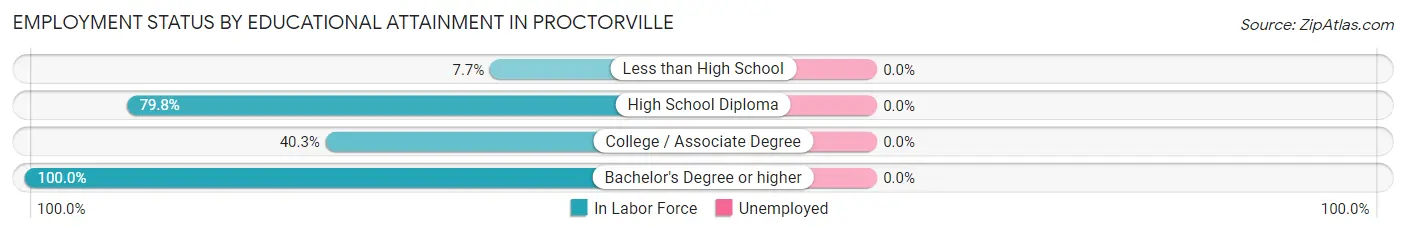
| Educational Attainment | In Labor Force | Unemployed |
| Less than High School | 2 (7.7%) | 0 (0.0%) |
| High School Diploma | 87 (79.8%) | 0 (0.0%) |
| College / Associate Degree | 31 (40.3%) | 0 (0.0%) |
| Bachelor's Degree or higher | 21 (100.0%) | 0 (0.0%) |
| Total | 141 (60.5%) | 0 (0.0%) |
Employment Occupations by Sex in Proctorville
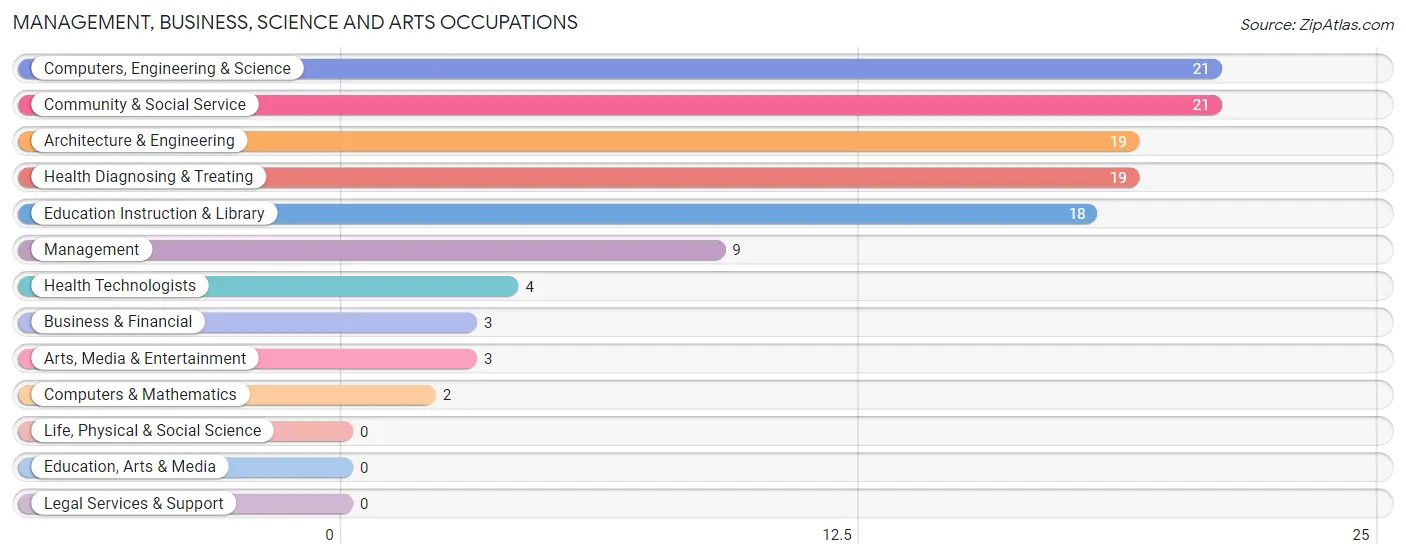
Management, Business, Science and Arts Occupations
The most common Management, Business, Science and Arts occupations in Proctorville are Computers, Engineering & Science (21 | 11.1%), Community & Social Service (21 | 11.1%), Architecture & Engineering (19 | 10.0%), Health Diagnosing & Treating (19 | 10.0%), and Education Instruction & Library (18 | 9.5%).
Management, Business, Science and Arts Occupations by Sex
Within the Management, Business, Science and Arts occupations in Proctorville, the most male-oriented occupations are Computers & Mathematics (100.0%), Arts, Media & Entertainment (100.0%), and Health Technologists (75.0%), while the most female-oriented occupations are Business & Financial (100.0%), Architecture & Engineering (89.5%), and Education Instruction & Library (88.9%).
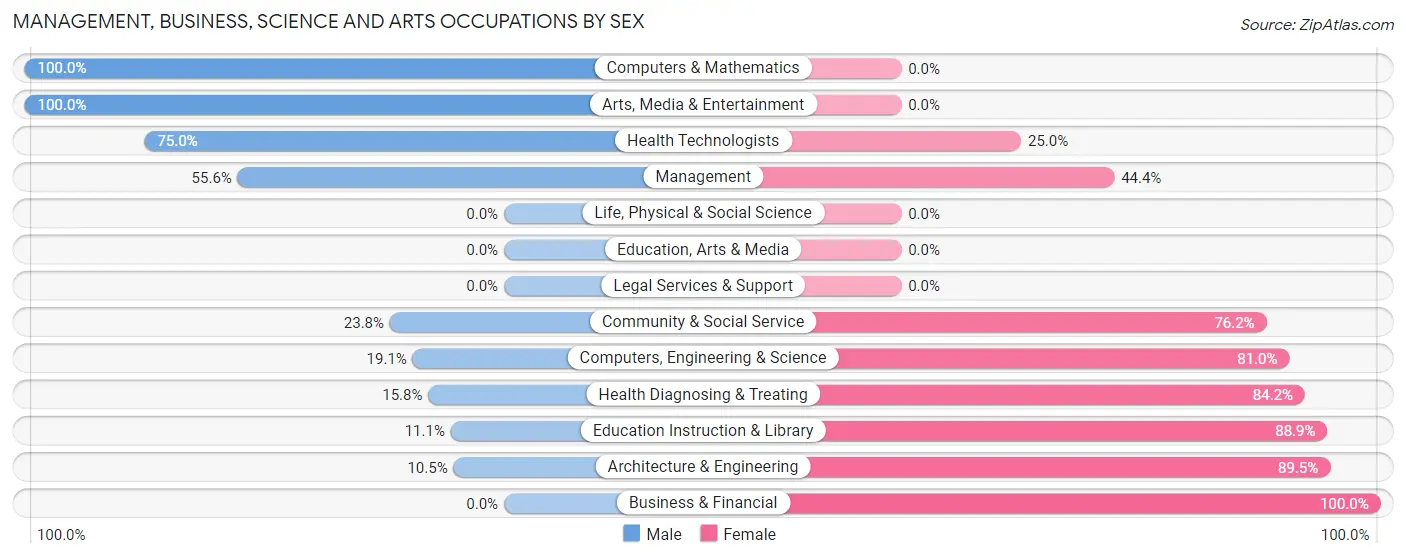
| Occupation | Male | Female |
| Management | 5 (55.6%) | 4 (44.4%) |
| Business & Financial | 0 (0.0%) | 3 (100.0%) |
| Computers, Engineering & Science | 4 (19.1%) | 17 (80.9%) |
| Computers & Mathematics | 2 (100.0%) | 0 (0.0%) |
| Architecture & Engineering | 2 (10.5%) | 17 (89.5%) |
| Life, Physical & Social Science | 0 (0.0%) | 0 (0.0%) |
| Community & Social Service | 5 (23.8%) | 16 (76.2%) |
| Education, Arts & Media | 0 (0.0%) | 0 (0.0%) |
| Legal Services & Support | 0 (0.0%) | 0 (0.0%) |
| Education Instruction & Library | 2 (11.1%) | 16 (88.9%) |
| Arts, Media & Entertainment | 3 (100.0%) | 0 (0.0%) |
| Health Diagnosing & Treating | 3 (15.8%) | 16 (84.2%) |
| Health Technologists | 3 (75.0%) | 1 (25.0%) |
| Total (Category) | 17 (23.3%) | 56 (76.7%) |
| Total (Overall) | 86 (45.3%) | 104 (54.7%) |
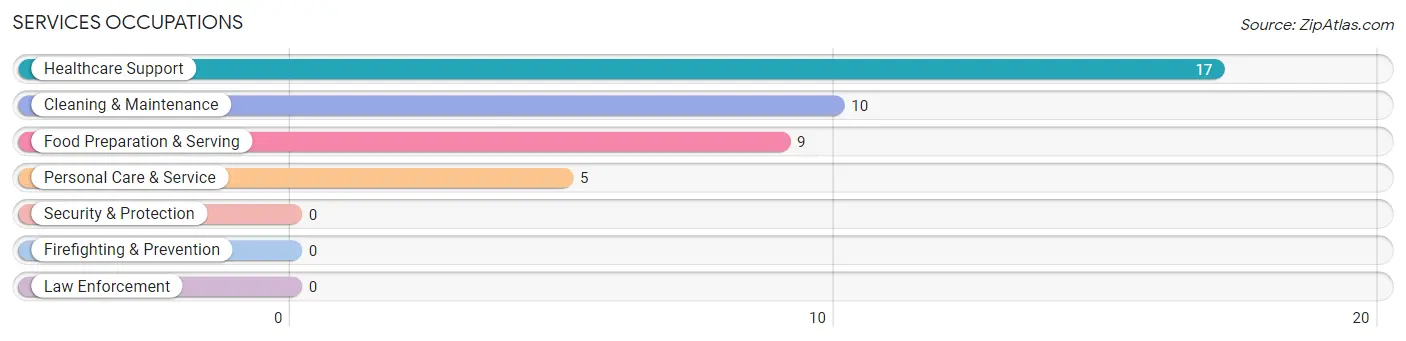
Services Occupations
The most common Services occupations in Proctorville are Healthcare Support (17 | 8.9%), Cleaning & Maintenance (10 | 5.3%), Food Preparation & Serving (9 | 4.7%), and Personal Care & Service (5 | 2.6%).
Services Occupations by Sex
Within the Services occupations in Proctorville, the most male-oriented occupations are Cleaning & Maintenance (100.0%), and Healthcare Support (64.7%), while the most female-oriented occupations are Food Preparation & Serving (100.0%), Personal Care & Service (100.0%), and Healthcare Support (35.3%).
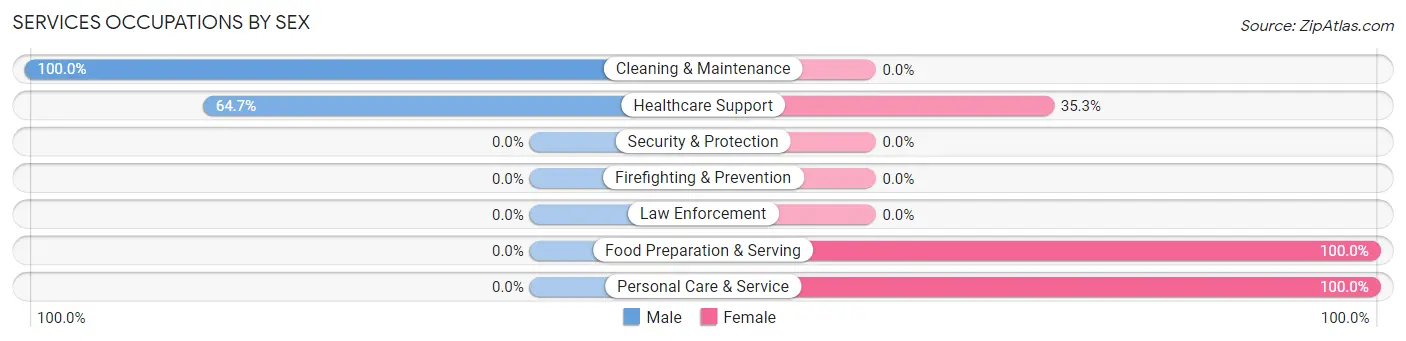
| Occupation | Male | Female |
| Healthcare Support | 11 (64.7%) | 6 (35.3%) |
| Security & Protection | 0 (0.0%) | 0 (0.0%) |
| Firefighting & Prevention | 0 (0.0%) | 0 (0.0%) |
| Law Enforcement | 0 (0.0%) | 0 (0.0%) |
| Food Preparation & Serving | 0 (0.0%) | 9 (100.0%) |
| Cleaning & Maintenance | 10 (100.0%) | 0 (0.0%) |
| Personal Care & Service | 0 (0.0%) | 5 (100.0%) |
| Total (Category) | 21 (51.2%) | 20 (48.8%) |
| Total (Overall) | 86 (45.3%) | 104 (54.7%) |
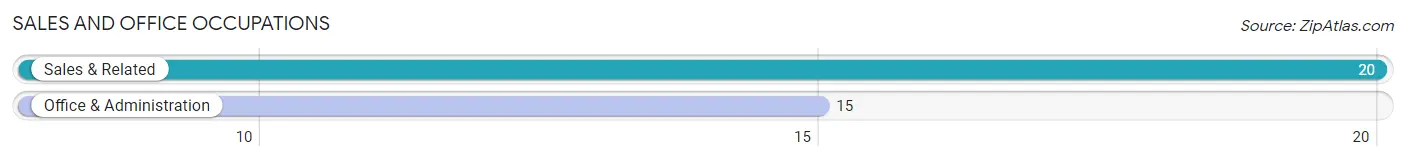
Sales and Office Occupations
The most common Sales and Office occupations in Proctorville are Sales & Related (20 | 10.5%), and Office & Administration (15 | 7.9%).
Sales and Office Occupations by Sex
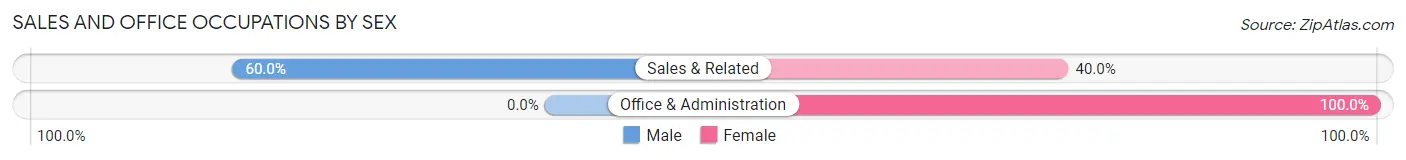
| Occupation | Male | Female |
| Sales & Related | 12 (60.0%) | 8 (40.0%) |
| Office & Administration | 0 (0.0%) | 15 (100.0%) |
| Total (Category) | 12 (34.3%) | 23 (65.7%) |
| Total (Overall) | 86 (45.3%) | 104 (54.7%) |
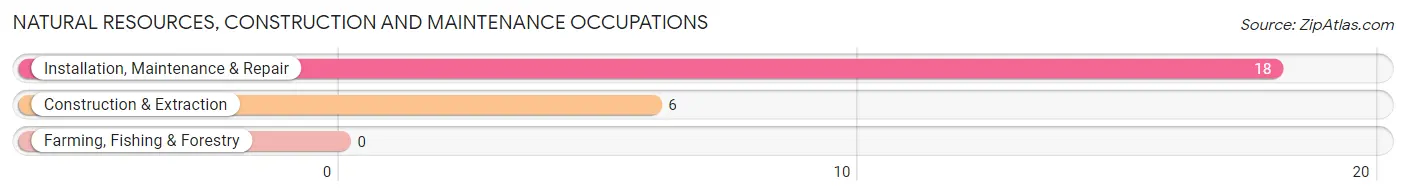
Natural Resources, Construction and Maintenance Occupations
The most common Natural Resources, Construction and Maintenance occupations in Proctorville are Installation, Maintenance & Repair (18 | 9.5%), and Construction & Extraction (6 | 3.2%).
Natural Resources, Construction and Maintenance Occupations by Sex
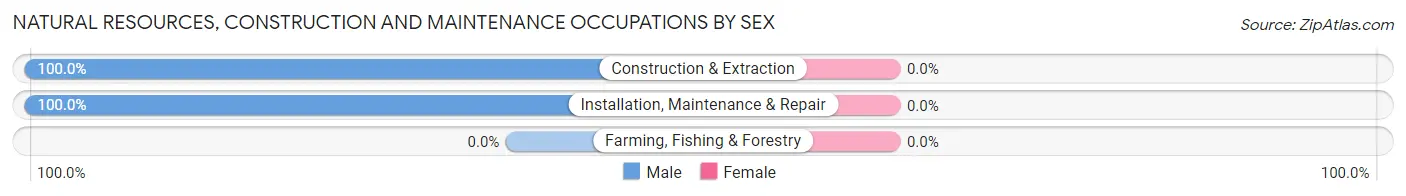
| Occupation | Male | Female |
| Farming, Fishing & Forestry | 0 (0.0%) | 0 (0.0%) |
| Construction & Extraction | 6 (100.0%) | 0 (0.0%) |
| Installation, Maintenance & Repair | 18 (100.0%) | 0 (0.0%) |
| Total (Category) | 24 (100.0%) | 0 (0.0%) |
| Total (Overall) | 86 (45.3%) | 104 (54.7%) |
Production, Transportation and Moving Occupations
The most common Production, Transportation and Moving occupations in Proctorville are Production (7 | 3.7%), Transportation (6 | 3.2%), and Material Moving (4 | 2.1%).
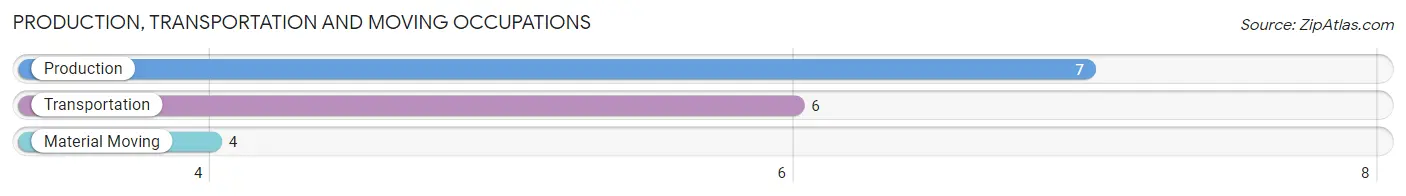
Production, Transportation and Moving Occupations by Sex
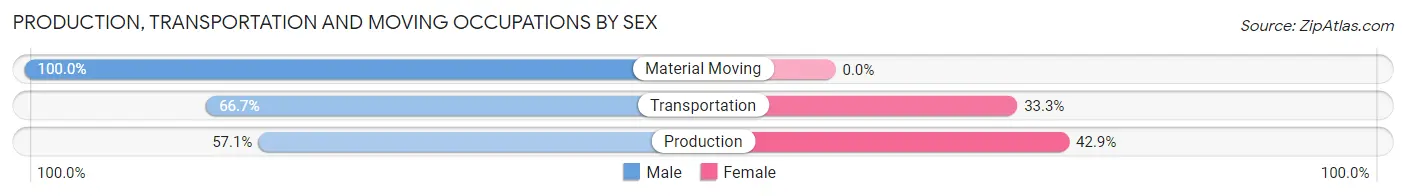
| Occupation | Male | Female |
| Production | 4 (57.1%) | 3 (42.9%) |
| Transportation | 4 (66.7%) | 2 (33.3%) |
| Material Moving | 4 (100.0%) | 0 (0.0%) |
| Total (Category) | 12 (70.6%) | 5 (29.4%) |
| Total (Overall) | 86 (45.3%) | 104 (54.7%) |
Employment Industries by Sex in Proctorville
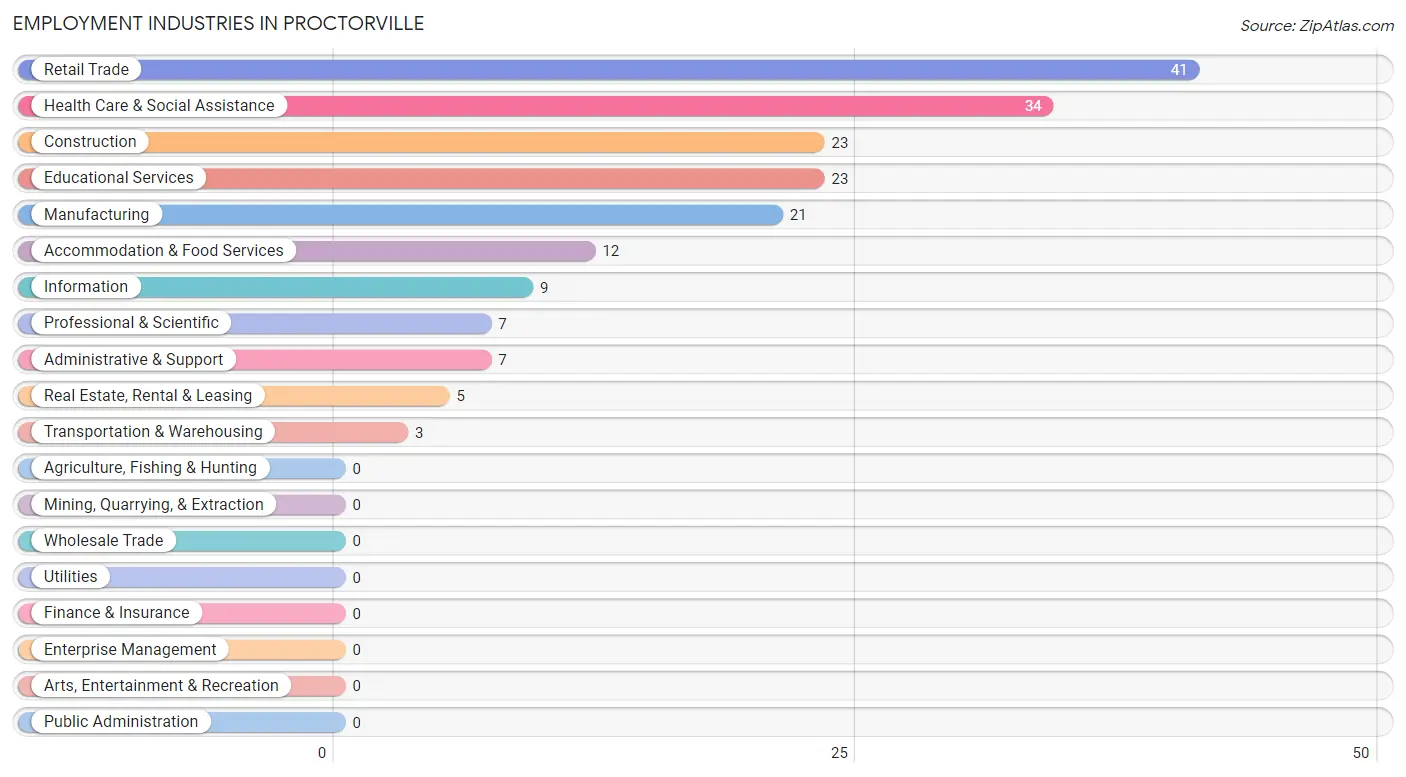
Employment Industries in Proctorville
The major employment industries in Proctorville include Retail Trade (41 | 21.6%), Health Care & Social Assistance (34 | 17.9%), Construction (23 | 12.1%), Educational Services (23 | 12.1%), and Manufacturing (21 | 11.1%).
Employment Industries by Sex in Proctorville
The Proctorville industries that see more men than women are Real Estate, Rental & Leasing (100.0%), Professional & Scientific (100.0%), and Health Care & Social Assistance (64.7%), whereas the industries that tend to have a higher number of women are Manufacturing (80.9%), Accommodation & Food Services (75.0%), and Transportation & Warehousing (66.7%).
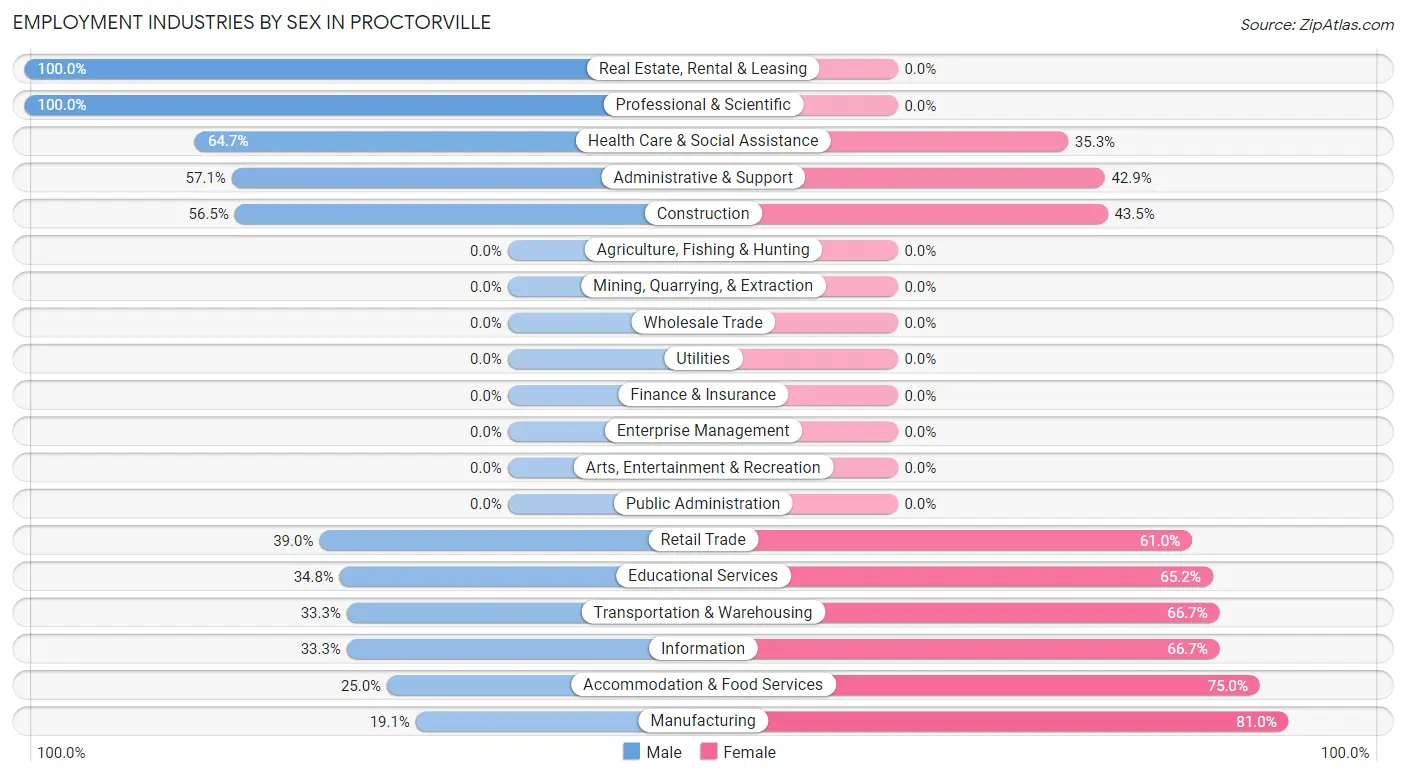
| Industry | Male | Female |
| Agriculture, Fishing & Hunting | 0 (0.0%) | 0 (0.0%) |
| Mining, Quarrying, & Extraction | 0 (0.0%) | 0 (0.0%) |
| Construction | 13 (56.5%) | 10 (43.5%) |
| Manufacturing | 4 (19.1%) | 17 (80.9%) |
| Wholesale Trade | 0 (0.0%) | 0 (0.0%) |
| Retail Trade | 16 (39.0%) | 25 (61.0%) |
| Transportation & Warehousing | 1 (33.3%) | 2 (66.7%) |
| Utilities | 0 (0.0%) | 0 (0.0%) |
| Information | 3 (33.3%) | 6 (66.7%) |
| Finance & Insurance | 0 (0.0%) | 0 (0.0%) |
| Real Estate, Rental & Leasing | 5 (100.0%) | 0 (0.0%) |
| Professional & Scientific | 7 (100.0%) | 0 (0.0%) |
| Enterprise Management | 0 (0.0%) | 0 (0.0%) |
| Administrative & Support | 4 (57.1%) | 3 (42.9%) |
| Educational Services | 8 (34.8%) | 15 (65.2%) |
| Health Care & Social Assistance | 22 (64.7%) | 12 (35.3%) |
| Arts, Entertainment & Recreation | 0 (0.0%) | 0 (0.0%) |
| Accommodation & Food Services | 3 (25.0%) | 9 (75.0%) |
| Public Administration | 0 (0.0%) | 0 (0.0%) |
| Total | 86 (45.3%) | 104 (54.7%) |
Education in Proctorville
School Enrollment in Proctorville
The most common levels of schooling among the 65 students in Proctorville are middle school (23 | 35.4%), college / undergraduate (21 | 32.3%), and high school (11 | 16.9%).
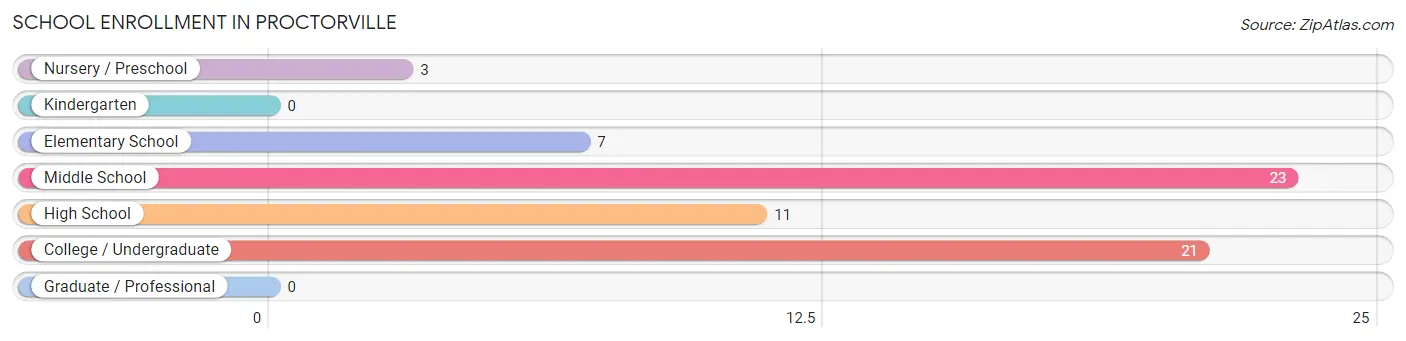
| School Level | # Students | % Students |
| Nursery / Preschool | 3 | 4.6% |
| Kindergarten | 0 | 0.0% |
| Elementary School | 7 | 10.8% |
| Middle School | 23 | 35.4% |
| High School | 11 | 16.9% |
| College / Undergraduate | 21 | 32.3% |
| Graduate / Professional | 0 | 0.0% |
| Total | 65 | 100.0% |
School Enrollment by Age by Funding Source in Proctorville
Out of a total of 65 students who are enrolled in schools in Proctorville, 7 (10.8%) attend a private institution, while the remaining 58 (89.2%) are enrolled in public schools. The age group of 3 to 4 year olds has the highest likelihood of being enrolled in private schools, with 3 (100.0% in the age bracket) enrolled. Conversely, the age group of 5 to 9 year old has the lowest likelihood of being enrolled in a private school, with 6 (100.0% in the age bracket) attending a public institution.
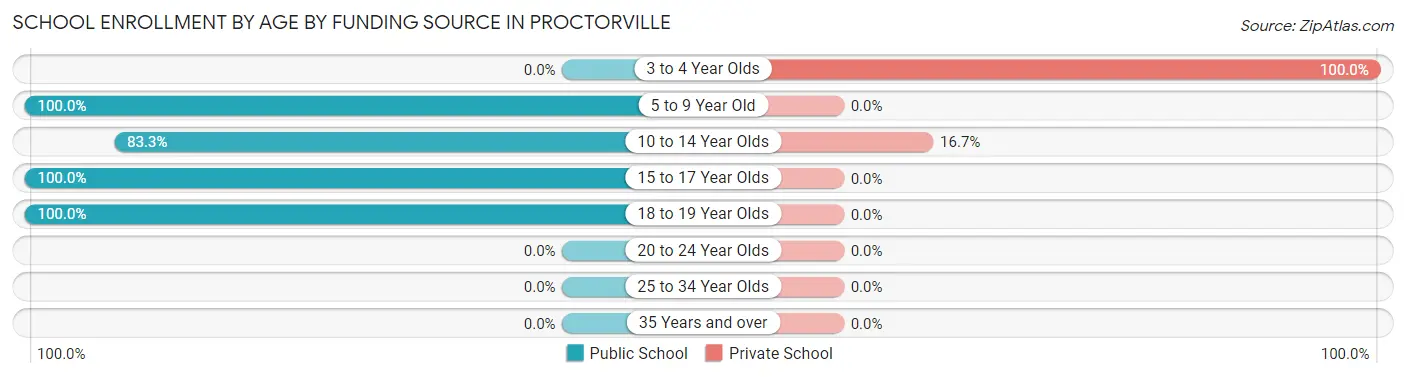
| Age Bracket | Public School | Private School |
| 3 to 4 Year Olds | 0 (0.0%) | 3 (100.0%) |
| 5 to 9 Year Old | 6 (100.0%) | 0 (0.0%) |
| 10 to 14 Year Olds | 20 (83.3%) | 4 (16.7%) |
| 15 to 17 Year Olds | 11 (100.0%) | 0 (0.0%) |
| 18 to 19 Year Olds | 21 (100.0%) | 0 (0.0%) |
| 20 to 24 Year Olds | 0 (0.0%) | 0 (0.0%) |
| 25 to 34 Year Olds | 0 (0.0%) | 0 (0.0%) |
| 35 Years and over | 0 (0.0%) | 0 (0.0%) |
| Total | 58 (89.2%) | 7 (10.8%) |
Educational Attainment by Field of Study in Proctorville
Education (51 | 73.9%), business (7 | 10.1%), visual & performing arts (5 | 7.2%), communications (4 | 5.8%), and engineering (2 | 2.9%) are the most common fields of study among 69 individuals in Proctorville who have obtained a bachelor's degree or higher.
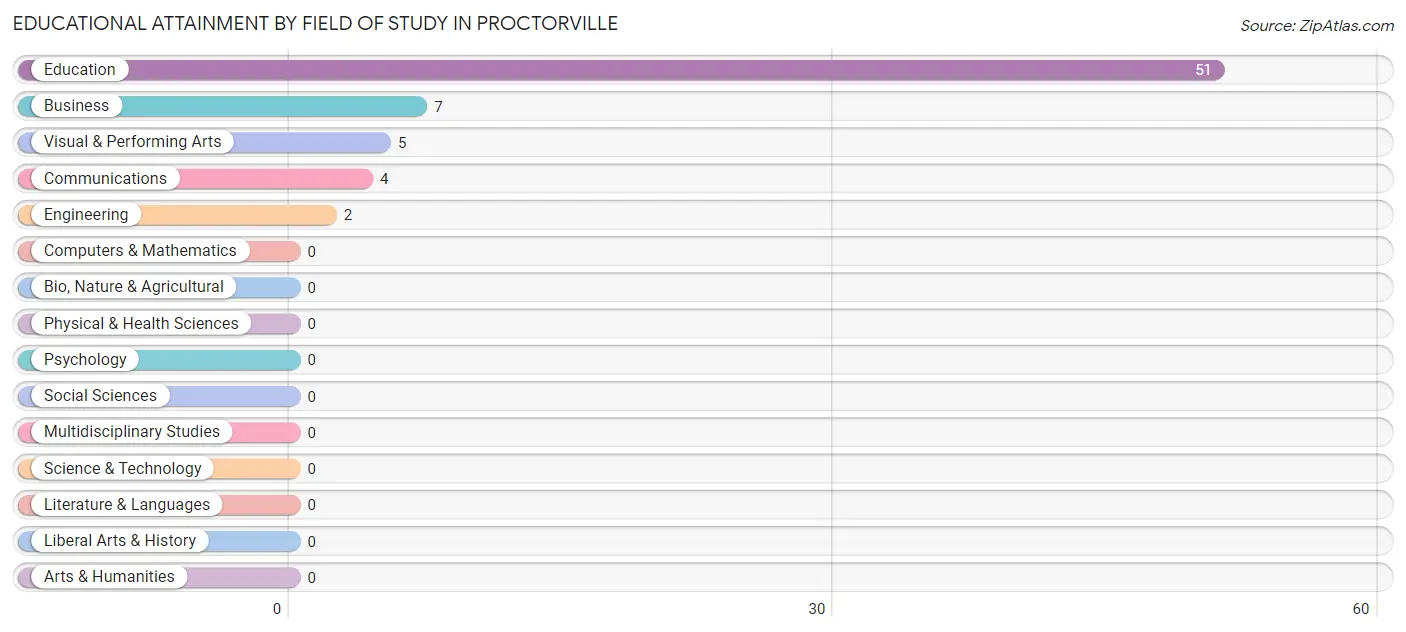
| Field of Study | # Graduates | % Graduates |
| Computers & Mathematics | 0 | 0.0% |
| Bio, Nature & Agricultural | 0 | 0.0% |
| Physical & Health Sciences | 0 | 0.0% |
| Psychology | 0 | 0.0% |
| Social Sciences | 0 | 0.0% |
| Engineering | 2 | 2.9% |
| Multidisciplinary Studies | 0 | 0.0% |
| Science & Technology | 0 | 0.0% |
| Business | 7 | 10.1% |
| Education | 51 | 73.9% |
| Literature & Languages | 0 | 0.0% |
| Liberal Arts & History | 0 | 0.0% |
| Visual & Performing Arts | 5 | 7.2% |
| Communications | 4 | 5.8% |
| Arts & Humanities | 0 | 0.0% |
| Total | 69 | 100.0% |
Transportation & Commute in Proctorville
Vehicle Availability by Sex in Proctorville
The most prevalent vehicle ownership categories in Proctorville are males with 2 vehicles (36, accounting for 41.9%) and females with 2 vehicles (36, making up 35.6%).
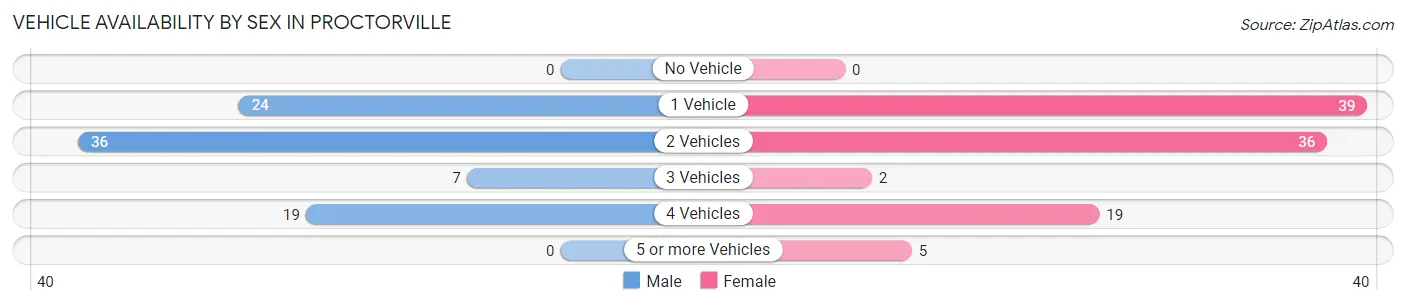
| Vehicles Available | Male | Female |
| No Vehicle | 0 (0.0%) | 0 (0.0%) |
| 1 Vehicle | 24 (27.9%) | 39 (38.6%) |
| 2 Vehicles | 36 (41.9%) | 36 (35.6%) |
| 3 Vehicles | 7 (8.1%) | 2 (2.0%) |
| 4 Vehicles | 19 (22.1%) | 19 (18.8%) |
| 5 or more Vehicles | 0 (0.0%) | 5 (5.0%) |
| Total | 86 (100.0%) | 101 (100.0%) |
Commute Time in Proctorville
The most frequently occuring commute durations in Proctorville are 20 to 24 minutes (48 commuters, 25.7%), 10 to 14 minutes (38 commuters, 20.3%), and 15 to 19 minutes (38 commuters, 20.3%).
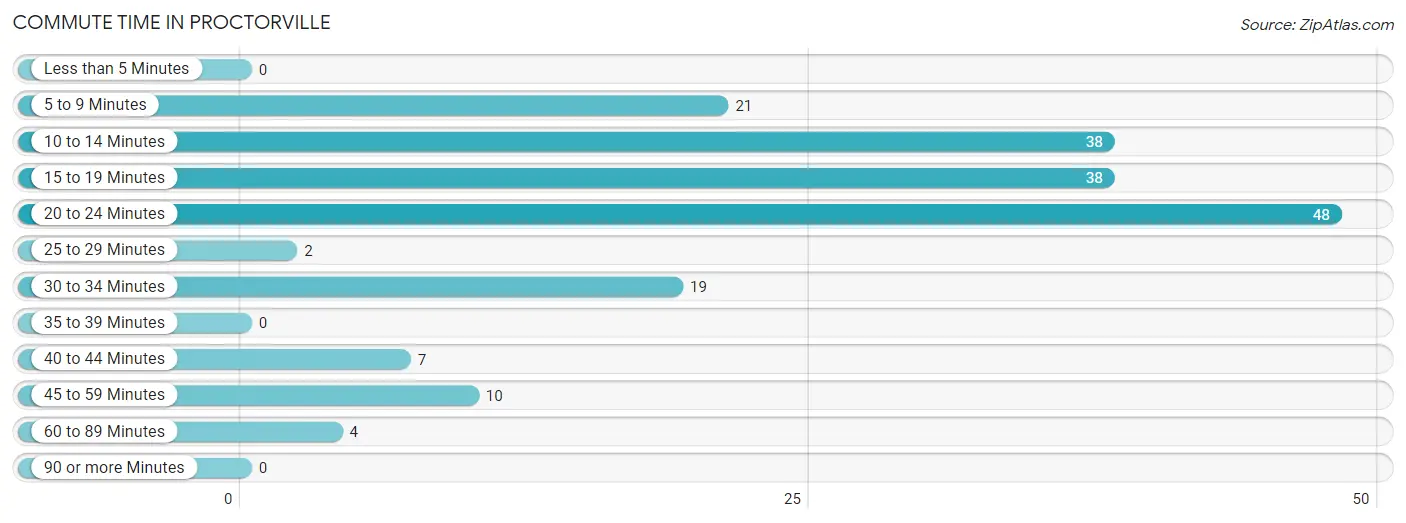
| Commute Time | # Commuters | % Commuters |
| Less than 5 Minutes | 0 | 0.0% |
| 5 to 9 Minutes | 21 | 11.2% |
| 10 to 14 Minutes | 38 | 20.3% |
| 15 to 19 Minutes | 38 | 20.3% |
| 20 to 24 Minutes | 48 | 25.7% |
| 25 to 29 Minutes | 2 | 1.1% |
| 30 to 34 Minutes | 19 | 10.2% |
| 35 to 39 Minutes | 0 | 0.0% |
| 40 to 44 Minutes | 7 | 3.7% |
| 45 to 59 Minutes | 10 | 5.3% |
| 60 to 89 Minutes | 4 | 2.1% |
| 90 or more Minutes | 0 | 0.0% |
Commute Time by Sex in Proctorville
The most common commute times in Proctorville are 10 to 14 minutes (21 commuters, 24.4%) for males and 20 to 24 minutes (30 commuters, 29.7%) for females.
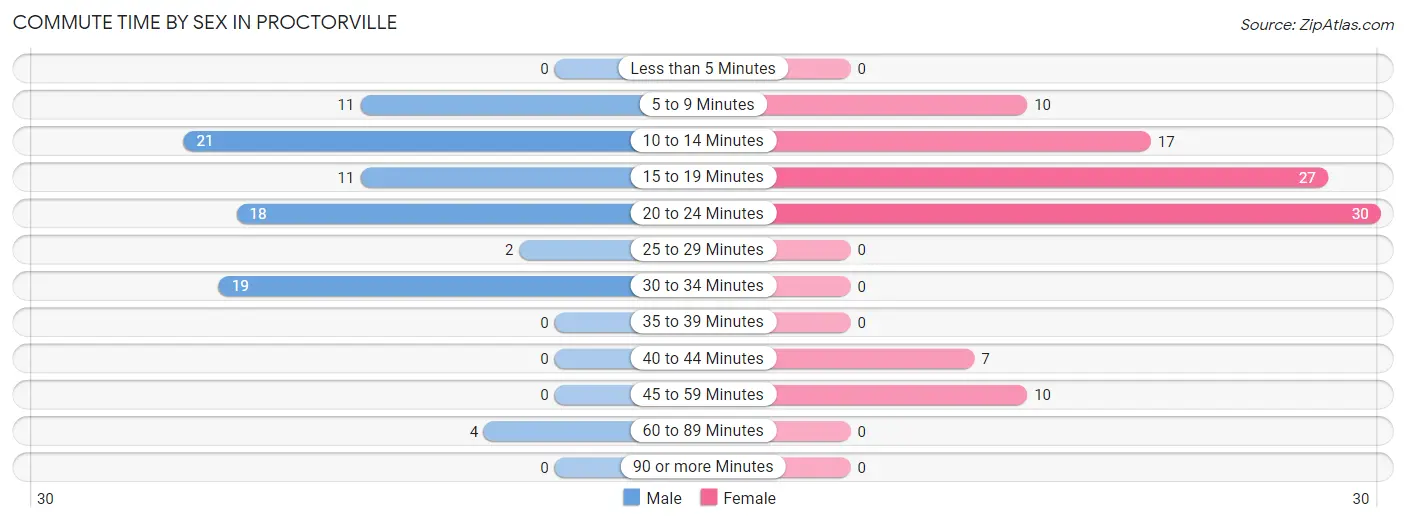
| Commute Time | Male | Female |
| Less than 5 Minutes | 0 (0.0%) | 0 (0.0%) |
| 5 to 9 Minutes | 11 (12.8%) | 10 (9.9%) |
| 10 to 14 Minutes | 21 (24.4%) | 17 (16.8%) |
| 15 to 19 Minutes | 11 (12.8%) | 27 (26.7%) |
| 20 to 24 Minutes | 18 (20.9%) | 30 (29.7%) |
| 25 to 29 Minutes | 2 (2.3%) | 0 (0.0%) |
| 30 to 34 Minutes | 19 (22.1%) | 0 (0.0%) |
| 35 to 39 Minutes | 0 (0.0%) | 0 (0.0%) |
| 40 to 44 Minutes | 0 (0.0%) | 7 (6.9%) |
| 45 to 59 Minutes | 0 (0.0%) | 10 (9.9%) |
| 60 to 89 Minutes | 4 (4.6%) | 0 (0.0%) |
| 90 or more Minutes | 0 (0.0%) | 0 (0.0%) |
Time of Departure to Work by Sex in Proctorville
The most frequent times of departure to work in Proctorville are 8:00 AM to 8:29 AM (17, 19.8%) for males and 4:00 PM to 11:59 PM (34, 33.7%) for females.
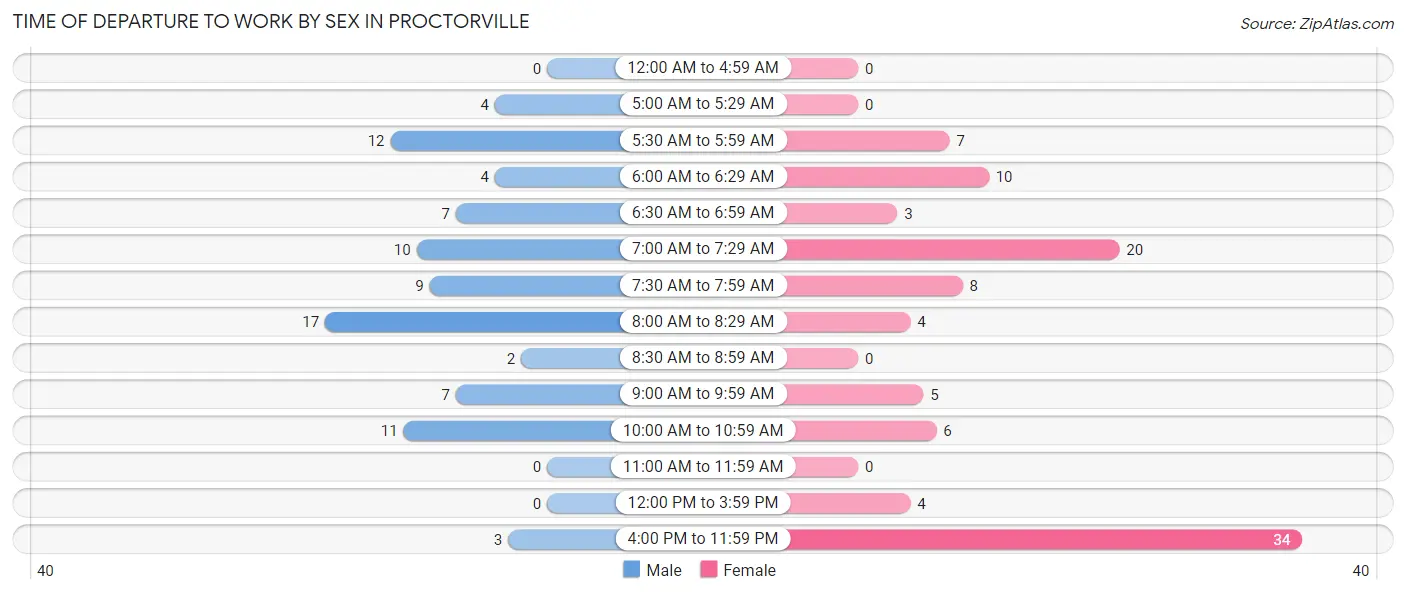
| Time of Departure | Male | Female |
| 12:00 AM to 4:59 AM | 0 (0.0%) | 0 (0.0%) |
| 5:00 AM to 5:29 AM | 4 (4.6%) | 0 (0.0%) |
| 5:30 AM to 5:59 AM | 12 (14.0%) | 7 (6.9%) |
| 6:00 AM to 6:29 AM | 4 (4.6%) | 10 (9.9%) |
| 6:30 AM to 6:59 AM | 7 (8.1%) | 3 (3.0%) |
| 7:00 AM to 7:29 AM | 10 (11.6%) | 20 (19.8%) |
| 7:30 AM to 7:59 AM | 9 (10.5%) | 8 (7.9%) |
| 8:00 AM to 8:29 AM | 17 (19.8%) | 4 (4.0%) |
| 8:30 AM to 8:59 AM | 2 (2.3%) | 0 (0.0%) |
| 9:00 AM to 9:59 AM | 7 (8.1%) | 5 (5.0%) |
| 10:00 AM to 10:59 AM | 11 (12.8%) | 6 (5.9%) |
| 11:00 AM to 11:59 AM | 0 (0.0%) | 0 (0.0%) |
| 12:00 PM to 3:59 PM | 0 (0.0%) | 4 (4.0%) |
| 4:00 PM to 11:59 PM | 3 (3.5%) | 34 (33.7%) |
| Total | 86 (100.0%) | 101 (100.0%) |
Housing Occupancy in Proctorville
Occupancy by Ownership in Proctorville
Of the total 325 dwellings in Proctorville, owner-occupied units account for 98 (30.1%), while renter-occupied units make up 227 (69.9%).
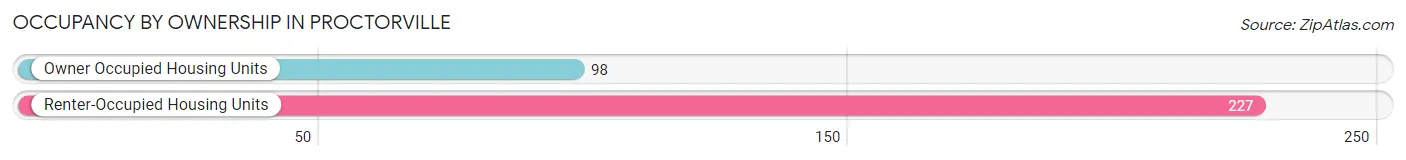
| Occupancy | # Housing Units | % Housing Units |
| Owner Occupied Housing Units | 98 | 30.1% |
| Renter-Occupied Housing Units | 227 | 69.9% |
| Total Occupied Housing Units | 325 | 100.0% |
Occupancy by Household Size in Proctorville
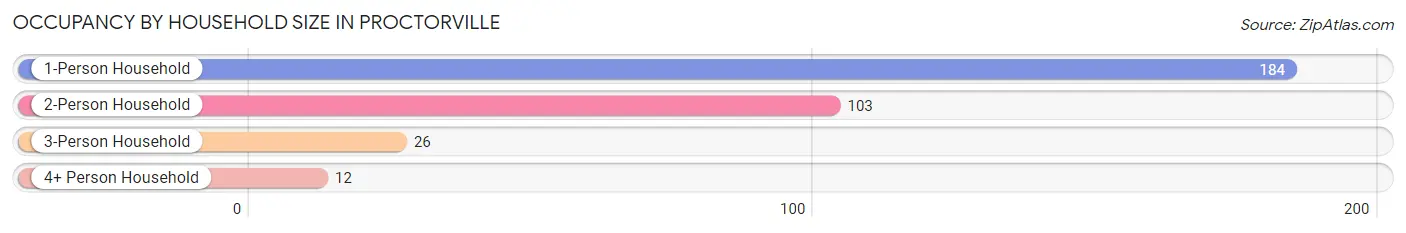
| Household Size | # Housing Units | % Housing Units |
| 1-Person Household | 184 | 56.6% |
| 2-Person Household | 103 | 31.7% |
| 3-Person Household | 26 | 8.0% |
| 4+ Person Household | 12 | 3.7% |
| Total Housing Units | 325 | 100.0% |
Occupancy by Ownership by Household Size in Proctorville
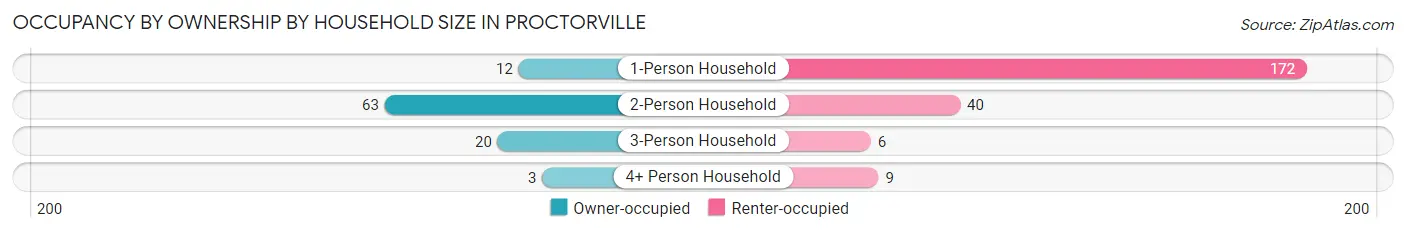
| Household Size | Owner-occupied | Renter-occupied |
| 1-Person Household | 12 (6.5%) | 172 (93.5%) |
| 2-Person Household | 63 (61.2%) | 40 (38.8%) |
| 3-Person Household | 20 (76.9%) | 6 (23.1%) |
| 4+ Person Household | 3 (25.0%) | 9 (75.0%) |
| Total Housing Units | 98 (30.1%) | 227 (69.9%) |
Occupancy by Educational Attainment in Proctorville
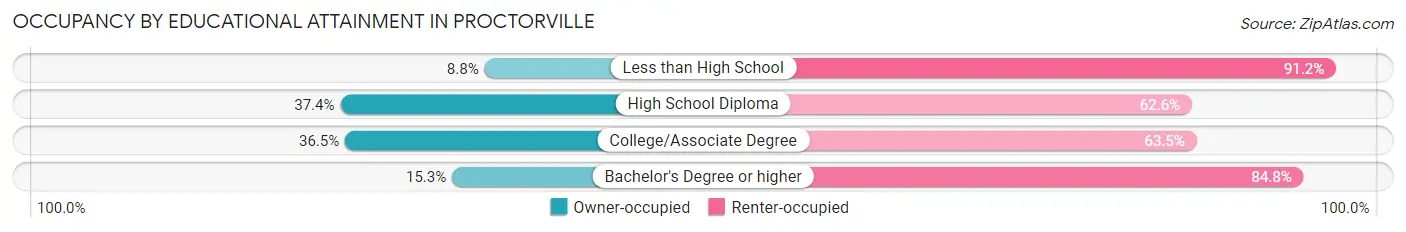
| Household Size | Owner-occupied | Renter-occupied |
| Less than High School | 3 (8.8%) | 31 (91.2%) |
| High School Diploma | 55 (37.4%) | 92 (62.6%) |
| College/Associate Degree | 31 (36.5%) | 54 (63.5%) |
| Bachelor's Degree or higher | 9 (15.2%) | 50 (84.8%) |
Occupancy by Age of Householder in Proctorville
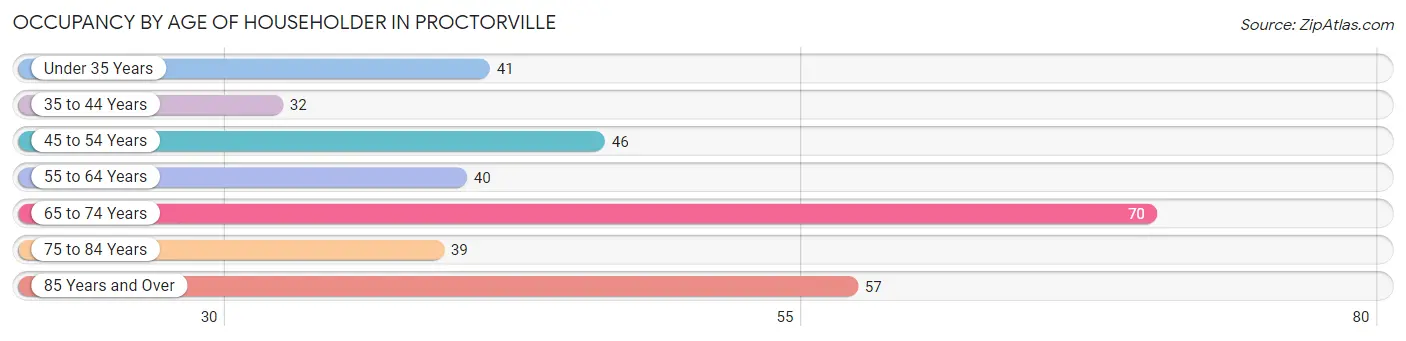
| Age Bracket | # Households | % Households |
| Under 35 Years | 41 | 12.6% |
| 35 to 44 Years | 32 | 9.9% |
| 45 to 54 Years | 46 | 14.1% |
| 55 to 64 Years | 40 | 12.3% |
| 65 to 74 Years | 70 | 21.5% |
| 75 to 84 Years | 39 | 12.0% |
| 85 Years and Over | 57 | 17.5% |
| Total | 325 | 100.0% |
Housing Finances in Proctorville
Median Income by Occupancy in Proctorville
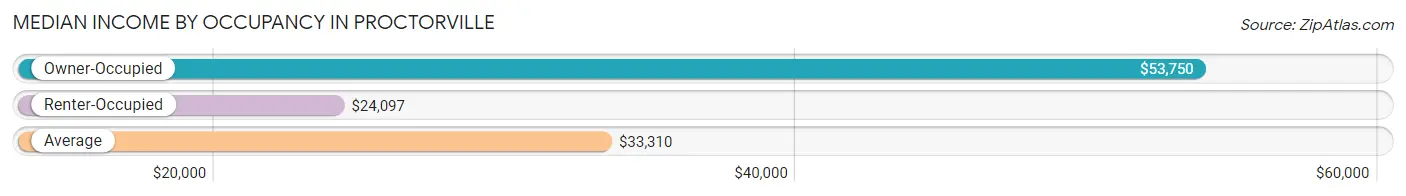
| Occupancy Type | # Households | Median Income |
| Owner-Occupied | 98 (30.1%) | $53,750 |
| Renter-Occupied | 227 (69.9%) | $24,097 |
| Average | 325 (100.0%) | $33,310 |
Occupancy by Householder Income Bracket in Proctorville
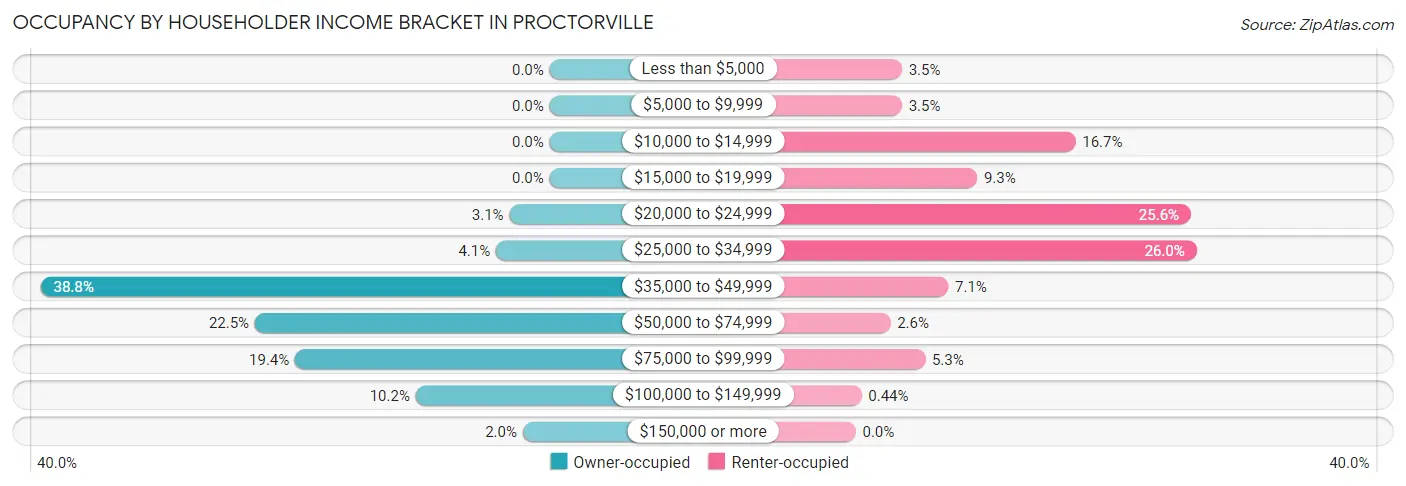
| Income Bracket | Owner-occupied | Renter-occupied |
| Less than $5,000 | 0 (0.0%) | 8 (3.5%) |
| $5,000 to $9,999 | 0 (0.0%) | 8 (3.5%) |
| $10,000 to $14,999 | 0 (0.0%) | 38 (16.7%) |
| $15,000 to $19,999 | 0 (0.0%) | 21 (9.2%) |
| $20,000 to $24,999 | 3 (3.1%) | 58 (25.6%) |
| $25,000 to $34,999 | 4 (4.1%) | 59 (26.0%) |
| $35,000 to $49,999 | 38 (38.8%) | 16 (7.0%) |
| $50,000 to $74,999 | 22 (22.5%) | 6 (2.6%) |
| $75,000 to $99,999 | 19 (19.4%) | 12 (5.3%) |
| $100,000 to $149,999 | 10 (10.2%) | 1 (0.4%) |
| $150,000 or more | 2 (2.0%) | 0 (0.0%) |
| Total | 98 (100.0%) | 227 (100.0%) |
Monthly Housing Cost Tiers in Proctorville
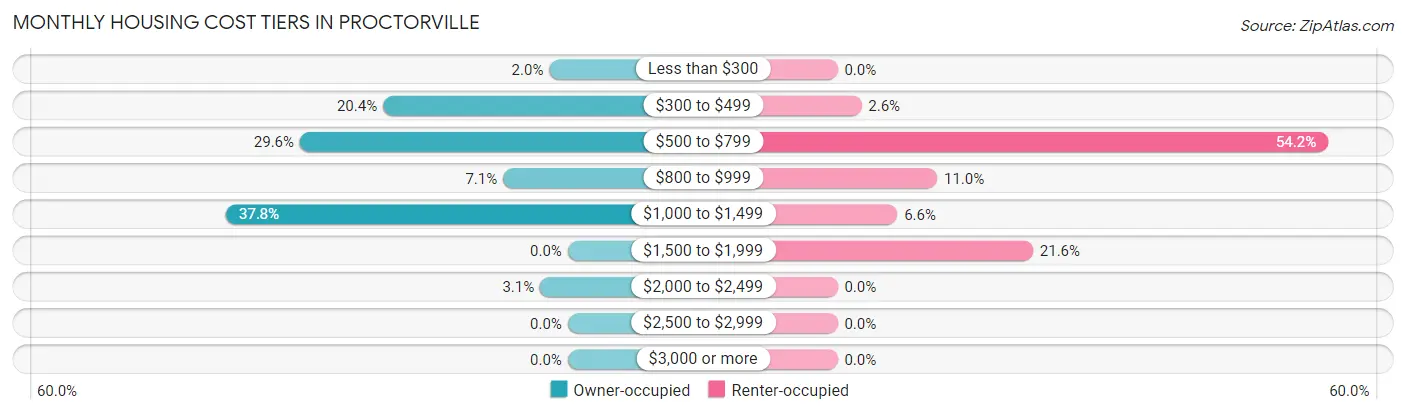
| Monthly Cost | Owner-occupied | Renter-occupied |
| Less than $300 | 2 (2.0%) | 0 (0.0%) |
| $300 to $499 | 20 (20.4%) | 6 (2.6%) |
| $500 to $799 | 29 (29.6%) | 123 (54.2%) |
| $800 to $999 | 7 (7.1%) | 25 (11.0%) |
| $1,000 to $1,499 | 37 (37.8%) | 15 (6.6%) |
| $1,500 to $1,999 | 0 (0.0%) | 49 (21.6%) |
| $2,000 to $2,499 | 3 (3.1%) | 0 (0.0%) |
| $2,500 to $2,999 | 0 (0.0%) | 0 (0.0%) |
| $3,000 or more | 0 (0.0%) | 0 (0.0%) |
| Total | 98 (100.0%) | 227 (100.0%) |
Physical Housing Characteristics in Proctorville
Housing Structures in Proctorville
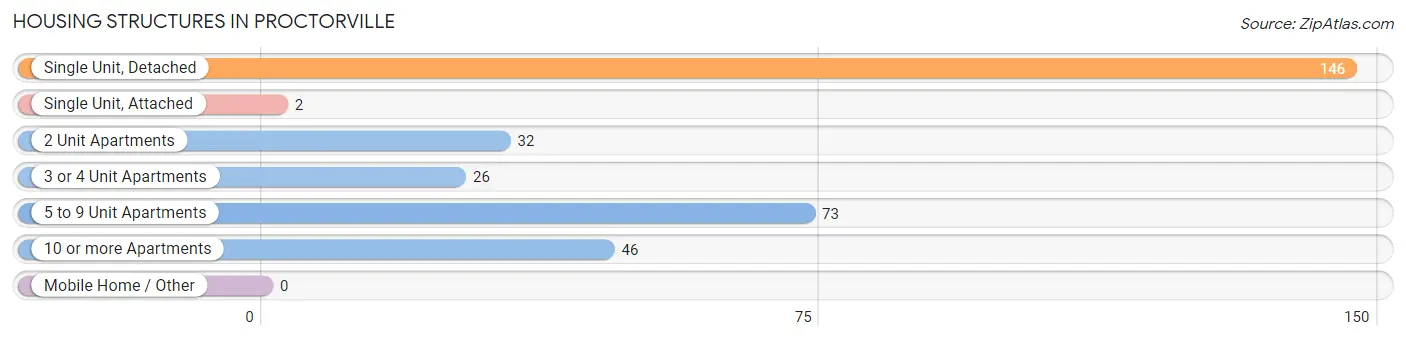
| Structure Type | # Housing Units | % Housing Units |
| Single Unit, Detached | 146 | 44.9% |
| Single Unit, Attached | 2 | 0.6% |
| 2 Unit Apartments | 32 | 9.9% |
| 3 or 4 Unit Apartments | 26 | 8.0% |
| 5 to 9 Unit Apartments | 73 | 22.5% |
| 10 or more Apartments | 46 | 14.1% |
| Mobile Home / Other | 0 | 0.0% |
| Total | 325 | 100.0% |
Housing Structures by Occupancy in Proctorville
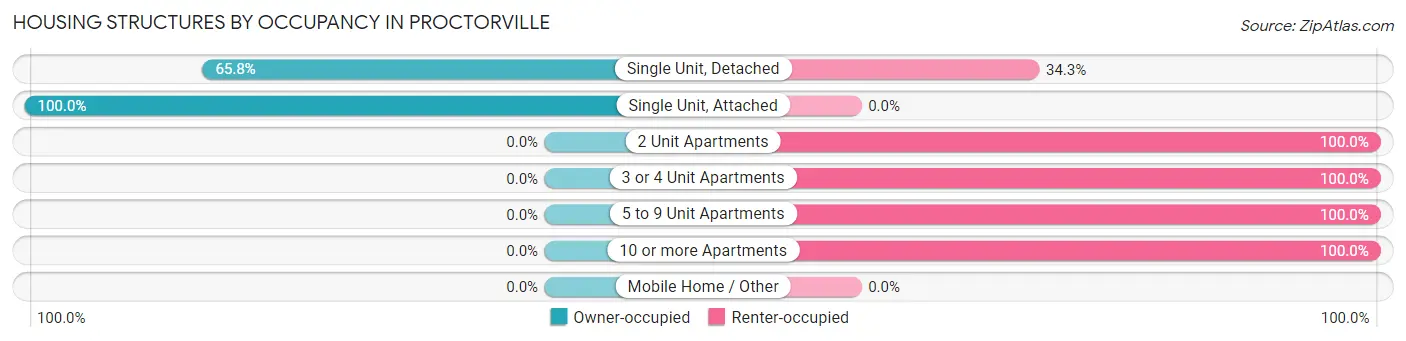
| Structure Type | Owner-occupied | Renter-occupied |
| Single Unit, Detached | 96 (65.7%) | 50 (34.3%) |
| Single Unit, Attached | 2 (100.0%) | 0 (0.0%) |
| 2 Unit Apartments | 0 (0.0%) | 32 (100.0%) |
| 3 or 4 Unit Apartments | 0 (0.0%) | 26 (100.0%) |
| 5 to 9 Unit Apartments | 0 (0.0%) | 73 (100.0%) |
| 10 or more Apartments | 0 (0.0%) | 46 (100.0%) |
| Mobile Home / Other | 0 (0.0%) | 0 (0.0%) |
| Total | 98 (30.1%) | 227 (69.9%) |
Housing Structures by Number of Rooms in Proctorville
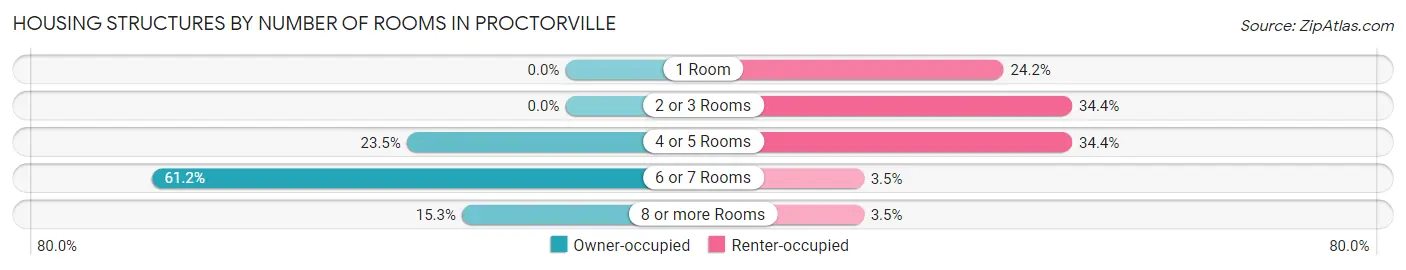
| Number of Rooms | Owner-occupied | Renter-occupied |
| 1 Room | 0 (0.0%) | 55 (24.2%) |
| 2 or 3 Rooms | 0 (0.0%) | 78 (34.4%) |
| 4 or 5 Rooms | 23 (23.5%) | 78 (34.4%) |
| 6 or 7 Rooms | 60 (61.2%) | 8 (3.5%) |
| 8 or more Rooms | 15 (15.3%) | 8 (3.5%) |
| Total | 98 (100.0%) | 227 (100.0%) |
Housing Structure by Heating Type in Proctorville
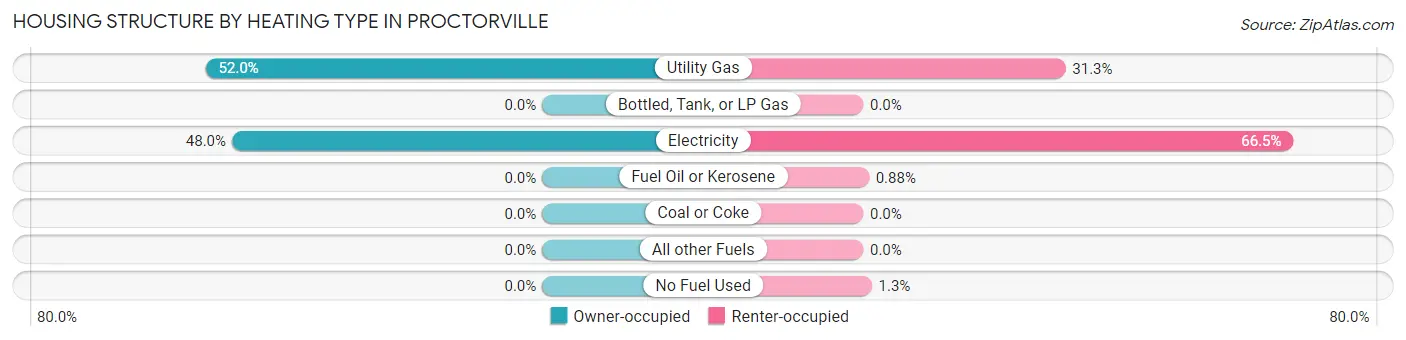
| Heating Type | Owner-occupied | Renter-occupied |
| Utility Gas | 51 (52.0%) | 71 (31.3%) |
| Bottled, Tank, or LP Gas | 0 (0.0%) | 0 (0.0%) |
| Electricity | 47 (48.0%) | 151 (66.5%) |
| Fuel Oil or Kerosene | 0 (0.0%) | 2 (0.9%) |
| Coal or Coke | 0 (0.0%) | 0 (0.0%) |
| All other Fuels | 0 (0.0%) | 0 (0.0%) |
| No Fuel Used | 0 (0.0%) | 3 (1.3%) |
| Total | 98 (100.0%) | 227 (100.0%) |
Household Vehicle Usage in Proctorville
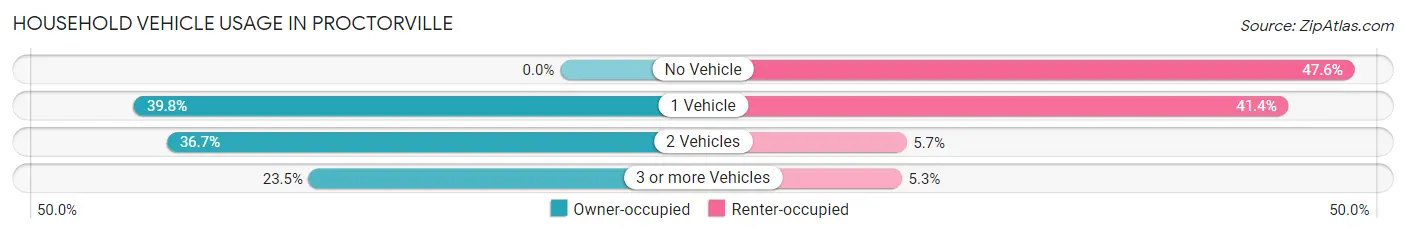
| Vehicles per Household | Owner-occupied | Renter-occupied |
| No Vehicle | 0 (0.0%) | 108 (47.6%) |
| 1 Vehicle | 39 (39.8%) | 94 (41.4%) |
| 2 Vehicles | 36 (36.7%) | 13 (5.7%) |
| 3 or more Vehicles | 23 (23.5%) | 12 (5.3%) |
| Total | 98 (100.0%) | 227 (100.0%) |
Real Estate & Mortgages in Proctorville
Real Estate and Mortgage Overview in Proctorville
| Characteristic | Without Mortgage | With Mortgage |
| Housing Units | 49 | 49 |
| Median Property Value | $115,600 | $98,600 |
| Median Household Income | $51,250 | $0 |
| Monthly Housing Costs | $514 | $0 |
| Real Estate Taxes | $1,102 | $0 |
Property Value by Mortgage Status in Proctorville
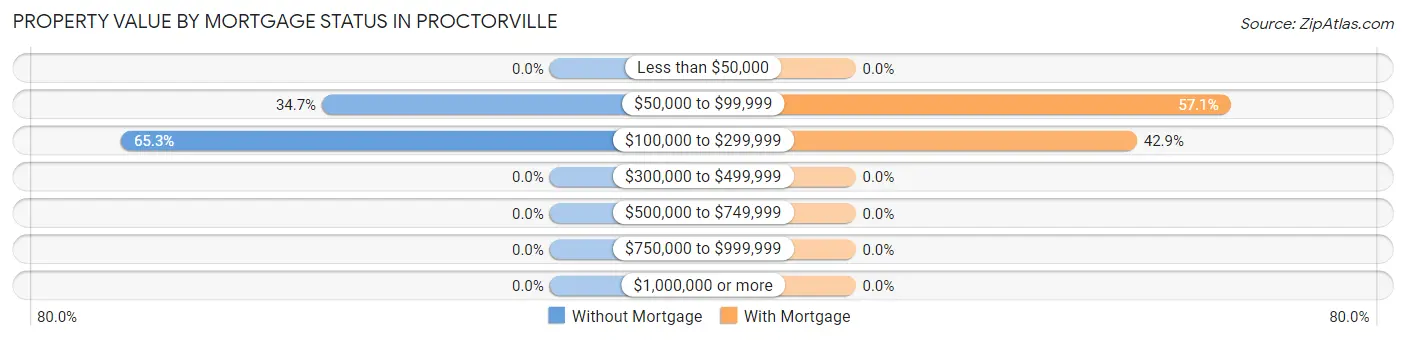
| Property Value | Without Mortgage | With Mortgage |
| Less than $50,000 | 0 (0.0%) | 0 (0.0%) |
| $50,000 to $99,999 | 17 (34.7%) | 28 (57.1%) |
| $100,000 to $299,999 | 32 (65.3%) | 21 (42.9%) |
| $300,000 to $499,999 | 0 (0.0%) | 0 (0.0%) |
| $500,000 to $749,999 | 0 (0.0%) | 0 (0.0%) |
| $750,000 to $999,999 | 0 (0.0%) | 0 (0.0%) |
| $1,000,000 or more | 0 (0.0%) | 0 (0.0%) |
| Total | 49 (100.0%) | 49 (100.0%) |
Household Income by Mortgage Status in Proctorville
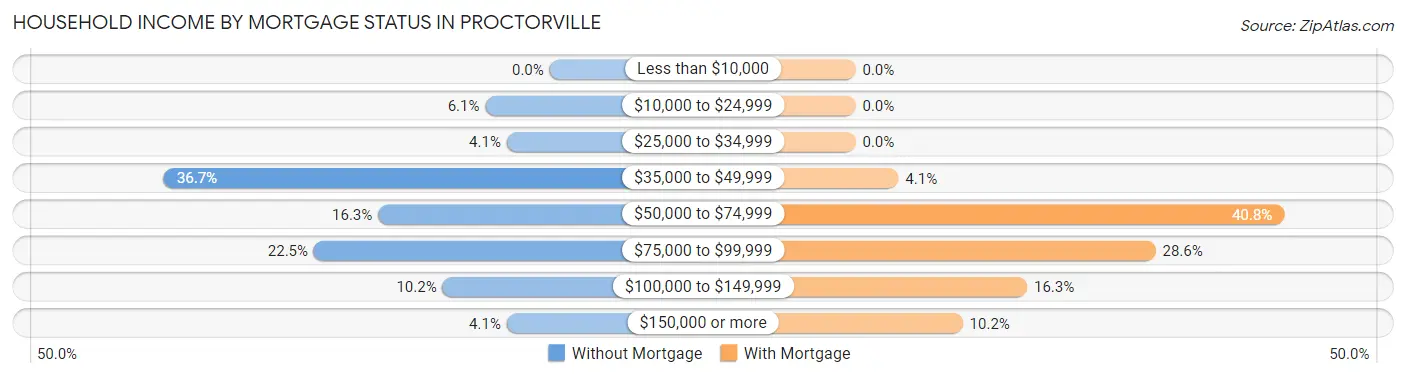
| Household Income | Without Mortgage | With Mortgage |
| Less than $10,000 | 0 (0.0%) | 0 (0.0%) |
| $10,000 to $24,999 | 3 (6.1%) | 0 (0.0%) |
| $25,000 to $34,999 | 2 (4.1%) | 0 (0.0%) |
| $35,000 to $49,999 | 18 (36.7%) | 2 (4.1%) |
| $50,000 to $74,999 | 8 (16.3%) | 20 (40.8%) |
| $75,000 to $99,999 | 11 (22.5%) | 14 (28.6%) |
| $100,000 to $149,999 | 5 (10.2%) | 8 (16.3%) |
| $150,000 or more | 2 (4.1%) | 5 (10.2%) |
| Total | 49 (100.0%) | 49 (100.0%) |
Property Value to Household Income Ratio in Proctorville
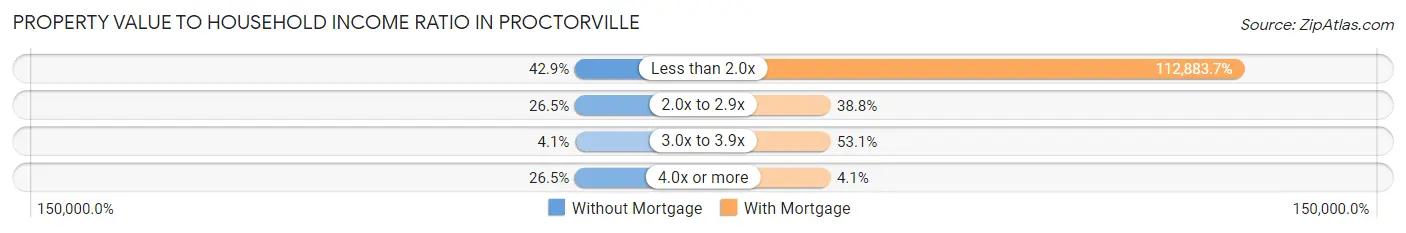
| Value-to-Income Ratio | Without Mortgage | With Mortgage |
| Less than 2.0x | 21 (42.9%) | 55,313 (112,883.7%) |
| 2.0x to 2.9x | 13 (26.5%) | 19 (38.8%) |
| 3.0x to 3.9x | 2 (4.1%) | 26 (53.1%) |
| 4.0x or more | 13 (26.5%) | 2 (4.1%) |
| Total | 49 (100.0%) | 49 (100.0%) |
Real Estate Taxes by Mortgage Status in Proctorville
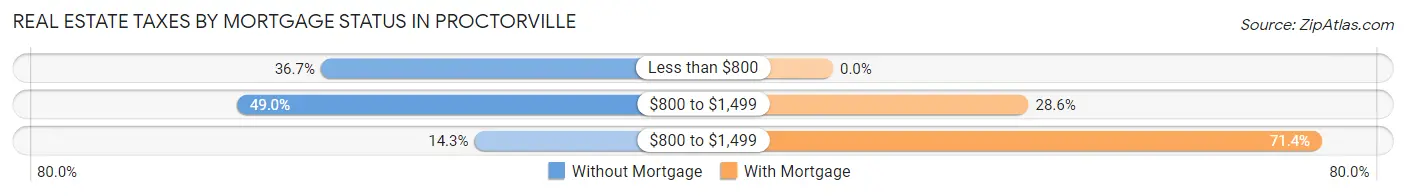
| Property Taxes | Without Mortgage | With Mortgage |
| Less than $800 | 18 (36.7%) | 0 (0.0%) |
| $800 to $1,499 | 24 (49.0%) | 14 (28.6%) |
| $800 to $1,499 | 7 (14.3%) | 35 (71.4%) |
| Total | 49 (100.0%) | 49 (100.0%) |
Health & Disability in Proctorville
Health Insurance Coverage by Age in Proctorville
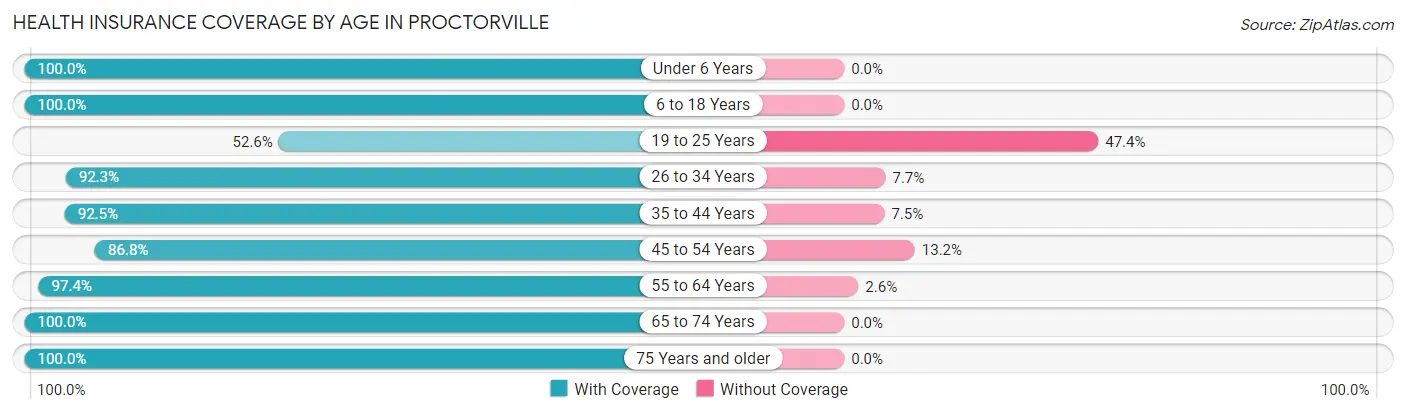
| Age Bracket | With Coverage | Without Coverage |
| Under 6 Years | 3 (100.0%) | 0 (0.0%) |
| 6 to 18 Years | 41 (100.0%) | 0 (0.0%) |
| 19 to 25 Years | 40 (52.6%) | 36 (47.4%) |
| 26 to 34 Years | 36 (92.3%) | 3 (7.7%) |
| 35 to 44 Years | 37 (92.5%) | 3 (7.5%) |
| 45 to 54 Years | 66 (86.8%) | 10 (13.2%) |
| 55 to 64 Years | 74 (97.4%) | 2 (2.6%) |
| 65 to 74 Years | 85 (100.0%) | 0 (0.0%) |
| 75 Years and older | 122 (100.0%) | 0 (0.0%) |
| Total | 504 (90.3%) | 54 (9.7%) |
Health Insurance Coverage by Citizenship Status in Proctorville
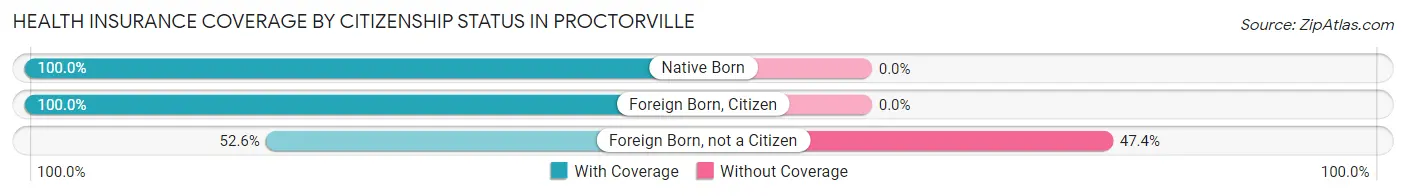
| Citizenship Status | With Coverage | Without Coverage |
| Native Born | 3 (100.0%) | 0 (0.0%) |
| Foreign Born, Citizen | 41 (100.0%) | 0 (0.0%) |
| Foreign Born, not a Citizen | 40 (52.6%) | 36 (47.4%) |
Health Insurance Coverage by Household Income in Proctorville
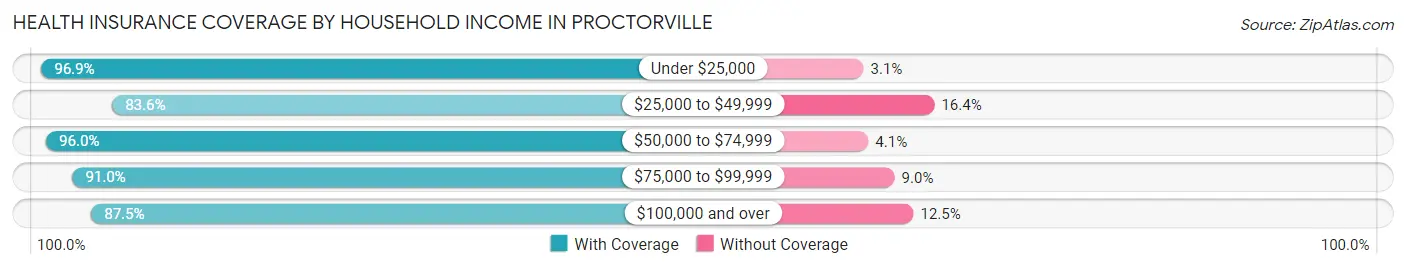
| Household Income | With Coverage | Without Coverage |
| Under $25,000 | 154 (96.9%) | 5 (3.1%) |
| $25,000 to $49,999 | 173 (83.6%) | 34 (16.4%) |
| $50,000 to $74,999 | 71 (96.0%) | 3 (4.1%) |
| $75,000 to $99,999 | 71 (91.0%) | 7 (9.0%) |
| $100,000 and over | 35 (87.5%) | 5 (12.5%) |
Public vs Private Health Insurance Coverage by Age in Proctorville
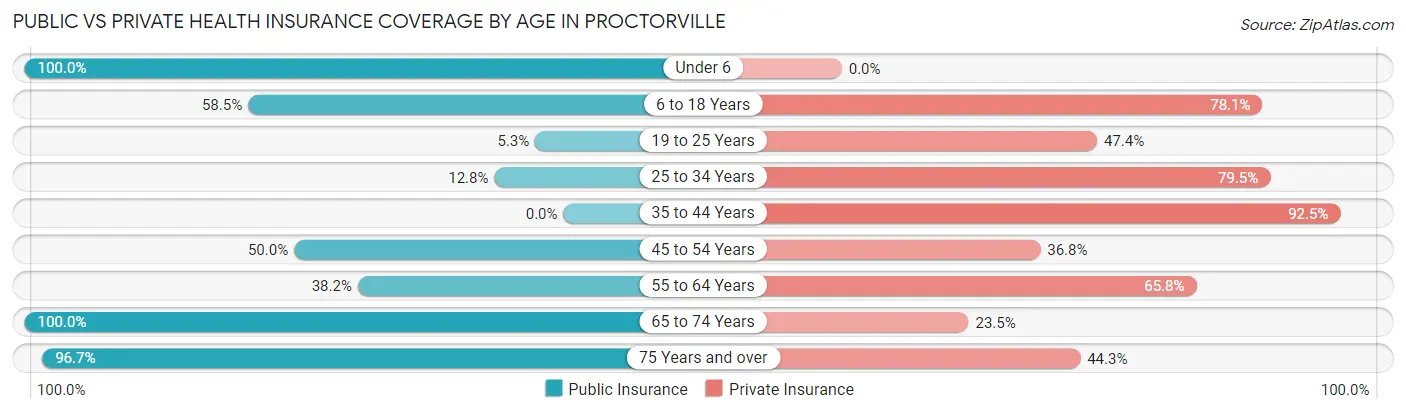
| Age Bracket | Public Insurance | Private Insurance |
| Under 6 | 3 (100.0%) | 0 (0.0%) |
| 6 to 18 Years | 24 (58.5%) | 32 (78.0%) |
| 19 to 25 Years | 4 (5.3%) | 36 (47.4%) |
| 25 to 34 Years | 5 (12.8%) | 31 (79.5%) |
| 35 to 44 Years | 0 (0.0%) | 37 (92.5%) |
| 45 to 54 Years | 38 (50.0%) | 28 (36.8%) |
| 55 to 64 Years | 29 (38.2%) | 50 (65.8%) |
| 65 to 74 Years | 85 (100.0%) | 20 (23.5%) |
| 75 Years and over | 118 (96.7%) | 54 (44.3%) |
| Total | 306 (54.8%) | 288 (51.6%) |
Disability Status by Sex by Age in Proctorville
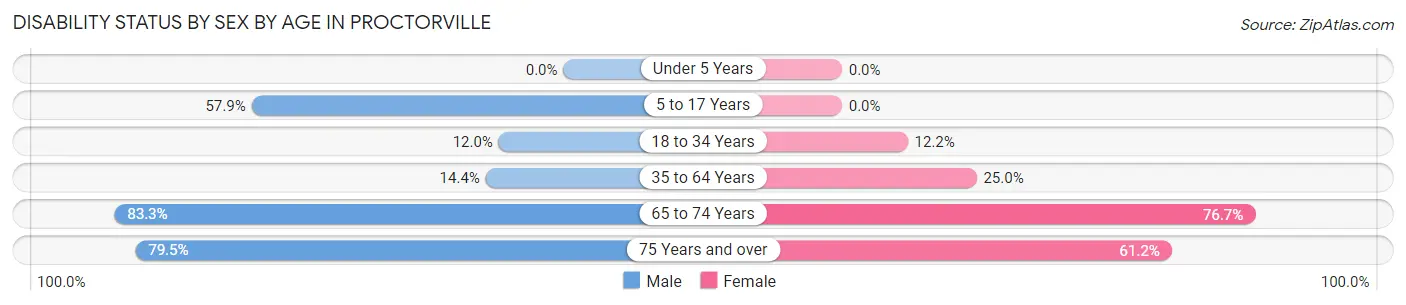
| Age Bracket | Male | Female |
| Under 5 Years | 0 (0.0%) | 0 (0.0%) |
| 5 to 17 Years | 11 (57.9%) | 0 (0.0%) |
| 18 to 34 Years | 3 (12.0%) | 11 (12.2%) |
| 35 to 64 Years | 15 (14.4%) | 22 (25.0%) |
| 65 to 74 Years | 10 (83.3%) | 56 (76.7%) |
| 75 Years and over | 58 (79.4%) | 30 (61.2%) |
Disability Class by Sex by Age in Proctorville
Disability Class: Hearing Difficulty
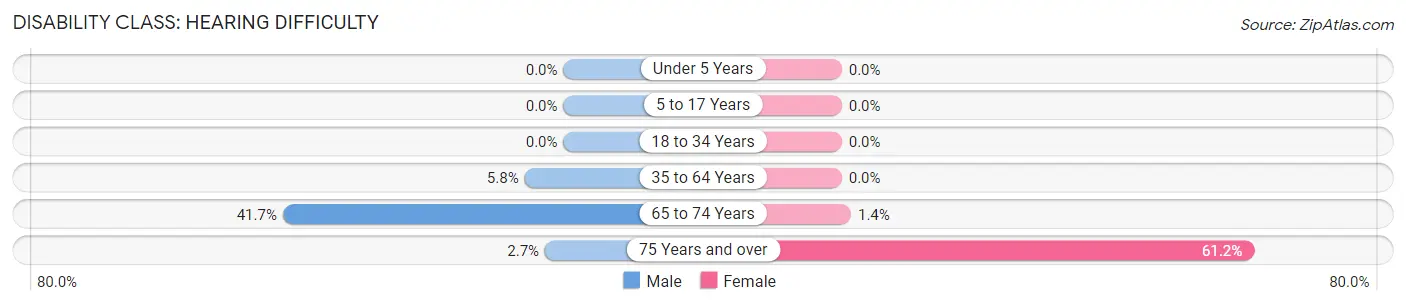
| Age Bracket | Male | Female |
| Under 5 Years | 0 (0.0%) | 0 (0.0%) |
| 5 to 17 Years | 0 (0.0%) | 0 (0.0%) |
| 18 to 34 Years | 0 (0.0%) | 0 (0.0%) |
| 35 to 64 Years | 6 (5.8%) | 0 (0.0%) |
| 65 to 74 Years | 5 (41.7%) | 1 (1.4%) |
| 75 Years and over | 2 (2.7%) | 30 (61.2%) |
Disability Class: Vision Difficulty
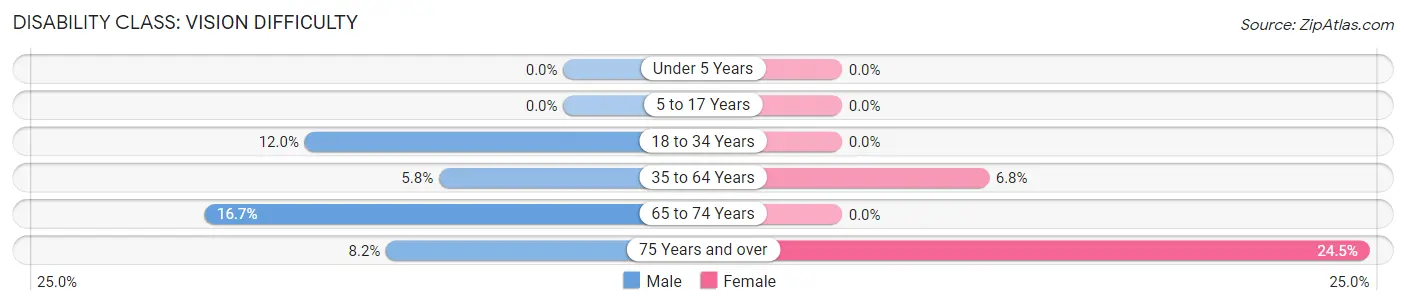
| Age Bracket | Male | Female |
| Under 5 Years | 0 (0.0%) | 0 (0.0%) |
| 5 to 17 Years | 0 (0.0%) | 0 (0.0%) |
| 18 to 34 Years | 3 (12.0%) | 0 (0.0%) |
| 35 to 64 Years | 6 (5.8%) | 6 (6.8%) |
| 65 to 74 Years | 2 (16.7%) | 0 (0.0%) |
| 75 Years and over | 6 (8.2%) | 12 (24.5%) |
Disability Class: Cognitive Difficulty
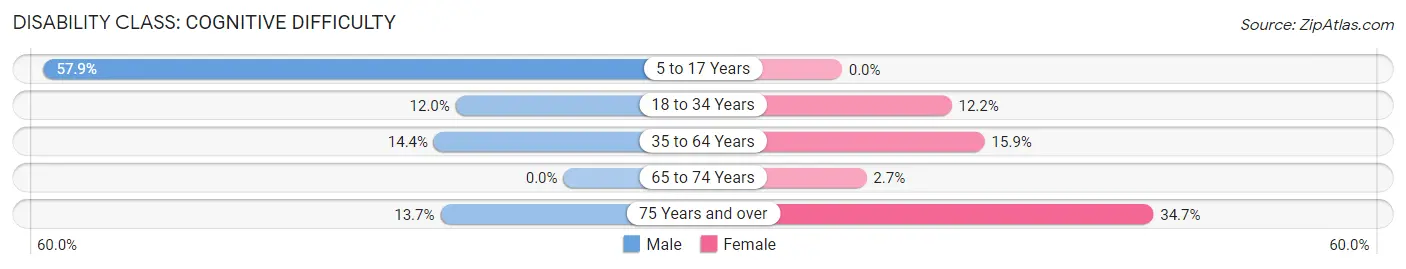
| Age Bracket | Male | Female |
| 5 to 17 Years | 11 (57.9%) | 0 (0.0%) |
| 18 to 34 Years | 3 (12.0%) | 11 (12.2%) |
| 35 to 64 Years | 15 (14.4%) | 14 (15.9%) |
| 65 to 74 Years | 0 (0.0%) | 2 (2.7%) |
| 75 Years and over | 10 (13.7%) | 17 (34.7%) |
Disability Class: Ambulatory Difficulty
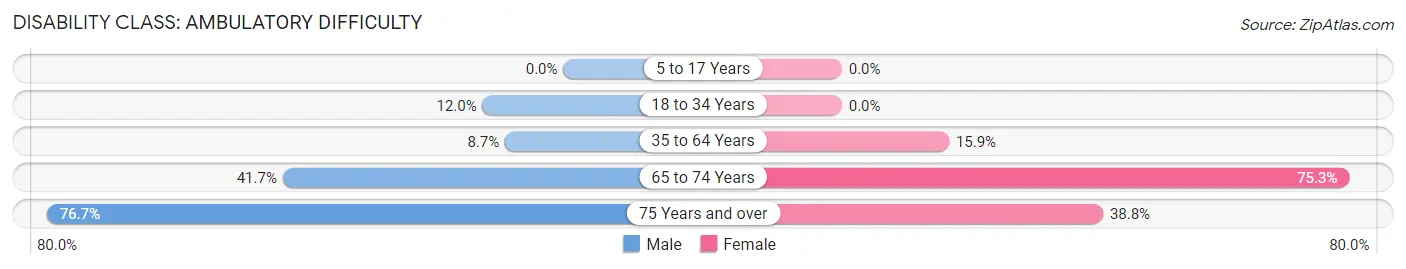
| Age Bracket | Male | Female |
| 5 to 17 Years | 0 (0.0%) | 0 (0.0%) |
| 18 to 34 Years | 3 (12.0%) | 0 (0.0%) |
| 35 to 64 Years | 9 (8.6%) | 14 (15.9%) |
| 65 to 74 Years | 5 (41.7%) | 55 (75.3%) |
| 75 Years and over | 56 (76.7%) | 19 (38.8%) |
Disability Class: Self-Care Difficulty
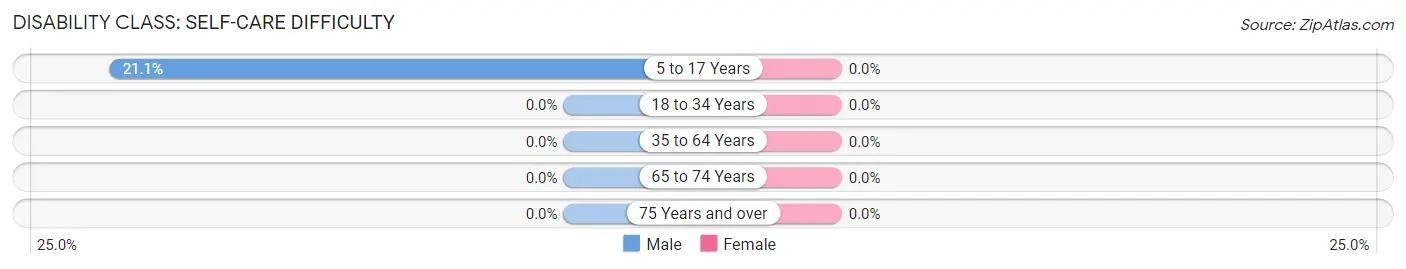
| Age Bracket | Male | Female |
| 5 to 17 Years | 4 (21.0%) | 0 (0.0%) |
| 18 to 34 Years | 0 (0.0%) | 0 (0.0%) |
| 35 to 64 Years | 0 (0.0%) | 0 (0.0%) |
| 65 to 74 Years | 0 (0.0%) | 0 (0.0%) |
| 75 Years and over | 0 (0.0%) | 0 (0.0%) |
Technology Access in Proctorville
Computing Device Access in Proctorville
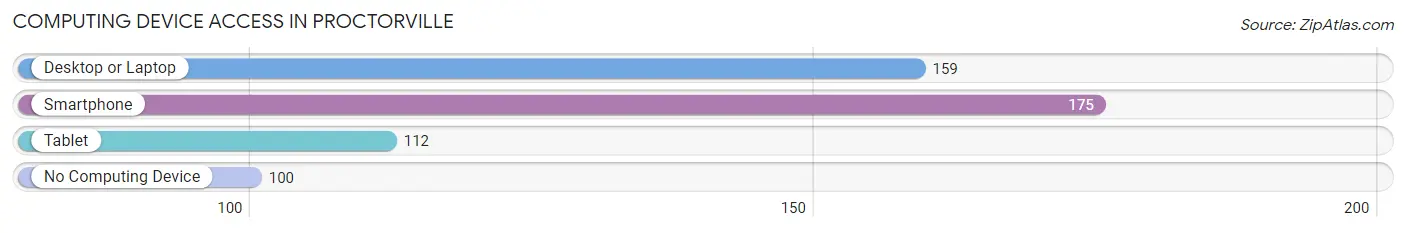
| Device Type | # Households | % Households |
| Desktop or Laptop | 159 | 48.9% |
| Smartphone | 175 | 53.8% |
| Tablet | 112 | 34.5% |
| No Computing Device | 100 | 30.8% |
| Total | 325 | 100.0% |
Internet Access in Proctorville
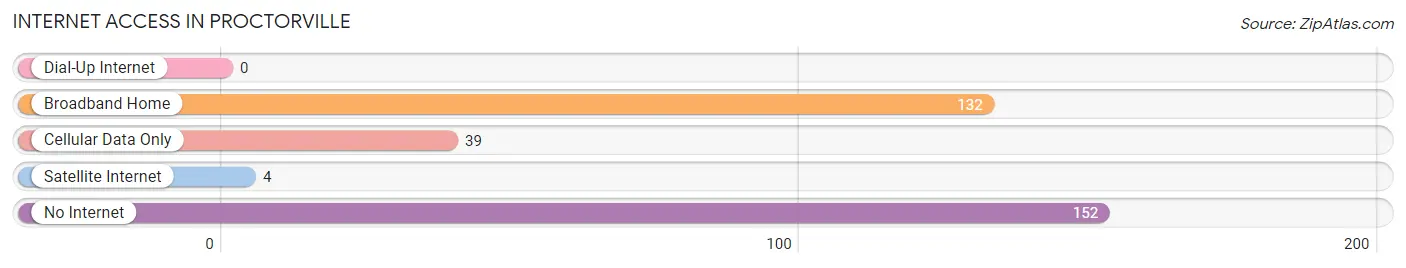
| Internet Type | # Households | % Households |
| Dial-Up Internet | 0 | 0.0% |
| Broadband Home | 132 | 40.6% |
| Cellular Data Only | 39 | 12.0% |
| Satellite Internet | 4 | 1.2% |
| No Internet | 152 | 46.8% |
| Total | 325 | 100.0% |
Proctorville Summary
Proctorville, Ohio is a small village located in Lawrence County, Ohio. It is situated on the Ohio River, just south of Huntington, West Virginia. The village has a population of 1,717 people, according to the 2010 census.
History
Proctorville was founded in 1837 by William Proctor, a local landowner. The village was originally known as Proctor's Landing, and was a popular stop for steamboats traveling up and down the Ohio River. In 1845, the village was renamed Proctorville.
The village was a popular stop for travelers and merchants, and the local economy was largely based on the river trade. In the late 19th century, the village was home to several factories, including a sawmill, a gristmill, and a brickyard.
Geography
Proctorville is located in Lawrence County, Ohio, on the Ohio River. The village is situated on the north bank of the river, just south of Huntington, West Virginia. The village is bordered by the towns of Chesapeake and Rome.
The village has a total area of 0.9 square miles, all of which is land. The terrain is mostly flat, with some rolling hills. The village is located in the Appalachian Plateau region of Ohio.
Economy
The economy of Proctorville is largely based on the river trade. The village is home to several marinas, which provide services to recreational boaters. The village also has several restaurants and bars, which cater to tourists and locals alike.
The village is also home to several small businesses, including a grocery store, a hardware store, and a gas station. The village is also home to a few manufacturing companies, including a plastics factory and a metal fabrication plant.
Demographics
According to the 2010 census, Proctorville has a population of 1,717 people. The population is predominantly white (97.2%), with a small minority of African Americans (1.2%) and Hispanics (1.6%). The median household income is $37,917, and the median age is 41.
The village is served by the Proctorville Local School District, which includes an elementary school, a middle school, and a high school. The village is also home to a branch of the Lawrence County Public Library.
Conclusion
Proctorville, Ohio is a small village located in Lawrence County, Ohio. It is situated on the Ohio River, just south of Huntington, West Virginia. The village has a population of 1,717 people, according to the 2010 census. The economy of Proctorville is largely based on the river trade, and the village is home to several small businesses and manufacturing companies. The population is predominantly white, with a small minority of African Americans and Hispanics. The village is served by the Proctorville Local School District, and is home to a branch of the Lawrence County Public Library.
Common Questions
What is Per Capita Income in Proctorville?
Per Capita income in Proctorville is $23,212.
What is the Median Family Income in Proctorville?
Median Family Income in Proctorville is $54,375.
What is the Median Household income in Proctorville?
Median Household Income in Proctorville is $33,310.
What is Income or Wage Gap in Proctorville?
Income or Wage Gap in Proctorville is 21.8%.
Women in Proctorville earn 78.2 cents for every dollar earned by a man.
What is Inequality or Gini Index in Proctorville?
Inequality or Gini Index in Proctorville is 0.38.
What is the Total Population of Proctorville?
Total Population of Proctorville is 558.
What is the Total Male Population of Proctorville?
Total Male Population of Proctorville is 233.
What is the Total Female Population of Proctorville?
Total Female Population of Proctorville is 325.
What is the Ratio of Males per 100 Females in Proctorville?
There are 71.69 Males per 100 Females in Proctorville.
What is the Ratio of Females per 100 Males in Proctorville?
There are 139.48 Females per 100 Males in Proctorville.
What is the Median Population Age in Proctorville?
Median Population Age in Proctorville is 55.8 Years.
What is the Average Family Size in Proctorville
Average Family Size in Proctorville is 2.7 People.
What is the Average Household Size in Proctorville
Average Household Size in Proctorville is 1.7 People.
How Large is the Labor Force in Proctorville?
There are 194 People in the Labor Forcein in Proctorville.
What is the Percentage of People in the Labor Force in Proctorville?
37.5% of People are in the Labor Force in Proctorville.
What is the Unemployment Rate in Proctorville?
Unemployment Rate in Proctorville is 2.1%.