Cloverdale, OH Map & Demographics
Cloverdale Map
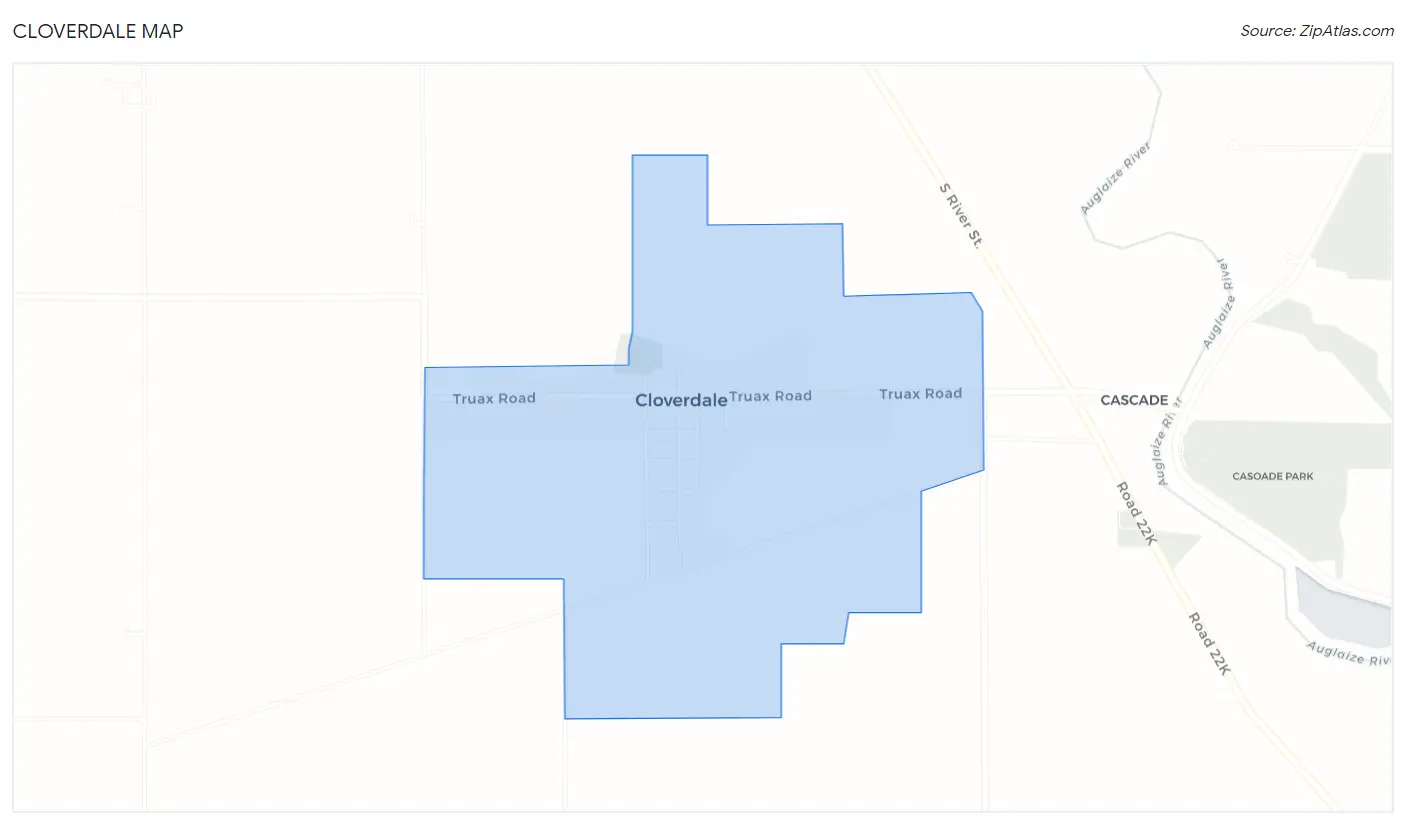
Cloverdale Overview
$25,815
PER CAPITA INCOME
$80,000
AVG FAMILY INCOME
$56,563
AVG HOUSEHOLD INCOME
62.4%
WAGE / INCOME GAP [ % ]
37.6¢/ $1
WAGE / INCOME GAP [ $ ]
0.46
INEQUALITY / GINI INDEX
148
TOTAL POPULATION
57
MALE POPULATION
91
FEMALE POPULATION
62.64
MALES / 100 FEMALES
159.65
FEMALES / 100 MALES
50.5
MEDIAN AGE
2.2
AVG FAMILY SIZE
2.3
AVG HOUSEHOLD SIZE
56
LABOR FORCE [ PEOPLE ]
39.7%
PERCENT IN LABOR FORCE
Cloverdale Zip Codes
Cloverdale Area Codes
Income in Cloverdale
Income Overview in Cloverdale
Per Capita Income in Cloverdale is $25,815, while median incomes of families and households are $80,000 and $56,563 respectively.
| Characteristic | Number | Measure |
| Per Capita Income | 148 | $25,815 |
| Median Family Income | 24 | $80,000 |
| Mean Family Income | 24 | $79,225 |
| Median Household Income | 55 | $56,563 |
| Mean Household Income | 55 | $71,580 |
| Income Deficit | 24 | $0 |
| Wage / Income Gap (%) | 148 | 62.39% |
| Wage / Income Gap ($) | 148 | 37.61¢ per $1 |
| Gini / Inequality Index | 148 | 0.46 |
Earnings by Sex in Cloverdale
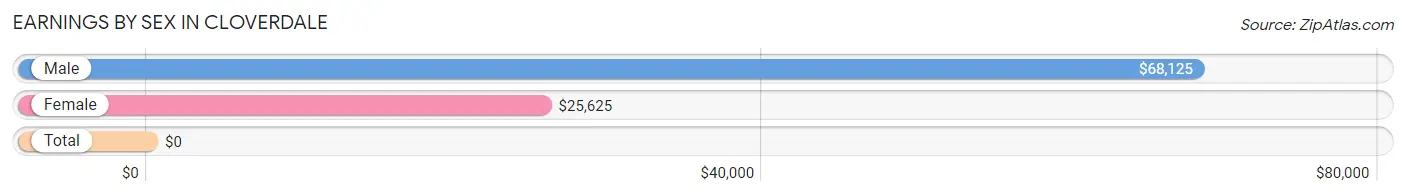
| Sex | Number | Average Earnings |
| Male | 23 (39.0%) | $68,125 |
| Female | 36 (61.0%) | $25,625 |
| Total | 59 (100.0%) | $0 |
Earnings by Sex by Income Bracket in Cloverdale
The most common earnings brackets in Cloverdale are $75,000 to $99,999 for men (9 | 39.1%) and $15,000 to $17,499 for women (7 | 19.4%).
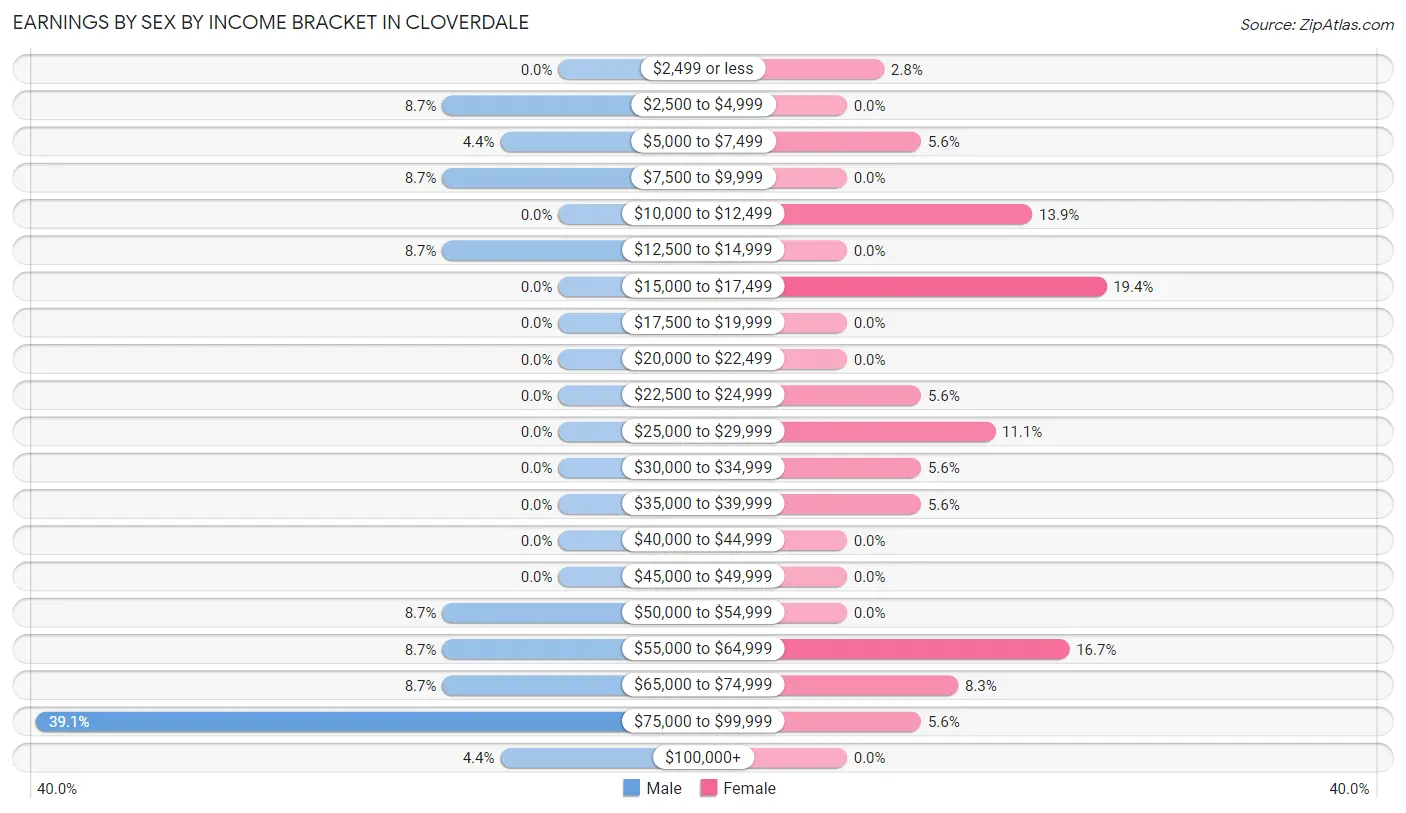
| Income | Male | Female |
| $2,499 or less | 0 (0.0%) | 1 (2.8%) |
| $2,500 to $4,999 | 2 (8.7%) | 0 (0.0%) |
| $5,000 to $7,499 | 1 (4.3%) | 2 (5.6%) |
| $7,500 to $9,999 | 2 (8.7%) | 0 (0.0%) |
| $10,000 to $12,499 | 0 (0.0%) | 5 (13.9%) |
| $12,500 to $14,999 | 2 (8.7%) | 0 (0.0%) |
| $15,000 to $17,499 | 0 (0.0%) | 7 (19.4%) |
| $17,500 to $19,999 | 0 (0.0%) | 0 (0.0%) |
| $20,000 to $22,499 | 0 (0.0%) | 0 (0.0%) |
| $22,500 to $24,999 | 0 (0.0%) | 2 (5.6%) |
| $25,000 to $29,999 | 0 (0.0%) | 4 (11.1%) |
| $30,000 to $34,999 | 0 (0.0%) | 2 (5.6%) |
| $35,000 to $39,999 | 0 (0.0%) | 2 (5.6%) |
| $40,000 to $44,999 | 0 (0.0%) | 0 (0.0%) |
| $45,000 to $49,999 | 0 (0.0%) | 0 (0.0%) |
| $50,000 to $54,999 | 2 (8.7%) | 0 (0.0%) |
| $55,000 to $64,999 | 2 (8.7%) | 6 (16.7%) |
| $65,000 to $74,999 | 2 (8.7%) | 3 (8.3%) |
| $75,000 to $99,999 | 9 (39.1%) | 2 (5.6%) |
| $100,000+ | 1 (4.3%) | 0 (0.0%) |
| Total | 23 (100.0%) | 36 (100.0%) |
Earnings by Sex by Educational Attainment in Cloverdale
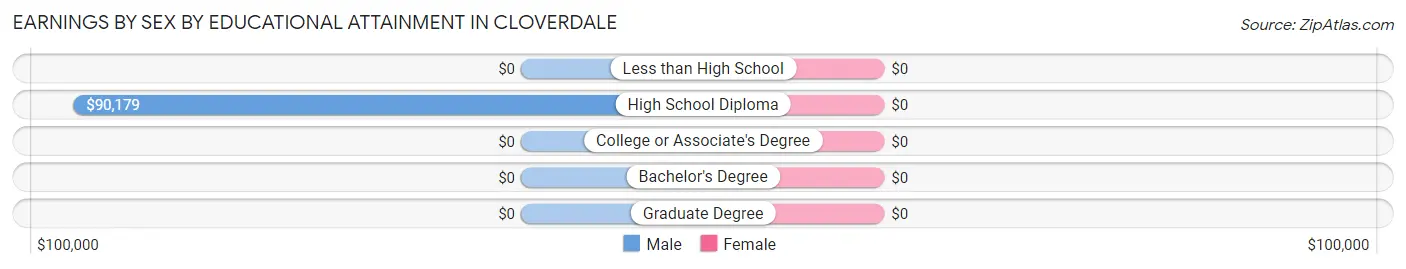
| Educational Attainment | Male Income | Female Income |
| Less than High School | - | - |
| High School Diploma | $90,179 | $0 |
| College or Associate's Degree | - | - |
| Bachelor's Degree | - | - |
| Graduate Degree | - | - |
| Total | $85,625 | $57,708 |
Family Income in Cloverdale
Family Income Brackets in Cloverdale
According to the Cloverdale family income data, there are 9 families falling into the $75,000 to $99,999 income range, which is the most common income bracket and makes up 37.5% of all families.
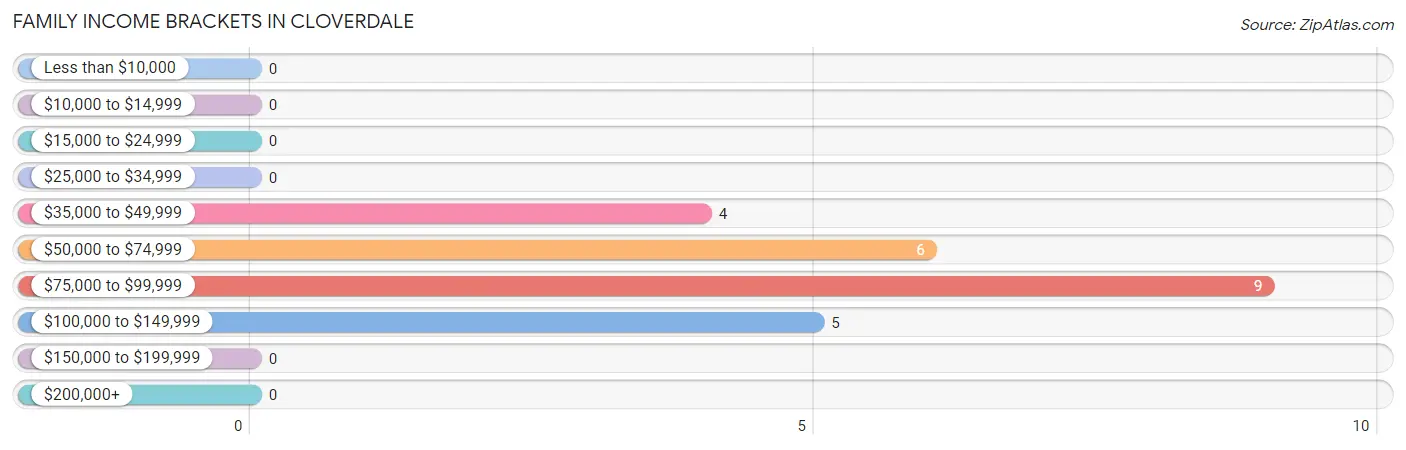
| Income Bracket | # Families | % Families |
| Less than $10,000 | 0 | 0.0% |
| $10,000 to $14,999 | 0 | 0.0% |
| $15,000 to $24,999 | 0 | 0.0% |
| $25,000 to $34,999 | 0 | 0.0% |
| $35,000 to $49,999 | 4 | 16.7% |
| $50,000 to $74,999 | 6 | 25.0% |
| $75,000 to $99,999 | 9 | 37.5% |
| $100,000 to $149,999 | 5 | 20.8% |
| $150,000 to $199,999 | 0 | 0.0% |
| $200,000+ | 0 | 0.0% |
Family Income by Famaliy Size in Cloverdale
3-person families (5 | 20.8%) account for the highest median family income in Cloverdale with $98,750 per family, while 2-person families (17 | 70.8%) have the highest median income of $41,354 per family member.
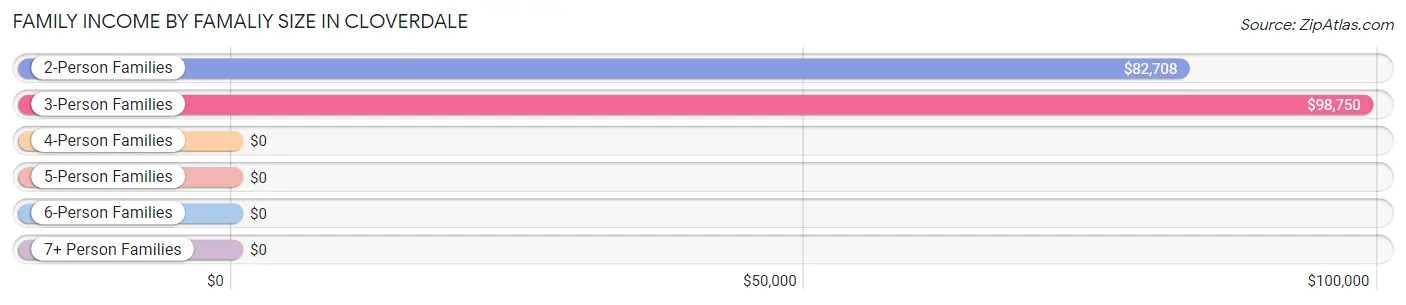
| Income Bracket | # Families | Median Income |
| 2-Person Families | 17 (70.8%) | $82,708 |
| 3-Person Families | 5 (20.8%) | $98,750 |
| 4-Person Families | 2 (8.3%) | $0 |
| 5-Person Families | 0 (0.0%) | $0 |
| 6-Person Families | 0 (0.0%) | $0 |
| 7+ Person Families | 0 (0.0%) | $0 |
| Total | 24 (100.0%) | $80,000 |
Family Income by Number of Earners in Cloverdale
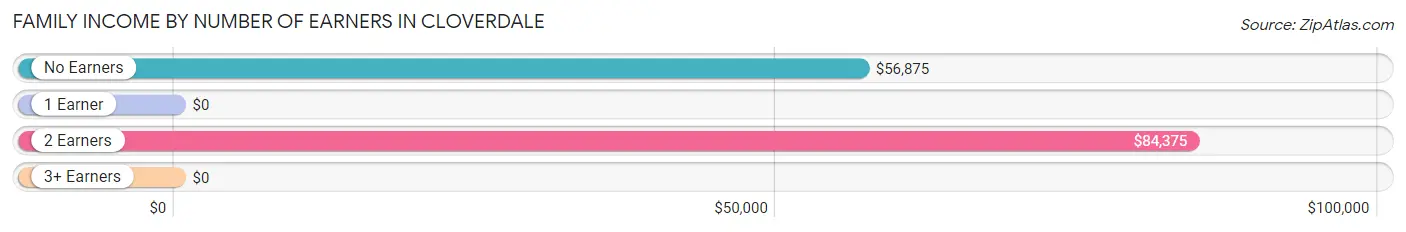
| Number of Earners | # Families | Median Income |
| No Earners | 7 (29.2%) | $56,875 |
| 1 Earner | 2 (8.3%) | $0 |
| 2 Earners | 13 (54.2%) | $84,375 |
| 3+ Earners | 2 (8.3%) | $0 |
| Total | 24 (100.0%) | $80,000 |
Household Income in Cloverdale
Household Income Brackets in Cloverdale
With 10 households falling in the category, the $15,000 to $24,999 income range is the most frequent in Cloverdale, accounting for 18.2% of all households.
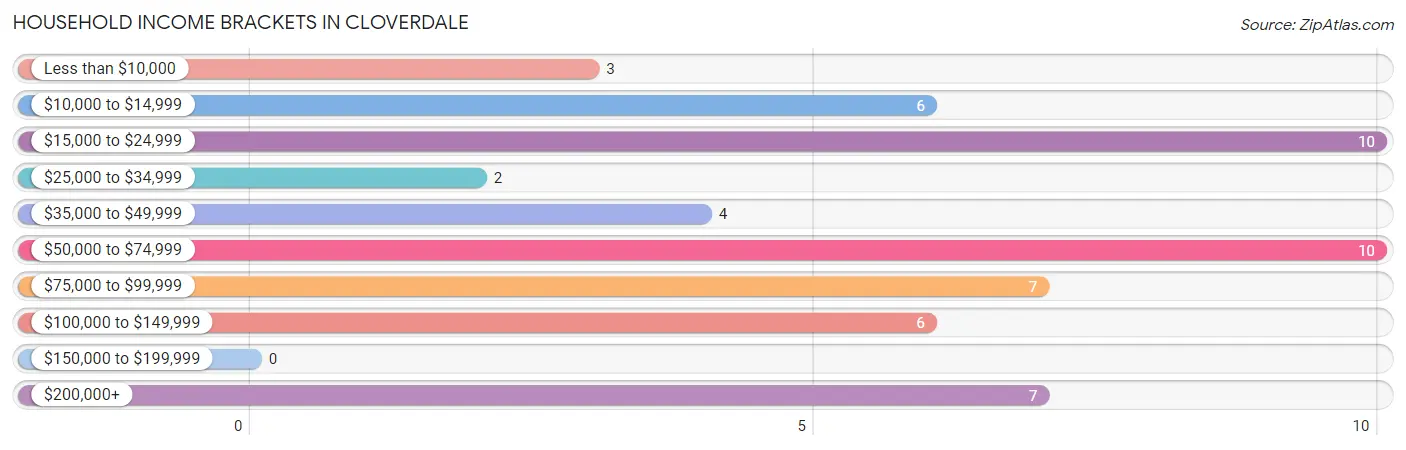
| Income Bracket | # Households | % Households |
| Less than $10,000 | 3 | 5.5% |
| $10,000 to $14,999 | 6 | 10.9% |
| $15,000 to $24,999 | 10 | 18.2% |
| $25,000 to $34,999 | 2 | 3.6% |
| $35,000 to $49,999 | 4 | 7.3% |
| $50,000 to $74,999 | 10 | 18.2% |
| $75,000 to $99,999 | 7 | 12.7% |
| $100,000 to $149,999 | 6 | 10.9% |
| $150,000 to $199,999 | 0 | 0.0% |
| $200,000+ | 7 | 12.7% |
Household Income by Householder Age in Cloverdale
The median household income in Cloverdale is $56,563, with the highest median household income of $25,000 found in the 65+ years age bracket for the primary householder. A total of 22 households (40.0%) fall into this category. Meanwhile, the 15 to 24 years age bracket for the primary householder has the lowest median household income of $0, with 4 households (7.3%) in this group.
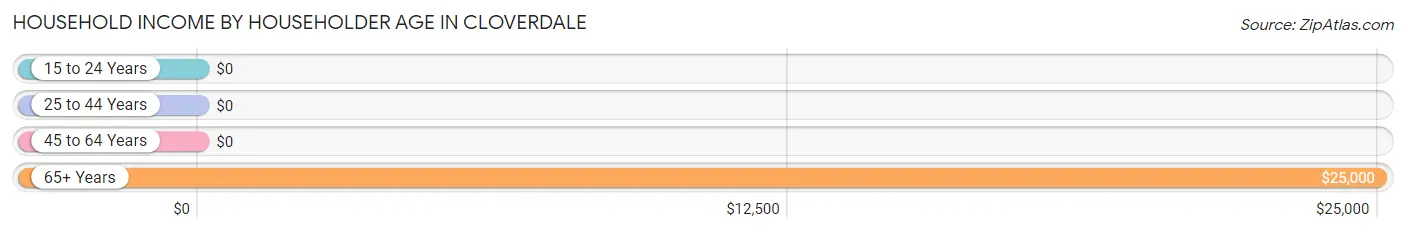
| Income Bracket | # Households | Median Income |
| 15 to 24 Years | 4 (7.3%) | $0 |
| 25 to 44 Years | 13 (23.6%) | $0 |
| 45 to 64 Years | 16 (29.1%) | $0 |
| 65+ Years | 22 (40.0%) | $25,000 |
| Total | 55 (100.0%) | $56,563 |
Poverty in Cloverdale
Income Below Poverty by Sex and Age in Cloverdale
With 21.0% poverty level for males and 46.2% for females among the residents of Cloverdale, 18 to 24 year old males and 16 and 17 year old females are the most vulnerable to poverty, with 2 males (50.0%) and 5 females (100.0%) in their respective age groups living below the poverty level.
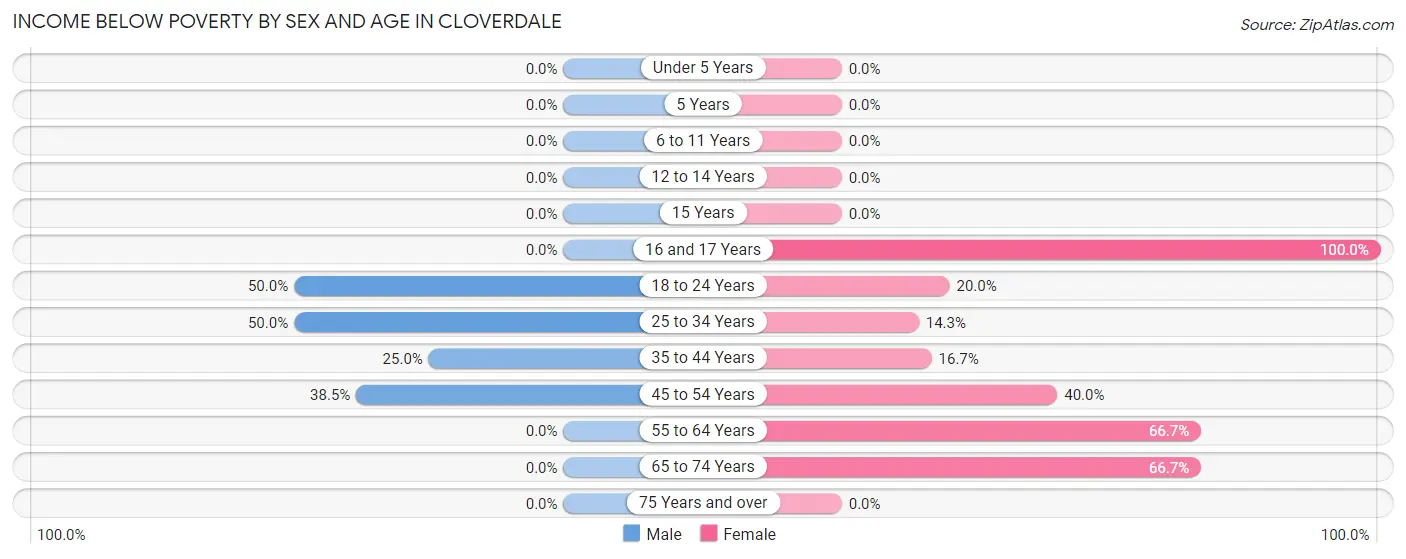
| Age Bracket | Male | Female |
| Under 5 Years | 0 (0.0%) | 0 (0.0%) |
| 5 Years | 0 (0.0%) | 0 (0.0%) |
| 6 to 11 Years | 0 (0.0%) | 0 (0.0%) |
| 12 to 14 Years | 0 (0.0%) | 0 (0.0%) |
| 15 Years | 0 (0.0%) | 0 (0.0%) |
| 16 and 17 Years | 0 (0.0%) | 5 (100.0%) |
| 18 to 24 Years | 2 (50.0%) | 2 (20.0%) |
| 25 to 34 Years | 2 (50.0%) | 1 (14.3%) |
| 35 to 44 Years | 3 (25.0%) | 2 (16.7%) |
| 45 to 54 Years | 5 (38.5%) | 2 (40.0%) |
| 55 to 64 Years | 0 (0.0%) | 8 (66.7%) |
| 65 to 74 Years | 0 (0.0%) | 22 (66.7%) |
| 75 Years and over | 0 (0.0%) | 0 (0.0%) |
| Total | 12 (21.0%) | 42 (46.2%) |
Income Above Poverty by Sex and Age in Cloverdale
According to the poverty statistics in Cloverdale, males aged 12 to 14 years and females aged 6 to 11 years are the age groups that are most secure financially, with 100.0% of males and 100.0% of females in these age groups living above the poverty line.
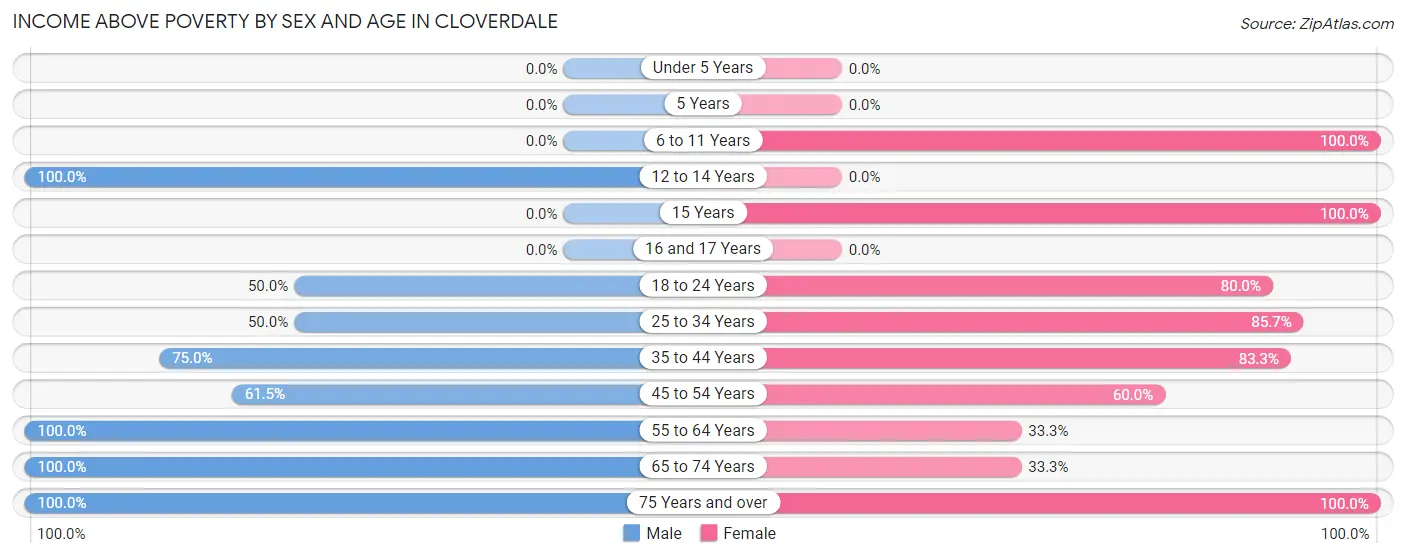
| Age Bracket | Male | Female |
| Under 5 Years | 0 (0.0%) | 0 (0.0%) |
| 5 Years | 0 (0.0%) | 0 (0.0%) |
| 6 to 11 Years | 0 (0.0%) | 3 (100.0%) |
| 12 to 14 Years | 2 (100.0%) | 0 (0.0%) |
| 15 Years | 0 (0.0%) | 2 (100.0%) |
| 16 and 17 Years | 0 (0.0%) | 0 (0.0%) |
| 18 to 24 Years | 2 (50.0%) | 8 (80.0%) |
| 25 to 34 Years | 2 (50.0%) | 6 (85.7%) |
| 35 to 44 Years | 9 (75.0%) | 10 (83.3%) |
| 45 to 54 Years | 8 (61.5%) | 3 (60.0%) |
| 55 to 64 Years | 5 (100.0%) | 4 (33.3%) |
| 65 to 74 Years | 16 (100.0%) | 11 (33.3%) |
| 75 Years and over | 1 (100.0%) | 2 (100.0%) |
| Total | 45 (78.9%) | 49 (53.8%) |
Income Below Poverty Among Married-Couple Families in Cloverdale
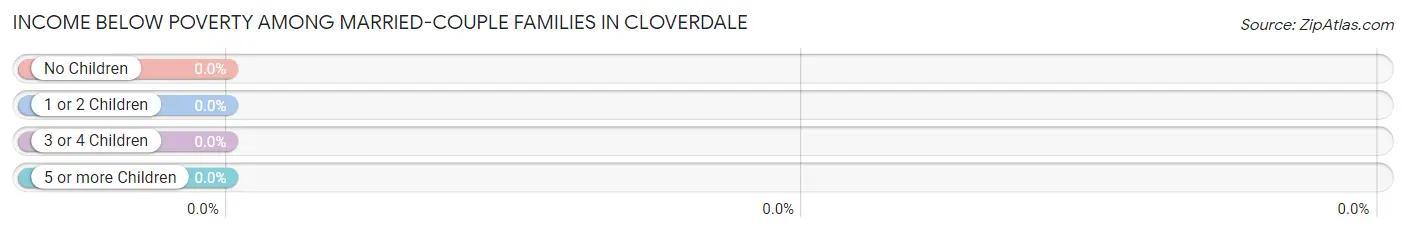
| Children | Above Poverty | Below Poverty |
| No Children | 14 (100.0%) | 0 (0.0%) |
| 1 or 2 Children | 4 (100.0%) | 0 (0.0%) |
| 3 or 4 Children | 0 (0.0%) | 0 (0.0%) |
| 5 or more Children | 0 (0.0%) | 0 (0.0%) |
| Total | 18 (100.0%) | 0 (0.0%) |
Income Below Poverty Among Single-Parent Households in Cloverdale
| Children | Single Father | Single Mother |
| No Children | 0 (0.0%) | 0 (0.0%) |
| 1 or 2 Children | 0 (0.0%) | 0 (0.0%) |
| 3 or 4 Children | 0 (0.0%) | 0 (0.0%) |
| 5 or more Children | 0 (0.0%) | 0 (0.0%) |
| Total | 0 (0.0%) | 0 (0.0%) |
Income Below Poverty Among Married-Couple vs Single-Parent Households in Cloverdale
| Children | Married-Couple Families | Single-Parent Households |
| No Children | 0 (0.0%) | 0 (0.0%) |
| 1 or 2 Children | 0 (0.0%) | 0 (0.0%) |
| 3 or 4 Children | 0 (0.0%) | 0 (0.0%) |
| 5 or more Children | 0 (0.0%) | 0 (0.0%) |
| Total | 0 (0.0%) | 0 (0.0%) |
Race in Cloverdale
The most populous races in Cloverdale are White / Caucasian (139 | 93.9%), Two or more Races (8 | 5.4%), and Black / African American (1 | 0.7%).
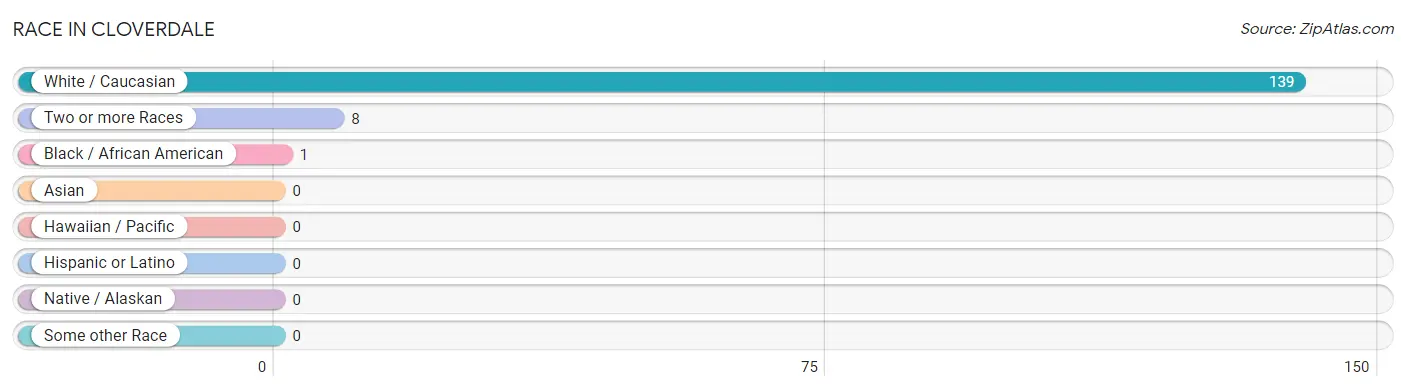
| Race | # Population | % Population |
| Asian | 0 | 0.0% |
| Black / African American | 1 | 0.7% |
| Hawaiian / Pacific | 0 | 0.0% |
| Hispanic or Latino | 0 | 0.0% |
| Native / Alaskan | 0 | 0.0% |
| White / Caucasian | 139 | 93.9% |
| Two or more Races | 8 | 5.4% |
| Some other Race | 0 | 0.0% |
| Total | 148 | 100.0% |
Ancestry in Cloverdale
The most populous ancestries reported in Cloverdale are German (29 | 19.6%), English (13 | 8.8%), Irish (9 | 6.1%), American (5 | 3.4%), and Cherokee (2 | 1.3%), together accounting for 39.2% of all Cloverdale residents.
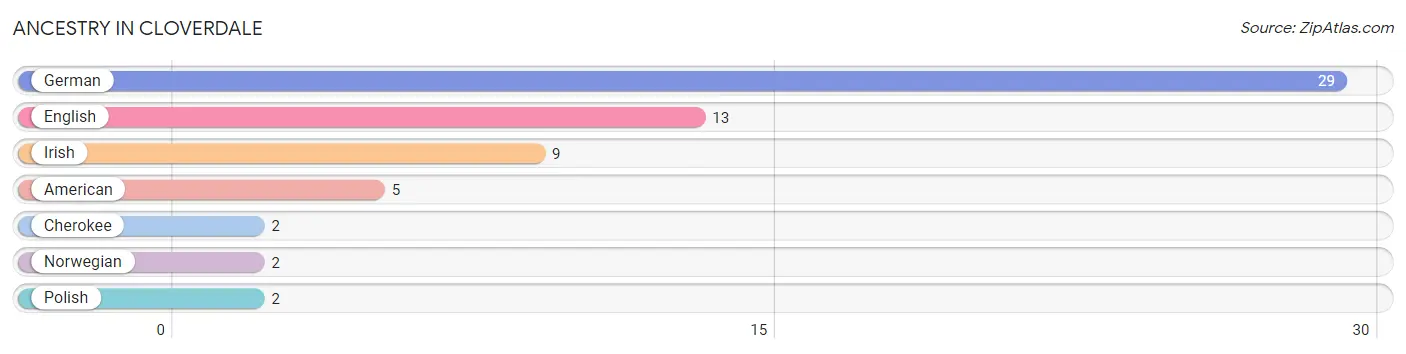
| Ancestry | # Population | % Population |
| American | 5 | 3.4% |
| Cherokee | 2 | 1.3% |
| English | 13 | 8.8% |
| German | 29 | 19.6% |
| Irish | 9 | 6.1% |
| Norwegian | 2 | 1.3% |
| Polish | 2 | 1.3% | View All 7 Rows |
Immigrants in Cloverdale

| Immigration Origin | # Population | % Population | View All 0 Rows |
Sex and Age in Cloverdale
Sex and Age in Cloverdale
The most populous age groups in Cloverdale are 65 to 69 Years (11 | 19.3%) for men and 65 to 69 Years (24 | 26.4%) for women.
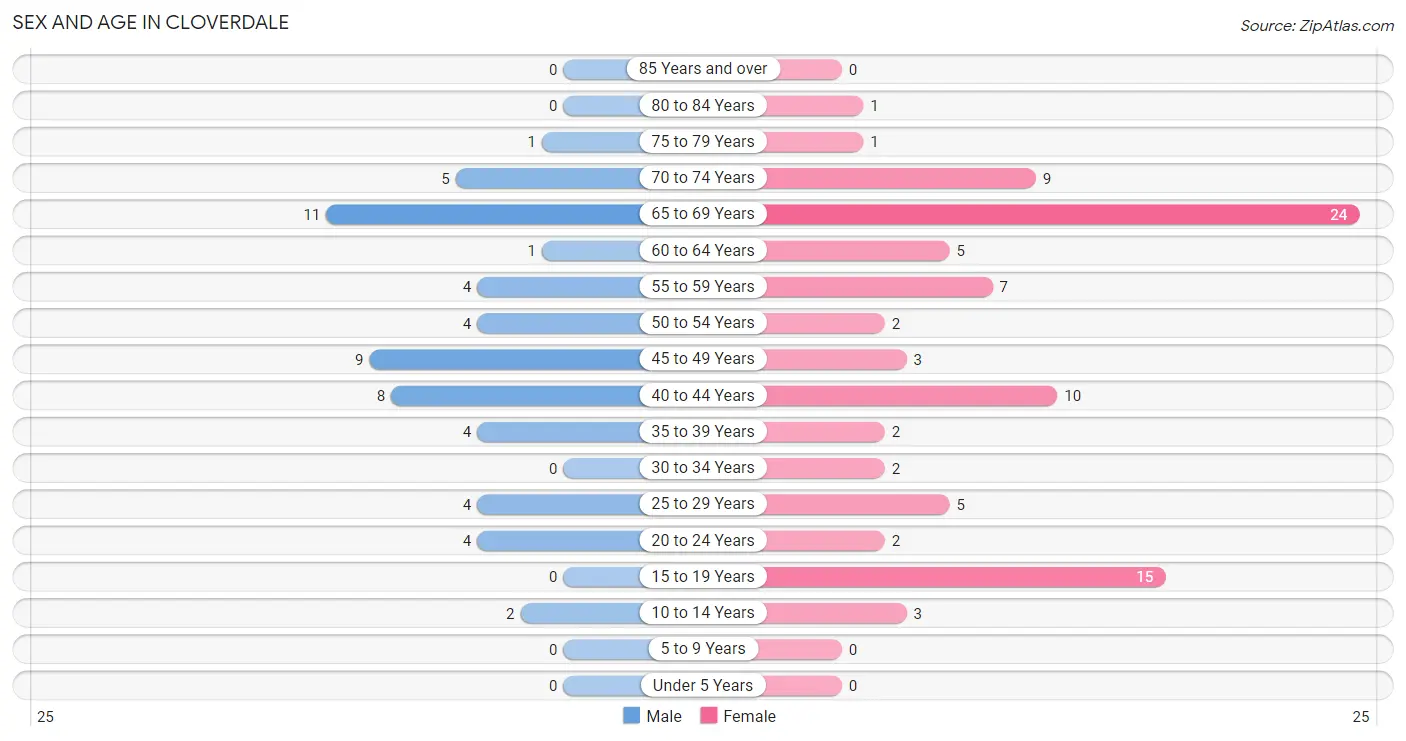
| Age Bracket | Male | Female |
| Under 5 Years | 0 (0.0%) | 0 (0.0%) |
| 5 to 9 Years | 0 (0.0%) | 0 (0.0%) |
| 10 to 14 Years | 2 (3.5%) | 3 (3.3%) |
| 15 to 19 Years | 0 (0.0%) | 15 (16.5%) |
| 20 to 24 Years | 4 (7.0%) | 2 (2.2%) |
| 25 to 29 Years | 4 (7.0%) | 5 (5.5%) |
| 30 to 34 Years | 0 (0.0%) | 2 (2.2%) |
| 35 to 39 Years | 4 (7.0%) | 2 (2.2%) |
| 40 to 44 Years | 8 (14.0%) | 10 (11.0%) |
| 45 to 49 Years | 9 (15.8%) | 3 (3.3%) |
| 50 to 54 Years | 4 (7.0%) | 2 (2.2%) |
| 55 to 59 Years | 4 (7.0%) | 7 (7.7%) |
| 60 to 64 Years | 1 (1.8%) | 5 (5.5%) |
| 65 to 69 Years | 11 (19.3%) | 24 (26.4%) |
| 70 to 74 Years | 5 (8.8%) | 9 (9.9%) |
| 75 to 79 Years | 1 (1.8%) | 1 (1.1%) |
| 80 to 84 Years | 0 (0.0%) | 1 (1.1%) |
| 85 Years and over | 0 (0.0%) | 0 (0.0%) |
| Total | 57 (100.0%) | 91 (100.0%) |
Families and Households in Cloverdale
Median Family Size in Cloverdale
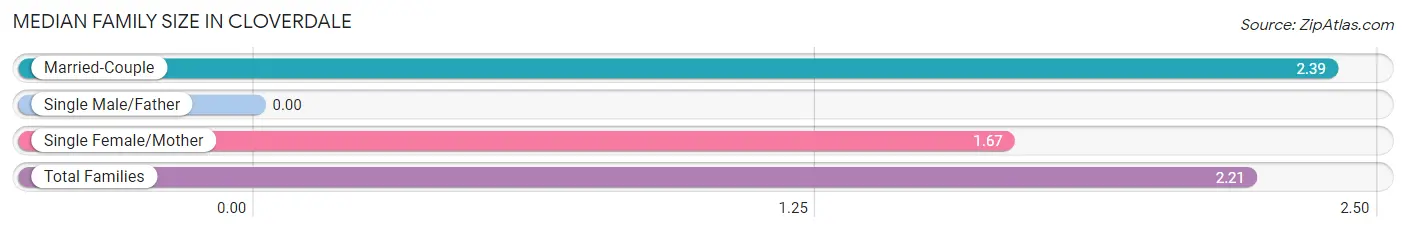
| Family Type | # Families | Family Size |
| Married-Couple | 18 (75.0%) | 2.39 |
| Single Male/Father | 0 (0.0%) | - |
| Single Female/Mother | 6 (25.0%) | 1.67 |
| Total Families | 24 (100.0%) | 2.21 |
Median Household Size in Cloverdale
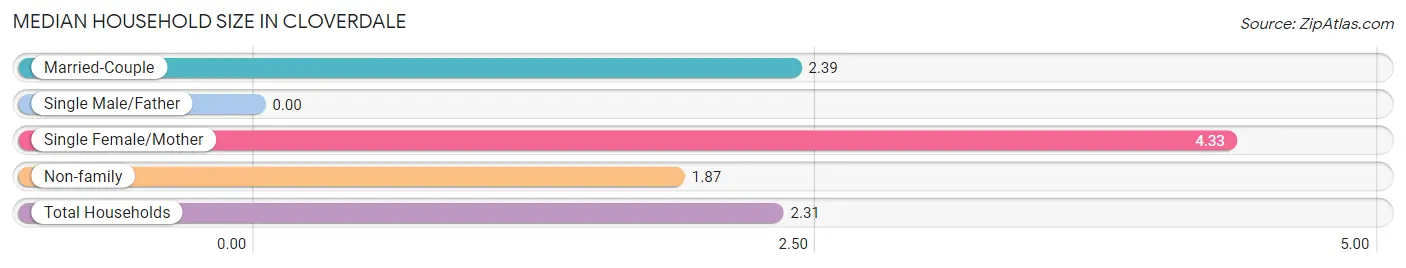
| Household Type | # Households | Household Size |
| Married-Couple | 18 (32.7%) | 2.39 |
| Single Male/Father | 0 (0.0%) | - |
| Single Female/Mother | 6 (10.9%) | 4.33 |
| Non-family | 31 (56.4%) | 1.87 |
| Total Households | 55 (100.0%) | 2.31 |
Household Size by Marriage Status in Cloverdale
Out of a total of 55 households in Cloverdale, 24 (43.6%) are family households, while 31 (56.4%) are nonfamily households. The most numerous type of family households are 2-person households, comprising 11, and the most common type of nonfamily households are 1-person households, comprising 27.
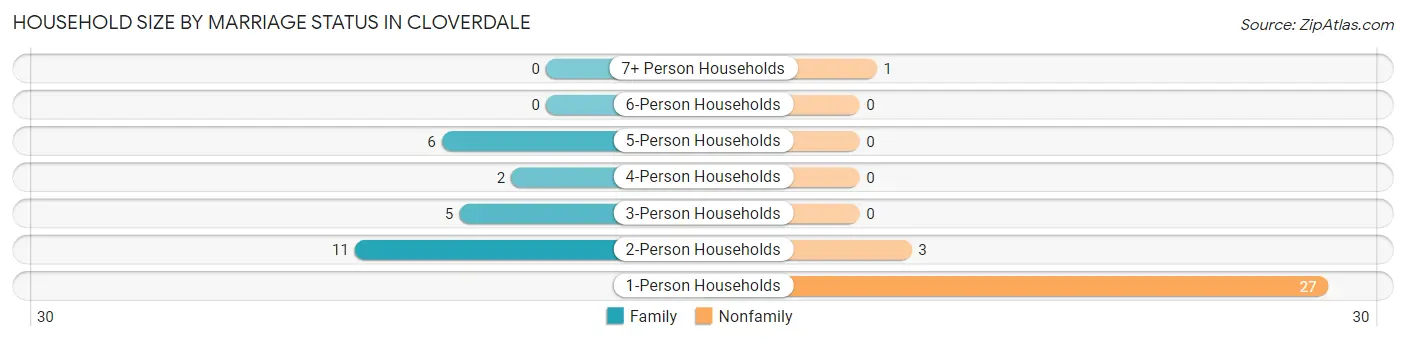
| Household Size | Family Households | Nonfamily Households |
| 1-Person Households | - | 27 (49.1%) |
| 2-Person Households | 11 (20.0%) | 3 (5.4%) |
| 3-Person Households | 5 (9.1%) | 0 (0.0%) |
| 4-Person Households | 2 (3.6%) | 0 (0.0%) |
| 5-Person Households | 6 (10.9%) | 0 (0.0%) |
| 6-Person Households | 0 (0.0%) | 0 (0.0%) |
| 7+ Person Households | 0 (0.0%) | 1 (1.8%) |
| Total | 24 (43.6%) | 31 (56.4%) |
Female Fertility in Cloverdale
Fertility by Age in Cloverdale
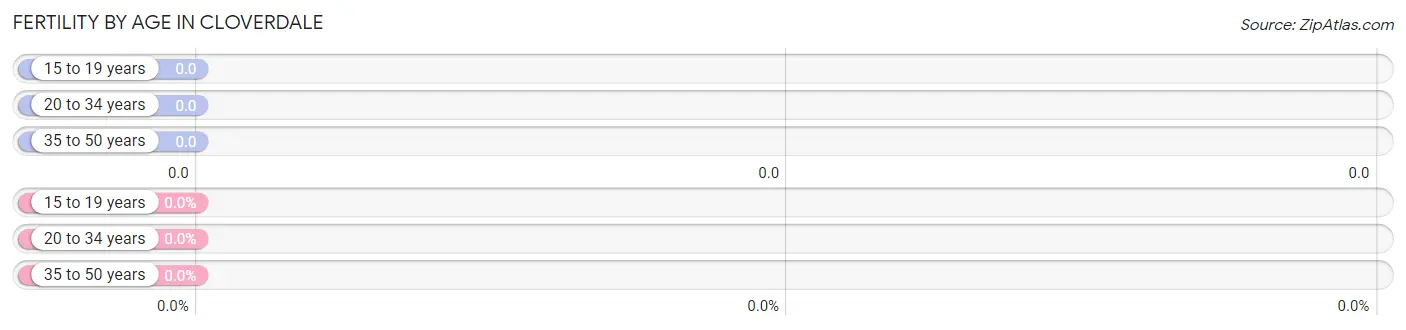
| Age Bracket | Women with Births | Births / 1,000 Women |
| 15 to 19 years | 0 (0.0%) | 0.0 |
| 20 to 34 years | 0 (0.0%) | 0.0 |
| 35 to 50 years | 0 (0.0%) | 0.0 |
| Total | 0 (0.0%) | 0.0 |
Fertility by Age by Marriage Status in Cloverdale
| Age Bracket | Married | Unmarried |
| 15 to 19 years | 0 (0.0%) | 0 (0.0%) |
| 20 to 34 years | 0 (0.0%) | 0 (0.0%) |
| 35 to 50 years | 0 (0.0%) | 0 (0.0%) |
| Total | 0 (0.0%) | 0 (0.0%) |
Fertility by Education in Cloverdale
| Educational Attainment | Women with Births | Births / 1,000 Women |
| Less than High School | 0 (0.0%) | 0.0 |
| High School Diploma | 0 (0.0%) | 0.0 |
| College or Associate's Degree | 0 (0.0%) | 0.0 |
| Bachelor's Degree | 0 (0.0%) | 0.0 |
| Graduate Degree | 0 (0.0%) | 0.0 |
| Total | 0 (0.0%) | 0.0 |
Fertility by Education by Marriage Status in Cloverdale
| Educational Attainment | Married | Unmarried |
| Less than High School | 0 (0.0%) | 0 (0.0%) |
| High School Diploma | 0 (0.0%) | 0 (0.0%) |
| College or Associate's Degree | 0 (0.0%) | 0 (0.0%) |
| Bachelor's Degree | 0 (0.0%) | 0 (0.0%) |
| Graduate Degree | 0 (0.0%) | 0 (0.0%) |
| Total | 0 (0.0%) | 0 (0.0%) |
Employment Characteristics in Cloverdale
Employment by Class of Employer in Cloverdale
Among the 54 employed individuals in Cloverdale, private company employees (51 | 94.4%), state government employees (2 | 3.7%), and not-for-profit organizations (1 | 1.8%) make up the most common classes of employment.
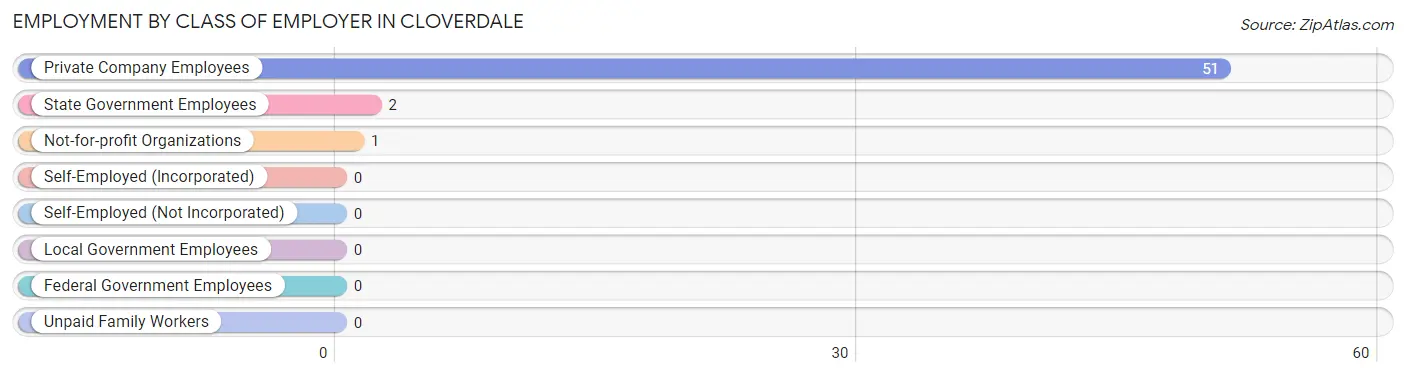
| Employer Class | # Employees | % Employees |
| Private Company Employees | 51 | 94.4% |
| Self-Employed (Incorporated) | 0 | 0.0% |
| Self-Employed (Not Incorporated) | 0 | 0.0% |
| Not-for-profit Organizations | 1 | 1.8% |
| Local Government Employees | 0 | 0.0% |
| State Government Employees | 2 | 3.7% |
| Federal Government Employees | 0 | 0.0% |
| Unpaid Family Workers | 0 | 0.0% |
| Total | 54 | 100.0% |
Employment Status by Age in Cloverdale
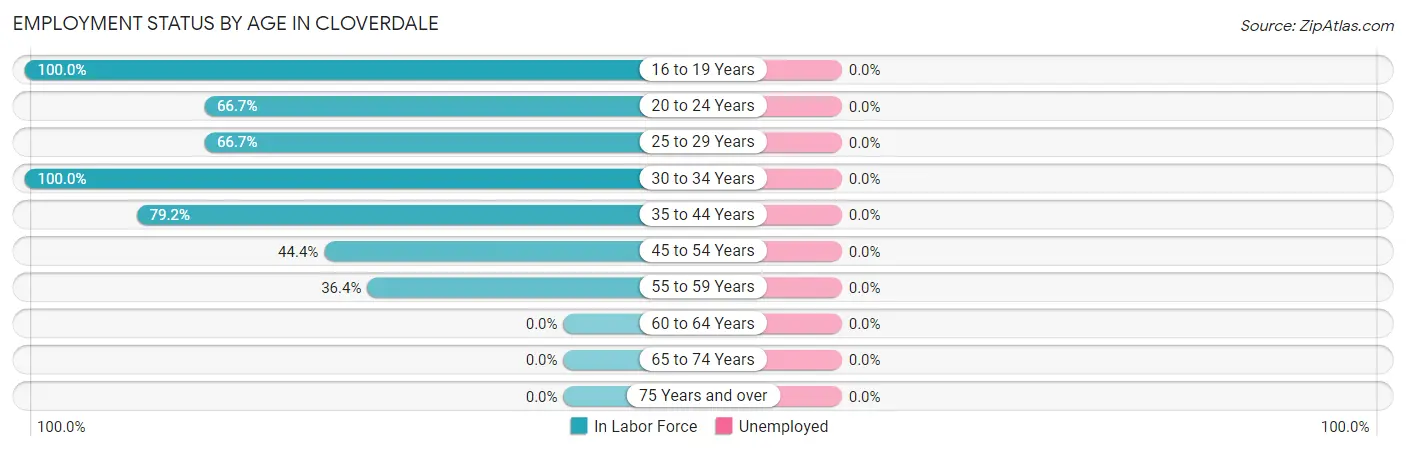
| Age Bracket | In Labor Force | Unemployed |
| 16 to 19 Years | 13 (100.0%) | 0 (0.0%) |
| 20 to 24 Years | 4 (66.7%) | 0 (0.0%) |
| 25 to 29 Years | 6 (66.7%) | 0 (0.0%) |
| 30 to 34 Years | 2 (100.0%) | 0 (0.0%) |
| 35 to 44 Years | 19 (79.2%) | 0 (0.0%) |
| 45 to 54 Years | 8 (44.4%) | 0 (0.0%) |
| 55 to 59 Years | 4 (36.4%) | 0 (0.0%) |
| 60 to 64 Years | 0 (0.0%) | 0 (0.0%) |
| 65 to 74 Years | 0 (0.0%) | 0 (0.0%) |
| 75 Years and over | 0 (0.0%) | 0 (0.0%) |
| Total | 56 (39.7%) | 0 (0.0%) |
Employment Status by Educational Attainment in Cloverdale
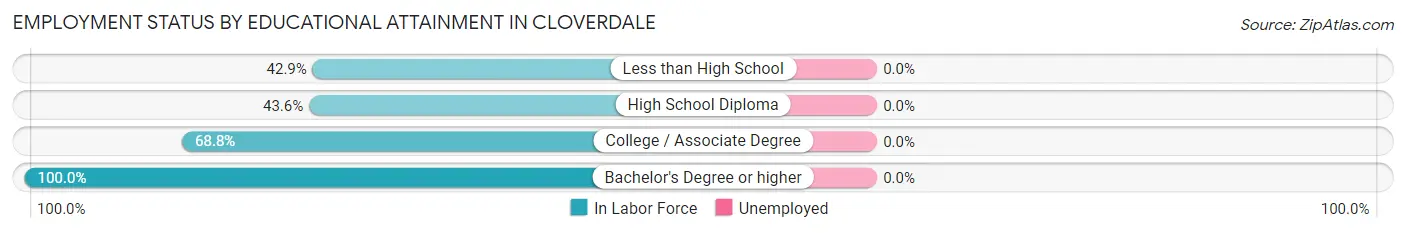
| Educational Attainment | In Labor Force | Unemployed |
| Less than High School | 3 (42.9%) | 0 (0.0%) |
| High School Diploma | 17 (43.6%) | 0 (0.0%) |
| College / Associate Degree | 11 (68.8%) | 0 (0.0%) |
| Bachelor's Degree or higher | 8 (100.0%) | 0 (0.0%) |
| Total | 39 (55.7%) | 0 (0.0%) |
Employment Occupations by Sex in Cloverdale
Management, Business, Science and Arts Occupations
The most common Management, Business, Science and Arts occupations in Cloverdale are Management (10 | 17.9%), Computers, Engineering & Science (7 | 12.5%), Architecture & Engineering (7 | 12.5%), Health Diagnosing & Treating (2 | 3.6%), and Health Technologists (2 | 3.6%).
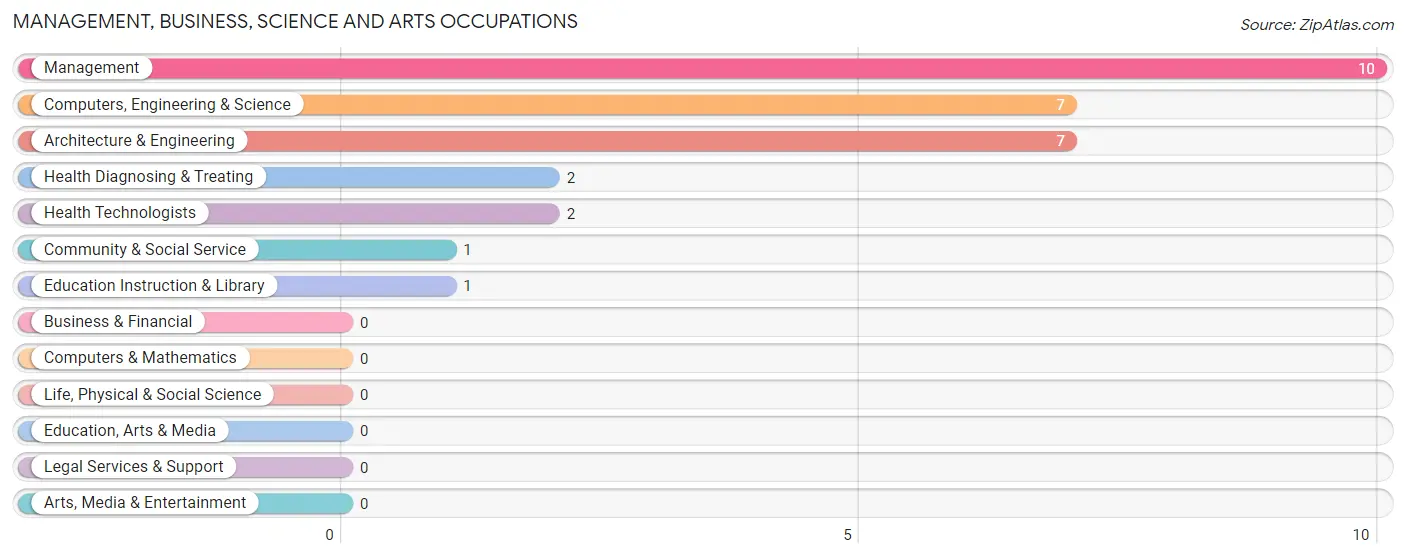
Management, Business, Science and Arts Occupations by Sex
Within the Management, Business, Science and Arts occupations in Cloverdale, the most male-oriented occupations are Computers, Engineering & Science (100.0%), and Architecture & Engineering (100.0%), while the most female-oriented occupations are Management (100.0%), Community & Social Service (100.0%), and Education Instruction & Library (100.0%).
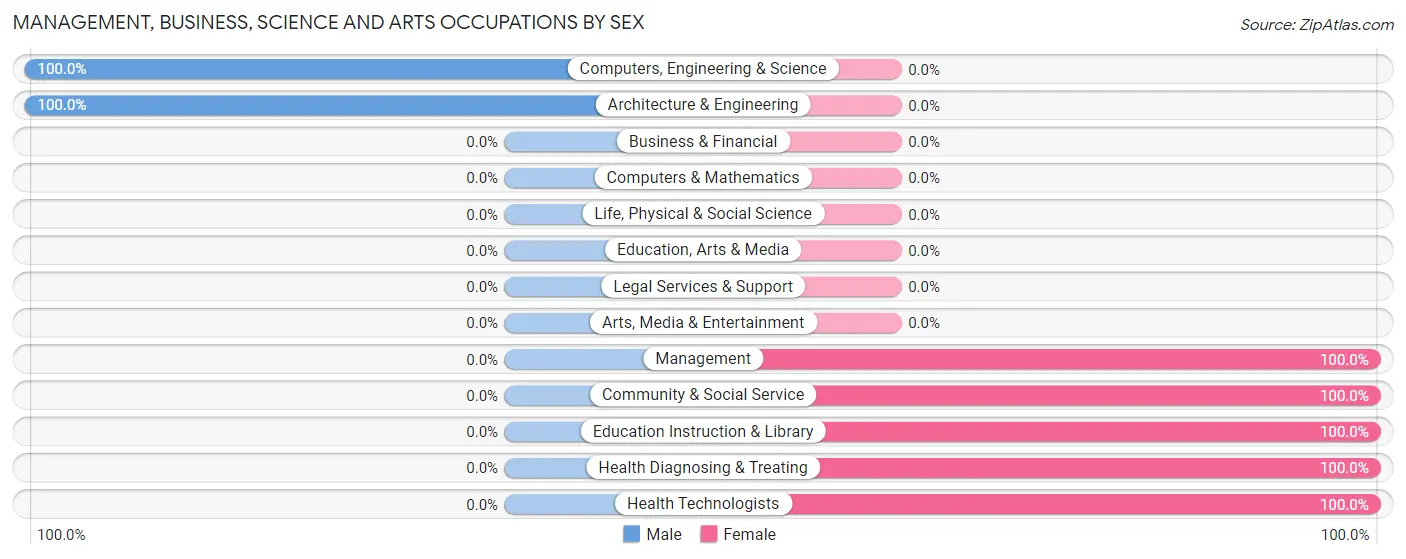
| Occupation | Male | Female |
| Management | 0 (0.0%) | 10 (100.0%) |
| Business & Financial | 0 (0.0%) | 0 (0.0%) |
| Computers, Engineering & Science | 7 (100.0%) | 0 (0.0%) |
| Computers & Mathematics | 0 (0.0%) | 0 (0.0%) |
| Architecture & Engineering | 7 (100.0%) | 0 (0.0%) |
| Life, Physical & Social Science | 0 (0.0%) | 0 (0.0%) |
| Community & Social Service | 0 (0.0%) | 1 (100.0%) |
| Education, Arts & Media | 0 (0.0%) | 0 (0.0%) |
| Legal Services & Support | 0 (0.0%) | 0 (0.0%) |
| Education Instruction & Library | 0 (0.0%) | 1 (100.0%) |
| Arts, Media & Entertainment | 0 (0.0%) | 0 (0.0%) |
| Health Diagnosing & Treating | 0 (0.0%) | 2 (100.0%) |
| Health Technologists | 0 (0.0%) | 2 (100.0%) |
| Total (Category) | 7 (35.0%) | 13 (65.0%) |
| Total (Overall) | 21 (37.5%) | 35 (62.5%) |
Services Occupations
The most common Services occupations in Cloverdale are , and Cleaning & Maintenance (11 | 19.6%).
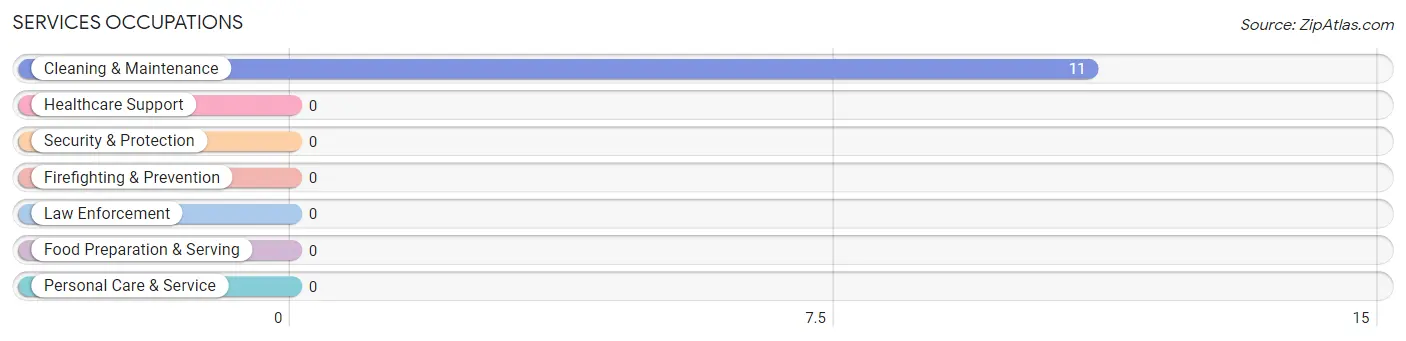
Services Occupations by Sex
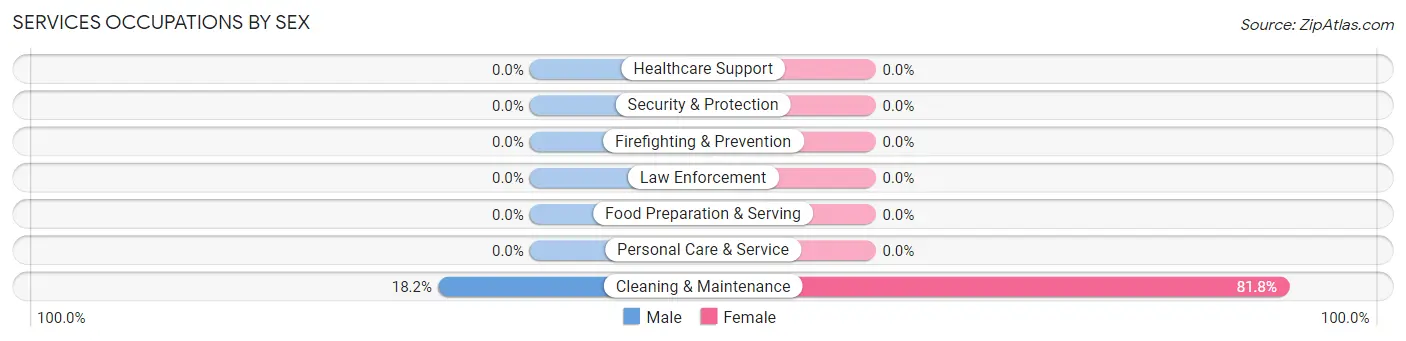
| Occupation | Male | Female |
| Healthcare Support | 0 (0.0%) | 0 (0.0%) |
| Security & Protection | 0 (0.0%) | 0 (0.0%) |
| Firefighting & Prevention | 0 (0.0%) | 0 (0.0%) |
| Law Enforcement | 0 (0.0%) | 0 (0.0%) |
| Food Preparation & Serving | 0 (0.0%) | 0 (0.0%) |
| Cleaning & Maintenance | 2 (18.2%) | 9 (81.8%) |
| Personal Care & Service | 0 (0.0%) | 0 (0.0%) |
| Total (Category) | 2 (18.2%) | 9 (81.8%) |
| Total (Overall) | 21 (37.5%) | 35 (62.5%) |
Sales and Office Occupations
The most common Sales and Office occupations in Cloverdale are Sales & Related (6 | 10.7%), and Office & Administration (5 | 8.9%).
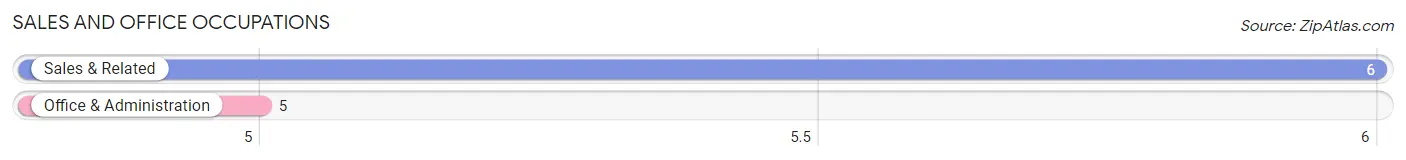
Sales and Office Occupations by Sex
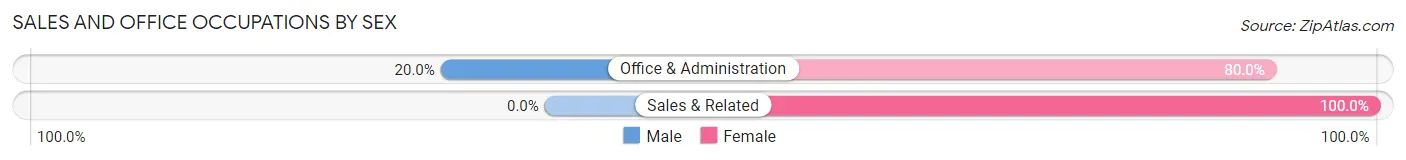
| Occupation | Male | Female |
| Sales & Related | 0 (0.0%) | 6 (100.0%) |
| Office & Administration | 1 (20.0%) | 4 (80.0%) |
| Total (Category) | 1 (9.1%) | 10 (90.9%) |
| Total (Overall) | 21 (37.5%) | 35 (62.5%) |
Natural Resources, Construction and Maintenance Occupations
The most common Natural Resources, Construction and Maintenance occupations in Cloverdale are Installation, Maintenance & Repair (5 | 8.9%), and Farming, Fishing & Forestry (2 | 3.6%).
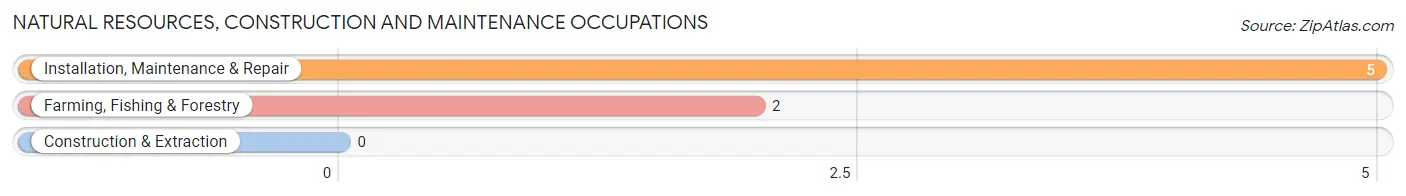
Natural Resources, Construction and Maintenance Occupations by Sex
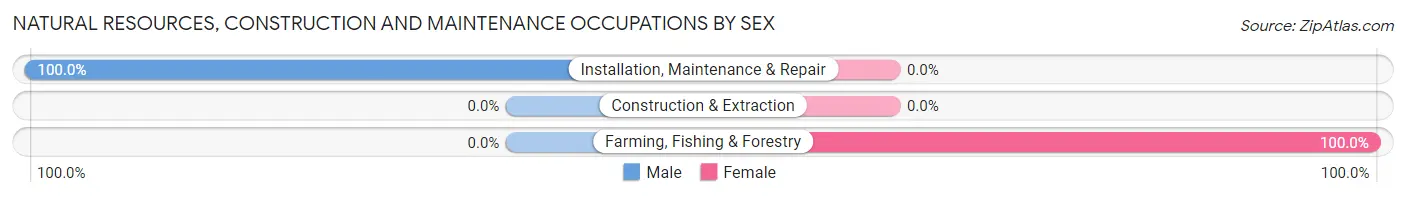
| Occupation | Male | Female |
| Farming, Fishing & Forestry | 0 (0.0%) | 2 (100.0%) |
| Construction & Extraction | 0 (0.0%) | 0 (0.0%) |
| Installation, Maintenance & Repair | 5 (100.0%) | 0 (0.0%) |
| Total (Category) | 5 (71.4%) | 2 (28.6%) |
| Total (Overall) | 21 (37.5%) | 35 (62.5%) |
Production, Transportation and Moving Occupations
The most common Production, Transportation and Moving occupations in Cloverdale are Material Moving (4 | 7.1%), and Production (3 | 5.4%).
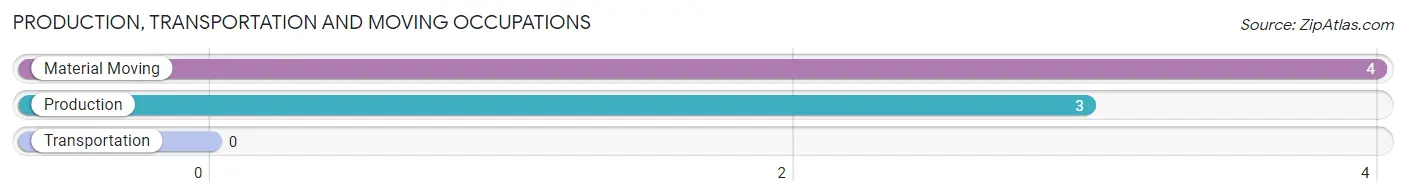
Production, Transportation and Moving Occupations by Sex
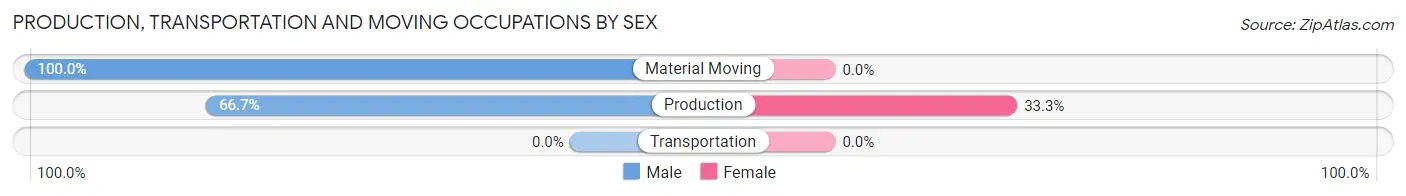
| Occupation | Male | Female |
| Production | 2 (66.7%) | 1 (33.3%) |
| Transportation | 0 (0.0%) | 0 (0.0%) |
| Material Moving | 4 (100.0%) | 0 (0.0%) |
| Total (Category) | 6 (85.7%) | 1 (14.3%) |
| Total (Overall) | 21 (37.5%) | 35 (62.5%) |
Employment Industries by Sex in Cloverdale
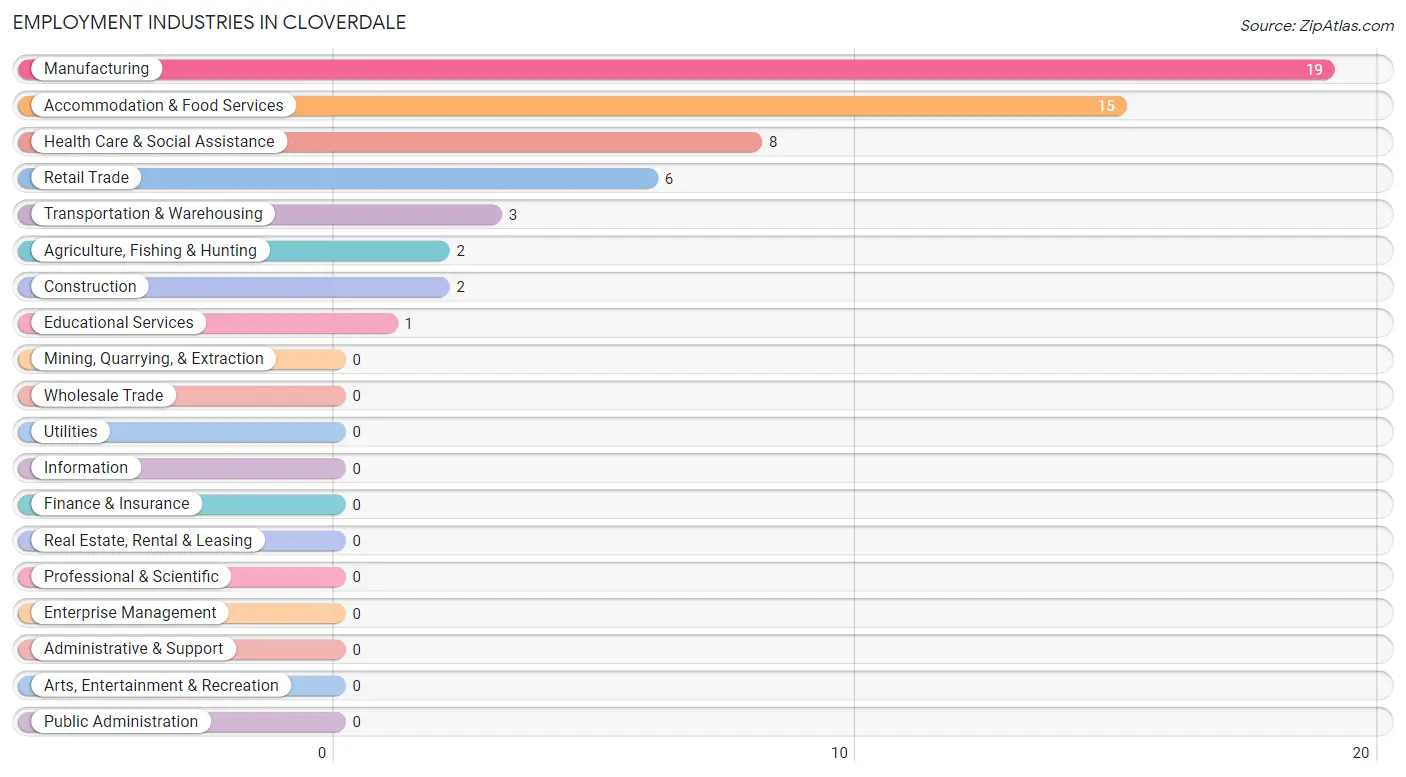
Employment Industries in Cloverdale
The major employment industries in Cloverdale include Manufacturing (19 | 33.9%), Accommodation & Food Services (15 | 26.8%), Health Care & Social Assistance (8 | 14.3%), Retail Trade (6 | 10.7%), and Transportation & Warehousing (3 | 5.4%).
Employment Industries by Sex in Cloverdale
The Cloverdale industries that see more men than women are Construction (100.0%), Manufacturing (84.2%), and Transportation & Warehousing (33.3%), whereas the industries that tend to have a higher number of women are Agriculture, Fishing & Hunting (100.0%), Retail Trade (100.0%), and Educational Services (100.0%).
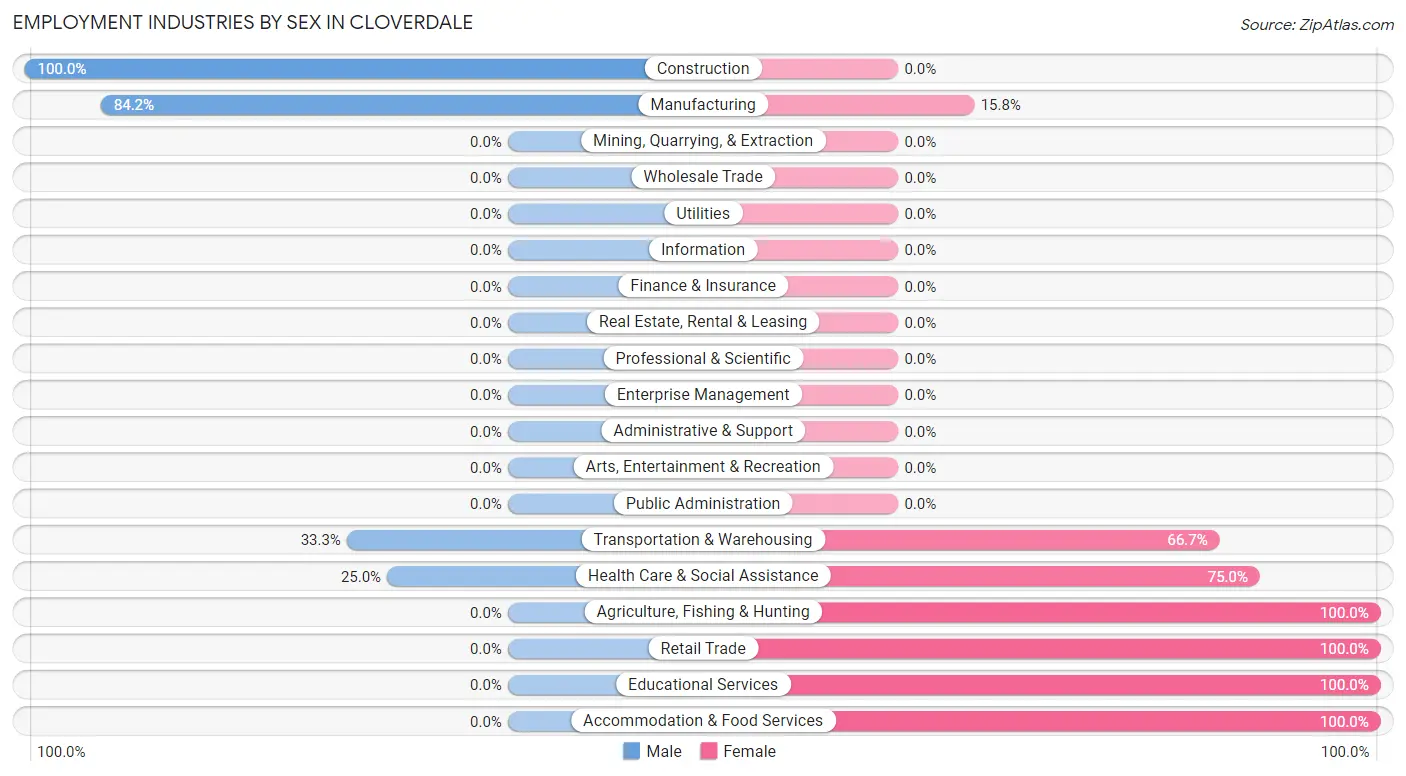
| Industry | Male | Female |
| Agriculture, Fishing & Hunting | 0 (0.0%) | 2 (100.0%) |
| Mining, Quarrying, & Extraction | 0 (0.0%) | 0 (0.0%) |
| Construction | 2 (100.0%) | 0 (0.0%) |
| Manufacturing | 16 (84.2%) | 3 (15.8%) |
| Wholesale Trade | 0 (0.0%) | 0 (0.0%) |
| Retail Trade | 0 (0.0%) | 6 (100.0%) |
| Transportation & Warehousing | 1 (33.3%) | 2 (66.7%) |
| Utilities | 0 (0.0%) | 0 (0.0%) |
| Information | 0 (0.0%) | 0 (0.0%) |
| Finance & Insurance | 0 (0.0%) | 0 (0.0%) |
| Real Estate, Rental & Leasing | 0 (0.0%) | 0 (0.0%) |
| Professional & Scientific | 0 (0.0%) | 0 (0.0%) |
| Enterprise Management | 0 (0.0%) | 0 (0.0%) |
| Administrative & Support | 0 (0.0%) | 0 (0.0%) |
| Educational Services | 0 (0.0%) | 1 (100.0%) |
| Health Care & Social Assistance | 2 (25.0%) | 6 (75.0%) |
| Arts, Entertainment & Recreation | 0 (0.0%) | 0 (0.0%) |
| Accommodation & Food Services | 0 (0.0%) | 15 (100.0%) |
| Public Administration | 0 (0.0%) | 0 (0.0%) |
| Total | 21 (37.5%) | 35 (62.5%) |
Education in Cloverdale
School Enrollment in Cloverdale
The most common levels of schooling among the 15 students in Cloverdale are high school (7 | 46.7%), college / undergraduate (6 | 40.0%), and middle school (2 | 13.3%).
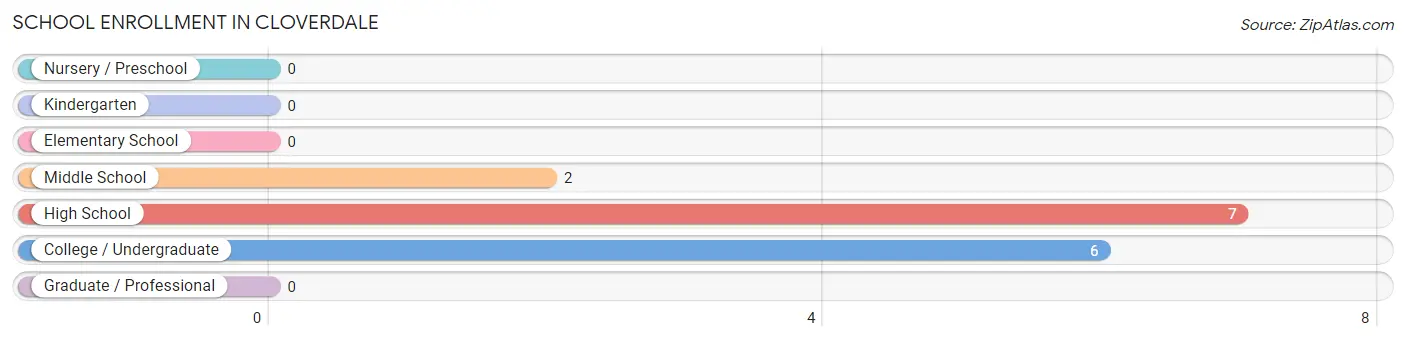
| School Level | # Students | % Students |
| Nursery / Preschool | 0 | 0.0% |
| Kindergarten | 0 | 0.0% |
| Elementary School | 0 | 0.0% |
| Middle School | 2 | 13.3% |
| High School | 7 | 46.7% |
| College / Undergraduate | 6 | 40.0% |
| Graduate / Professional | 0 | 0.0% |
| Total | 15 | 100.0% |
School Enrollment by Age by Funding Source in Cloverdale
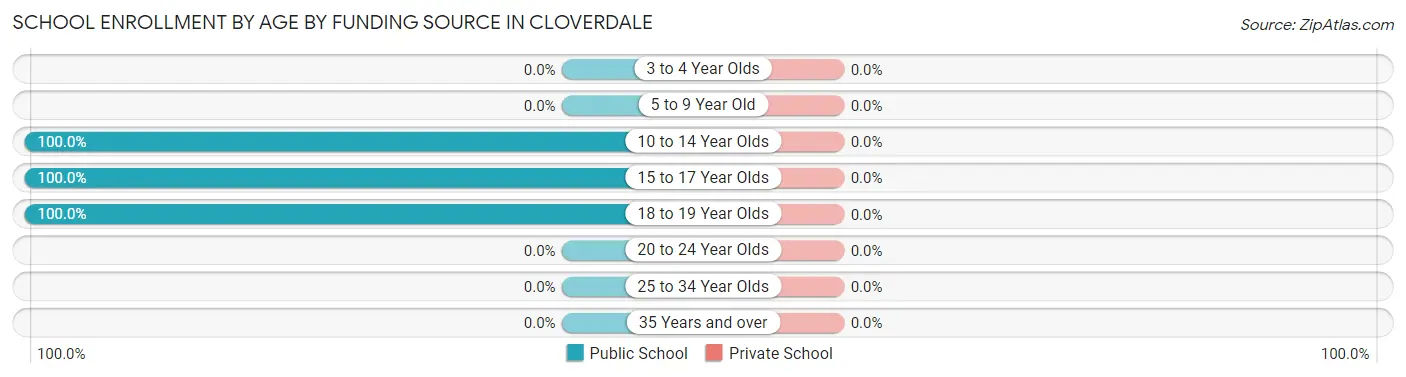
| Age Bracket | Public School | Private School |
| 3 to 4 Year Olds | 0 (0.0%) | 0 (0.0%) |
| 5 to 9 Year Old | 0 (0.0%) | 0 (0.0%) |
| 10 to 14 Year Olds | 2 (100.0%) | 0 (0.0%) |
| 15 to 17 Year Olds | 7 (100.0%) | 0 (0.0%) |
| 18 to 19 Year Olds | 6 (100.0%) | 0 (0.0%) |
| 20 to 24 Year Olds | 0 (0.0%) | 0 (0.0%) |
| 25 to 34 Year Olds | 0 (0.0%) | 0 (0.0%) |
| 35 Years and over | 0 (0.0%) | 0 (0.0%) |
| Total | 15 (100.0%) | 0 (0.0%) |
Educational Attainment by Field of Study in Cloverdale
Science & technology (7 | 77.8%), and education (2 | 22.2%) are the most common fields of study among 9 individuals in Cloverdale who have obtained a bachelor's degree or higher.
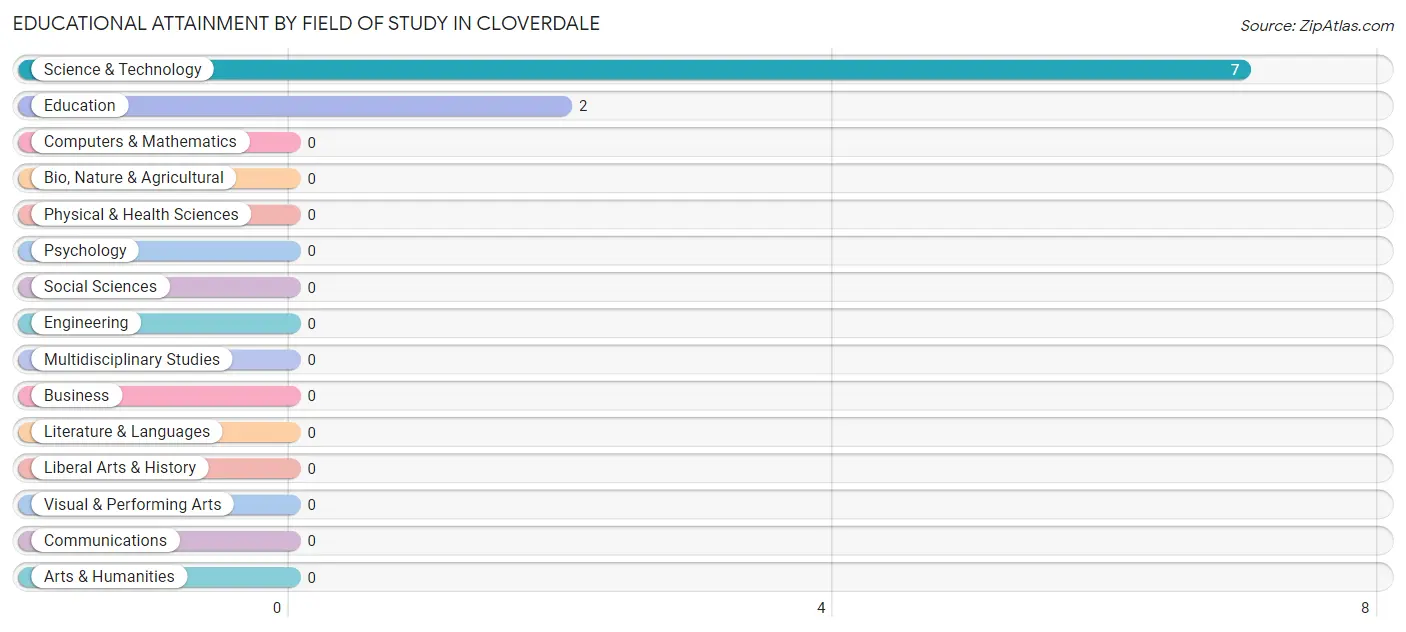
| Field of Study | # Graduates | % Graduates |
| Computers & Mathematics | 0 | 0.0% |
| Bio, Nature & Agricultural | 0 | 0.0% |
| Physical & Health Sciences | 0 | 0.0% |
| Psychology | 0 | 0.0% |
| Social Sciences | 0 | 0.0% |
| Engineering | 0 | 0.0% |
| Multidisciplinary Studies | 0 | 0.0% |
| Science & Technology | 7 | 77.8% |
| Business | 0 | 0.0% |
| Education | 2 | 22.2% |
| Literature & Languages | 0 | 0.0% |
| Liberal Arts & History | 0 | 0.0% |
| Visual & Performing Arts | 0 | 0.0% |
| Communications | 0 | 0.0% |
| Arts & Humanities | 0 | 0.0% |
| Total | 9 | 100.0% |
Transportation & Commute in Cloverdale
Vehicle Availability by Sex in Cloverdale
The most prevalent vehicle ownership categories in Cloverdale are males with 3 vehicles (9, accounting for 42.9%) and females with 3 vehicles (4, making up 27.3%).
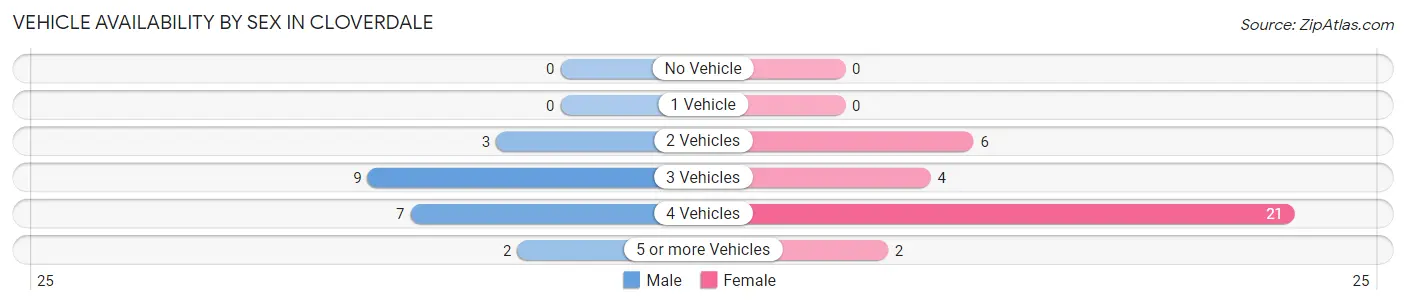
| Vehicles Available | Male | Female |
| No Vehicle | 0 (0.0%) | 0 (0.0%) |
| 1 Vehicle | 0 (0.0%) | 0 (0.0%) |
| 2 Vehicles | 3 (14.3%) | 6 (18.2%) |
| 3 Vehicles | 9 (42.9%) | 4 (12.1%) |
| 4 Vehicles | 7 (33.3%) | 21 (63.6%) |
| 5 or more Vehicles | 2 (9.5%) | 2 (6.1%) |
| Total | 21 (100.0%) | 33 (100.0%) |
Commute Time in Cloverdale
The most frequently occuring commute durations in Cloverdale are 30 to 34 minutes (27 commuters, 50.0%), 10 to 14 minutes (6 commuters, 11.1%), and 45 to 59 minutes (6 commuters, 11.1%).
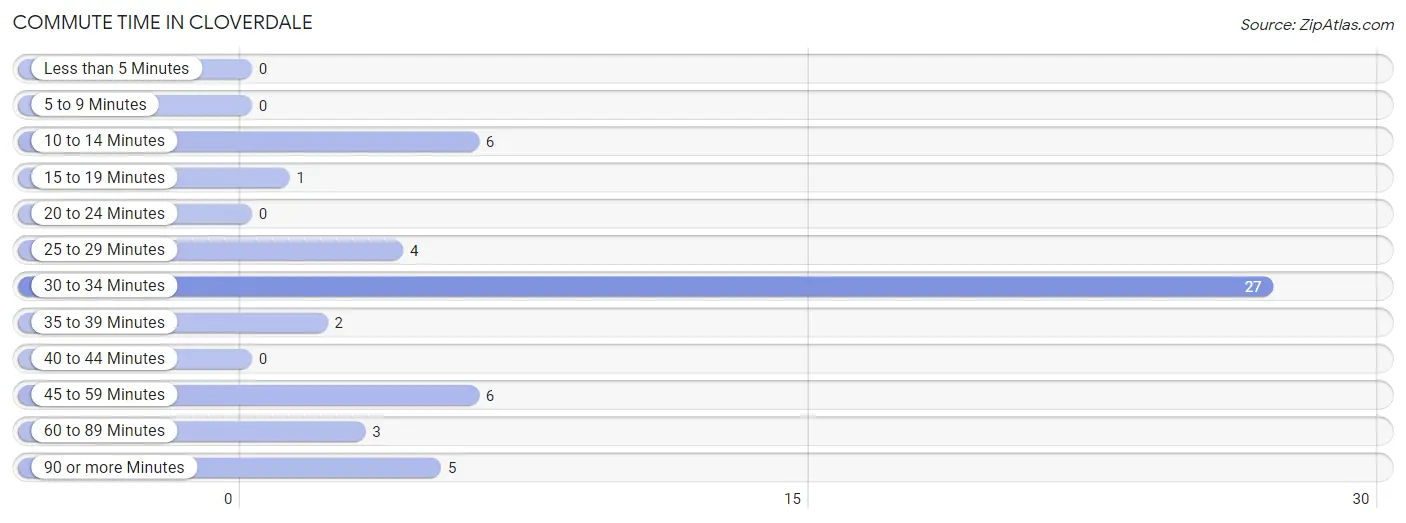
| Commute Time | # Commuters | % Commuters |
| Less than 5 Minutes | 0 | 0.0% |
| 5 to 9 Minutes | 0 | 0.0% |
| 10 to 14 Minutes | 6 | 11.1% |
| 15 to 19 Minutes | 1 | 1.8% |
| 20 to 24 Minutes | 0 | 0.0% |
| 25 to 29 Minutes | 4 | 7.4% |
| 30 to 34 Minutes | 27 | 50.0% |
| 35 to 39 Minutes | 2 | 3.7% |
| 40 to 44 Minutes | 0 | 0.0% |
| 45 to 59 Minutes | 6 | 11.1% |
| 60 to 89 Minutes | 3 | 5.6% |
| 90 or more Minutes | 5 | 9.3% |
Commute Time by Sex in Cloverdale
The most common commute times in Cloverdale are 45 to 59 minutes (6 commuters, 28.6%) for males and 30 to 34 minutes (24 commuters, 72.7%) for females.
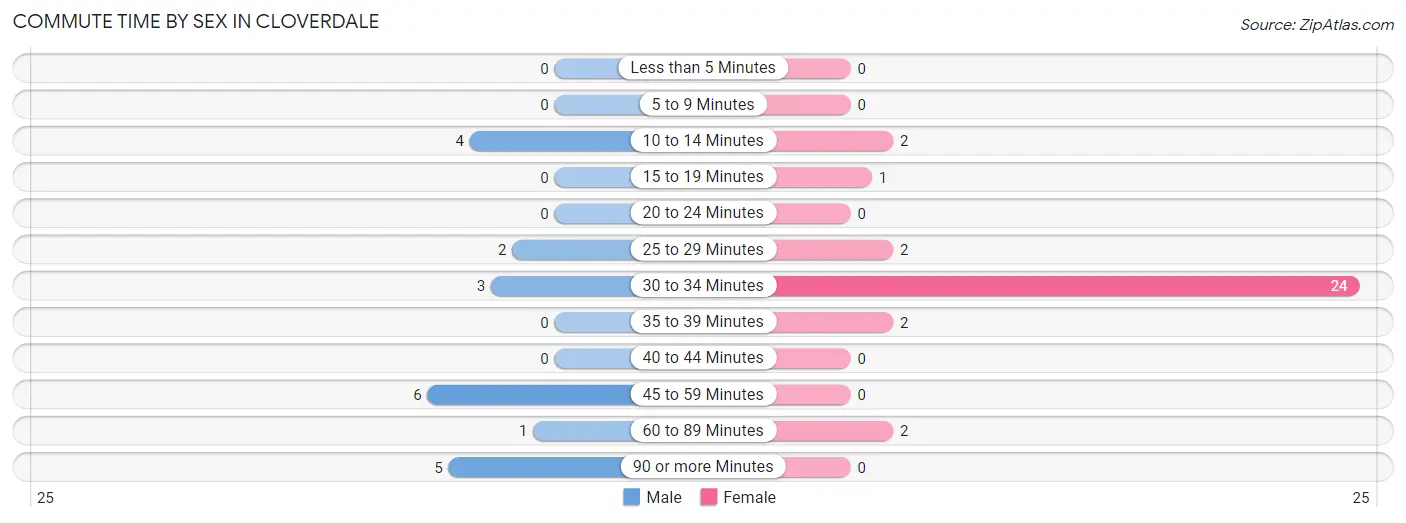
| Commute Time | Male | Female |
| Less than 5 Minutes | 0 (0.0%) | 0 (0.0%) |
| 5 to 9 Minutes | 0 (0.0%) | 0 (0.0%) |
| 10 to 14 Minutes | 4 (19.1%) | 2 (6.1%) |
| 15 to 19 Minutes | 0 (0.0%) | 1 (3.0%) |
| 20 to 24 Minutes | 0 (0.0%) | 0 (0.0%) |
| 25 to 29 Minutes | 2 (9.5%) | 2 (6.1%) |
| 30 to 34 Minutes | 3 (14.3%) | 24 (72.7%) |
| 35 to 39 Minutes | 0 (0.0%) | 2 (6.1%) |
| 40 to 44 Minutes | 0 (0.0%) | 0 (0.0%) |
| 45 to 59 Minutes | 6 (28.6%) | 0 (0.0%) |
| 60 to 89 Minutes | 1 (4.8%) | 2 (6.1%) |
| 90 or more Minutes | 5 (23.8%) | 0 (0.0%) |
Time of Departure to Work by Sex in Cloverdale
The most frequent times of departure to work in Cloverdale are 5:00 AM to 5:29 AM (5, 23.8%) for males and 8:00 AM to 8:29 AM (11, 33.3%) for females.
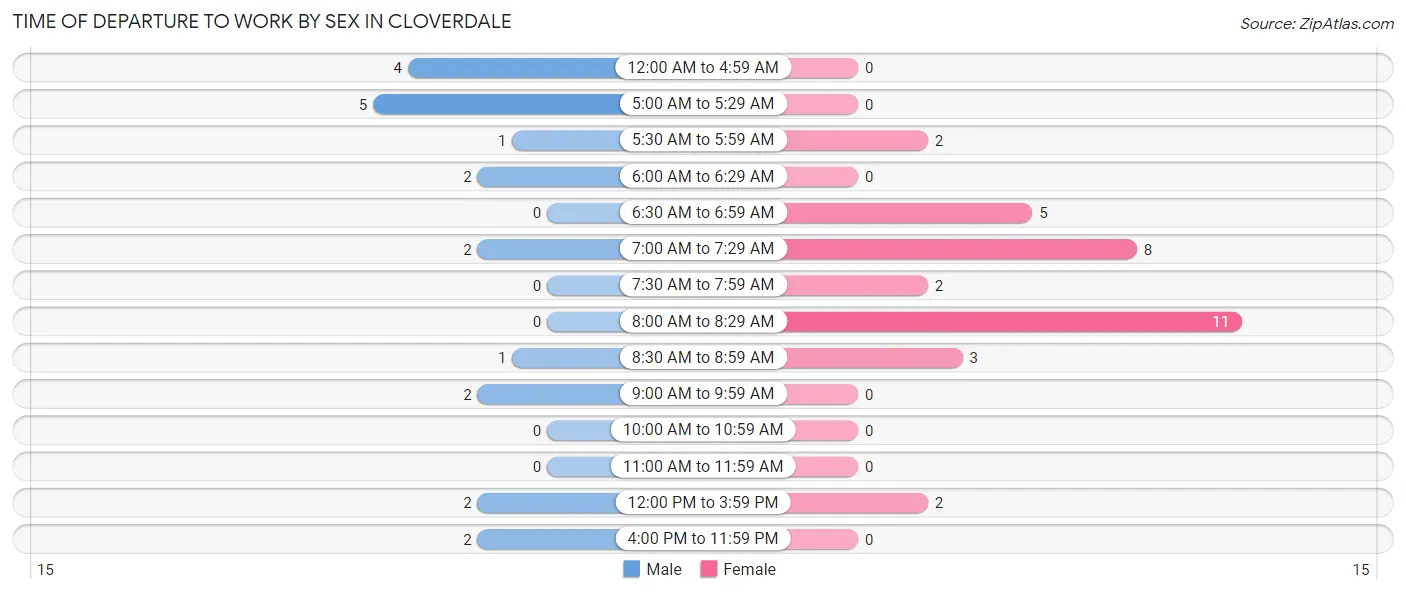
| Time of Departure | Male | Female |
| 12:00 AM to 4:59 AM | 4 (19.1%) | 0 (0.0%) |
| 5:00 AM to 5:29 AM | 5 (23.8%) | 0 (0.0%) |
| 5:30 AM to 5:59 AM | 1 (4.8%) | 2 (6.1%) |
| 6:00 AM to 6:29 AM | 2 (9.5%) | 0 (0.0%) |
| 6:30 AM to 6:59 AM | 0 (0.0%) | 5 (15.1%) |
| 7:00 AM to 7:29 AM | 2 (9.5%) | 8 (24.2%) |
| 7:30 AM to 7:59 AM | 0 (0.0%) | 2 (6.1%) |
| 8:00 AM to 8:29 AM | 0 (0.0%) | 11 (33.3%) |
| 8:30 AM to 8:59 AM | 1 (4.8%) | 3 (9.1%) |
| 9:00 AM to 9:59 AM | 2 (9.5%) | 0 (0.0%) |
| 10:00 AM to 10:59 AM | 0 (0.0%) | 0 (0.0%) |
| 11:00 AM to 11:59 AM | 0 (0.0%) | 0 (0.0%) |
| 12:00 PM to 3:59 PM | 2 (9.5%) | 2 (6.1%) |
| 4:00 PM to 11:59 PM | 2 (9.5%) | 0 (0.0%) |
| Total | 21 (100.0%) | 33 (100.0%) |
Housing Occupancy in Cloverdale
Occupancy by Ownership in Cloverdale
Of the total 55 dwellings in Cloverdale, owner-occupied units account for 52 (94.6%), while renter-occupied units make up 3 (5.4%).
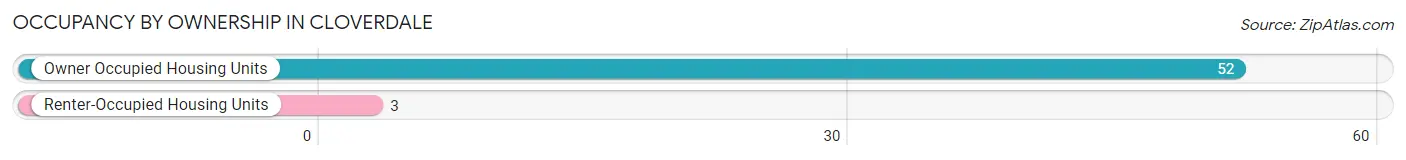
| Occupancy | # Housing Units | % Housing Units |
| Owner Occupied Housing Units | 52 | 94.6% |
| Renter-Occupied Housing Units | 3 | 5.4% |
| Total Occupied Housing Units | 55 | 100.0% |
Occupancy by Household Size in Cloverdale
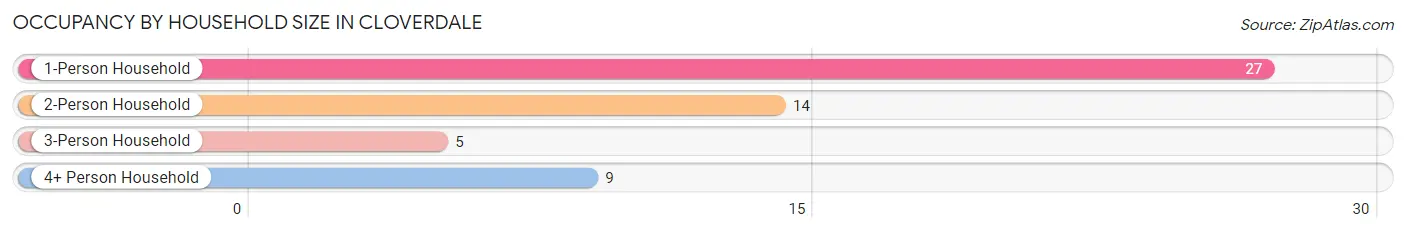
| Household Size | # Housing Units | % Housing Units |
| 1-Person Household | 27 | 49.1% |
| 2-Person Household | 14 | 25.5% |
| 3-Person Household | 5 | 9.1% |
| 4+ Person Household | 9 | 16.4% |
| Total Housing Units | 55 | 100.0% |
Occupancy by Ownership by Household Size in Cloverdale
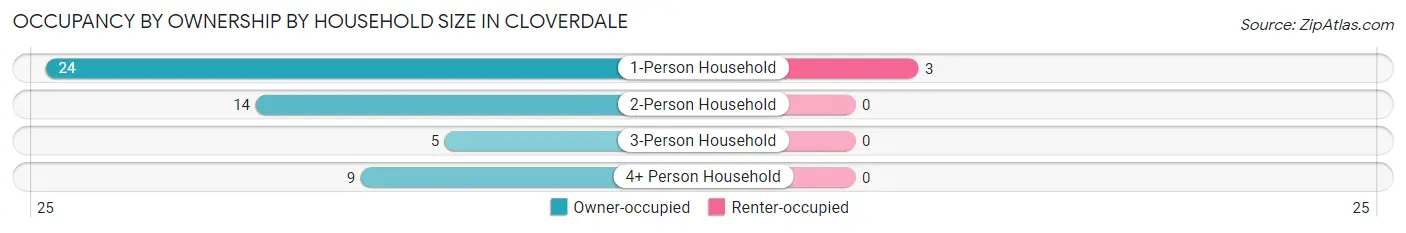
| Household Size | Owner-occupied | Renter-occupied |
| 1-Person Household | 24 (88.9%) | 3 (11.1%) |
| 2-Person Household | 14 (100.0%) | 0 (0.0%) |
| 3-Person Household | 5 (100.0%) | 0 (0.0%) |
| 4+ Person Household | 9 (100.0%) | 0 (0.0%) |
| Total Housing Units | 52 (94.6%) | 3 (5.4%) |
Occupancy by Educational Attainment in Cloverdale
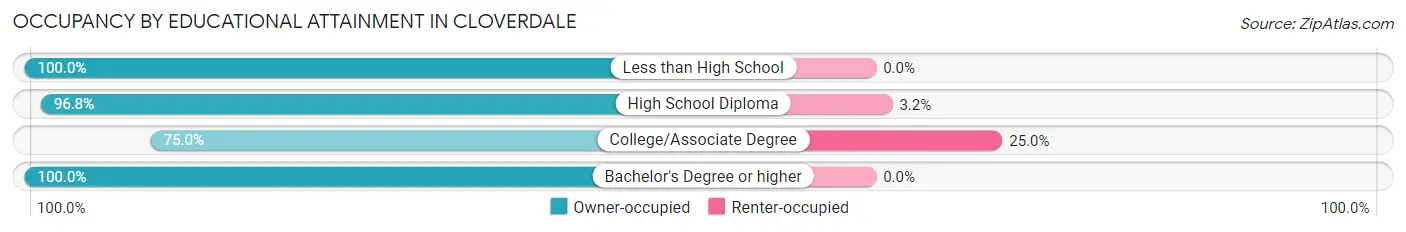
| Household Size | Owner-occupied | Renter-occupied |
| Less than High School | 7 (100.0%) | 0 (0.0%) |
| High School Diploma | 30 (96.8%) | 1 (3.2%) |
| College/Associate Degree | 6 (75.0%) | 2 (25.0%) |
| Bachelor's Degree or higher | 9 (100.0%) | 0 (0.0%) |
Occupancy by Age of Householder in Cloverdale
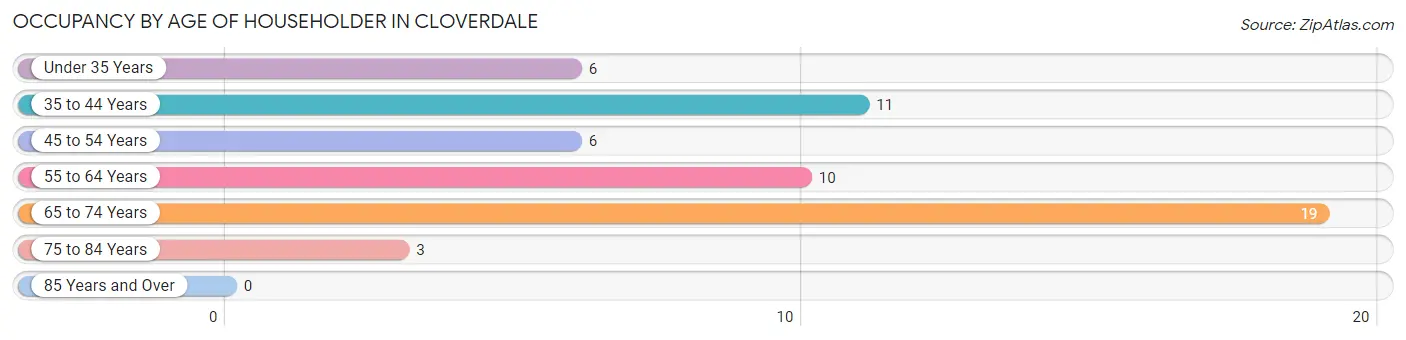
| Age Bracket | # Households | % Households |
| Under 35 Years | 6 | 10.9% |
| 35 to 44 Years | 11 | 20.0% |
| 45 to 54 Years | 6 | 10.9% |
| 55 to 64 Years | 10 | 18.2% |
| 65 to 74 Years | 19 | 34.5% |
| 75 to 84 Years | 3 | 5.4% |
| 85 Years and Over | 0 | 0.0% |
| Total | 55 | 100.0% |
Housing Finances in Cloverdale
Median Income by Occupancy in Cloverdale
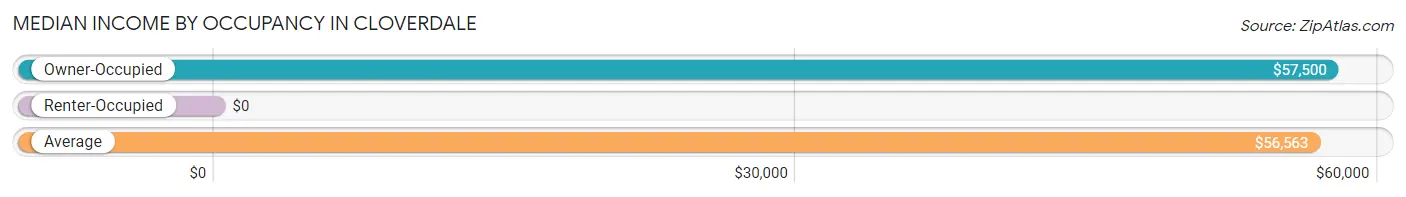
| Occupancy Type | # Households | Median Income |
| Owner-Occupied | 52 (94.6%) | $57,500 |
| Renter-Occupied | 3 (5.4%) | $0 |
| Average | 55 (100.0%) | $56,563 |
Occupancy by Householder Income Bracket in Cloverdale
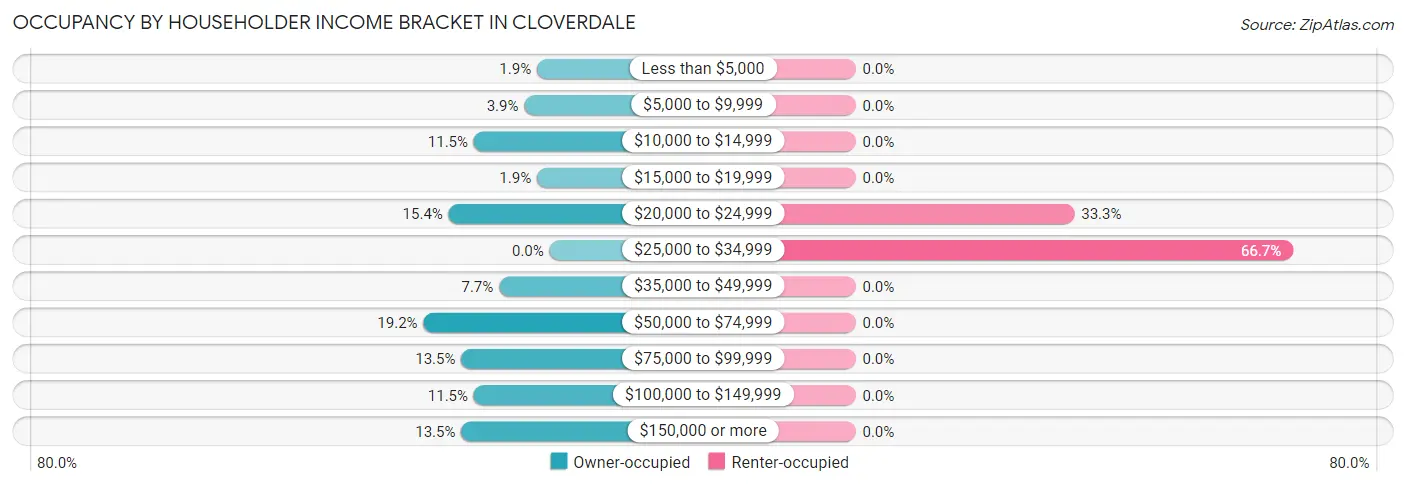
| Income Bracket | Owner-occupied | Renter-occupied |
| Less than $5,000 | 1 (1.9%) | 0 (0.0%) |
| $5,000 to $9,999 | 2 (3.8%) | 0 (0.0%) |
| $10,000 to $14,999 | 6 (11.5%) | 0 (0.0%) |
| $15,000 to $19,999 | 1 (1.9%) | 0 (0.0%) |
| $20,000 to $24,999 | 8 (15.4%) | 1 (33.3%) |
| $25,000 to $34,999 | 0 (0.0%) | 2 (66.7%) |
| $35,000 to $49,999 | 4 (7.7%) | 0 (0.0%) |
| $50,000 to $74,999 | 10 (19.2%) | 0 (0.0%) |
| $75,000 to $99,999 | 7 (13.5%) | 0 (0.0%) |
| $100,000 to $149,999 | 6 (11.5%) | 0 (0.0%) |
| $150,000 or more | 7 (13.5%) | 0 (0.0%) |
| Total | 52 (100.0%) | 3 (100.0%) |
Monthly Housing Cost Tiers in Cloverdale
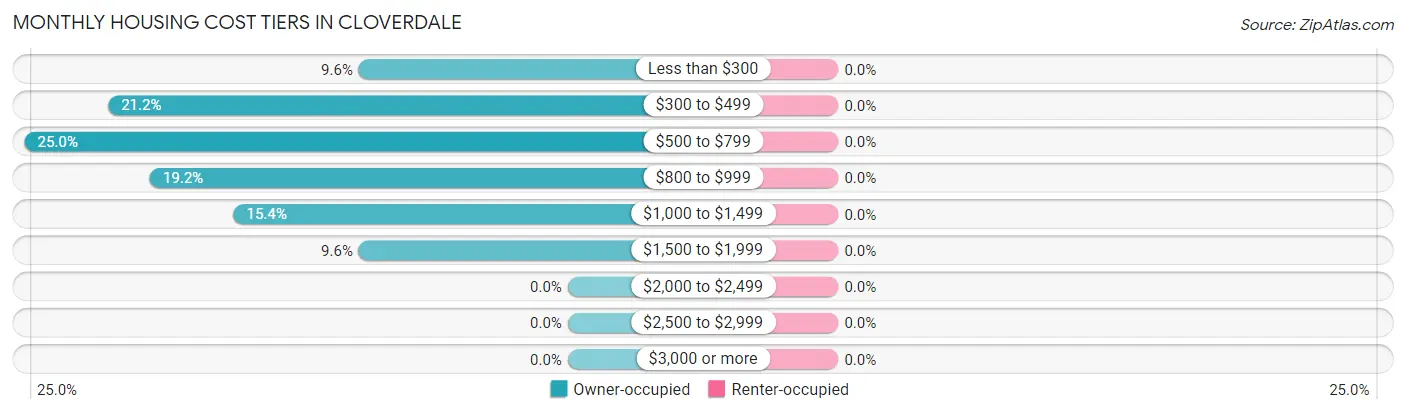
| Monthly Cost | Owner-occupied | Renter-occupied |
| Less than $300 | 5 (9.6%) | 0 (0.0%) |
| $300 to $499 | 11 (21.1%) | 0 (0.0%) |
| $500 to $799 | 13 (25.0%) | 0 (0.0%) |
| $800 to $999 | 10 (19.2%) | 0 (0.0%) |
| $1,000 to $1,499 | 8 (15.4%) | 0 (0.0%) |
| $1,500 to $1,999 | 5 (9.6%) | 0 (0.0%) |
| $2,000 to $2,499 | 0 (0.0%) | 0 (0.0%) |
| $2,500 to $2,999 | 0 (0.0%) | 0 (0.0%) |
| $3,000 or more | 0 (0.0%) | 0 (0.0%) |
| Total | 52 (100.0%) | 3 (100.0%) |
Physical Housing Characteristics in Cloverdale
Housing Structures in Cloverdale
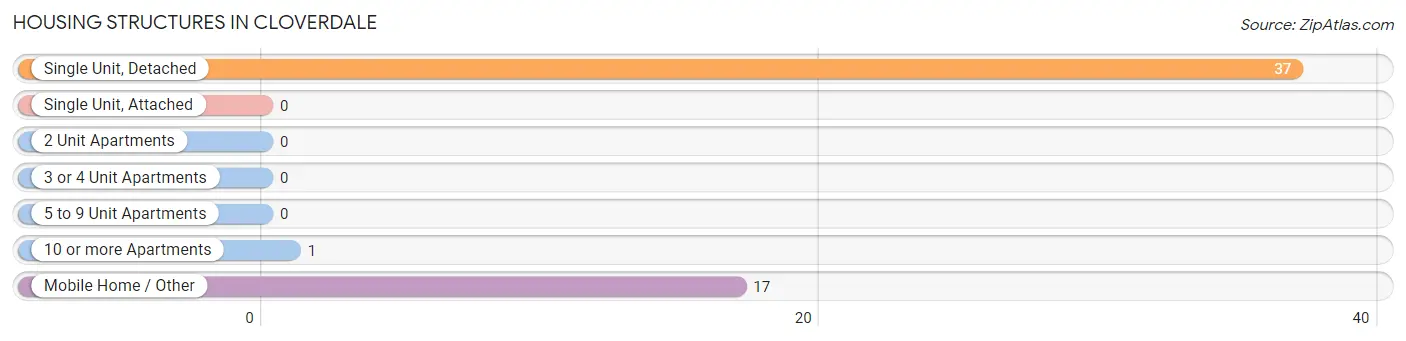
| Structure Type | # Housing Units | % Housing Units |
| Single Unit, Detached | 37 | 67.3% |
| Single Unit, Attached | 0 | 0.0% |
| 2 Unit Apartments | 0 | 0.0% |
| 3 or 4 Unit Apartments | 0 | 0.0% |
| 5 to 9 Unit Apartments | 0 | 0.0% |
| 10 or more Apartments | 1 | 1.8% |
| Mobile Home / Other | 17 | 30.9% |
| Total | 55 | 100.0% |
Housing Structures by Occupancy in Cloverdale
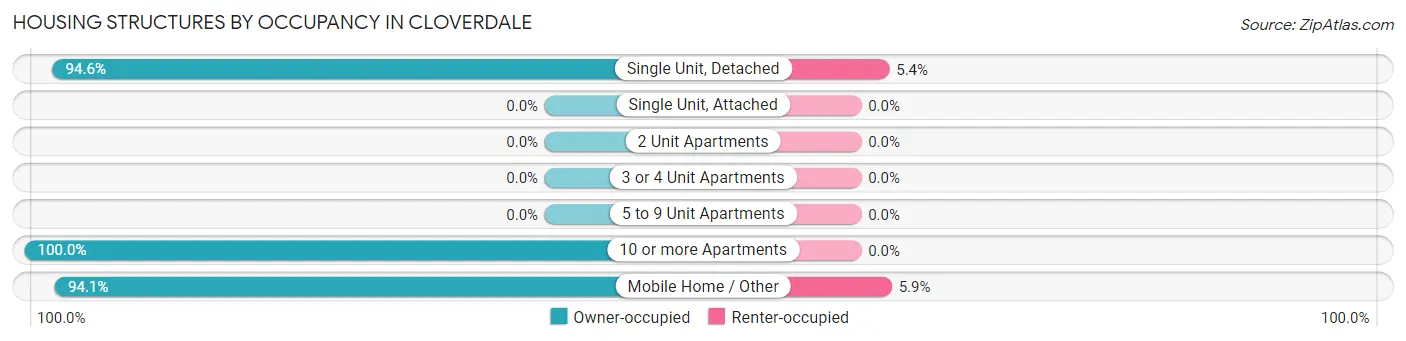
| Structure Type | Owner-occupied | Renter-occupied |
| Single Unit, Detached | 35 (94.6%) | 2 (5.4%) |
| Single Unit, Attached | 0 (0.0%) | 0 (0.0%) |
| 2 Unit Apartments | 0 (0.0%) | 0 (0.0%) |
| 3 or 4 Unit Apartments | 0 (0.0%) | 0 (0.0%) |
| 5 to 9 Unit Apartments | 0 (0.0%) | 0 (0.0%) |
| 10 or more Apartments | 1 (100.0%) | 0 (0.0%) |
| Mobile Home / Other | 16 (94.1%) | 1 (5.9%) |
| Total | 52 (94.6%) | 3 (5.4%) |
Housing Structures by Number of Rooms in Cloverdale
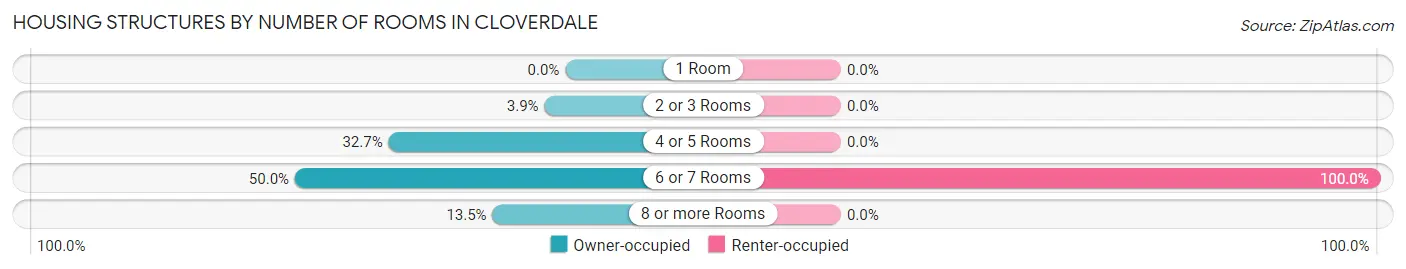
| Number of Rooms | Owner-occupied | Renter-occupied |
| 1 Room | 0 (0.0%) | 0 (0.0%) |
| 2 or 3 Rooms | 2 (3.8%) | 0 (0.0%) |
| 4 or 5 Rooms | 17 (32.7%) | 0 (0.0%) |
| 6 or 7 Rooms | 26 (50.0%) | 3 (100.0%) |
| 8 or more Rooms | 7 (13.5%) | 0 (0.0%) |
| Total | 52 (100.0%) | 3 (100.0%) |
Housing Structure by Heating Type in Cloverdale
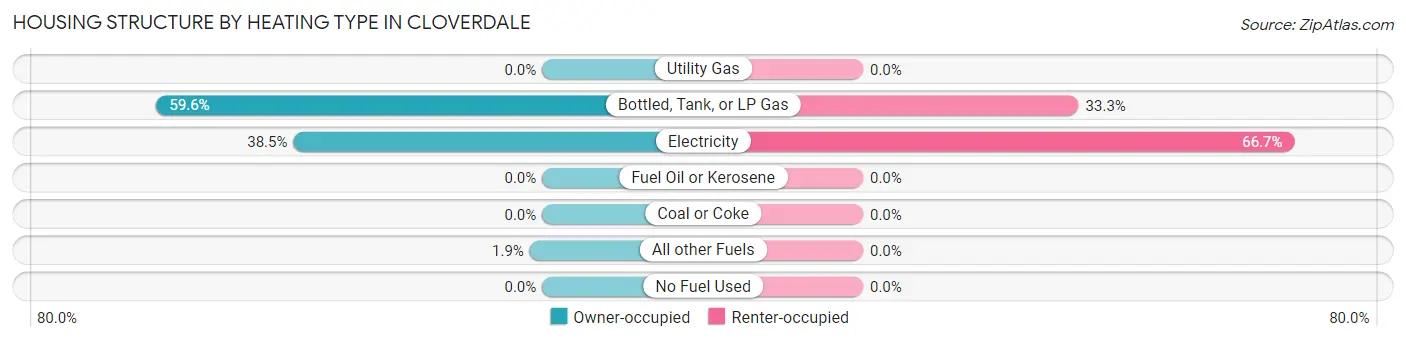
| Heating Type | Owner-occupied | Renter-occupied |
| Utility Gas | 0 (0.0%) | 0 (0.0%) |
| Bottled, Tank, or LP Gas | 31 (59.6%) | 1 (33.3%) |
| Electricity | 20 (38.5%) | 2 (66.7%) |
| Fuel Oil or Kerosene | 0 (0.0%) | 0 (0.0%) |
| Coal or Coke | 0 (0.0%) | 0 (0.0%) |
| All other Fuels | 1 (1.9%) | 0 (0.0%) |
| No Fuel Used | 0 (0.0%) | 0 (0.0%) |
| Total | 52 (100.0%) | 3 (100.0%) |
Household Vehicle Usage in Cloverdale
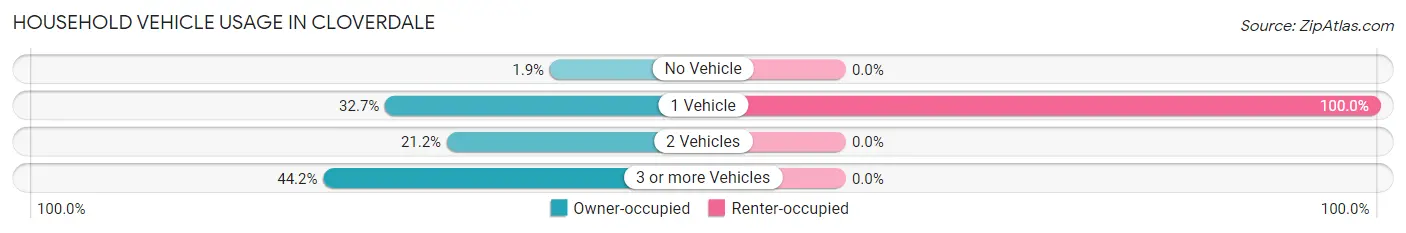
| Vehicles per Household | Owner-occupied | Renter-occupied |
| No Vehicle | 1 (1.9%) | 0 (0.0%) |
| 1 Vehicle | 17 (32.7%) | 3 (100.0%) |
| 2 Vehicles | 11 (21.1%) | 0 (0.0%) |
| 3 or more Vehicles | 23 (44.2%) | 0 (0.0%) |
| Total | 52 (100.0%) | 3 (100.0%) |
Real Estate & Mortgages in Cloverdale
Real Estate and Mortgage Overview in Cloverdale
| Characteristic | Without Mortgage | With Mortgage |
| Housing Units | 24 | 28 |
| Median Property Value | $75,000 | $0 |
| Median Household Income | $42,500 | $7 |
| Monthly Housing Costs | $375 | $0 |
| Real Estate Taxes | $680 | $0 |
Property Value by Mortgage Status in Cloverdale
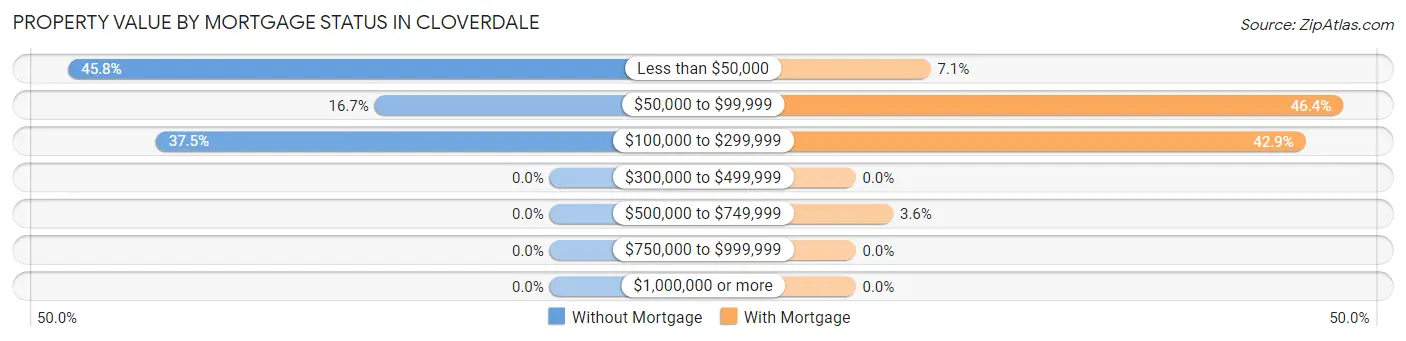
| Property Value | Without Mortgage | With Mortgage |
| Less than $50,000 | 11 (45.8%) | 2 (7.1%) |
| $50,000 to $99,999 | 4 (16.7%) | 13 (46.4%) |
| $100,000 to $299,999 | 9 (37.5%) | 12 (42.9%) |
| $300,000 to $499,999 | 0 (0.0%) | 0 (0.0%) |
| $500,000 to $749,999 | 0 (0.0%) | 1 (3.6%) |
| $750,000 to $999,999 | 0 (0.0%) | 0 (0.0%) |
| $1,000,000 or more | 0 (0.0%) | 0 (0.0%) |
| Total | 24 (100.0%) | 28 (100.0%) |
Household Income by Mortgage Status in Cloverdale
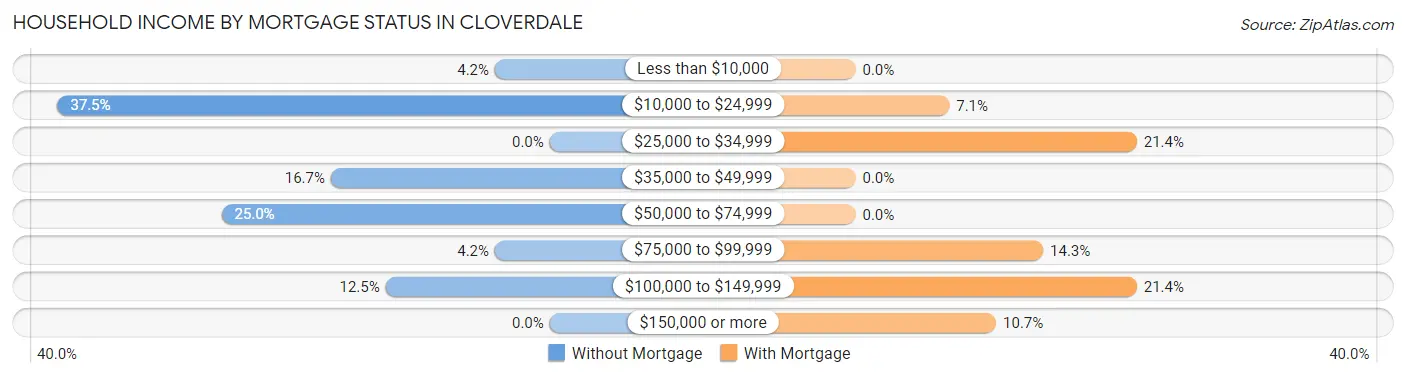
| Household Income | Without Mortgage | With Mortgage |
| Less than $10,000 | 1 (4.2%) | 0 (0.0%) |
| $10,000 to $24,999 | 9 (37.5%) | 2 (7.1%) |
| $25,000 to $34,999 | 0 (0.0%) | 6 (21.4%) |
| $35,000 to $49,999 | 4 (16.7%) | 0 (0.0%) |
| $50,000 to $74,999 | 6 (25.0%) | 0 (0.0%) |
| $75,000 to $99,999 | 1 (4.2%) | 4 (14.3%) |
| $100,000 to $149,999 | 3 (12.5%) | 6 (21.4%) |
| $150,000 or more | 0 (0.0%) | 3 (10.7%) |
| Total | 24 (100.0%) | 28 (100.0%) |
Property Value to Household Income Ratio in Cloverdale
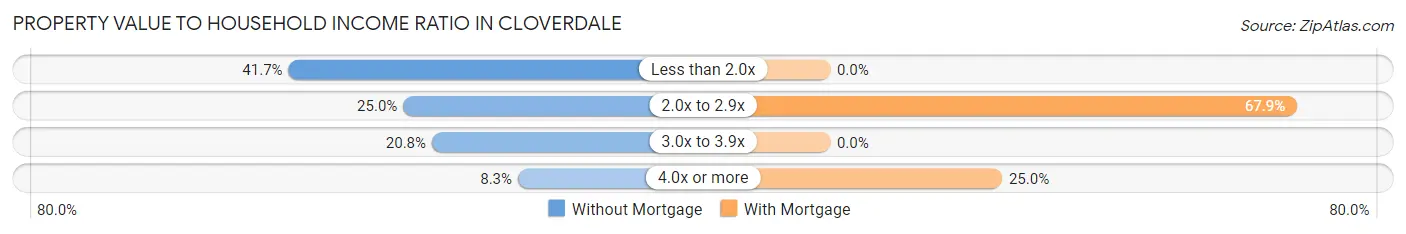
| Value-to-Income Ratio | Without Mortgage | With Mortgage |
| Less than 2.0x | 10 (41.7%) | 0 (0.0%) |
| 2.0x to 2.9x | 6 (25.0%) | 19 (67.9%) |
| 3.0x to 3.9x | 5 (20.8%) | 0 (0.0%) |
| 4.0x or more | 2 (8.3%) | 7 (25.0%) |
| Total | 24 (100.0%) | 28 (100.0%) |
Real Estate Taxes by Mortgage Status in Cloverdale
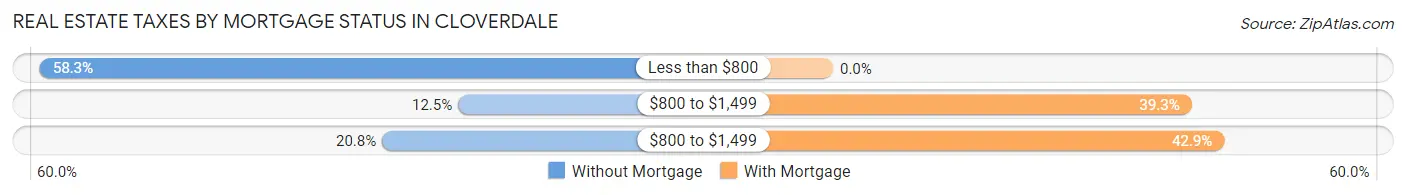
| Property Taxes | Without Mortgage | With Mortgage |
| Less than $800 | 14 (58.3%) | 0 (0.0%) |
| $800 to $1,499 | 3 (12.5%) | 11 (39.3%) |
| $800 to $1,499 | 5 (20.8%) | 12 (42.9%) |
| Total | 24 (100.0%) | 28 (100.0%) |
Health & Disability in Cloverdale
Health Insurance Coverage by Age in Cloverdale
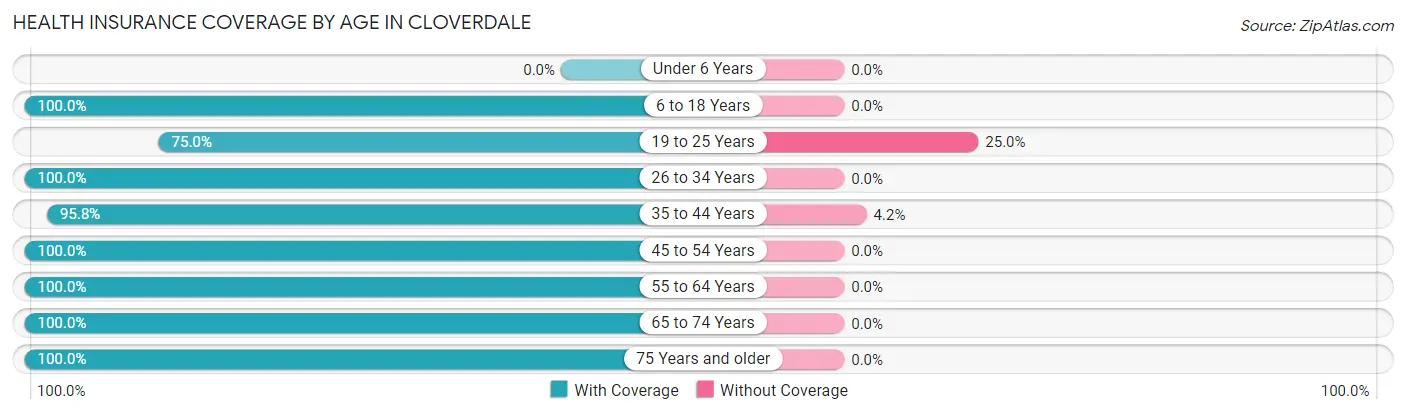
| Age Bracket | With Coverage | Without Coverage |
| Under 6 Years | 0 (0.0%) | 0 (0.0%) |
| 6 to 18 Years | 18 (100.0%) | 0 (0.0%) |
| 19 to 25 Years | 6 (75.0%) | 2 (25.0%) |
| 26 to 34 Years | 11 (100.0%) | 0 (0.0%) |
| 35 to 44 Years | 23 (95.8%) | 1 (4.2%) |
| 45 to 54 Years | 18 (100.0%) | 0 (0.0%) |
| 55 to 64 Years | 17 (100.0%) | 0 (0.0%) |
| 65 to 74 Years | 49 (100.0%) | 0 (0.0%) |
| 75 Years and older | 3 (100.0%) | 0 (0.0%) |
| Total | 145 (98.0%) | 3 (2.0%) |
Health Insurance Coverage by Citizenship Status in Cloverdale
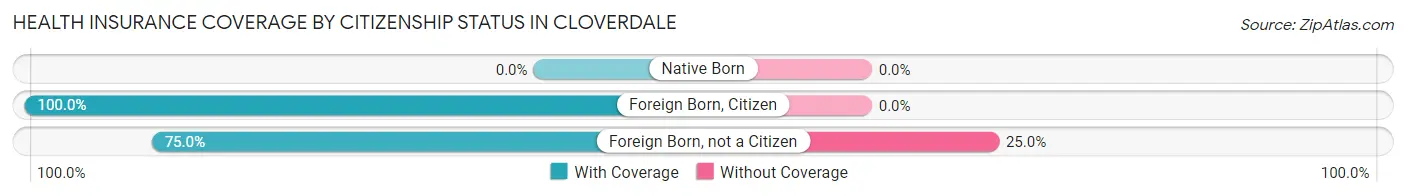
| Citizenship Status | With Coverage | Without Coverage |
| Native Born | 0 (0.0%) | 0 (0.0%) |
| Foreign Born, Citizen | 18 (100.0%) | 0 (0.0%) |
| Foreign Born, not a Citizen | 6 (75.0%) | 2 (25.0%) |
Health Insurance Coverage by Household Income in Cloverdale
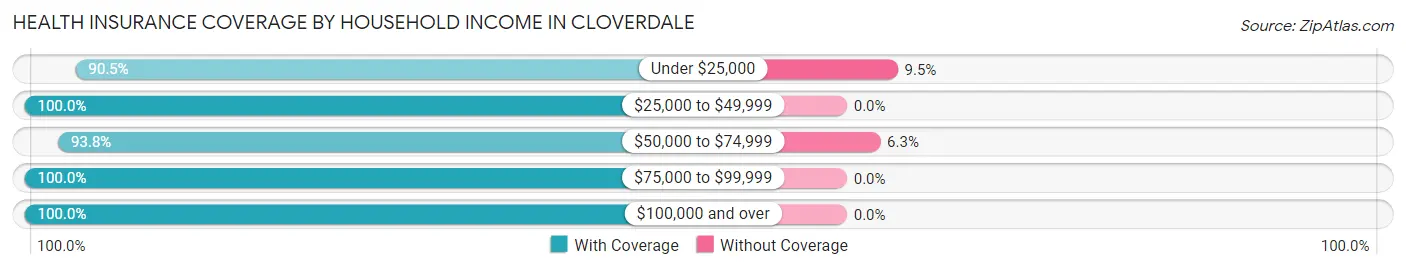
| Household Income | With Coverage | Without Coverage |
| Under $25,000 | 19 (90.5%) | 2 (9.5%) |
| $25,000 to $49,999 | 8 (100.0%) | 0 (0.0%) |
| $50,000 to $74,999 | 15 (93.8%) | 1 (6.2%) |
| $75,000 to $99,999 | 18 (100.0%) | 0 (0.0%) |
| $100,000 and over | 64 (100.0%) | 0 (0.0%) |
Public vs Private Health Insurance Coverage by Age in Cloverdale
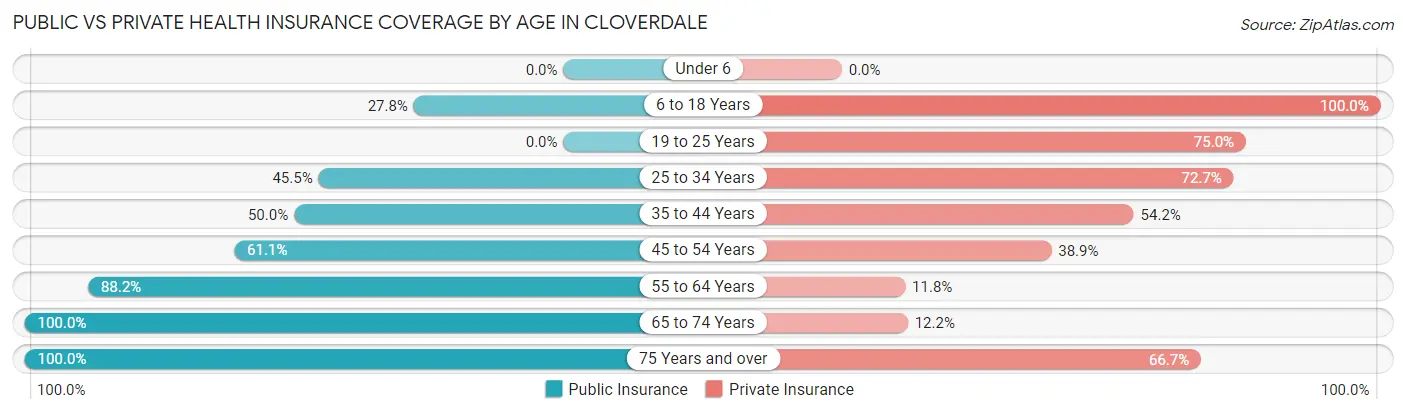
| Age Bracket | Public Insurance | Private Insurance |
| Under 6 | 0 (0.0%) | 0 (0.0%) |
| 6 to 18 Years | 5 (27.8%) | 18 (100.0%) |
| 19 to 25 Years | 0 (0.0%) | 6 (75.0%) |
| 25 to 34 Years | 5 (45.5%) | 8 (72.7%) |
| 35 to 44 Years | 12 (50.0%) | 13 (54.2%) |
| 45 to 54 Years | 11 (61.1%) | 7 (38.9%) |
| 55 to 64 Years | 15 (88.2%) | 2 (11.8%) |
| 65 to 74 Years | 49 (100.0%) | 6 (12.2%) |
| 75 Years and over | 3 (100.0%) | 2 (66.7%) |
| Total | 100 (67.6%) | 62 (41.9%) |
Disability Status by Sex by Age in Cloverdale
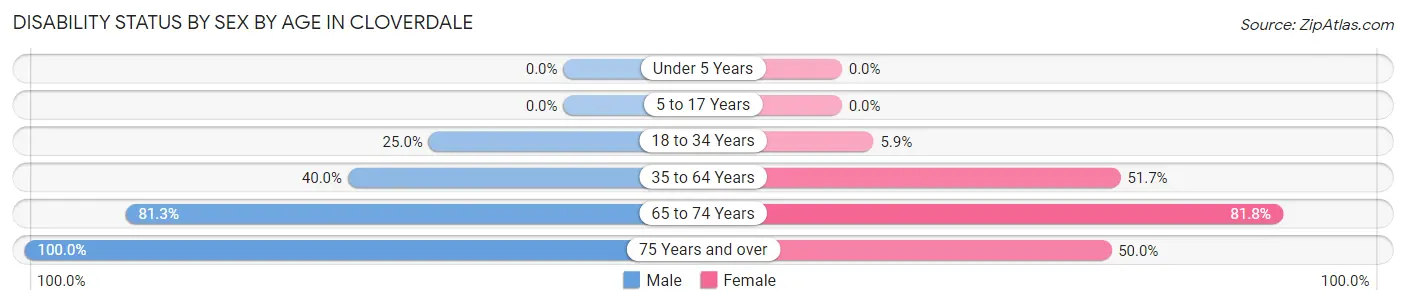
| Age Bracket | Male | Female |
| Under 5 Years | 0 (0.0%) | 0 (0.0%) |
| 5 to 17 Years | 0 (0.0%) | 0 (0.0%) |
| 18 to 34 Years | 2 (25.0%) | 1 (5.9%) |
| 35 to 64 Years | 12 (40.0%) | 15 (51.7%) |
| 65 to 74 Years | 13 (81.2%) | 27 (81.8%) |
| 75 Years and over | 1 (100.0%) | 1 (50.0%) |
Disability Class by Sex by Age in Cloverdale
Disability Class: Hearing Difficulty
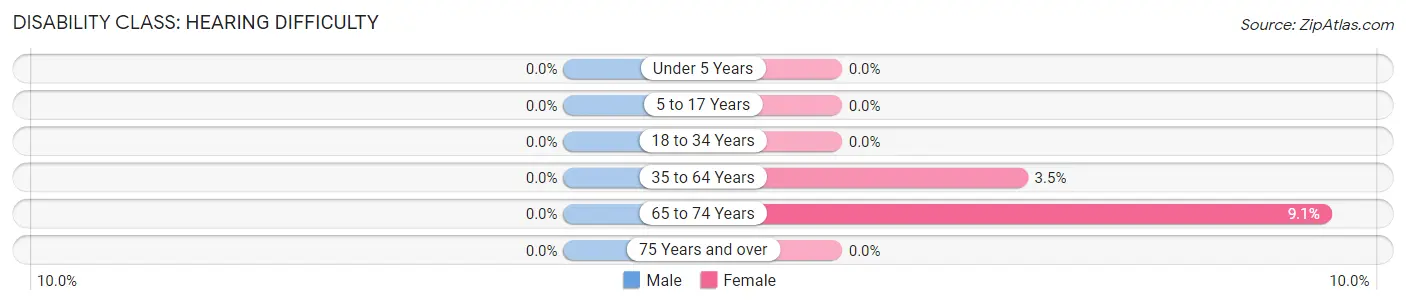
| Age Bracket | Male | Female |
| Under 5 Years | 0 (0.0%) | 0 (0.0%) |
| 5 to 17 Years | 0 (0.0%) | 0 (0.0%) |
| 18 to 34 Years | 0 (0.0%) | 0 (0.0%) |
| 35 to 64 Years | 0 (0.0%) | 1 (3.5%) |
| 65 to 74 Years | 0 (0.0%) | 3 (9.1%) |
| 75 Years and over | 0 (0.0%) | 0 (0.0%) |
Disability Class: Vision Difficulty
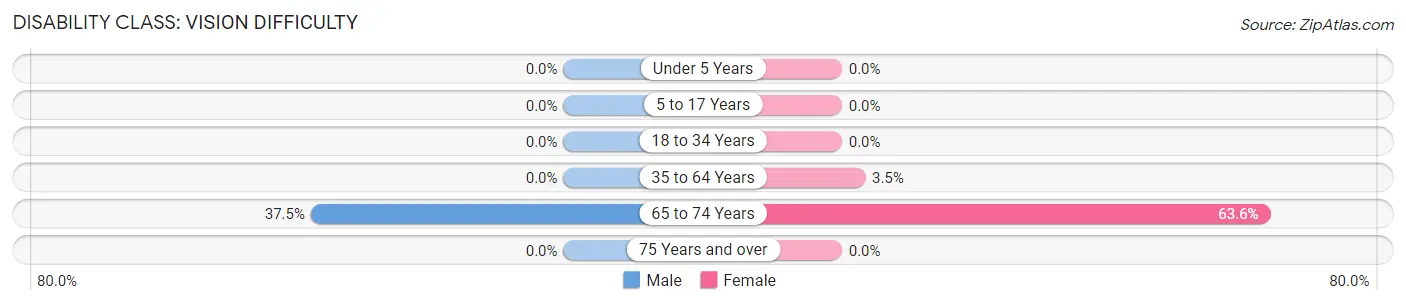
| Age Bracket | Male | Female |
| Under 5 Years | 0 (0.0%) | 0 (0.0%) |
| 5 to 17 Years | 0 (0.0%) | 0 (0.0%) |
| 18 to 34 Years | 0 (0.0%) | 0 (0.0%) |
| 35 to 64 Years | 0 (0.0%) | 1 (3.5%) |
| 65 to 74 Years | 6 (37.5%) | 21 (63.6%) |
| 75 Years and over | 0 (0.0%) | 0 (0.0%) |
Disability Class: Cognitive Difficulty
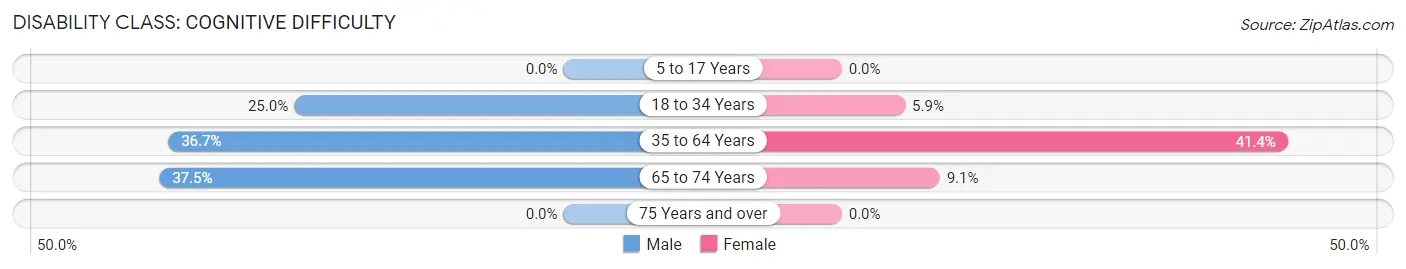
| Age Bracket | Male | Female |
| 5 to 17 Years | 0 (0.0%) | 0 (0.0%) |
| 18 to 34 Years | 2 (25.0%) | 1 (5.9%) |
| 35 to 64 Years | 11 (36.7%) | 12 (41.4%) |
| 65 to 74 Years | 6 (37.5%) | 3 (9.1%) |
| 75 Years and over | 0 (0.0%) | 0 (0.0%) |
Disability Class: Ambulatory Difficulty
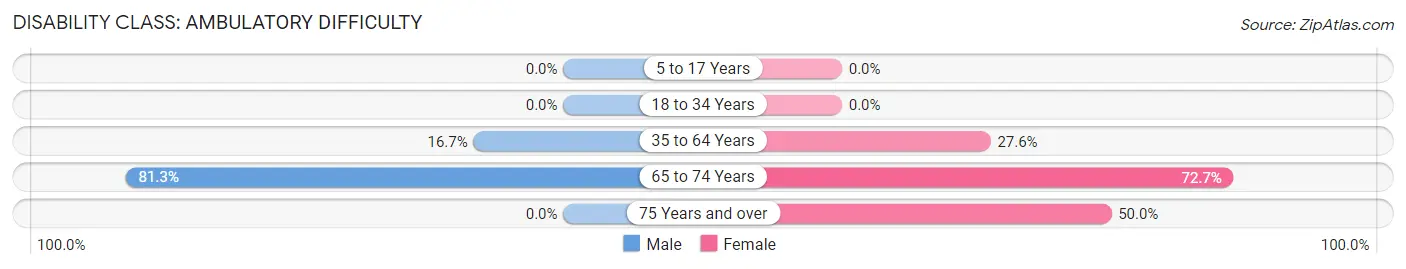
| Age Bracket | Male | Female |
| 5 to 17 Years | 0 (0.0%) | 0 (0.0%) |
| 18 to 34 Years | 0 (0.0%) | 0 (0.0%) |
| 35 to 64 Years | 5 (16.7%) | 8 (27.6%) |
| 65 to 74 Years | 13 (81.2%) | 24 (72.7%) |
| 75 Years and over | 0 (0.0%) | 1 (50.0%) |
Disability Class: Self-Care Difficulty
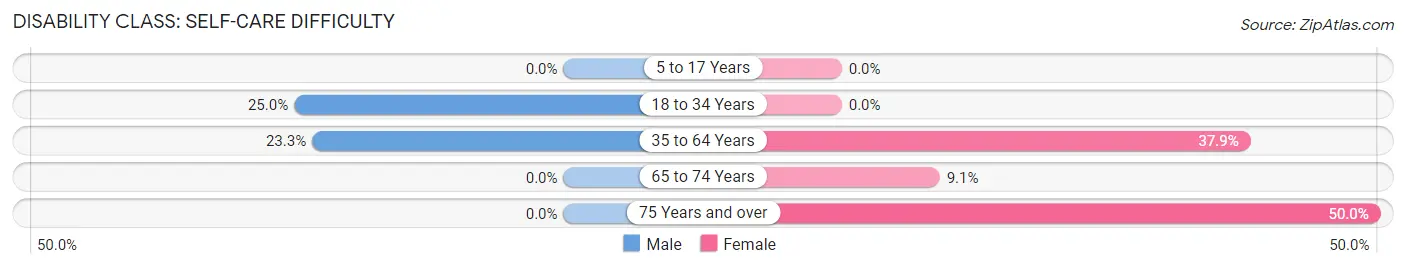
| Age Bracket | Male | Female |
| 5 to 17 Years | 0 (0.0%) | 0 (0.0%) |
| 18 to 34 Years | 2 (25.0%) | 0 (0.0%) |
| 35 to 64 Years | 7 (23.3%) | 11 (37.9%) |
| 65 to 74 Years | 0 (0.0%) | 3 (9.1%) |
| 75 Years and over | 0 (0.0%) | 1 (50.0%) |
Technology Access in Cloverdale
Computing Device Access in Cloverdale
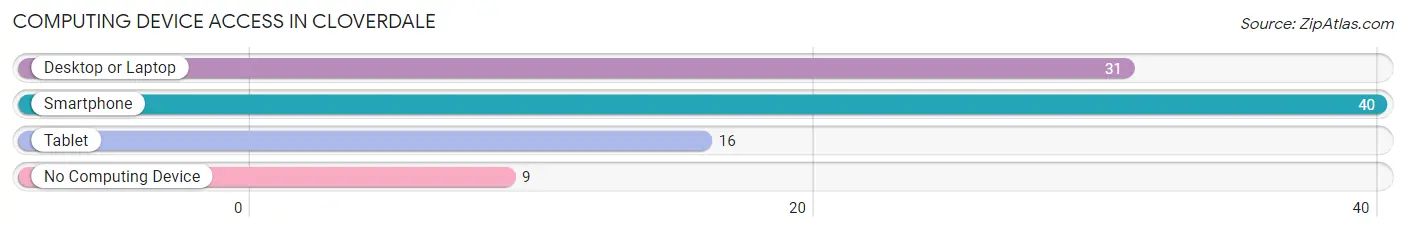
| Device Type | # Households | % Households |
| Desktop or Laptop | 31 | 56.4% |
| Smartphone | 40 | 72.7% |
| Tablet | 16 | 29.1% |
| No Computing Device | 9 | 16.4% |
| Total | 55 | 100.0% |
Internet Access in Cloverdale
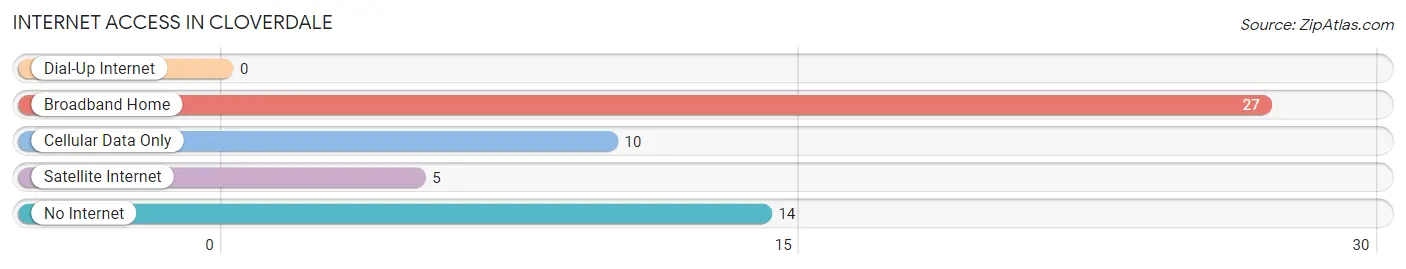
| Internet Type | # Households | % Households |
| Dial-Up Internet | 0 | 0.0% |
| Broadband Home | 27 | 49.1% |
| Cellular Data Only | 10 | 18.2% |
| Satellite Internet | 5 | 9.1% |
| No Internet | 14 | 25.5% |
| Total | 55 | 100.0% |
Cloverdale Summary
Cloverdale, Ohio is a small village located in the southeastern corner of the state, in the county of Belmont. It is situated on the Ohio River, just south of the city of Wheeling, West Virginia. The village has a population of just over 500 people, and is part of the Wheeling Metropolitan Statistical Area.
History
Cloverdale was first settled in 1817 by a group of settlers from Pennsylvania. The village was originally known as “Cloverdale” due to the abundance of clover in the area. The village was officially incorporated in 1837.
In the late 19th century, Cloverdale was a thriving industrial center, with several factories and mills located in the village. The most prominent of these was the Cloverdale Iron Works, which was established in 1872 and produced a variety of products, including stoves, boilers, and other iron products. The Iron Works was the largest employer in the village, and provided employment for many of the residents.
The village also had a thriving agricultural industry, with many of the residents working in the fields and orchards. The village was also home to several churches, including the First Presbyterian Church, which was established in 1837.
Geography
Cloverdale is located in the southeastern corner of Ohio, in Belmont County. It is situated on the Ohio River, just south of the city of Wheeling, West Virginia. The village is located in a rural area, and is surrounded by rolling hills and farmland. The village is located approximately 30 miles from the city of Pittsburgh, Pennsylvania.
The climate in Cloverdale is generally mild, with hot summers and cold winters. The average temperature in the summer is around 75 degrees Fahrenheit, and the average temperature in the winter is around 30 degrees Fahrenheit.
Economy
The economy of Cloverdale is largely based on agriculture and tourism. The village is home to several farms, which produce a variety of crops, including corn, soybeans, and wheat. The village also has several orchards, which produce apples, peaches, and other fruits.
The village is also home to several tourist attractions, including the Cloverdale Iron Works Museum, which showcases the history of the Iron Works, and the Cloverdale Historical Society, which offers tours of the village and its historic sites.
Demographics
As of the 2010 census, the population of Cloverdale was 514 people. The racial makeup of the village was 97.3% White, 0.6% African American, 0.2% Native American, 0.2% Asian, 0.2% from other races, and 1.6% from two or more races. Hispanic or Latino of any race were 0.6% of the population.
The median income for a household in the village was $37,500, and the median income for a family was $41,250. The per capita income for the village was $17,845. About 11.2% of families and 13.2% of the population were below the poverty line, including 16.7% of those under age 18 and 8.3% of those age 65 or over.
Common Questions
What is Per Capita Income in Cloverdale?
Per Capita income in Cloverdale is $25,815.
What is the Median Family Income in Cloverdale?
Median Family Income in Cloverdale is $80,000.
What is the Median Household income in Cloverdale?
Median Household Income in Cloverdale is $56,563.
What is Income or Wage Gap in Cloverdale?
Income or Wage Gap in Cloverdale is 62.4%.
Women in Cloverdale earn 37.6 cents for every dollar earned by a man.
What is Inequality or Gini Index in Cloverdale?
Inequality or Gini Index in Cloverdale is 0.46.
What is the Total Population of Cloverdale?
Total Population of Cloverdale is 148.
What is the Total Male Population of Cloverdale?
Total Male Population of Cloverdale is 57.
What is the Total Female Population of Cloverdale?
Total Female Population of Cloverdale is 91.
What is the Ratio of Males per 100 Females in Cloverdale?
There are 62.64 Males per 100 Females in Cloverdale.
What is the Ratio of Females per 100 Males in Cloverdale?
There are 159.65 Females per 100 Males in Cloverdale.
What is the Median Population Age in Cloverdale?
Median Population Age in Cloverdale is 50.5 Years.
What is the Average Family Size in Cloverdale
Average Family Size in Cloverdale is 2.2 People.
What is the Average Household Size in Cloverdale
Average Household Size in Cloverdale is 2.3 People.
How Large is the Labor Force in Cloverdale?
There are 56 People in the Labor Forcein in Cloverdale.
What is the Percentage of People in the Labor Force in Cloverdale?
39.7% of People are in the Labor Force in Cloverdale.