Springboro, OH Map & Demographics
Springboro Map
Springboro Overview
$46,606
PER CAPITA INCOME
$121,521
AVG FAMILY INCOME
$113,182
AVG HOUSEHOLD INCOME
45.2%
WAGE / INCOME GAP [ % ]
54.8¢/ $1
WAGE / INCOME GAP [ $ ]
0.37
INEQUALITY / GINI INDEX
19,218
TOTAL POPULATION
9,428
MALE POPULATION
9,790
FEMALE POPULATION
96.30
MALES / 100 FEMALES
103.84
FEMALES / 100 MALES
37.7
MEDIAN AGE
3.1
AVG FAMILY SIZE
2.8
AVG HOUSEHOLD SIZE
9,771
LABOR FORCE [ PEOPLE ]
66.8%
PERCENT IN LABOR FORCE
4.6%
UNEMPLOYMENT RATE
Springboro Zip Codes
Springboro Area Codes
Income in Springboro
Income Overview in Springboro
Per Capita Income in Springboro is $46,606, while median incomes of families and households are $121,521 and $113,182 respectively.
| Characteristic | Number | Measure |
| Per Capita Income | 19,218 | $46,606 |
| Median Family Income | 5,493 | $121,521 |
| Mean Family Income | 5,493 | $141,035 |
| Median Household Income | 6,750 | $113,182 |
| Mean Household Income | 6,750 | $130,569 |
| Income Deficit | 5,493 | $0 |
| Wage / Income Gap (%) | 19,218 | 45.19% |
| Wage / Income Gap ($) | 19,218 | 54.81¢ per $1 |
| Gini / Inequality Index | 19,218 | 0.37 |
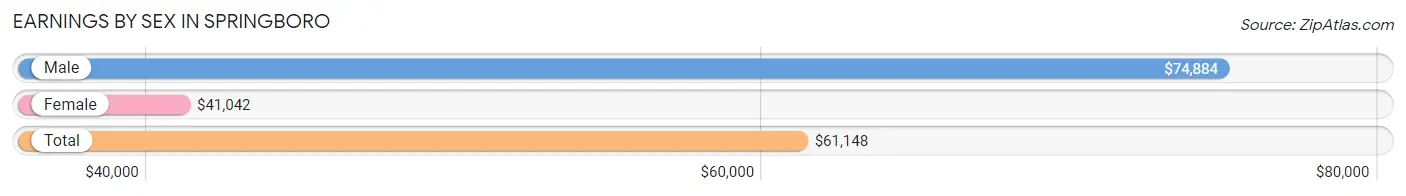
Earnings by Sex in Springboro
Average Earnings in Springboro are $61,148, $74,884 for men and $41,042 for women, a difference of 45.2%.
| Sex | Number | Average Earnings |
| Male | 5,099 (50.9%) | $74,884 |
| Female | 4,909 (49.0%) | $41,042 |
| Total | 10,008 (100.0%) | $61,148 |
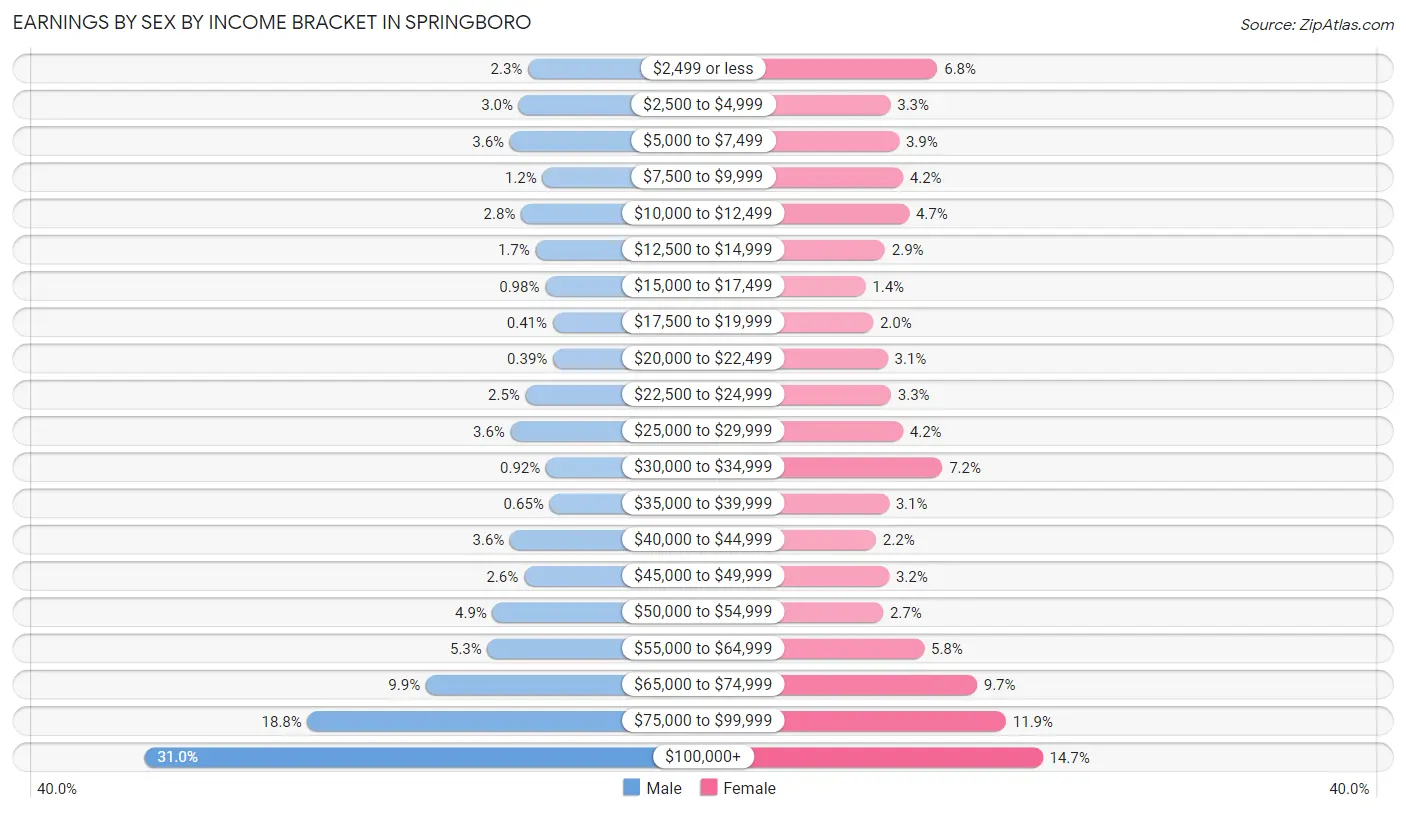
Earnings by Sex by Income Bracket in Springboro
The most common earnings brackets in Springboro are $100,000+ for men (1,581 | 31.0%) and $100,000+ for women (720 | 14.7%).
| Income | Male | Female |
| $2,499 or less | 115 (2.3%) | 333 (6.8%) |
| $2,500 to $4,999 | 151 (3.0%) | 160 (3.3%) |
| $5,000 to $7,499 | 185 (3.6%) | 192 (3.9%) |
| $7,500 to $9,999 | 60 (1.2%) | 206 (4.2%) |
| $10,000 to $12,499 | 142 (2.8%) | 229 (4.7%) |
| $12,500 to $14,999 | 87 (1.7%) | 140 (2.9%) |
| $15,000 to $17,499 | 50 (1.0%) | 68 (1.4%) |
| $17,500 to $19,999 | 21 (0.4%) | 96 (2.0%) |
| $20,000 to $22,499 | 20 (0.4%) | 150 (3.1%) |
| $22,500 to $24,999 | 125 (2.5%) | 162 (3.3%) |
| $25,000 to $29,999 | 182 (3.6%) | 206 (4.2%) |
| $30,000 to $34,999 | 47 (0.9%) | 351 (7.1%) |
| $35,000 to $39,999 | 33 (0.6%) | 154 (3.1%) |
| $40,000 to $44,999 | 184 (3.6%) | 107 (2.2%) |
| $45,000 to $49,999 | 131 (2.6%) | 155 (3.2%) |
| $50,000 to $54,999 | 251 (4.9%) | 133 (2.7%) |
| $55,000 to $64,999 | 270 (5.3%) | 284 (5.8%) |
| $65,000 to $74,999 | 506 (9.9%) | 478 (9.7%) |
| $75,000 to $99,999 | 958 (18.8%) | 585 (11.9%) |
| $100,000+ | 1,581 (31.0%) | 720 (14.7%) |
| Total | 5,099 (100.0%) | 4,909 (100.0%) |
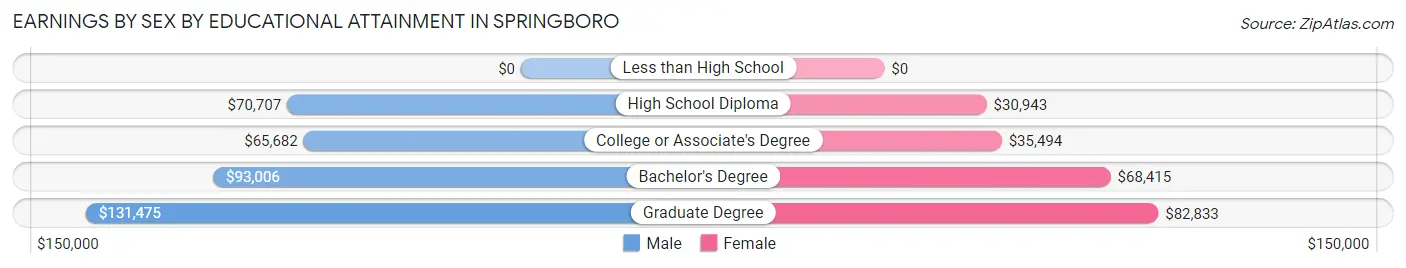
Earnings by Sex by Educational Attainment in Springboro
Average earnings in Springboro are $84,238 for men and $54,141 for women, a difference of 35.7%. Men with an educational attainment of graduate degree enjoy the highest average annual earnings of $131,475, while those with college or associate's degree education earn the least with $65,682. Women with an educational attainment of graduate degree earn the most with the average annual earnings of $82,833, while those with high school diploma education have the smallest earnings of $30,943.
| Educational Attainment | Male Income | Female Income |
| Less than High School | - | - |
| High School Diploma | $70,707 | $30,943 |
| College or Associate's Degree | $65,682 | $35,494 |
| Bachelor's Degree | $93,006 | $68,415 |
| Graduate Degree | $131,475 | $82,833 |
| Total | $84,238 | $54,141 |
Family Income in Springboro
Family Income Brackets in Springboro
According to the Springboro family income data, there are 1,445 families falling into the $100,000 to $149,999 income range, which is the most common income bracket and makes up 26.3% of all families. Conversely, the $10,000 to $14,999 income bracket is the least frequent group with only 22 families (0.4%) belonging to this category.
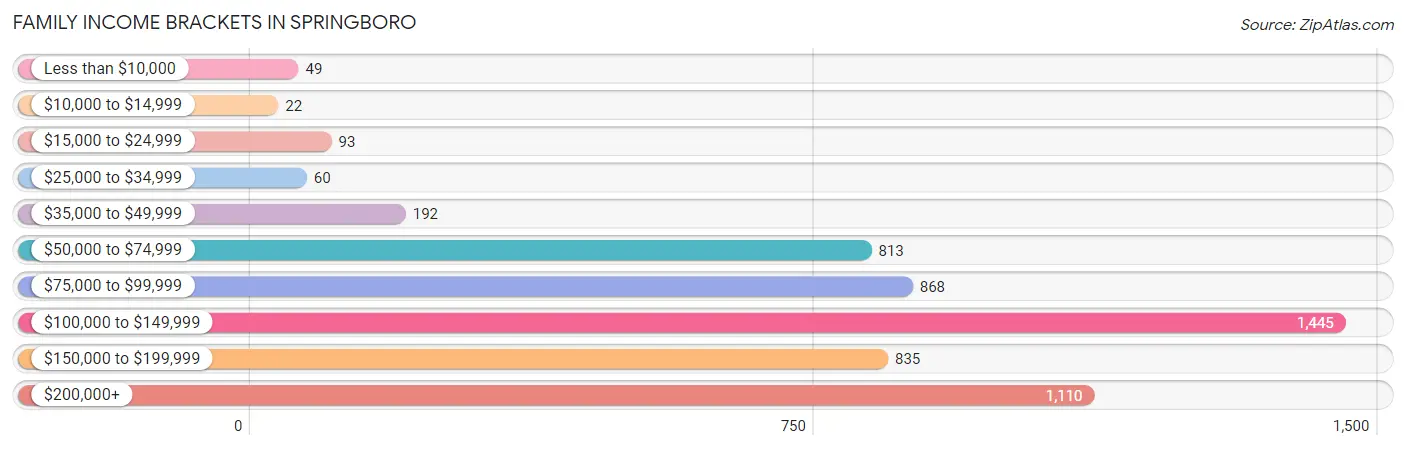
| Income Bracket | # Families | % Families |
| Less than $10,000 | 49 | 0.9% |
| $10,000 to $14,999 | 22 | 0.4% |
| $15,000 to $24,999 | 93 | 1.7% |
| $25,000 to $34,999 | 60 | 1.1% |
| $35,000 to $49,999 | 192 | 3.5% |
| $50,000 to $74,999 | 813 | 14.8% |
| $75,000 to $99,999 | 868 | 15.8% |
| $100,000 to $149,999 | 1,445 | 26.3% |
| $150,000 to $199,999 | 835 | 15.2% |
| $200,000+ | 1,110 | 20.2% |
Family Income by Famaliy Size in Springboro
5-person families (658 | 12.0%) account for the highest median family income in Springboro with $165,714 per family, while 3-person families (896 | 16.3%) have the highest median income of $48,563 per family member.
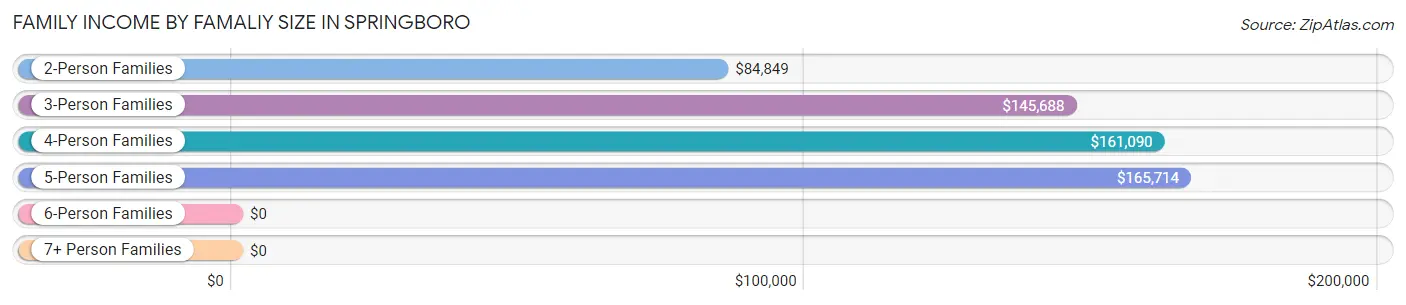
| Income Bracket | # Families | Median Income |
| 2-Person Families | 2,594 (47.2%) | $84,849 |
| 3-Person Families | 896 (16.3%) | $145,688 |
| 4-Person Families | 1,238 (22.5%) | $161,090 |
| 5-Person Families | 658 (12.0%) | $165,714 |
| 6-Person Families | 89 (1.6%) | $0 |
| 7+ Person Families | 18 (0.3%) | $0 |
| Total | 5,493 (100.0%) | $121,521 |
Family Income by Number of Earners in Springboro
The median family income in Springboro is $121,521, with families comprising 3+ earners (662) having the highest median family income of $173,095, while families with no earners (914) have the lowest median family income of $62,972, accounting for 12.0% and 16.6% of families, respectively.
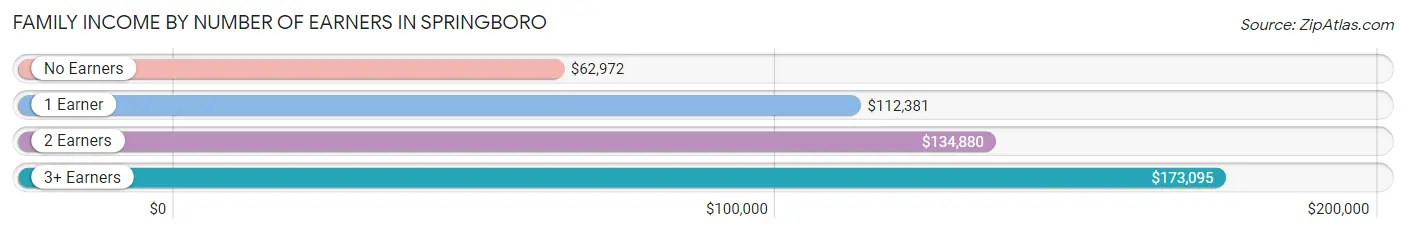
| Number of Earners | # Families | Median Income |
| No Earners | 914 (16.6%) | $62,972 |
| 1 Earner | 1,390 (25.3%) | $112,381 |
| 2 Earners | 2,527 (46.0%) | $134,880 |
| 3+ Earners | 662 (12.0%) | $173,095 |
| Total | 5,493 (100.0%) | $121,521 |
Household Income in Springboro
Household Income Brackets in Springboro
With 1,694 households falling in the category, the $100,000 to $149,999 income range is the most frequent in Springboro, accounting for 25.1% of all households. In contrast, only 47 households (0.7%) fall into the $10,000 to $14,999 income bracket, making it the least populous group.
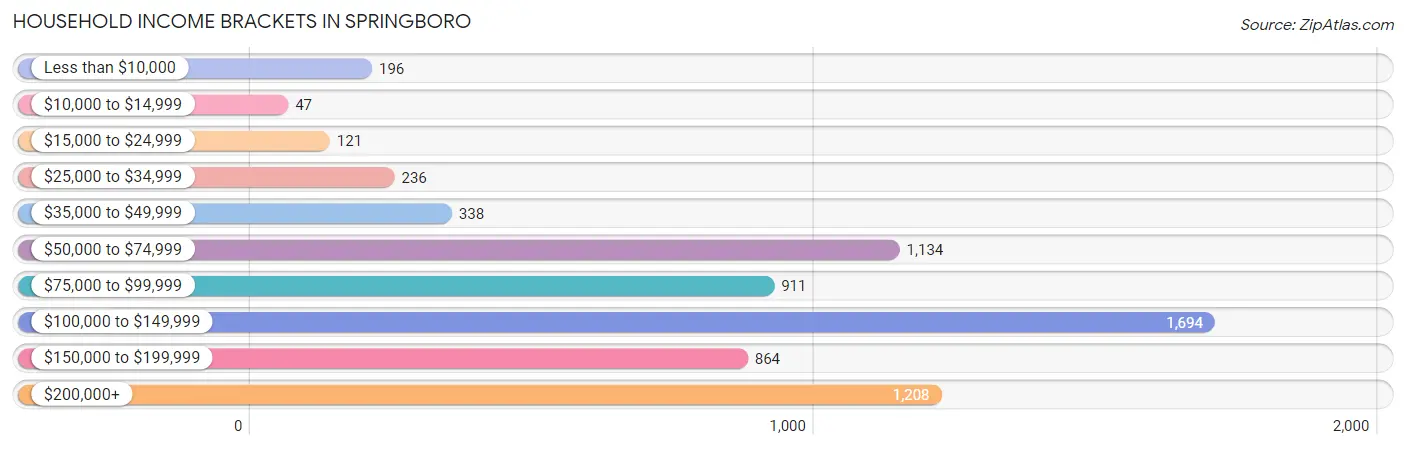
| Income Bracket | # Households | % Households |
| Less than $10,000 | 196 | 2.9% |
| $10,000 to $14,999 | 47 | 0.7% |
| $15,000 to $24,999 | 121 | 1.8% |
| $25,000 to $34,999 | 236 | 3.5% |
| $35,000 to $49,999 | 338 | 5.0% |
| $50,000 to $74,999 | 1,134 | 16.8% |
| $75,000 to $99,999 | 911 | 13.5% |
| $100,000 to $149,999 | 1,694 | 25.1% |
| $150,000 to $199,999 | 864 | 12.8% |
| $200,000+ | 1,208 | 17.9% |
Household Income by Householder Age in Springboro
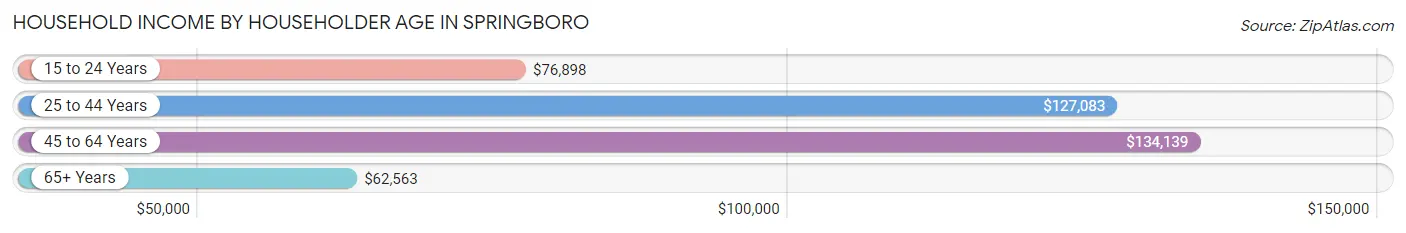
The median household income in Springboro is $113,182, with the highest median household income of $134,139 found in the 45 to 64 years age bracket for the primary householder. A total of 2,712 households (40.2%) fall into this category. Meanwhile, the 65+ years age bracket for the primary householder has the lowest median household income of $62,563, with 1,831 households (27.1%) in this group.
| Income Bracket | # Households | Median Income |
| 15 to 24 Years | 191 (2.8%) | $76,898 |
| 25 to 44 Years | 2,016 (29.9%) | $127,083 |
| 45 to 64 Years | 2,712 (40.2%) | $134,139 |
| 65+ Years | 1,831 (27.1%) | $62,563 |
| Total | 6,750 (100.0%) | $113,182 |
Poverty in Springboro
Income Below Poverty by Sex and Age in Springboro
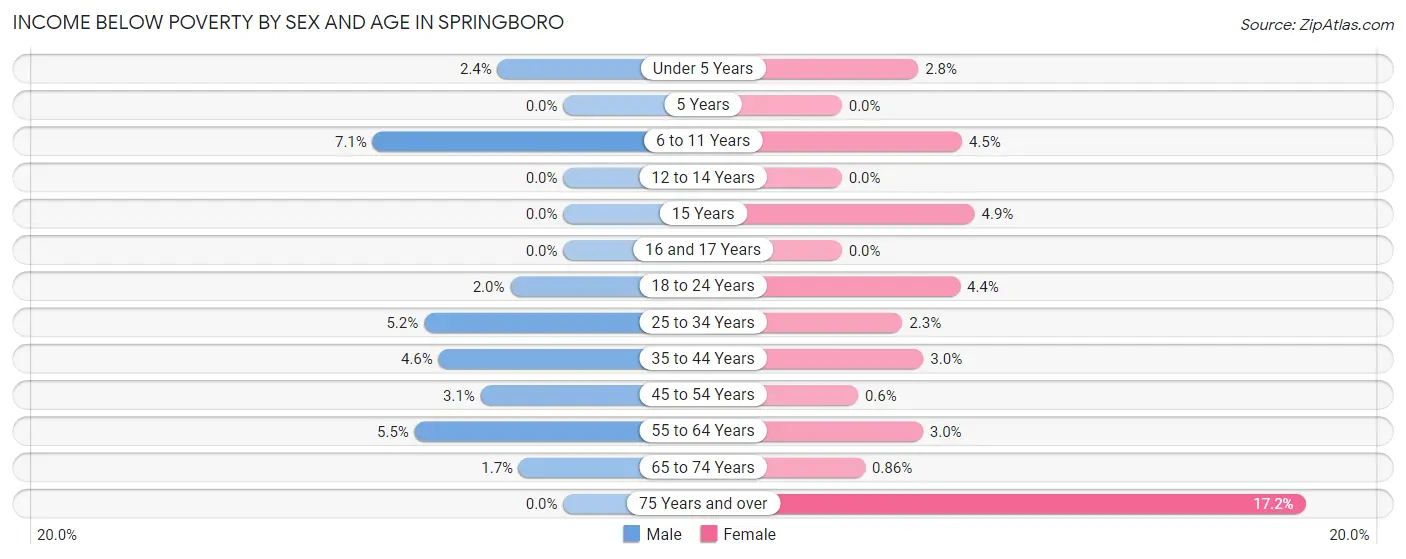
With 3.3% poverty level for males and 3.3% for females among the residents of Springboro, 6 to 11 year old males and 75 year old and over females are the most vulnerable to poverty, with 56 males (7.1%) and 106 females (17.2%) in their respective age groups living below the poverty level.
| Age Bracket | Male | Female |
| Under 5 Years | 15 (2.4%) | 22 (2.8%) |
| 5 Years | 0 (0.0%) | 0 (0.0%) |
| 6 to 11 Years | 56 (7.1%) | 37 (4.5%) |
| 12 to 14 Years | 0 (0.0%) | 0 (0.0%) |
| 15 Years | 0 (0.0%) | 10 (4.9%) |
| 16 and 17 Years | 0 (0.0%) | 0 (0.0%) |
| 18 to 24 Years | 14 (2.0%) | 30 (4.4%) |
| 25 to 34 Years | 46 (5.2%) | 24 (2.2%) |
| 35 to 44 Years | 57 (4.6%) | 40 (3.0%) |
| 45 to 54 Years | 45 (3.1%) | 8 (0.6%) |
| 55 to 64 Years | 54 (5.5%) | 30 (3.0%) |
| 65 to 74 Years | 18 (1.7%) | 9 (0.9%) |
| 75 Years and over | 0 (0.0%) | 106 (17.2%) |
| Total | 305 (3.3%) | 316 (3.3%) |
Income Above Poverty by Sex and Age in Springboro
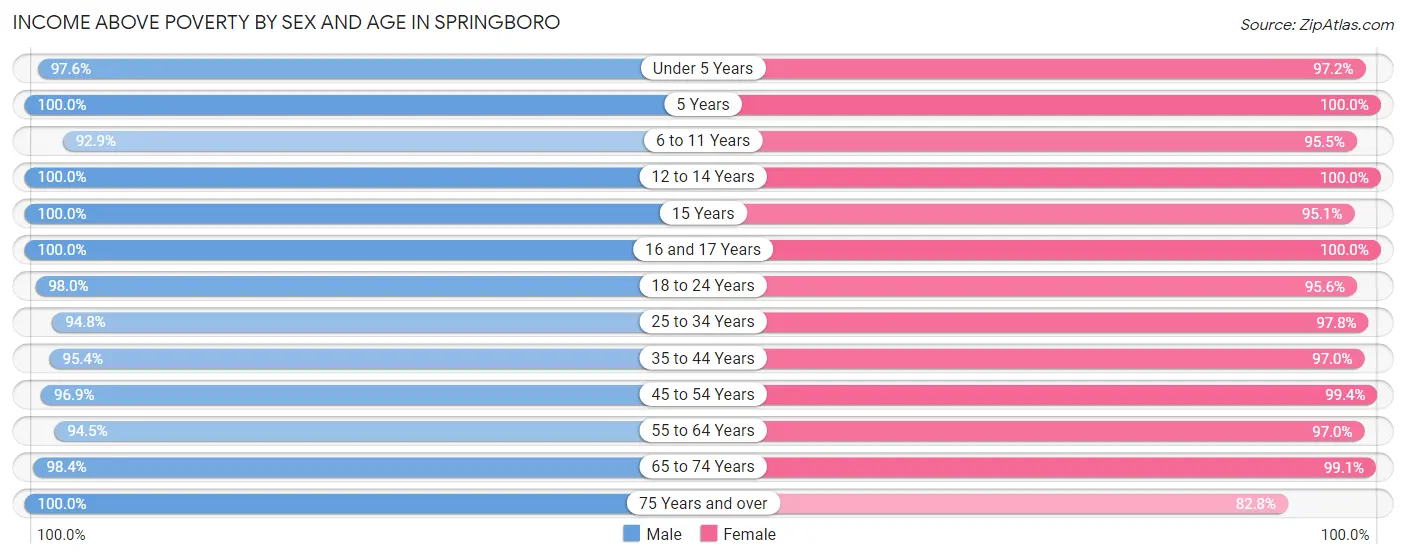
According to the poverty statistics in Springboro, males aged 5 years and females aged 5 years are the age groups that are most secure financially, with 100.0% of males and 100.0% of females in these age groups living above the poverty line.
| Age Bracket | Male | Female |
| Under 5 Years | 599 (97.6%) | 754 (97.2%) |
| 5 Years | 130 (100.0%) | 67 (100.0%) |
| 6 to 11 Years | 735 (92.9%) | 793 (95.5%) |
| 12 to 14 Years | 592 (100.0%) | 450 (100.0%) |
| 15 Years | 95 (100.0%) | 193 (95.1%) |
| 16 and 17 Years | 473 (100.0%) | 304 (100.0%) |
| 18 to 24 Years | 696 (98.0%) | 654 (95.6%) |
| 25 to 34 Years | 844 (94.8%) | 1,045 (97.8%) |
| 35 to 44 Years | 1,174 (95.4%) | 1,280 (97.0%) |
| 45 to 54 Years | 1,419 (96.9%) | 1,319 (99.4%) |
| 55 to 64 Years | 925 (94.5%) | 966 (97.0%) |
| 65 to 74 Years | 1,076 (98.4%) | 1,043 (99.1%) |
| 75 Years and over | 296 (100.0%) | 510 (82.8%) |
| Total | 9,054 (96.7%) | 9,378 (96.7%) |
Income Below Poverty Among Married-Couple Families in Springboro
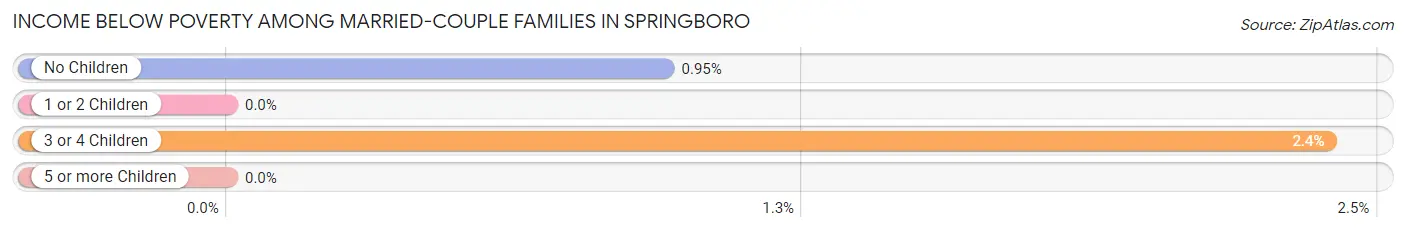
The poverty statistics for married-couple families in Springboro show that 0.7% or 35 of the total 4,691 families live below the poverty line. Families with 3 or 4 children have the highest poverty rate of 2.4%, comprising of 12 families. On the other hand, families with 1 or 2 children have the lowest poverty rate of 0.0%, which includes 0 families.
| Children | Above Poverty | Below Poverty |
| No Children | 2,400 (99.1%) | 23 (0.9%) |
| 1 or 2 Children | 1,752 (100.0%) | 0 (0.0%) |
| 3 or 4 Children | 491 (97.6%) | 12 (2.4%) |
| 5 or more Children | 13 (100.0%) | 0 (0.0%) |
| Total | 4,656 (99.3%) | 35 (0.7%) |
Income Below Poverty Among Single-Parent Households in Springboro
According to the poverty data in Springboro, 13.5% or 23 single-father households and 9.7% or 61 single-mother households are living below the poverty line. Among single-father households, those with no children have the highest poverty rate, with 23 households (25.3%) experiencing poverty. Likewise, among single-mother households, those with no children have the highest poverty rate, with 21 households (11.8%) falling below the poverty line.
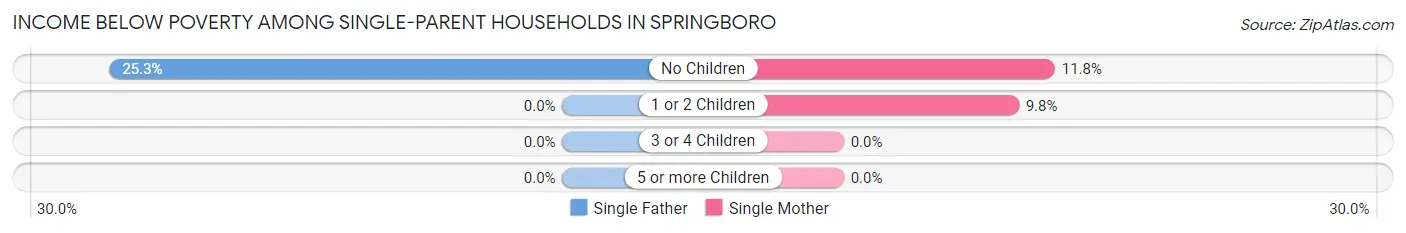
| Children | Single Father | Single Mother |
| No Children | 23 (25.3%) | 21 (11.8%) |
| 1 or 2 Children | 0 (0.0%) | 40 (9.8%) |
| 3 or 4 Children | 0 (0.0%) | 0 (0.0%) |
| 5 or more Children | 0 (0.0%) | 0 (0.0%) |
| Total | 23 (13.5%) | 61 (9.7%) |
Income Below Poverty Among Married-Couple vs Single-Parent Households in Springboro
The poverty data for Springboro shows that 35 of the married-couple family households (0.7%) and 84 of the single-parent households (10.5%) are living below the poverty level. Within the married-couple family households, those with 3 or 4 children have the highest poverty rate, with 12 households (2.4%) falling below the poverty line. Among the single-parent households, those with no children have the highest poverty rate, with 44 household (16.4%) living below poverty.
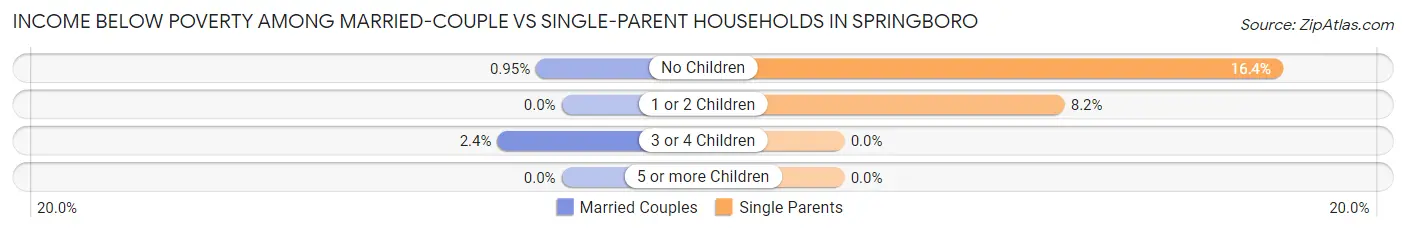
| Children | Married-Couple Families | Single-Parent Households |
| No Children | 23 (0.9%) | 44 (16.4%) |
| 1 or 2 Children | 0 (0.0%) | 40 (8.2%) |
| 3 or 4 Children | 12 (2.4%) | 0 (0.0%) |
| 5 or more Children | 0 (0.0%) | 0 (0.0%) |
| Total | 35 (0.7%) | 84 (10.5%) |
Race in Springboro
The most populous races in Springboro are White / Caucasian (17,448 | 90.8%), Two or more Races (725 | 3.8%), and Hispanic or Latino (552 | 2.9%).
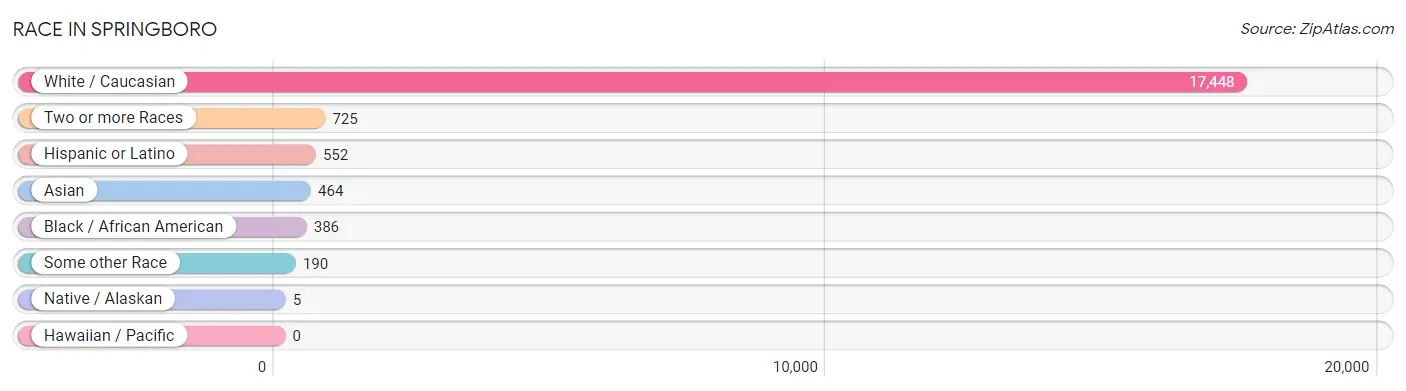
| Race | # Population | % Population |
| Asian | 464 | 2.4% |
| Black / African American | 386 | 2.0% |
| Hawaiian / Pacific | 0 | 0.0% |
| Hispanic or Latino | 552 | 2.9% |
| Native / Alaskan | 5 | 0.0% |
| White / Caucasian | 17,448 | 90.8% |
| Two or more Races | 725 | 3.8% |
| Some other Race | 190 | 1.0% |
| Total | 19,218 | 100.0% |
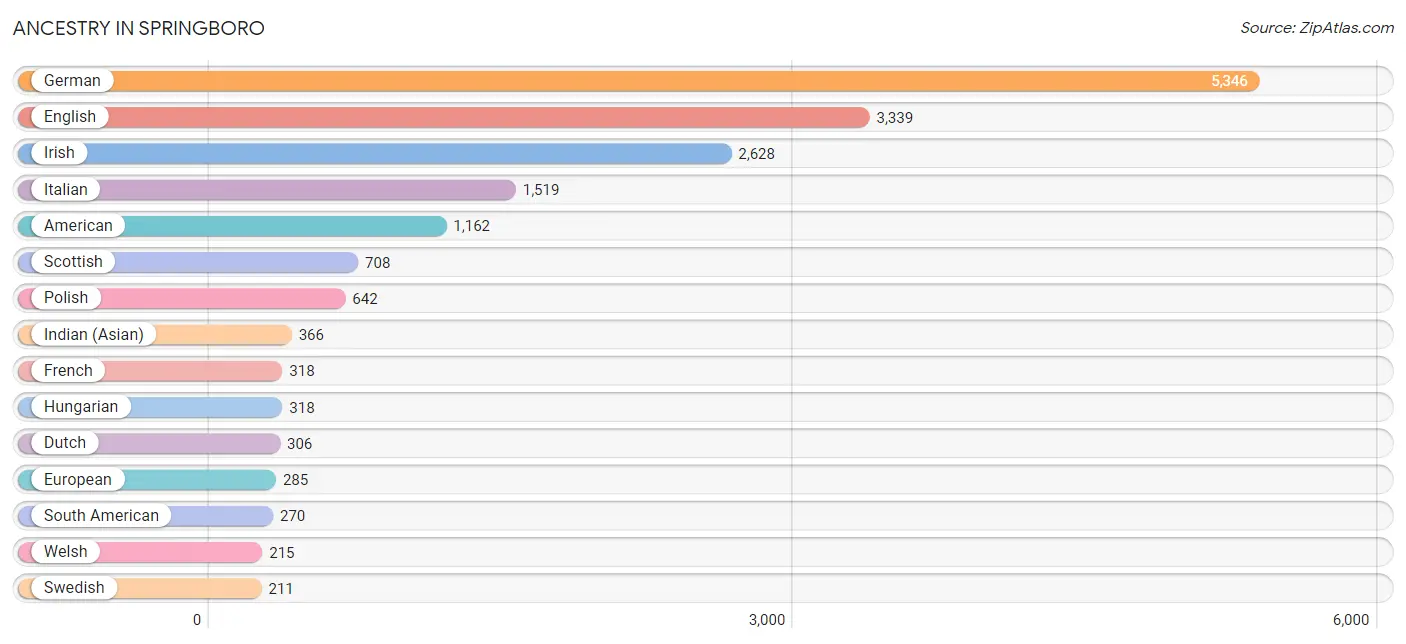
Ancestry in Springboro
The most populous ancestries reported in Springboro are German (5,346 | 27.8%), English (3,339 | 17.4%), Irish (2,628 | 13.7%), Italian (1,519 | 7.9%), and American (1,162 | 6.0%), together accounting for 72.8% of all Springboro residents.
| Ancestry | # Population | % Population |
| American | 1,162 | 6.0% |
| Arab | 11 | 0.1% |
| Armenian | 25 | 0.1% |
| Austrian | 122 | 0.6% |
| Bhutanese | 37 | 0.2% |
| Blackfeet | 7 | 0.0% |
| Brazilian | 44 | 0.2% |
| British | 154 | 0.8% |
| Canadian | 11 | 0.1% |
| Cherokee | 12 | 0.1% |
| Chilean | 14 | 0.1% |
| Colombian | 19 | 0.1% |
| Cuban | 17 | 0.1% |
| Czech | 123 | 0.6% |
| Danish | 26 | 0.1% |
| Dutch | 306 | 1.6% |
| Eastern European | 40 | 0.2% |
| Ecuadorian | 92 | 0.5% |
| English | 3,339 | 17.4% |
| European | 285 | 1.5% |
| French | 318 | 1.7% |
| French Canadian | 28 | 0.2% |
| German | 5,346 | 27.8% |
| Greek | 192 | 1.0% |
| Haitian | 14 | 0.1% |
| Hungarian | 318 | 1.7% |
| Indian (Asian) | 366 | 1.9% |
| Iranian | 98 | 0.5% |
| Irish | 2,628 | 13.7% |
| Iroquois | 13 | 0.1% |
| Italian | 1,519 | 7.9% |
| Jamaican | 37 | 0.2% |
| Japanese | 19 | 0.1% |
| Korean | 109 | 0.6% |
| Lebanese | 11 | 0.1% |
| Lithuanian | 15 | 0.1% |
| Mexican | 69 | 0.4% |
| Norwegian | 89 | 0.5% |
| Peruvian | 98 | 0.5% |
| Polish | 642 | 3.3% |
| Puerto Rican | 122 | 0.6% |
| Russian | 11 | 0.1% |
| Scandinavian | 95 | 0.5% |
| Scotch-Irish | 118 | 0.6% |
| Scottish | 708 | 3.7% |
| Slovak | 56 | 0.3% |
| South American | 270 | 1.4% |
| Spaniard | 27 | 0.1% |
| Sri Lankan | 36 | 0.2% |
| Swedish | 211 | 1.1% |
| Swiss | 18 | 0.1% |
| Thai | 200 | 1.0% |
| Ukrainian | 38 | 0.2% |
| Venezuelan | 47 | 0.2% |
| Welsh | 215 | 1.1% | View All 55 Rows |
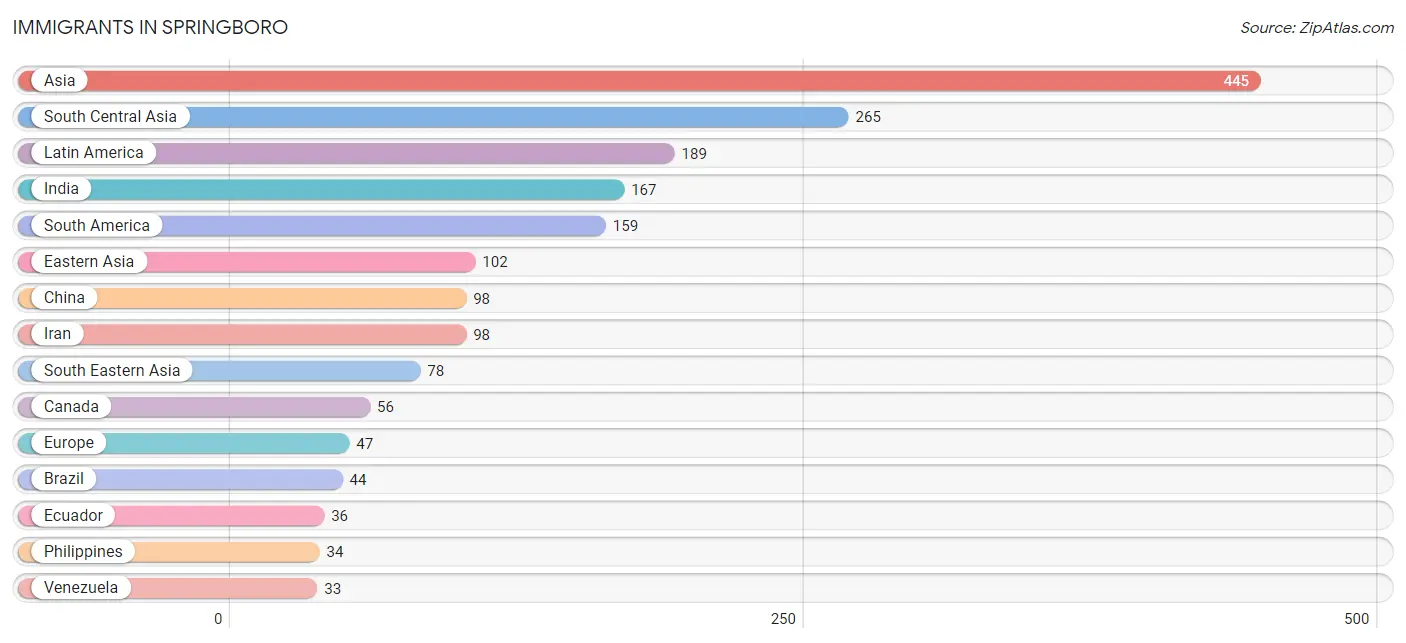
Immigrants in Springboro
The most numerous immigrant groups reported in Springboro came from Asia (445 | 2.3%), South Central Asia (265 | 1.4%), Latin America (189 | 1.0%), India (167 | 0.9%), and South America (159 | 0.8%), together accounting for 6.4% of all Springboro residents.
| Immigration Origin | # Population | % Population |
| Asia | 445 | 2.3% |
| Brazil | 44 | 0.2% |
| Cambodia | 19 | 0.1% |
| Canada | 56 | 0.3% |
| Caribbean | 30 | 0.2% |
| Chile | 14 | 0.1% |
| China | 98 | 0.5% |
| Colombia | 13 | 0.1% |
| Eastern Asia | 102 | 0.5% |
| Eastern Europe | 31 | 0.2% |
| Ecuador | 36 | 0.2% |
| Europe | 47 | 0.2% |
| Greece | 10 | 0.1% |
| Hungary | 10 | 0.1% |
| India | 167 | 0.9% |
| Iran | 98 | 0.5% |
| Jamaica | 30 | 0.2% |
| Japan | 4 | 0.0% |
| Latin America | 189 | 1.0% |
| Northern Europe | 6 | 0.0% |
| Peru | 19 | 0.1% |
| Philippines | 34 | 0.2% |
| Russia | 11 | 0.1% |
| South America | 159 | 0.8% |
| South Central Asia | 265 | 1.4% |
| South Eastern Asia | 78 | 0.4% |
| Southern Europe | 10 | 0.1% |
| Ukraine | 10 | 0.1% |
| Venezuela | 33 | 0.2% |
| Vietnam | 25 | 0.1% | View All 30 Rows |
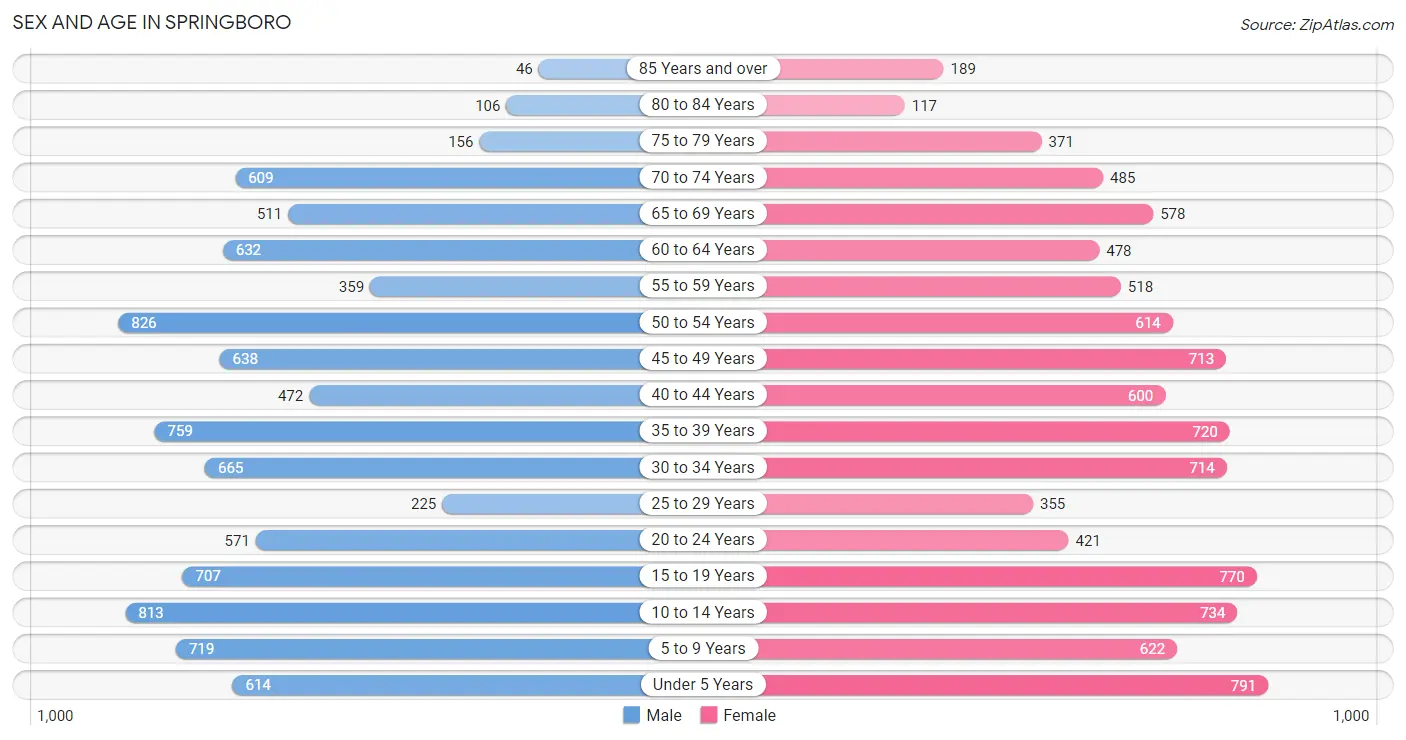
Sex and Age in Springboro
Sex and Age in Springboro
The most populous age groups in Springboro are 50 to 54 Years (826 | 8.8%) for men and Under 5 Years (791 | 8.1%) for women.
| Age Bracket | Male | Female |
| Under 5 Years | 614 (6.5%) | 791 (8.1%) |
| 5 to 9 Years | 719 (7.6%) | 622 (6.4%) |
| 10 to 14 Years | 813 (8.6%) | 734 (7.5%) |
| 15 to 19 Years | 707 (7.5%) | 770 (7.9%) |
| 20 to 24 Years | 571 (6.1%) | 421 (4.3%) |
| 25 to 29 Years | 225 (2.4%) | 355 (3.6%) |
| 30 to 34 Years | 665 (7.0%) | 714 (7.3%) |
| 35 to 39 Years | 759 (8.1%) | 720 (7.3%) |
| 40 to 44 Years | 472 (5.0%) | 600 (6.1%) |
| 45 to 49 Years | 638 (6.8%) | 713 (7.3%) |
| 50 to 54 Years | 826 (8.8%) | 614 (6.3%) |
| 55 to 59 Years | 359 (3.8%) | 518 (5.3%) |
| 60 to 64 Years | 632 (6.7%) | 478 (4.9%) |
| 65 to 69 Years | 511 (5.4%) | 578 (5.9%) |
| 70 to 74 Years | 609 (6.5%) | 485 (5.0%) |
| 75 to 79 Years | 156 (1.7%) | 371 (3.8%) |
| 80 to 84 Years | 106 (1.1%) | 117 (1.2%) |
| 85 Years and over | 46 (0.5%) | 189 (1.9%) |
| Total | 9,428 (100.0%) | 9,790 (100.0%) |
Families and Households in Springboro
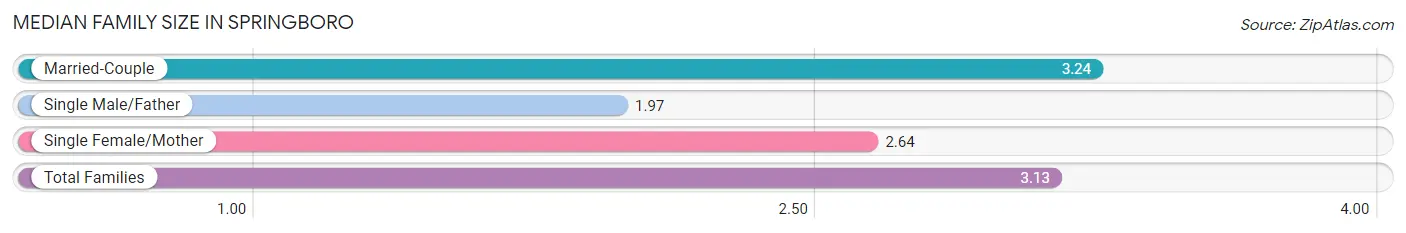
Median Family Size in Springboro
The median family size in Springboro is 3.13 persons per family, with married-couple families (4,691 | 85.4%) accounting for the largest median family size of 3.24 persons per family. On the other hand, single male/father families (170 | 3.1%) represent the smallest median family size with 1.97 persons per family.
| Family Type | # Families | Family Size |
| Married-Couple | 4,691 (85.4%) | 3.24 |
| Single Male/Father | 170 (3.1%) | 1.97 |
| Single Female/Mother | 632 (11.5%) | 2.64 |
| Total Families | 5,493 (100.0%) | 3.13 |
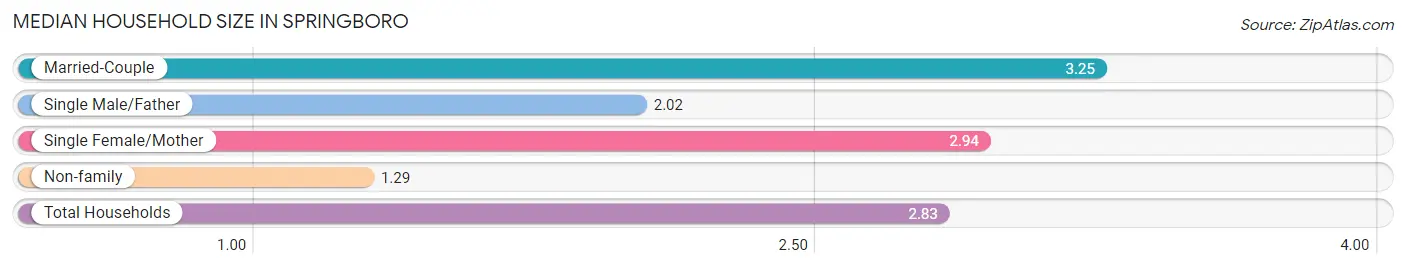
Median Household Size in Springboro
The median household size in Springboro is 2.83 persons per household, with married-couple households (4,691 | 69.5%) accounting for the largest median household size of 3.25 persons per household. non-family households (1,257 | 18.6%) represent the smallest median household size with 1.29 persons per household.
| Household Type | # Households | Household Size |
| Married-Couple | 4,691 (69.5%) | 3.25 |
| Single Male/Father | 170 (2.5%) | 2.02 |
| Single Female/Mother | 632 (9.4%) | 2.94 |
| Non-family | 1,257 (18.6%) | 1.29 |
| Total Households | 6,750 (100.0%) | 2.83 |
Household Size by Marriage Status in Springboro
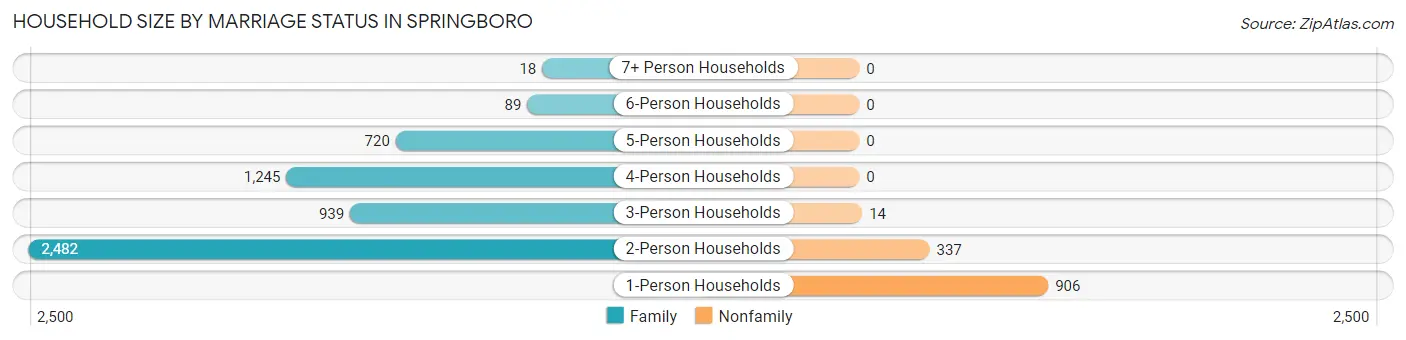
Out of a total of 6,750 households in Springboro, 5,493 (81.4%) are family households, while 1,257 (18.6%) are nonfamily households. The most numerous type of family households are 2-person households, comprising 2,482, and the most common type of nonfamily households are 1-person households, comprising 906.
| Household Size | Family Households | Nonfamily Households |
| 1-Person Households | - | 906 (13.4%) |
| 2-Person Households | 2,482 (36.8%) | 337 (5.0%) |
| 3-Person Households | 939 (13.9%) | 14 (0.2%) |
| 4-Person Households | 1,245 (18.4%) | 0 (0.0%) |
| 5-Person Households | 720 (10.7%) | 0 (0.0%) |
| 6-Person Households | 89 (1.3%) | 0 (0.0%) |
| 7+ Person Households | 18 (0.3%) | 0 (0.0%) |
| Total | 5,493 (81.4%) | 1,257 (18.6%) |
Female Fertility in Springboro
Fertility by Age in Springboro
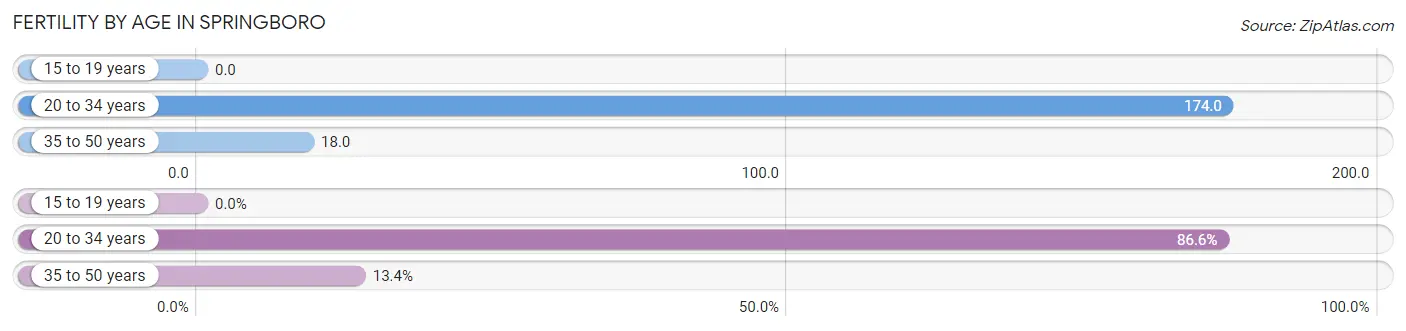
Average fertility rate in Springboro is 68.0 births per 1,000 women. Women in the age bracket of 20 to 34 years have the highest fertility rate with 174.0 births per 1,000 women. Women in the age bracket of 20 to 34 years acount for 86.6% of all women with births.
| Age Bracket | Women with Births | Births / 1,000 Women |
| 15 to 19 years | 0 (0.0%) | 0.0 |
| 20 to 34 years | 259 (86.6%) | 174.0 |
| 35 to 50 years | 40 (13.4%) | 18.0 |
| Total | 299 (100.0%) | 68.0 |
Fertility by Age by Marriage Status in Springboro
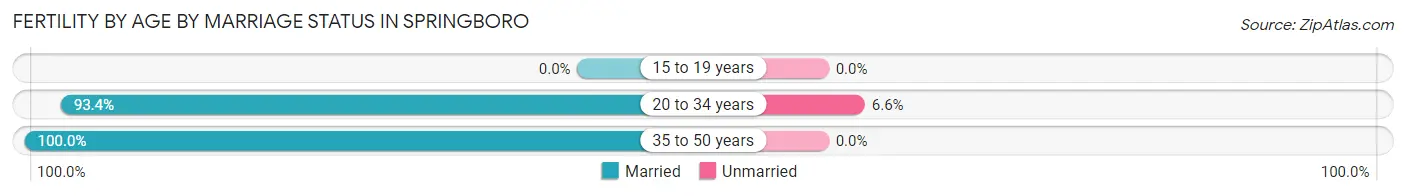
94.3% of women with births (299) in Springboro are married. The highest percentage of unmarried women with births falls into 20 to 34 years age bracket with 6.6% of them unmarried at the time of birth, while the lowest percentage of unmarried women with births belong to 35 to 50 years age bracket with 0.0% of them unmarried.
| Age Bracket | Married | Unmarried |
| 15 to 19 years | 0 (0.0%) | 0 (0.0%) |
| 20 to 34 years | 242 (93.4%) | 17 (6.6%) |
| 35 to 50 years | 40 (100.0%) | 0 (0.0%) |
| Total | 282 (94.3%) | 17 (5.7%) |
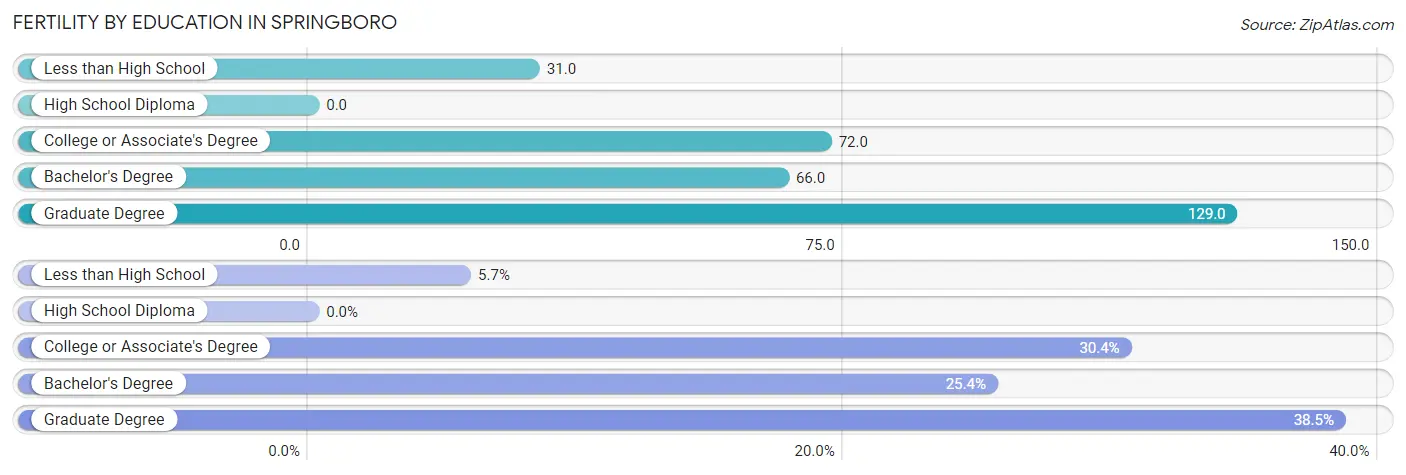
Fertility by Education in Springboro
| Educational Attainment | Women with Births | Births / 1,000 Women |
| Less than High School | 17 (5.7%) | 31.0 |
| High School Diploma | 0 (0.0%) | 0.0 |
| College or Associate's Degree | 91 (30.4%) | 72.0 |
| Bachelor's Degree | 76 (25.4%) | 66.0 |
| Graduate Degree | 115 (38.5%) | 129.0 |
| Total | 299 (100.0%) | 68.0 |
Fertility by Education by Marriage Status in Springboro
5.7% of women with births in Springboro are unmarried. Women with the educational attainment of college or associate's degree are most likely to be married with 100.0% of them married at childbirth, while women with the educational attainment of less than high school are least likely to be married with 100.0% of them unmarried at childbirth.
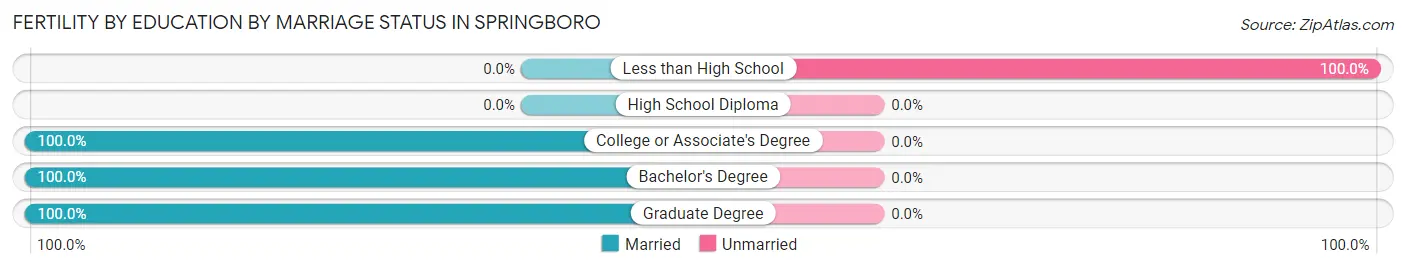
| Educational Attainment | Married | Unmarried |
| Less than High School | 0 (0.0%) | 17 (100.0%) |
| High School Diploma | 0 (0.0%) | 0 (0.0%) |
| College or Associate's Degree | 91 (100.0%) | 0 (0.0%) |
| Bachelor's Degree | 76 (100.0%) | 0 (0.0%) |
| Graduate Degree | 115 (100.0%) | 0 (0.0%) |
| Total | 282 (94.3%) | 17 (5.7%) |
Employment Characteristics in Springboro
Employment by Class of Employer in Springboro
Among the 9,230 employed individuals in Springboro, private company employees (6,192 | 67.1%), not-for-profit organizations (775 | 8.4%), and local government employees (701 | 7.6%) make up the most common classes of employment.
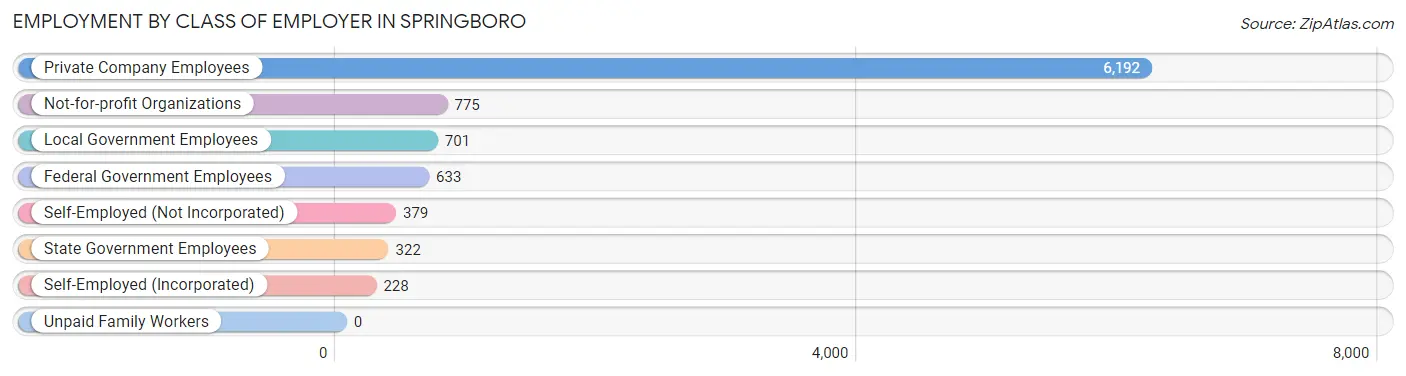
| Employer Class | # Employees | % Employees |
| Private Company Employees | 6,192 | 67.1% |
| Self-Employed (Incorporated) | 228 | 2.5% |
| Self-Employed (Not Incorporated) | 379 | 4.1% |
| Not-for-profit Organizations | 775 | 8.4% |
| Local Government Employees | 701 | 7.6% |
| State Government Employees | 322 | 3.5% |
| Federal Government Employees | 633 | 6.9% |
| Unpaid Family Workers | 0 | 0.0% |
| Total | 9,230 | 100.0% |
Employment Status by Age in Springboro
According to the labor force statistics for Springboro, out of the total population over 16 years of age (14,627), 66.8% or 9,771 individuals are in the labor force, with 4.6% or 449 of them unemployed. The age group with the highest labor force participation rate is 25 to 29 years, with 100.0% or 580 individuals in the labor force. Within the labor force, the 16 to 19 years age range has the highest percentage of unemployed individuals, with 17.9% or 111 of them being unemployed.
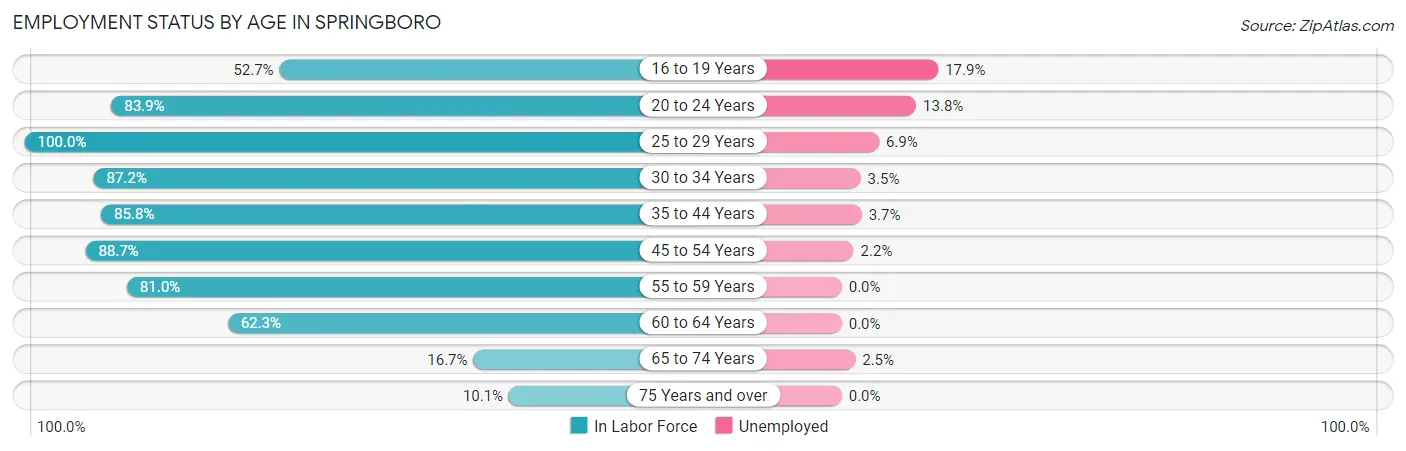
| Age Bracket | In Labor Force | Unemployed |
| 16 to 19 Years | 621 (52.7%) | 111 (17.9%) |
| 20 to 24 Years | 832 (83.9%) | 115 (13.8%) |
| 25 to 29 Years | 580 (100.0%) | 40 (6.9%) |
| 30 to 34 Years | 1,202 (87.2%) | 42 (3.5%) |
| 35 to 44 Years | 2,189 (85.8%) | 81 (3.7%) |
| 45 to 54 Years | 2,476 (88.7%) | 54 (2.2%) |
| 55 to 59 Years | 710 (81.0%) | 0 (0.0%) |
| 60 to 64 Years | 692 (62.3%) | 0 (0.0%) |
| 65 to 74 Years | 365 (16.7%) | 9 (2.5%) |
| 75 Years and over | 99 (10.1%) | 0 (0.0%) |
| Total | 9,771 (66.8%) | 449 (4.6%) |
Employment Status by Educational Attainment in Springboro
According to labor force statistics for Springboro, 84.5% of individuals (7,848) out of the total population between 25 and 64 years of age (9,288) are in the labor force, with 2.8% or 220 of them being unemployed. The group with the highest labor force participation rate are those with the educational attainment of college / associate degree, with 88.0% or 2,075 individuals in the labor force. Within the labor force, individuals with high school diploma education have the highest percentage of unemployment, with 7.3% or 88 of them being unemployed.
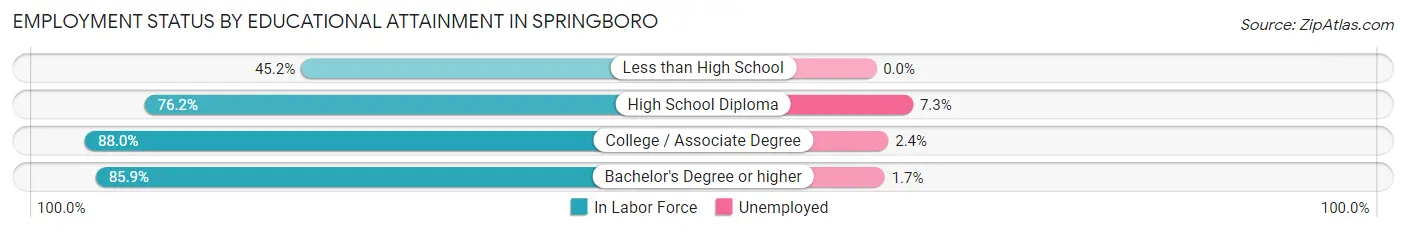
| Educational Attainment | In Labor Force | Unemployed |
| Less than High School | 28 (45.2%) | 0 (0.0%) |
| High School Diploma | 1,209 (76.2%) | 116 (7.3%) |
| College / Associate Degree | 2,075 (88.0%) | 57 (2.4%) |
| Bachelor's Degree or higher | 4,536 (85.9%) | 90 (1.7%) |
| Total | 7,848 (84.5%) | 260 (2.8%) |
Employment Occupations by Sex in Springboro
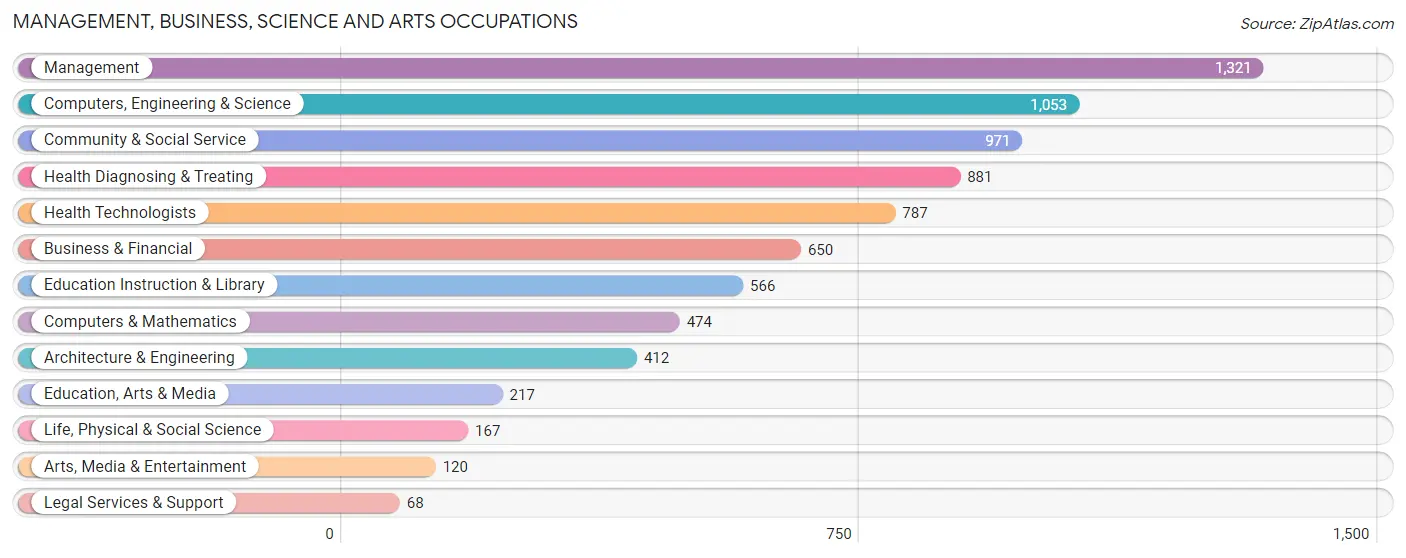
Management, Business, Science and Arts Occupations
The most common Management, Business, Science and Arts occupations in Springboro are Management (1,321 | 14.4%), Computers, Engineering & Science (1,053 | 11.4%), Community & Social Service (971 | 10.5%), Health Diagnosing & Treating (881 | 9.6%), and Health Technologists (787 | 8.6%).
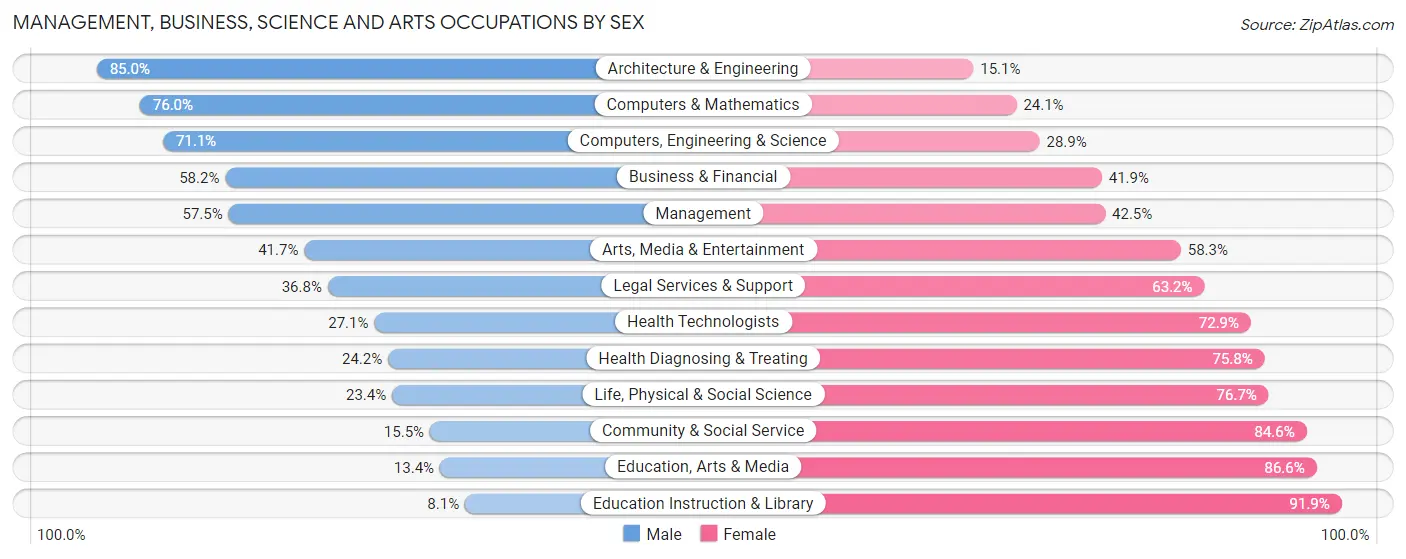
Management, Business, Science and Arts Occupations by Sex
Within the Management, Business, Science and Arts occupations in Springboro, the most male-oriented occupations are Architecture & Engineering (85.0%), Computers & Mathematics (75.9%), and Computers, Engineering & Science (71.1%), while the most female-oriented occupations are Education Instruction & Library (91.9%), Education, Arts & Media (86.6%), and Community & Social Service (84.6%).
| Occupation | Male | Female |
| Management | 759 (57.5%) | 562 (42.5%) |
| Business & Financial | 378 (58.2%) | 272 (41.8%) |
| Computers, Engineering & Science | 749 (71.1%) | 304 (28.9%) |
| Computers & Mathematics | 360 (75.9%) | 114 (24.0%) |
| Architecture & Engineering | 350 (85.0%) | 62 (15.0%) |
| Life, Physical & Social Science | 39 (23.4%) | 128 (76.6%) |
| Community & Social Service | 150 (15.4%) | 821 (84.6%) |
| Education, Arts & Media | 29 (13.4%) | 188 (86.6%) |
| Legal Services & Support | 25 (36.8%) | 43 (63.2%) |
| Education Instruction & Library | 46 (8.1%) | 520 (91.9%) |
| Arts, Media & Entertainment | 50 (41.7%) | 70 (58.3%) |
| Health Diagnosing & Treating | 213 (24.2%) | 668 (75.8%) |
| Health Technologists | 213 (27.1%) | 574 (72.9%) |
| Total (Category) | 2,249 (46.1%) | 2,627 (53.9%) |
| Total (Overall) | 4,706 (51.1%) | 4,496 (48.9%) |
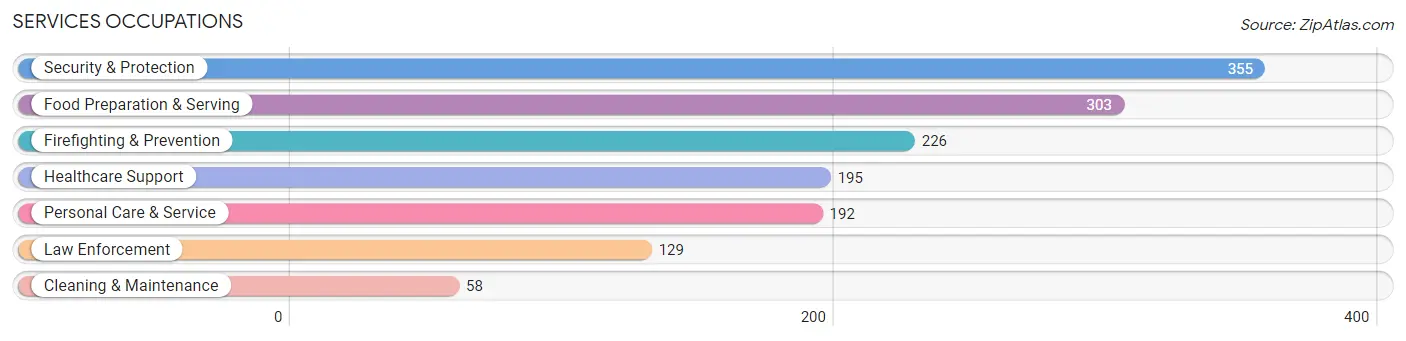
Services Occupations
The most common Services occupations in Springboro are Security & Protection (355 | 3.9%), Food Preparation & Serving (303 | 3.3%), Firefighting & Prevention (226 | 2.5%), Healthcare Support (195 | 2.1%), and Personal Care & Service (192 | 2.1%).
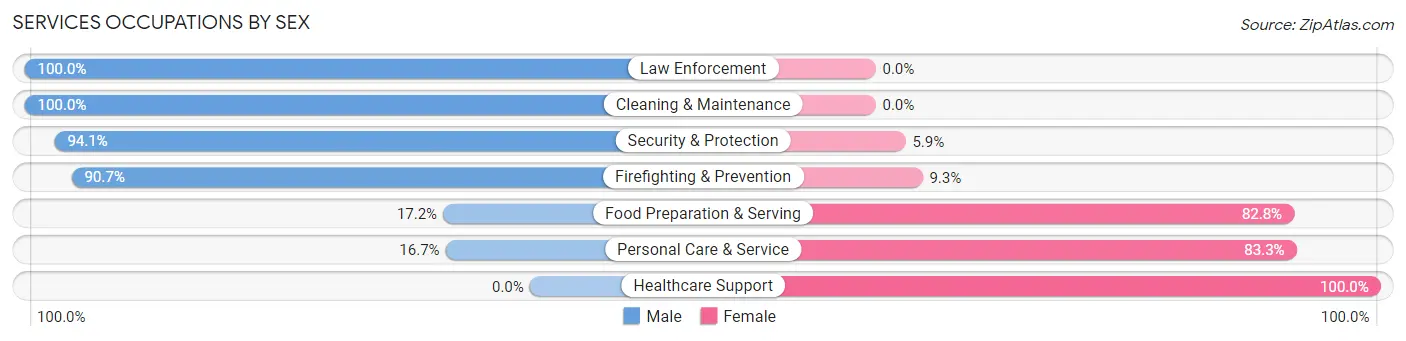
Services Occupations by Sex
Within the Services occupations in Springboro, the most male-oriented occupations are Law Enforcement (100.0%), Cleaning & Maintenance (100.0%), and Security & Protection (94.1%), while the most female-oriented occupations are Healthcare Support (100.0%), Personal Care & Service (83.3%), and Food Preparation & Serving (82.8%).
| Occupation | Male | Female |
| Healthcare Support | 0 (0.0%) | 195 (100.0%) |
| Security & Protection | 334 (94.1%) | 21 (5.9%) |
| Firefighting & Prevention | 205 (90.7%) | 21 (9.3%) |
| Law Enforcement | 129 (100.0%) | 0 (0.0%) |
| Food Preparation & Serving | 52 (17.2%) | 251 (82.8%) |
| Cleaning & Maintenance | 58 (100.0%) | 0 (0.0%) |
| Personal Care & Service | 32 (16.7%) | 160 (83.3%) |
| Total (Category) | 476 (43.2%) | 627 (56.8%) |
| Total (Overall) | 4,706 (51.1%) | 4,496 (48.9%) |
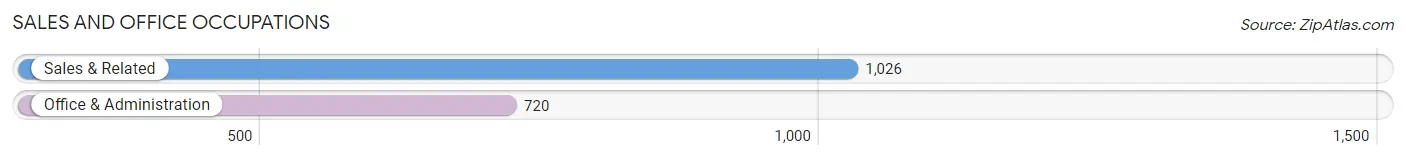
Sales and Office Occupations
The most common Sales and Office occupations in Springboro are Sales & Related (1,026 | 11.2%), and Office & Administration (720 | 7.8%).
Sales and Office Occupations by Sex
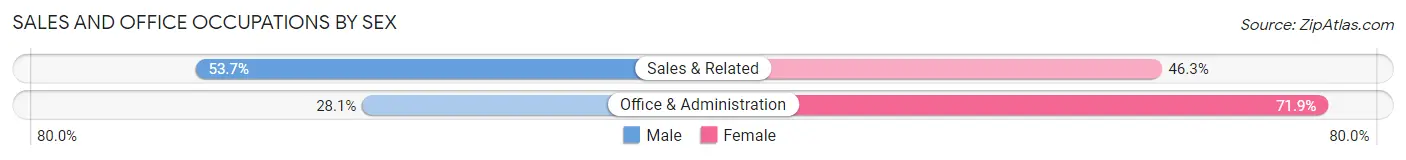
| Occupation | Male | Female |
| Sales & Related | 551 (53.7%) | 475 (46.3%) |
| Office & Administration | 202 (28.1%) | 518 (71.9%) |
| Total (Category) | 753 (43.1%) | 993 (56.9%) |
| Total (Overall) | 4,706 (51.1%) | 4,496 (48.9%) |
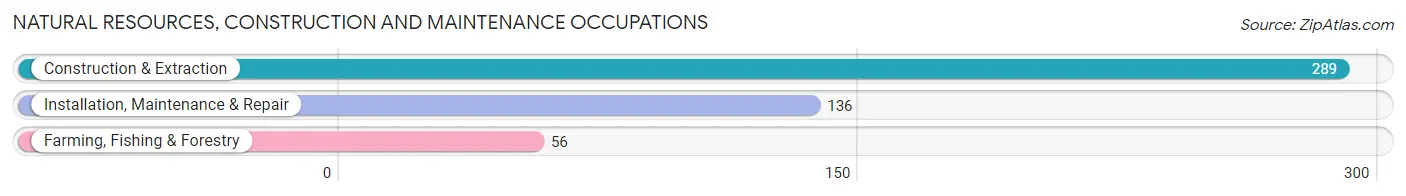
Natural Resources, Construction and Maintenance Occupations
The most common Natural Resources, Construction and Maintenance occupations in Springboro are Construction & Extraction (289 | 3.1%), Installation, Maintenance & Repair (136 | 1.5%), and Farming, Fishing & Forestry (56 | 0.6%).
Natural Resources, Construction and Maintenance Occupations by Sex
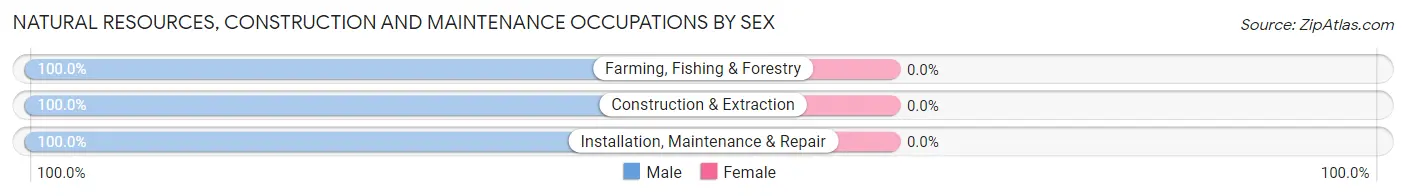
| Occupation | Male | Female |
| Farming, Fishing & Forestry | 56 (100.0%) | 0 (0.0%) |
| Construction & Extraction | 289 (100.0%) | 0 (0.0%) |
| Installation, Maintenance & Repair | 136 (100.0%) | 0 (0.0%) |
| Total (Category) | 481 (100.0%) | 0 (0.0%) |
| Total (Overall) | 4,706 (51.1%) | 4,496 (48.9%) |
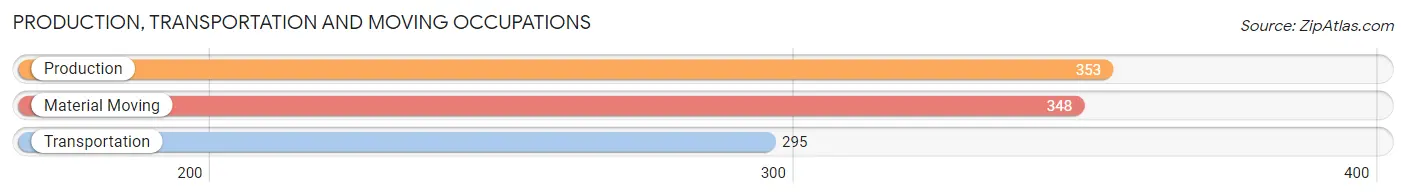
Production, Transportation and Moving Occupations
The most common Production, Transportation and Moving occupations in Springboro are Production (353 | 3.8%), Material Moving (348 | 3.8%), and Transportation (295 | 3.2%).
Production, Transportation and Moving Occupations by Sex
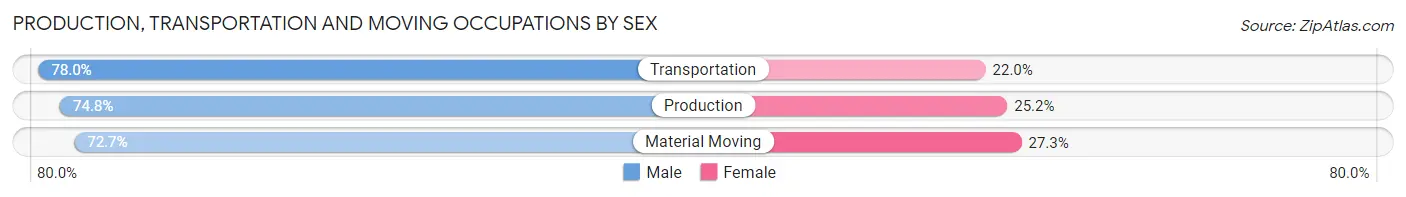
| Occupation | Male | Female |
| Production | 264 (74.8%) | 89 (25.2%) |
| Transportation | 230 (78.0%) | 65 (22.0%) |
| Material Moving | 253 (72.7%) | 95 (27.3%) |
| Total (Category) | 747 (75.0%) | 249 (25.0%) |
| Total (Overall) | 4,706 (51.1%) | 4,496 (48.9%) |
Employment Industries by Sex in Springboro
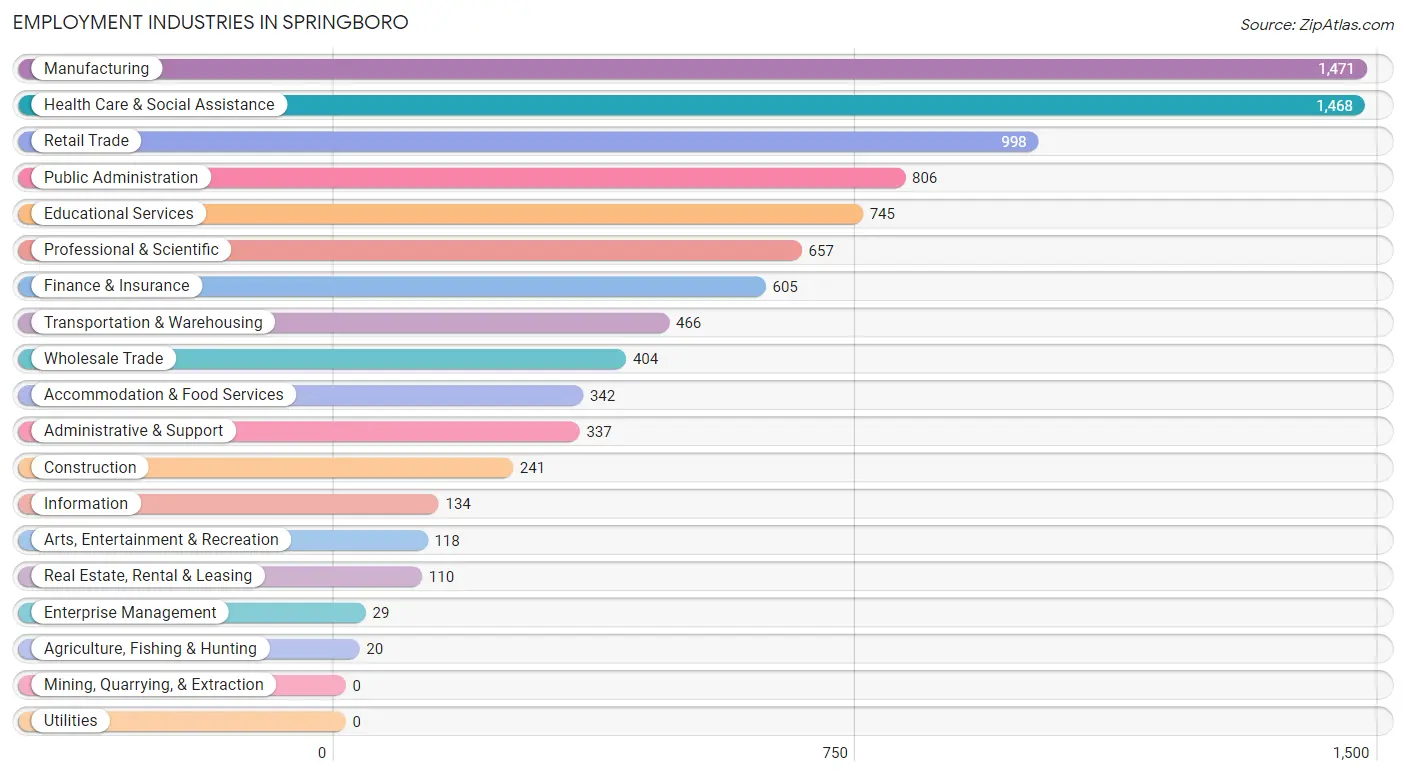
Employment Industries in Springboro
The major employment industries in Springboro include Manufacturing (1,471 | 16.0%), Health Care & Social Assistance (1,468 | 16.0%), Retail Trade (998 | 10.8%), Public Administration (806 | 8.8%), and Educational Services (745 | 8.1%).
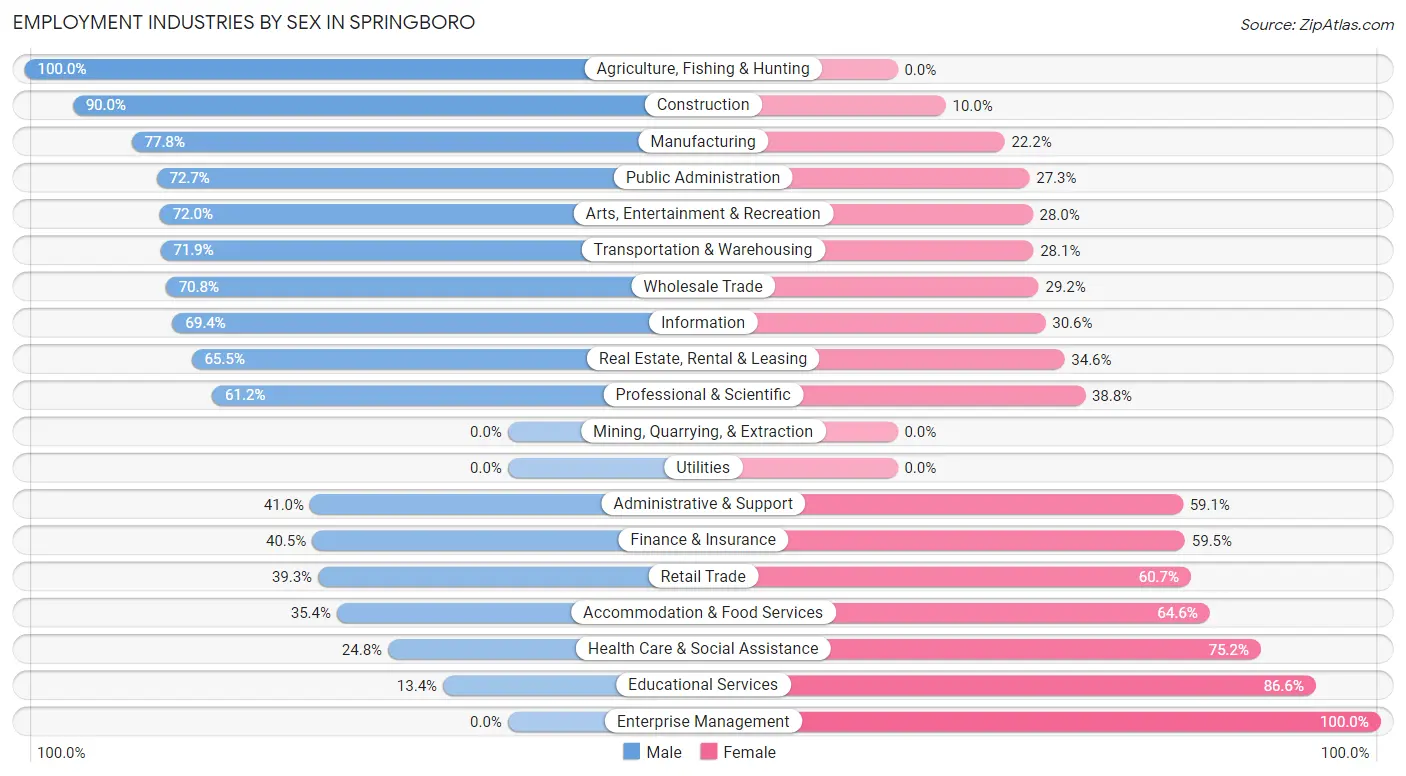
Employment Industries by Sex in Springboro
The Springboro industries that see more men than women are Agriculture, Fishing & Hunting (100.0%), Construction (90.0%), and Manufacturing (77.8%), whereas the industries that tend to have a higher number of women are Enterprise Management (100.0%), Educational Services (86.6%), and Health Care & Social Assistance (75.2%).
| Industry | Male | Female |
| Agriculture, Fishing & Hunting | 20 (100.0%) | 0 (0.0%) |
| Mining, Quarrying, & Extraction | 0 (0.0%) | 0 (0.0%) |
| Construction | 217 (90.0%) | 24 (10.0%) |
| Manufacturing | 1,145 (77.8%) | 326 (22.2%) |
| Wholesale Trade | 286 (70.8%) | 118 (29.2%) |
| Retail Trade | 392 (39.3%) | 606 (60.7%) |
| Transportation & Warehousing | 335 (71.9%) | 131 (28.1%) |
| Utilities | 0 (0.0%) | 0 (0.0%) |
| Information | 93 (69.4%) | 41 (30.6%) |
| Finance & Insurance | 245 (40.5%) | 360 (59.5%) |
| Real Estate, Rental & Leasing | 72 (65.4%) | 38 (34.5%) |
| Professional & Scientific | 402 (61.2%) | 255 (38.8%) |
| Enterprise Management | 0 (0.0%) | 29 (100.0%) |
| Administrative & Support | 138 (40.9%) | 199 (59.1%) |
| Educational Services | 100 (13.4%) | 645 (86.6%) |
| Health Care & Social Assistance | 364 (24.8%) | 1,104 (75.2%) |
| Arts, Entertainment & Recreation | 85 (72.0%) | 33 (28.0%) |
| Accommodation & Food Services | 121 (35.4%) | 221 (64.6%) |
| Public Administration | 586 (72.7%) | 220 (27.3%) |
| Total | 4,706 (51.1%) | 4,496 (48.9%) |
Education in Springboro
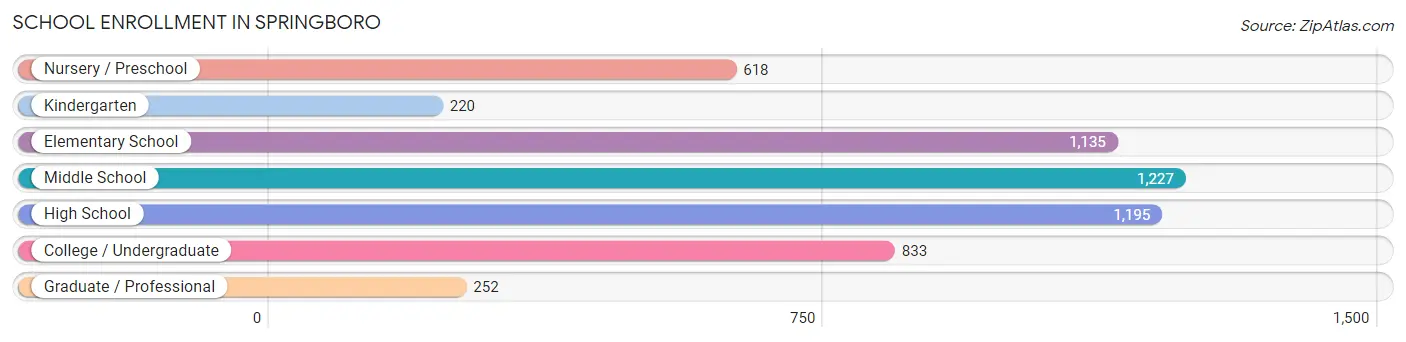
School Enrollment in Springboro
The most common levels of schooling among the 5,480 students in Springboro are middle school (1,227 | 22.4%), high school (1,195 | 21.8%), and elementary school (1,135 | 20.7%).
| School Level | # Students | % Students |
| Nursery / Preschool | 618 | 11.3% |
| Kindergarten | 220 | 4.0% |
| Elementary School | 1,135 | 20.7% |
| Middle School | 1,227 | 22.4% |
| High School | 1,195 | 21.8% |
| College / Undergraduate | 833 | 15.2% |
| Graduate / Professional | 252 | 4.6% |
| Total | 5,480 | 100.0% |
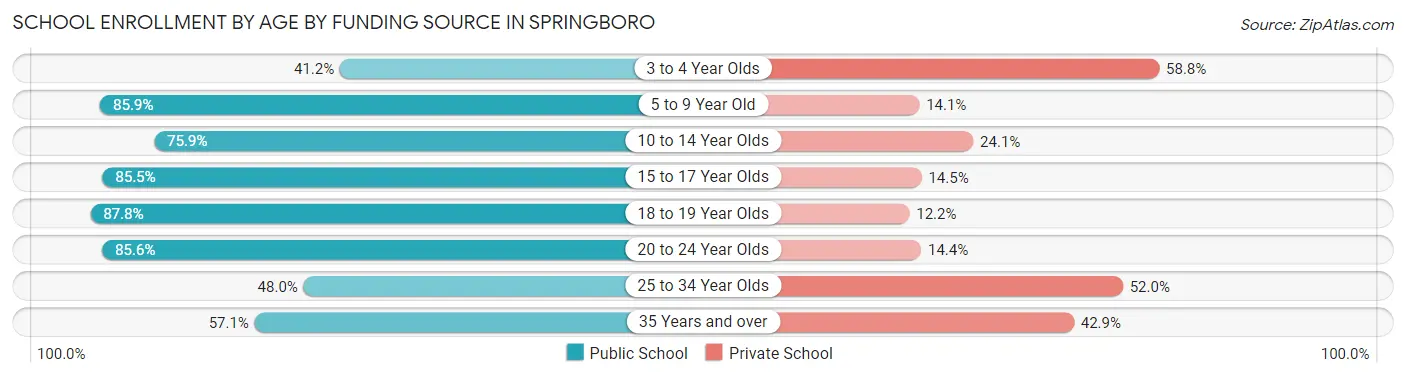
School Enrollment by Age by Funding Source in Springboro
Out of a total of 5,480 students who are enrolled in schools in Springboro, 1,238 (22.6%) attend a private institution, while the remaining 4,242 (77.4%) are enrolled in public schools. The age group of 3 to 4 year olds has the highest likelihood of being enrolled in private schools, with 265 (58.8% in the age bracket) enrolled. Conversely, the age group of 18 to 19 year olds has the lowest likelihood of being enrolled in a private school, with 323 (87.8% in the age bracket) attending a public institution.
| Age Bracket | Public School | Private School |
| 3 to 4 Year Olds | 186 (41.2%) | 265 (58.8%) |
| 5 to 9 Year Old | 1,136 (85.9%) | 186 (14.1%) |
| 10 to 14 Year Olds | 1,139 (75.9%) | 362 (24.1%) |
| 15 to 17 Year Olds | 909 (85.5%) | 154 (14.5%) |
| 18 to 19 Year Olds | 323 (87.8%) | 45 (12.2%) |
| 20 to 24 Year Olds | 368 (85.6%) | 62 (14.4%) |
| 25 to 34 Year Olds | 85 (48.0%) | 92 (52.0%) |
| 35 Years and over | 96 (57.1%) | 72 (42.9%) |
| Total | 4,242 (77.4%) | 1,238 (22.6%) |
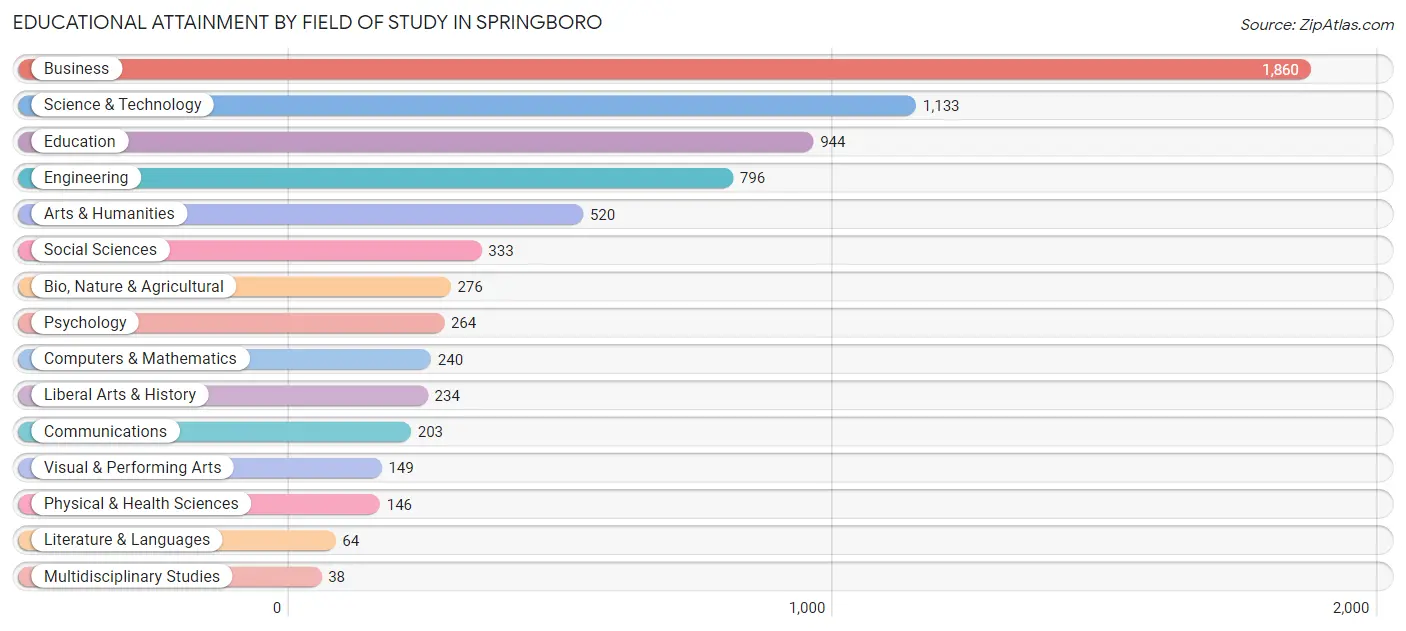
Educational Attainment by Field of Study in Springboro
Business (1,860 | 25.8%), science & technology (1,133 | 15.7%), education (944 | 13.1%), engineering (796 | 11.1%), and arts & humanities (520 | 7.2%) are the most common fields of study among 7,200 individuals in Springboro who have obtained a bachelor's degree or higher.
| Field of Study | # Graduates | % Graduates |
| Computers & Mathematics | 240 | 3.3% |
| Bio, Nature & Agricultural | 276 | 3.8% |
| Physical & Health Sciences | 146 | 2.0% |
| Psychology | 264 | 3.7% |
| Social Sciences | 333 | 4.6% |
| Engineering | 796 | 11.1% |
| Multidisciplinary Studies | 38 | 0.5% |
| Science & Technology | 1,133 | 15.7% |
| Business | 1,860 | 25.8% |
| Education | 944 | 13.1% |
| Literature & Languages | 64 | 0.9% |
| Liberal Arts & History | 234 | 3.3% |
| Visual & Performing Arts | 149 | 2.1% |
| Communications | 203 | 2.8% |
| Arts & Humanities | 520 | 7.2% |
| Total | 7,200 | 100.0% |
Transportation & Commute in Springboro
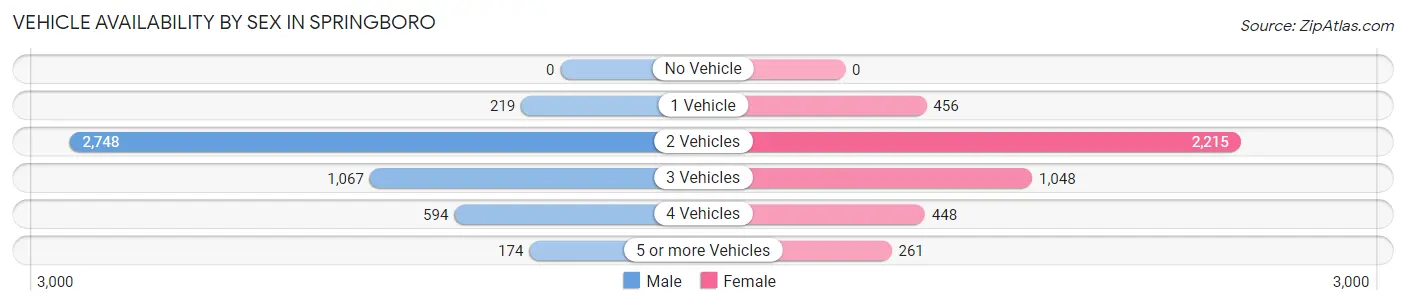
Vehicle Availability by Sex in Springboro
The most prevalent vehicle ownership categories in Springboro are males with 2 vehicles (2,748, accounting for 57.2%) and females with 2 vehicles (2,215, making up 62.1%).
| Vehicles Available | Male | Female |
| No Vehicle | 0 (0.0%) | 0 (0.0%) |
| 1 Vehicle | 219 (4.6%) | 456 (10.3%) |
| 2 Vehicles | 2,748 (57.2%) | 2,215 (50.0%) |
| 3 Vehicles | 1,067 (22.2%) | 1,048 (23.7%) |
| 4 Vehicles | 594 (12.4%) | 448 (10.1%) |
| 5 or more Vehicles | 174 (3.6%) | 261 (5.9%) |
| Total | 4,802 (100.0%) | 4,428 (100.0%) |
Commute Time in Springboro
The most frequently occuring commute durations in Springboro are 30 to 34 minutes (1,318 commuters, 16.8%), 25 to 29 minutes (1,230 commuters, 15.6%), and 20 to 24 minutes (1,201 commuters, 15.3%).
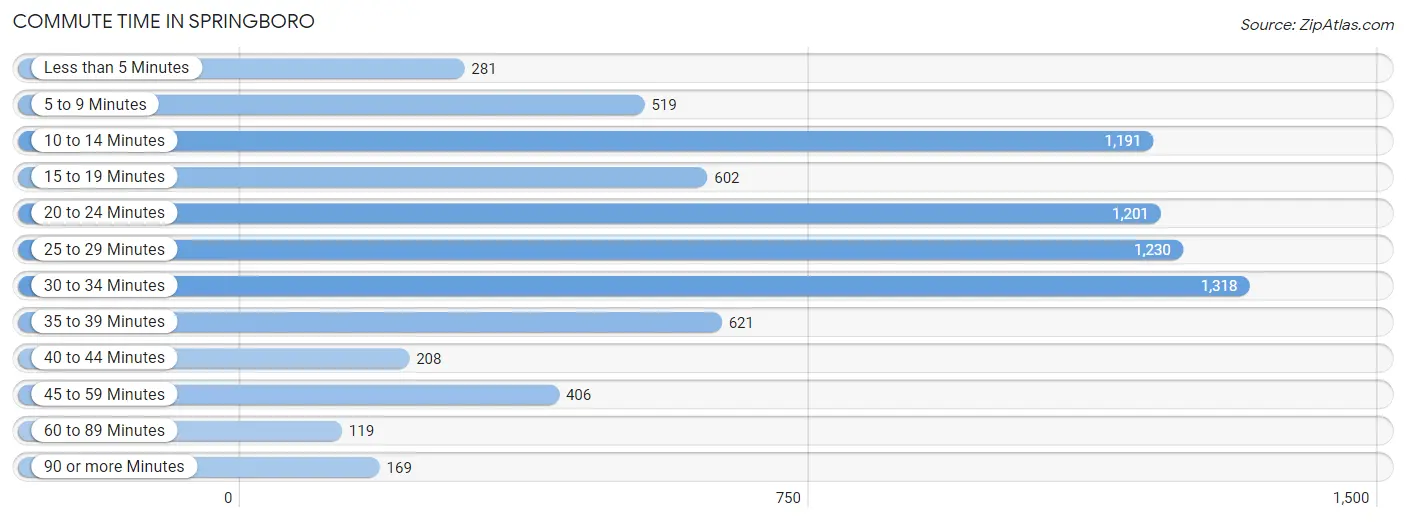
| Commute Time | # Commuters | % Commuters |
| Less than 5 Minutes | 281 | 3.6% |
| 5 to 9 Minutes | 519 | 6.6% |
| 10 to 14 Minutes | 1,191 | 15.1% |
| 15 to 19 Minutes | 602 | 7.6% |
| 20 to 24 Minutes | 1,201 | 15.3% |
| 25 to 29 Minutes | 1,230 | 15.6% |
| 30 to 34 Minutes | 1,318 | 16.8% |
| 35 to 39 Minutes | 621 | 7.9% |
| 40 to 44 Minutes | 208 | 2.6% |
| 45 to 59 Minutes | 406 | 5.2% |
| 60 to 89 Minutes | 119 | 1.5% |
| 90 or more Minutes | 169 | 2.1% |
Commute Time by Sex in Springboro
The most common commute times in Springboro are 25 to 29 minutes (798 commuters, 18.8%) for males and 10 to 14 minutes (806 commuters, 22.2%) for females.
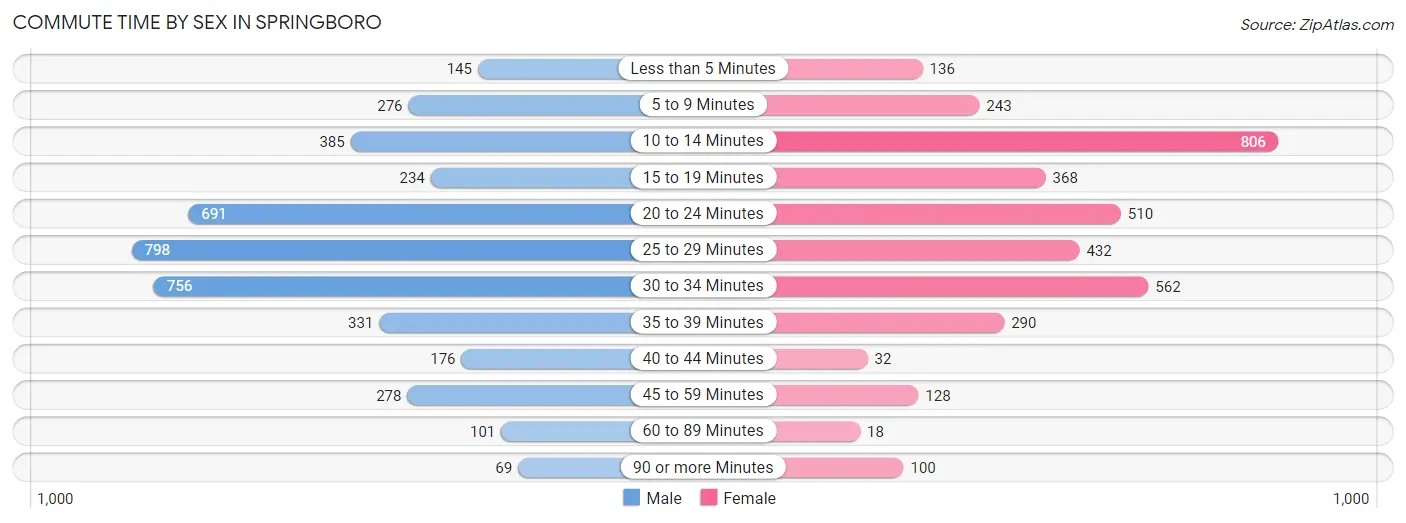
| Commute Time | Male | Female |
| Less than 5 Minutes | 145 (3.4%) | 136 (3.7%) |
| 5 to 9 Minutes | 276 (6.5%) | 243 (6.7%) |
| 10 to 14 Minutes | 385 (9.1%) | 806 (22.2%) |
| 15 to 19 Minutes | 234 (5.5%) | 368 (10.2%) |
| 20 to 24 Minutes | 691 (16.3%) | 510 (14.1%) |
| 25 to 29 Minutes | 798 (18.8%) | 432 (11.9%) |
| 30 to 34 Minutes | 756 (17.8%) | 562 (15.5%) |
| 35 to 39 Minutes | 331 (7.8%) | 290 (8.0%) |
| 40 to 44 Minutes | 176 (4.2%) | 32 (0.9%) |
| 45 to 59 Minutes | 278 (6.6%) | 128 (3.5%) |
| 60 to 89 Minutes | 101 (2.4%) | 18 (0.5%) |
| 90 or more Minutes | 69 (1.6%) | 100 (2.8%) |
Time of Departure to Work by Sex in Springboro
The most frequent times of departure to work in Springboro are 7:00 AM to 7:29 AM (1,016, 24.0%) for males and 6:30 AM to 6:59 AM (714, 19.7%) for females.
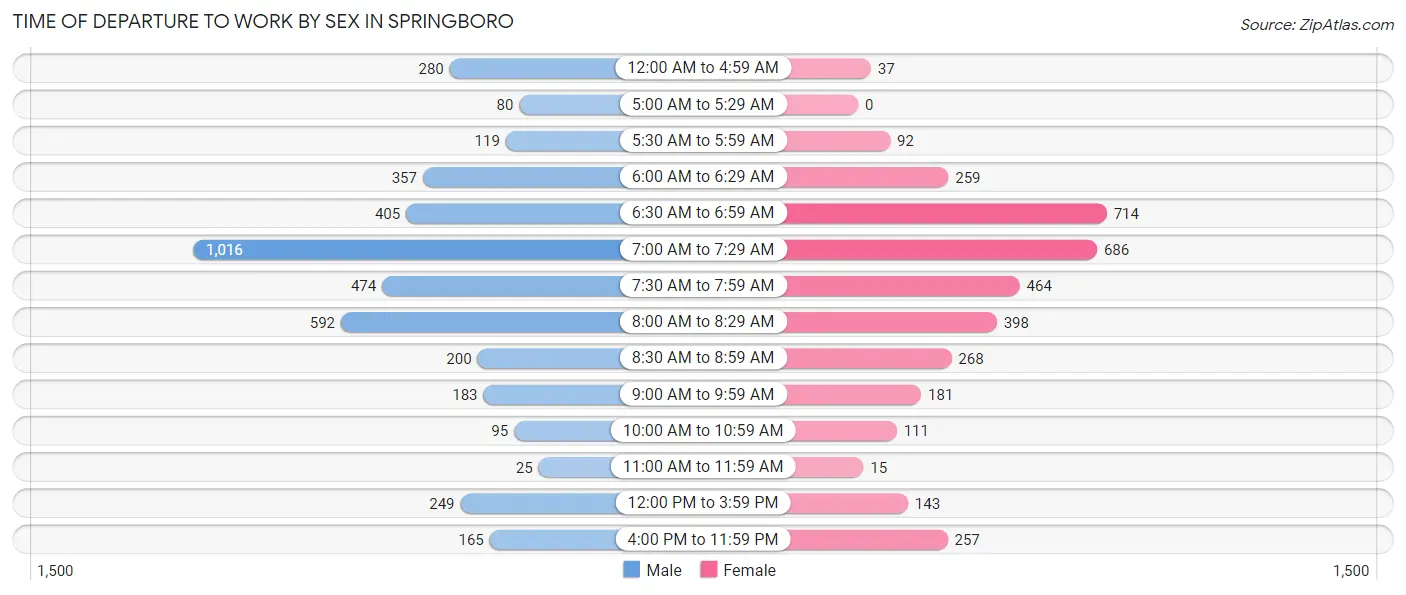
| Time of Departure | Male | Female |
| 12:00 AM to 4:59 AM | 280 (6.6%) | 37 (1.0%) |
| 5:00 AM to 5:29 AM | 80 (1.9%) | 0 (0.0%) |
| 5:30 AM to 5:59 AM | 119 (2.8%) | 92 (2.5%) |
| 6:00 AM to 6:29 AM | 357 (8.4%) | 259 (7.1%) |
| 6:30 AM to 6:59 AM | 405 (9.6%) | 714 (19.7%) |
| 7:00 AM to 7:29 AM | 1,016 (24.0%) | 686 (18.9%) |
| 7:30 AM to 7:59 AM | 474 (11.2%) | 464 (12.8%) |
| 8:00 AM to 8:29 AM | 592 (14.0%) | 398 (11.0%) |
| 8:30 AM to 8:59 AM | 200 (4.7%) | 268 (7.4%) |
| 9:00 AM to 9:59 AM | 183 (4.3%) | 181 (5.0%) |
| 10:00 AM to 10:59 AM | 95 (2.2%) | 111 (3.1%) |
| 11:00 AM to 11:59 AM | 25 (0.6%) | 15 (0.4%) |
| 12:00 PM to 3:59 PM | 249 (5.9%) | 143 (3.9%) |
| 4:00 PM to 11:59 PM | 165 (3.9%) | 257 (7.1%) |
| Total | 4,240 (100.0%) | 3,625 (100.0%) |
Housing Occupancy in Springboro
Occupancy by Ownership in Springboro
Of the total 6,750 dwellings in Springboro, owner-occupied units account for 5,861 (86.8%), while renter-occupied units make up 889 (13.2%).
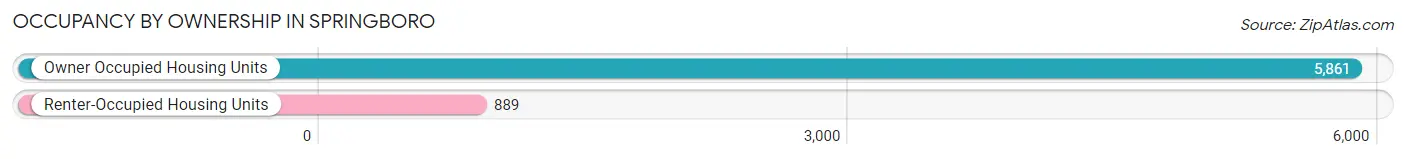
| Occupancy | # Housing Units | % Housing Units |
| Owner Occupied Housing Units | 5,861 | 86.8% |
| Renter-Occupied Housing Units | 889 | 13.2% |
| Total Occupied Housing Units | 6,750 | 100.0% |
Occupancy by Household Size in Springboro
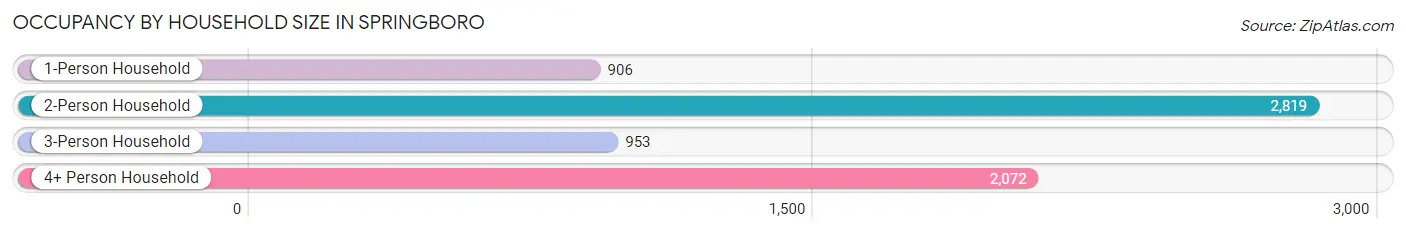
| Household Size | # Housing Units | % Housing Units |
| 1-Person Household | 906 | 13.4% |
| 2-Person Household | 2,819 | 41.8% |
| 3-Person Household | 953 | 14.1% |
| 4+ Person Household | 2,072 | 30.7% |
| Total Housing Units | 6,750 | 100.0% |
Occupancy by Ownership by Household Size in Springboro
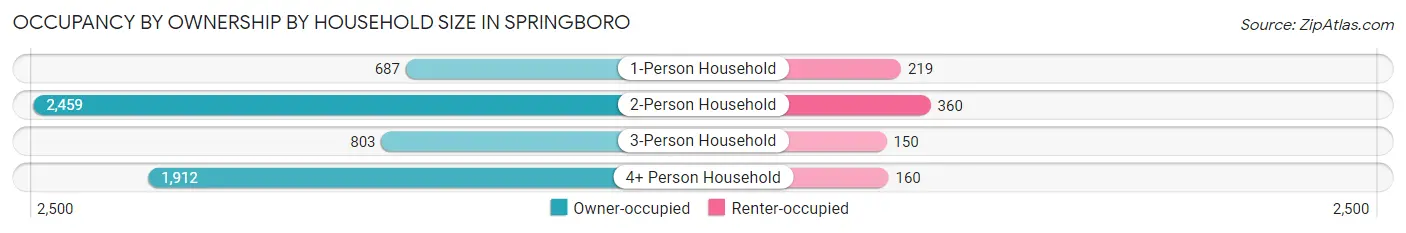
| Household Size | Owner-occupied | Renter-occupied |
| 1-Person Household | 687 (75.8%) | 219 (24.2%) |
| 2-Person Household | 2,459 (87.2%) | 360 (12.8%) |
| 3-Person Household | 803 (84.3%) | 150 (15.7%) |
| 4+ Person Household | 1,912 (92.3%) | 160 (7.7%) |
| Total Housing Units | 5,861 (86.8%) | 889 (13.2%) |
Occupancy by Educational Attainment in Springboro
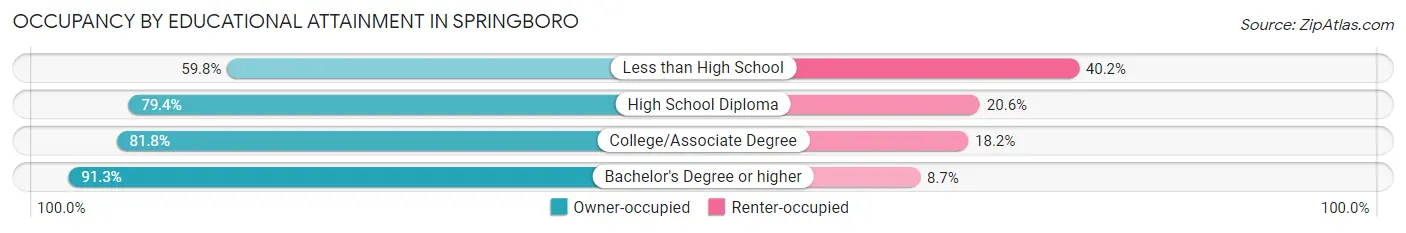
| Household Size | Owner-occupied | Renter-occupied |
| Less than High School | 67 (59.8%) | 45 (40.2%) |
| High School Diploma | 722 (79.4%) | 187 (20.6%) |
| College/Associate Degree | 1,364 (81.8%) | 304 (18.2%) |
| Bachelor's Degree or higher | 3,708 (91.3%) | 353 (8.7%) |
Occupancy by Age of Householder in Springboro
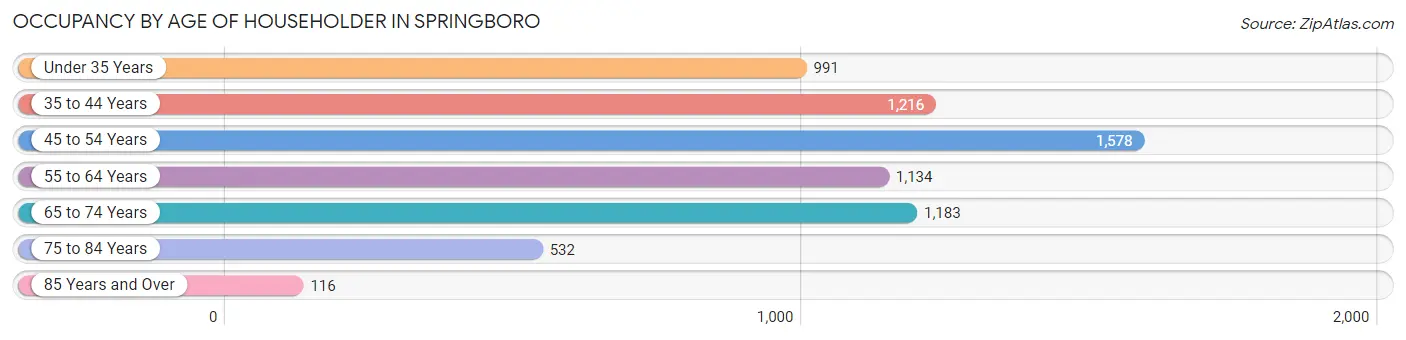
| Age Bracket | # Households | % Households |
| Under 35 Years | 991 | 14.7% |
| 35 to 44 Years | 1,216 | 18.0% |
| 45 to 54 Years | 1,578 | 23.4% |
| 55 to 64 Years | 1,134 | 16.8% |
| 65 to 74 Years | 1,183 | 17.5% |
| 75 to 84 Years | 532 | 7.9% |
| 85 Years and Over | 116 | 1.7% |
| Total | 6,750 | 100.0% |
Housing Finances in Springboro
Median Income by Occupancy in Springboro
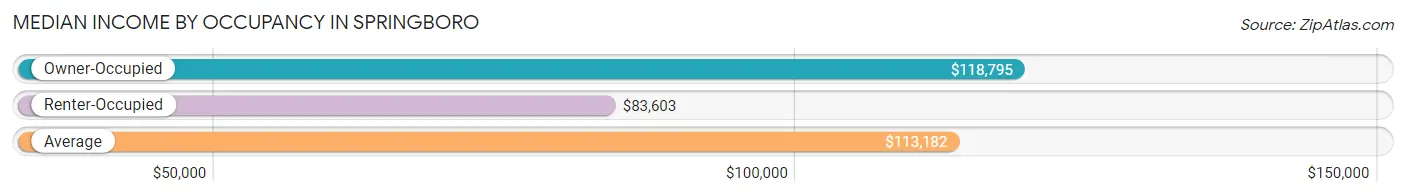
| Occupancy Type | # Households | Median Income |
| Owner-Occupied | 5,861 (86.8%) | $118,795 |
| Renter-Occupied | 889 (13.2%) | $83,603 |
| Average | 6,750 (100.0%) | $113,182 |
Occupancy by Householder Income Bracket in Springboro
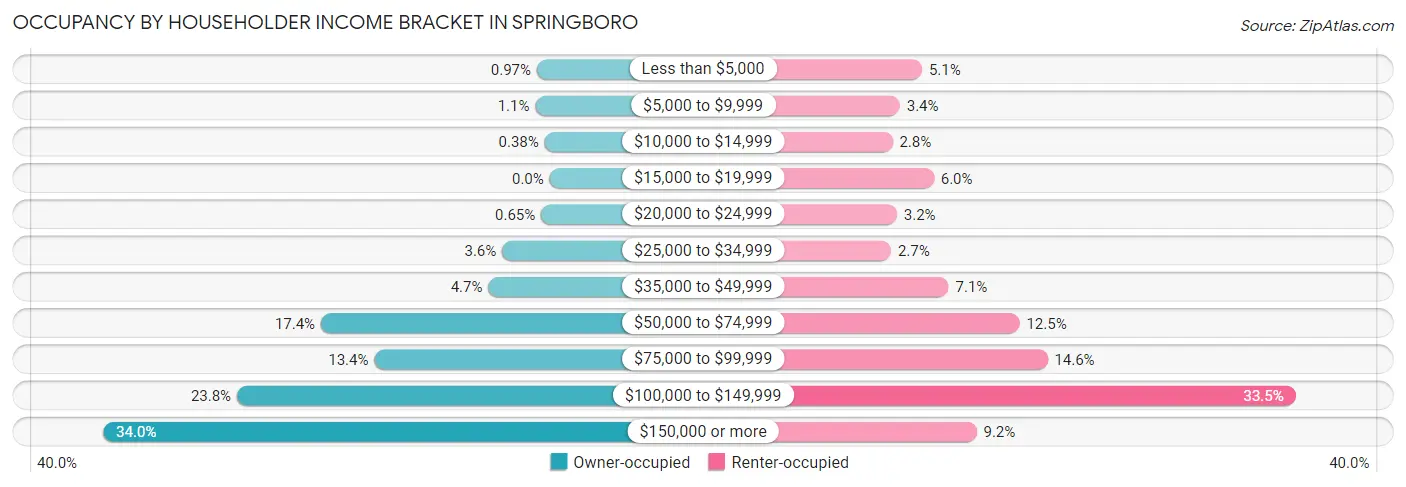
| Income Bracket | Owner-occupied | Renter-occupied |
| Less than $5,000 | 57 (1.0%) | 45 (5.1%) |
| $5,000 to $9,999 | 64 (1.1%) | 30 (3.4%) |
| $10,000 to $14,999 | 22 (0.4%) | 25 (2.8%) |
| $15,000 to $19,999 | 0 (0.0%) | 53 (6.0%) |
| $20,000 to $24,999 | 38 (0.6%) | 28 (3.2%) |
| $25,000 to $34,999 | 212 (3.6%) | 24 (2.7%) |
| $35,000 to $49,999 | 274 (4.7%) | 63 (7.1%) |
| $50,000 to $74,999 | 1,021 (17.4%) | 111 (12.5%) |
| $75,000 to $99,999 | 783 (13.4%) | 130 (14.6%) |
| $100,000 to $149,999 | 1,396 (23.8%) | 298 (33.5%) |
| $150,000 or more | 1,994 (34.0%) | 82 (9.2%) |
| Total | 5,861 (100.0%) | 889 (100.0%) |
Monthly Housing Cost Tiers in Springboro
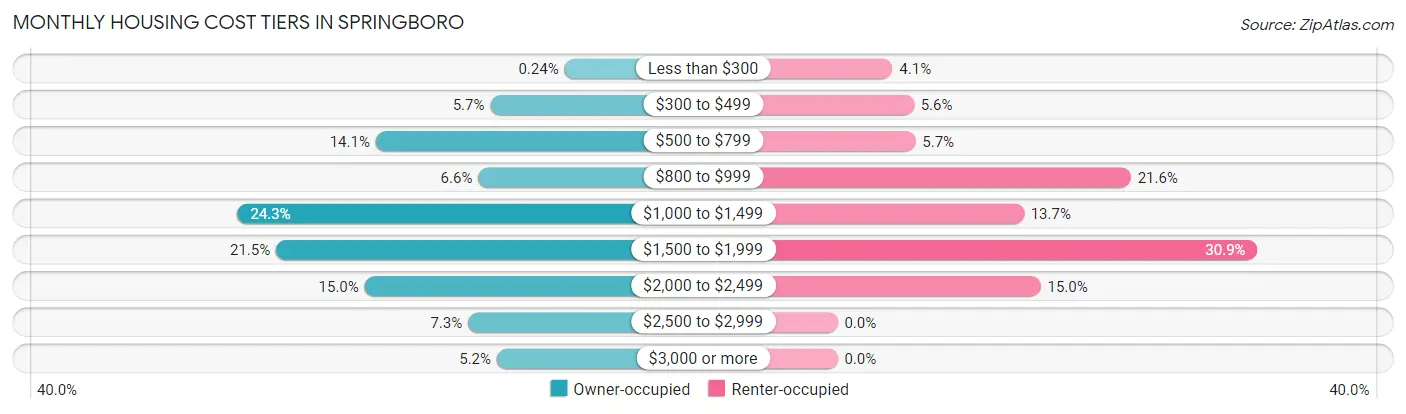
| Monthly Cost | Owner-occupied | Renter-occupied |
| Less than $300 | 14 (0.2%) | 36 (4.1%) |
| $300 to $499 | 334 (5.7%) | 50 (5.6%) |
| $500 to $799 | 829 (14.1%) | 51 (5.7%) |
| $800 to $999 | 386 (6.6%) | 192 (21.6%) |
| $1,000 to $1,499 | 1,426 (24.3%) | 122 (13.7%) |
| $1,500 to $1,999 | 1,259 (21.5%) | 275 (30.9%) |
| $2,000 to $2,499 | 877 (15.0%) | 133 (15.0%) |
| $2,500 to $2,999 | 430 (7.3%) | 0 (0.0%) |
| $3,000 or more | 306 (5.2%) | 0 (0.0%) |
| Total | 5,861 (100.0%) | 889 (100.0%) |
Physical Housing Characteristics in Springboro
Housing Structures in Springboro
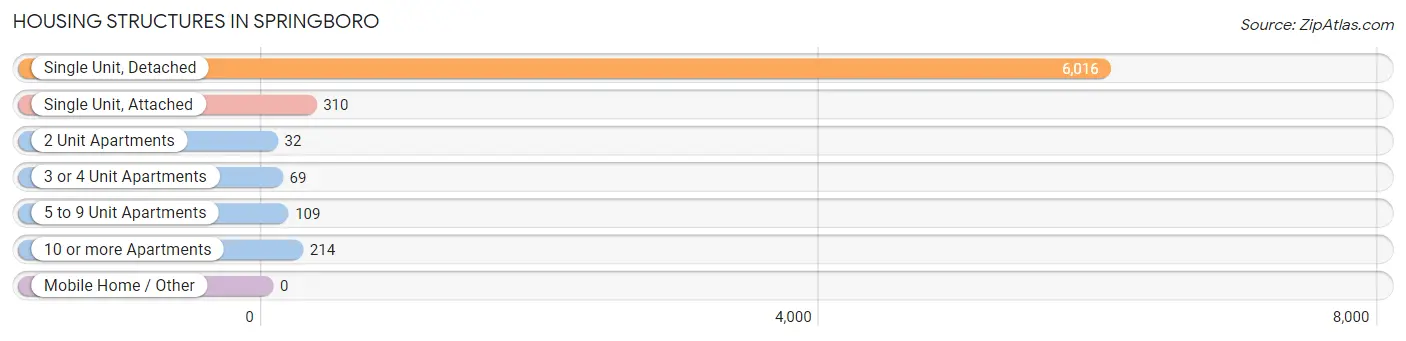
| Structure Type | # Housing Units | % Housing Units |
| Single Unit, Detached | 6,016 | 89.1% |
| Single Unit, Attached | 310 | 4.6% |
| 2 Unit Apartments | 32 | 0.5% |
| 3 or 4 Unit Apartments | 69 | 1.0% |
| 5 to 9 Unit Apartments | 109 | 1.6% |
| 10 or more Apartments | 214 | 3.2% |
| Mobile Home / Other | 0 | 0.0% |
| Total | 6,750 | 100.0% |
Housing Structures by Occupancy in Springboro
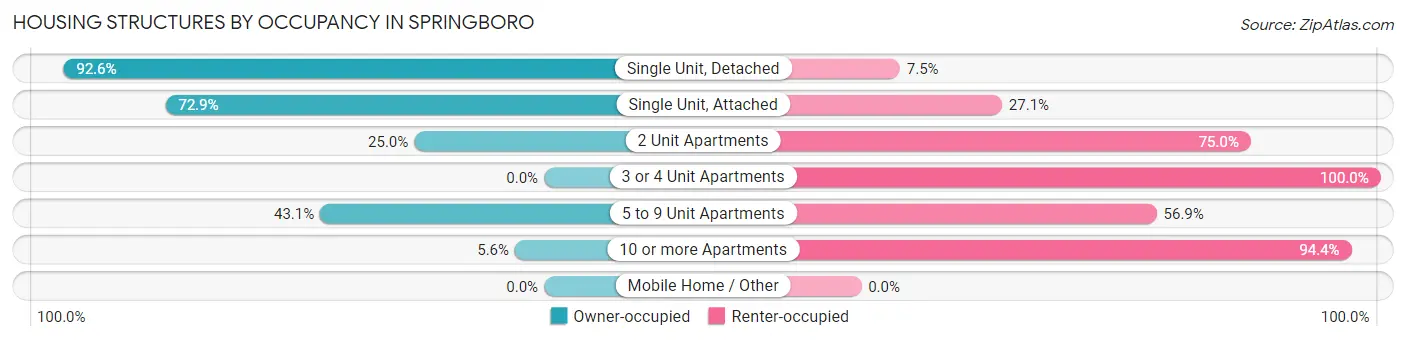
| Structure Type | Owner-occupied | Renter-occupied |
| Single Unit, Detached | 5,568 (92.5%) | 448 (7.4%) |
| Single Unit, Attached | 226 (72.9%) | 84 (27.1%) |
| 2 Unit Apartments | 8 (25.0%) | 24 (75.0%) |
| 3 or 4 Unit Apartments | 0 (0.0%) | 69 (100.0%) |
| 5 to 9 Unit Apartments | 47 (43.1%) | 62 (56.9%) |
| 10 or more Apartments | 12 (5.6%) | 202 (94.4%) |
| Mobile Home / Other | 0 (0.0%) | 0 (0.0%) |
| Total | 5,861 (86.8%) | 889 (13.2%) |
Housing Structures by Number of Rooms in Springboro
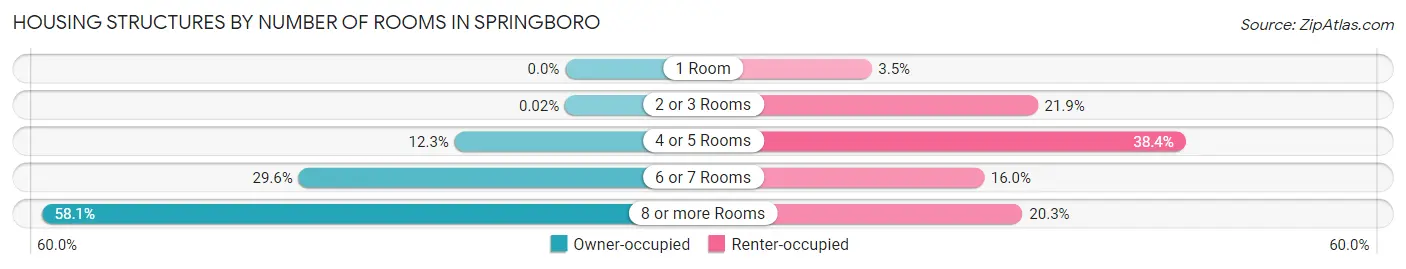
| Number of Rooms | Owner-occupied | Renter-occupied |
| 1 Room | 0 (0.0%) | 31 (3.5%) |
| 2 or 3 Rooms | 1 (0.0%) | 195 (21.9%) |
| 4 or 5 Rooms | 719 (12.3%) | 341 (38.4%) |
| 6 or 7 Rooms | 1,735 (29.6%) | 142 (16.0%) |
| 8 or more Rooms | 3,406 (58.1%) | 180 (20.3%) |
| Total | 5,861 (100.0%) | 889 (100.0%) |
Housing Structure by Heating Type in Springboro
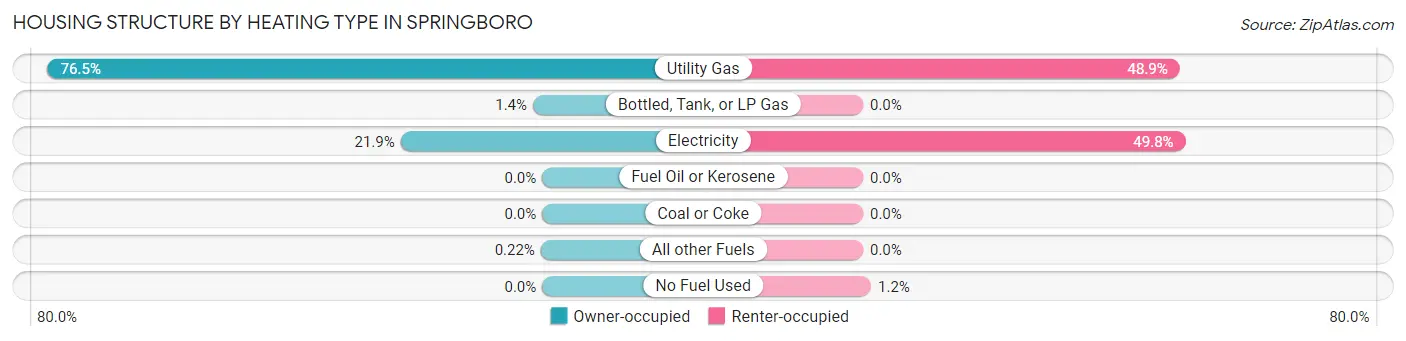
| Heating Type | Owner-occupied | Renter-occupied |
| Utility Gas | 4,481 (76.4%) | 435 (48.9%) |
| Bottled, Tank, or LP Gas | 84 (1.4%) | 0 (0.0%) |
| Electricity | 1,283 (21.9%) | 443 (49.8%) |
| Fuel Oil or Kerosene | 0 (0.0%) | 0 (0.0%) |
| Coal or Coke | 0 (0.0%) | 0 (0.0%) |
| All other Fuels | 13 (0.2%) | 0 (0.0%) |
| No Fuel Used | 0 (0.0%) | 11 (1.2%) |
| Total | 5,861 (100.0%) | 889 (100.0%) |
Household Vehicle Usage in Springboro
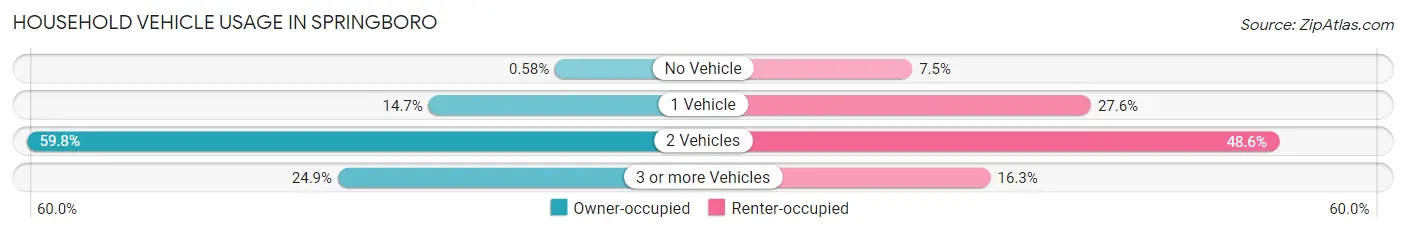
| Vehicles per Household | Owner-occupied | Renter-occupied |
| No Vehicle | 34 (0.6%) | 67 (7.5%) |
| 1 Vehicle | 864 (14.7%) | 245 (27.6%) |
| 2 Vehicles | 3,503 (59.8%) | 432 (48.6%) |
| 3 or more Vehicles | 1,460 (24.9%) | 145 (16.3%) |
| Total | 5,861 (100.0%) | 889 (100.0%) |
Real Estate & Mortgages in Springboro
Real Estate and Mortgage Overview in Springboro
| Characteristic | Without Mortgage | With Mortgage |
| Housing Units | 1,879 | 3,982 |
| Median Property Value | $314,000 | $292,000 |
| Median Household Income | $79,471 | $1,633 |
| Monthly Housing Costs | $708 | $306 |
| Real Estate Taxes | $3,654 | $80 |
Property Value by Mortgage Status in Springboro
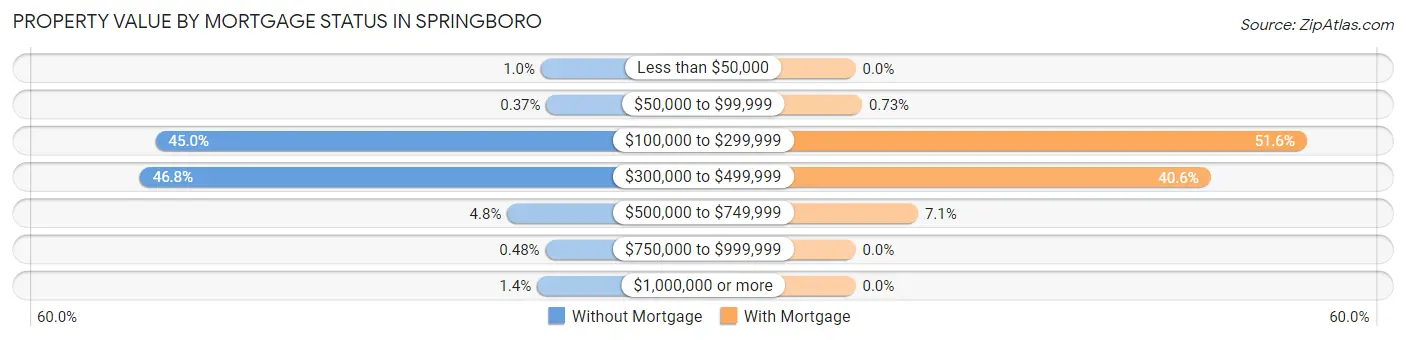
| Property Value | Without Mortgage | With Mortgage |
| Less than $50,000 | 19 (1.0%) | 0 (0.0%) |
| $50,000 to $99,999 | 7 (0.4%) | 29 (0.7%) |
| $100,000 to $299,999 | 846 (45.0%) | 2,053 (51.6%) |
| $300,000 to $499,999 | 880 (46.8%) | 1,616 (40.6%) |
| $500,000 to $749,999 | 91 (4.8%) | 284 (7.1%) |
| $750,000 to $999,999 | 9 (0.5%) | 0 (0.0%) |
| $1,000,000 or more | 27 (1.4%) | 0 (0.0%) |
| Total | 1,879 (100.0%) | 3,982 (100.0%) |
Household Income by Mortgage Status in Springboro
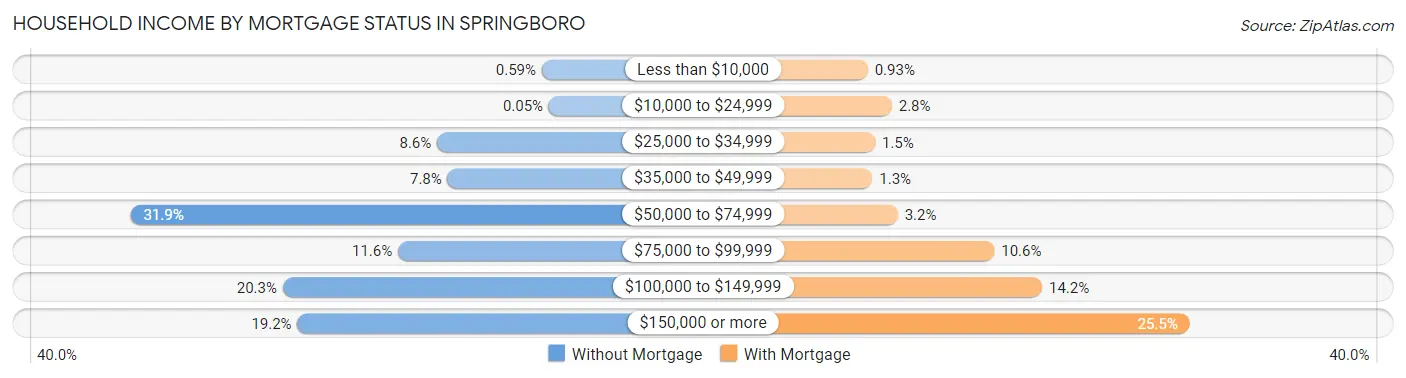
| Household Income | Without Mortgage | With Mortgage |
| Less than $10,000 | 11 (0.6%) | 37 (0.9%) |
| $10,000 to $24,999 | 1 (0.1%) | 110 (2.8%) |
| $25,000 to $34,999 | 161 (8.6%) | 59 (1.5%) |
| $35,000 to $49,999 | 146 (7.8%) | 51 (1.3%) |
| $50,000 to $74,999 | 600 (31.9%) | 128 (3.2%) |
| $75,000 to $99,999 | 217 (11.6%) | 421 (10.6%) |
| $100,000 to $149,999 | 382 (20.3%) | 566 (14.2%) |
| $150,000 or more | 361 (19.2%) | 1,014 (25.5%) |
| Total | 1,879 (100.0%) | 3,982 (100.0%) |
Property Value to Household Income Ratio in Springboro
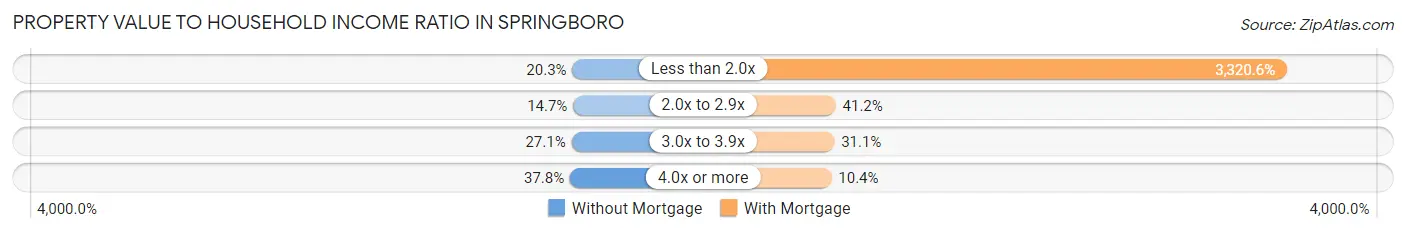
| Value-to-Income Ratio | Without Mortgage | With Mortgage |
| Less than 2.0x | 382 (20.3%) | 132,227 (3,320.6%) |
| 2.0x to 2.9x | 276 (14.7%) | 1,642 (41.2%) |
| 3.0x to 3.9x | 510 (27.1%) | 1,238 (31.1%) |
| 4.0x or more | 711 (37.8%) | 412 (10.3%) |
| Total | 1,879 (100.0%) | 3,982 (100.0%) |
Real Estate Taxes by Mortgage Status in Springboro
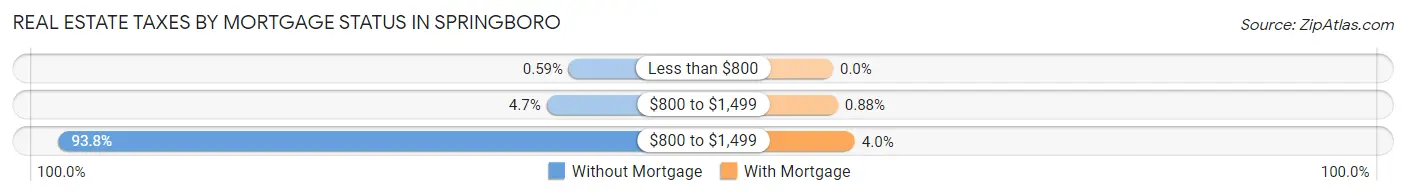
| Property Taxes | Without Mortgage | With Mortgage |
| Less than $800 | 11 (0.6%) | 0 (0.0%) |
| $800 to $1,499 | 88 (4.7%) | 35 (0.9%) |
| $800 to $1,499 | 1,762 (93.8%) | 159 (4.0%) |
| Total | 1,879 (100.0%) | 3,982 (100.0%) |
Health & Disability in Springboro
Health Insurance Coverage by Age in Springboro
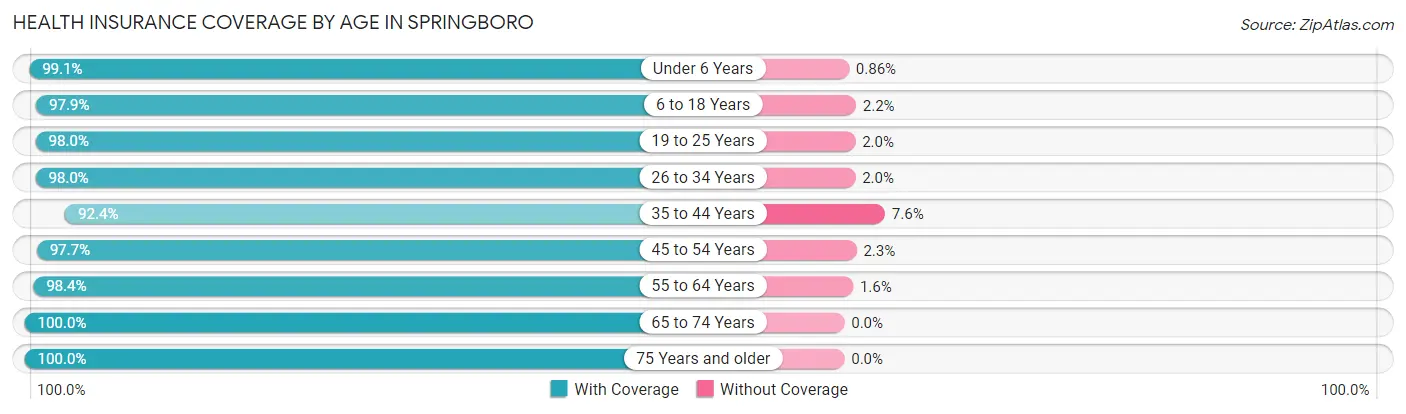
| Age Bracket | With Coverage | Without Coverage |
| Under 6 Years | 1,607 (99.1%) | 14 (0.9%) |
| 6 to 18 Years | 3,916 (97.9%) | 86 (2.1%) |
| 19 to 25 Years | 1,298 (98.0%) | 27 (2.0%) |
| 26 to 34 Years | 1,737 (98.0%) | 36 (2.0%) |
| 35 to 44 Years | 2,309 (92.4%) | 189 (7.6%) |
| 45 to 54 Years | 2,668 (97.7%) | 62 (2.3%) |
| 55 to 64 Years | 1,943 (98.4%) | 32 (1.6%) |
| 65 to 74 Years | 2,146 (100.0%) | 0 (0.0%) |
| 75 Years and older | 912 (100.0%) | 0 (0.0%) |
| Total | 18,536 (97.7%) | 446 (2.4%) |
Health Insurance Coverage by Citizenship Status in Springboro
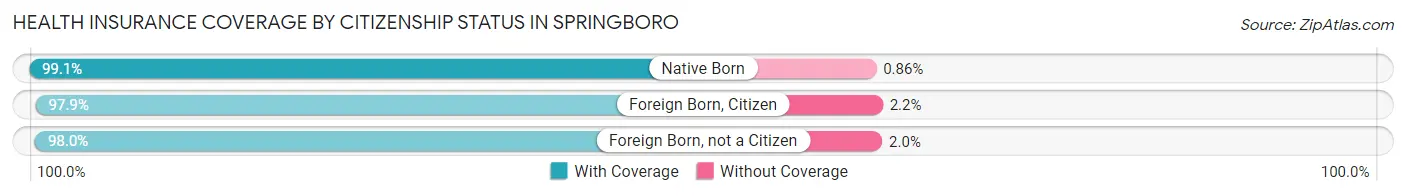
| Citizenship Status | With Coverage | Without Coverage |
| Native Born | 1,607 (99.1%) | 14 (0.9%) |
| Foreign Born, Citizen | 3,916 (97.9%) | 86 (2.1%) |
| Foreign Born, not a Citizen | 1,298 (98.0%) | 27 (2.0%) |
Health Insurance Coverage by Household Income in Springboro
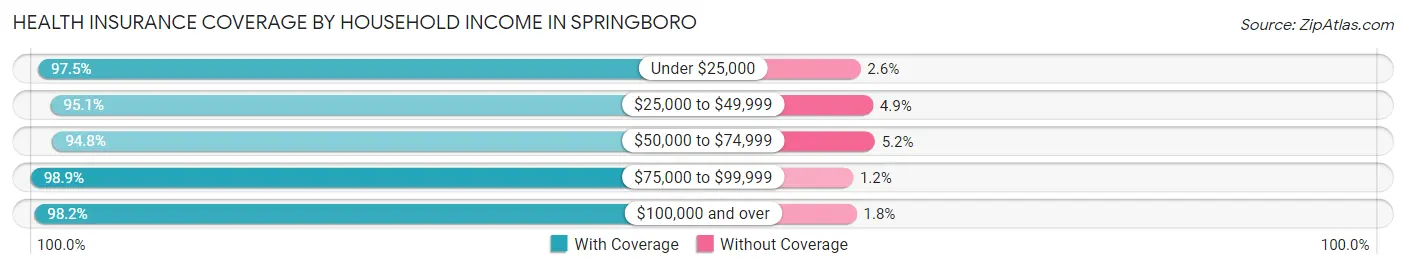
| Household Income | With Coverage | Without Coverage |
| Under $25,000 | 536 (97.5%) | 14 (2.5%) |
| $25,000 to $49,999 | 954 (95.1%) | 49 (4.9%) |
| $50,000 to $74,999 | 2,231 (94.8%) | 123 (5.2%) |
| $75,000 to $99,999 | 2,326 (98.9%) | 27 (1.1%) |
| $100,000 and over | 12,476 (98.2%) | 233 (1.8%) |
Public vs Private Health Insurance Coverage by Age in Springboro
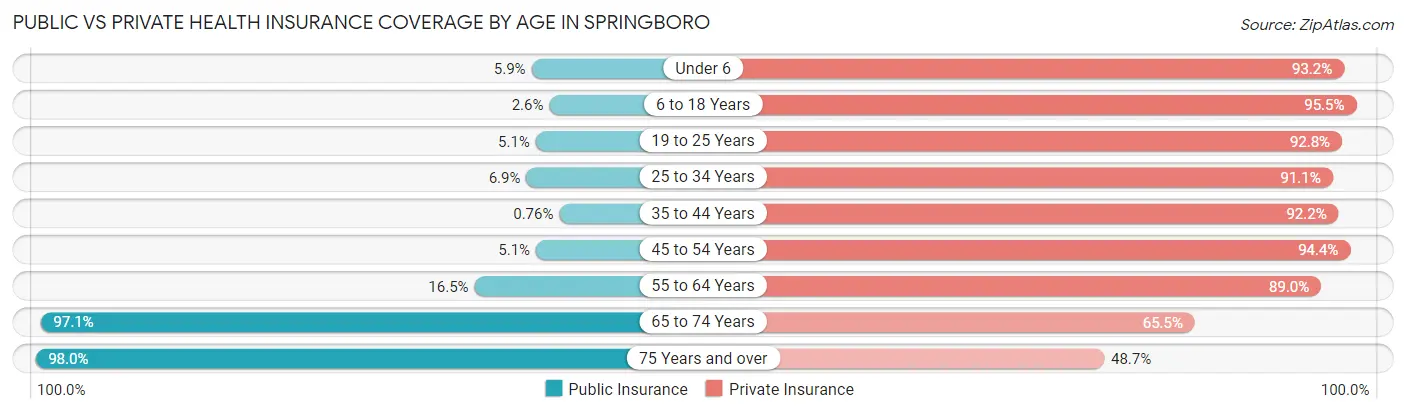
| Age Bracket | Public Insurance | Private Insurance |
| Under 6 | 96 (5.9%) | 1,511 (93.2%) |
| 6 to 18 Years | 104 (2.6%) | 3,822 (95.5%) |
| 19 to 25 Years | 68 (5.1%) | 1,230 (92.8%) |
| 25 to 34 Years | 122 (6.9%) | 1,615 (91.1%) |
| 35 to 44 Years | 19 (0.8%) | 2,303 (92.2%) |
| 45 to 54 Years | 139 (5.1%) | 2,576 (94.4%) |
| 55 to 64 Years | 326 (16.5%) | 1,757 (89.0%) |
| 65 to 74 Years | 2,083 (97.1%) | 1,406 (65.5%) |
| 75 Years and over | 894 (98.0%) | 444 (48.7%) |
| Total | 3,851 (20.3%) | 16,664 (87.8%) |
Disability Status by Sex by Age in Springboro
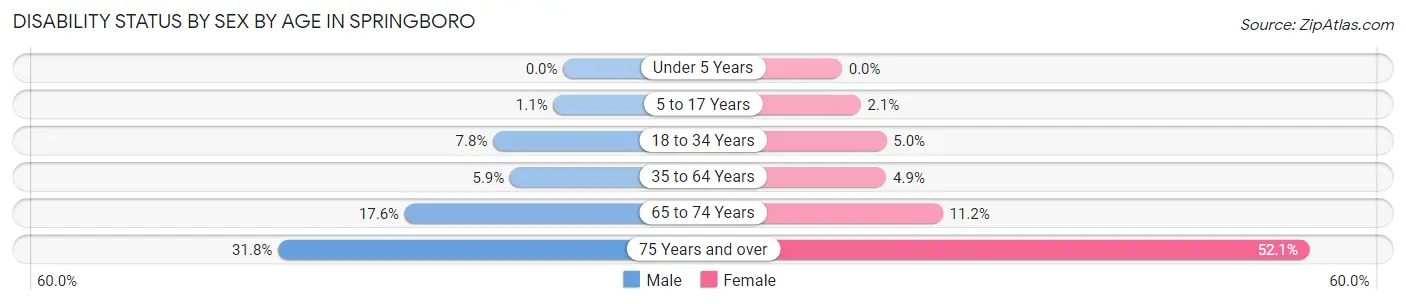
| Age Bracket | Male | Female |
| Under 5 Years | 0 (0.0%) | 0 (0.0%) |
| 5 to 17 Years | 23 (1.1%) | 39 (2.1%) |
| 18 to 34 Years | 125 (7.8%) | 87 (5.0%) |
| 35 to 64 Years | 211 (5.9%) | 180 (4.9%) |
| 65 to 74 Years | 193 (17.6%) | 118 (11.2%) |
| 75 Years and over | 94 (31.8%) | 321 (52.1%) |
Disability Class by Sex by Age in Springboro
Disability Class: Hearing Difficulty
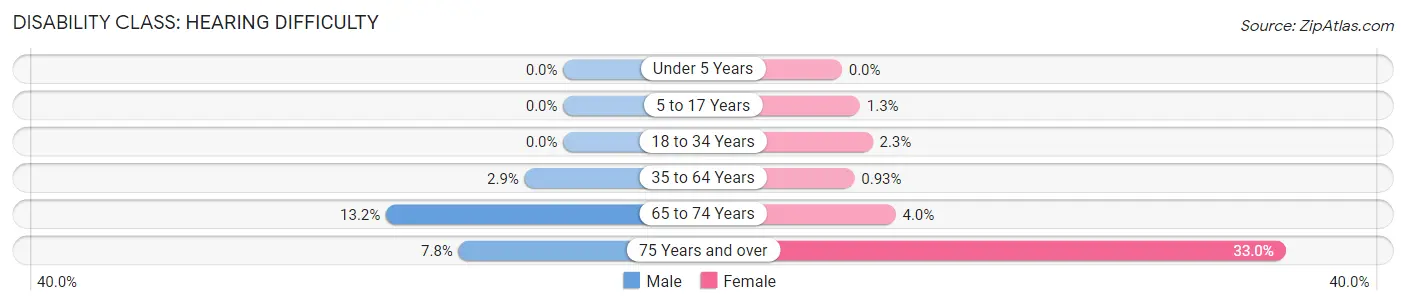
| Age Bracket | Male | Female |
| Under 5 Years | 0 (0.0%) | 0 (0.0%) |
| 5 to 17 Years | 0 (0.0%) | 25 (1.3%) |
| 18 to 34 Years | 0 (0.0%) | 40 (2.3%) |
| 35 to 64 Years | 102 (2.9%) | 34 (0.9%) |
| 65 to 74 Years | 144 (13.2%) | 42 (4.0%) |
| 75 Years and over | 23 (7.8%) | 203 (33.0%) |
Disability Class: Vision Difficulty
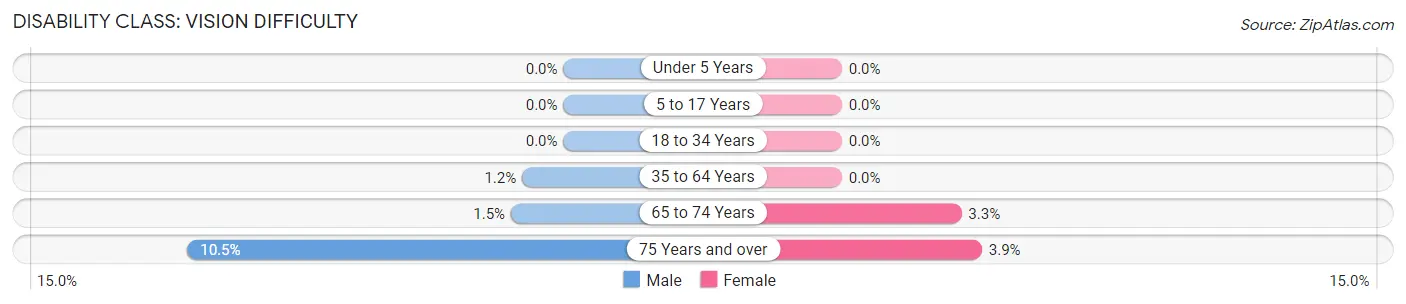
| Age Bracket | Male | Female |
| Under 5 Years | 0 (0.0%) | 0 (0.0%) |
| 5 to 17 Years | 0 (0.0%) | 0 (0.0%) |
| 18 to 34 Years | 0 (0.0%) | 0 (0.0%) |
| 35 to 64 Years | 41 (1.1%) | 0 (0.0%) |
| 65 to 74 Years | 16 (1.5%) | 35 (3.3%) |
| 75 Years and over | 31 (10.5%) | 24 (3.9%) |
Disability Class: Cognitive Difficulty
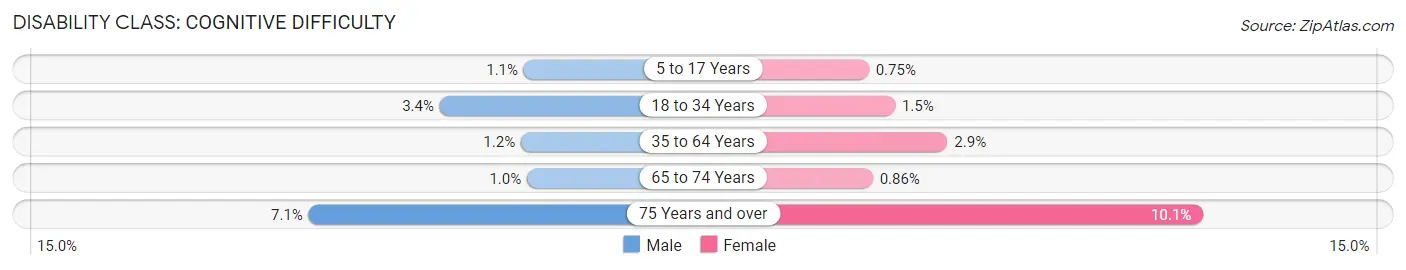
| Age Bracket | Male | Female |
| 5 to 17 Years | 23 (1.1%) | 14 (0.7%) |
| 18 to 34 Years | 55 (3.4%) | 26 (1.5%) |
| 35 to 64 Years | 42 (1.2%) | 107 (2.9%) |
| 65 to 74 Years | 11 (1.0%) | 9 (0.9%) |
| 75 Years and over | 21 (7.1%) | 62 (10.1%) |
Disability Class: Ambulatory Difficulty
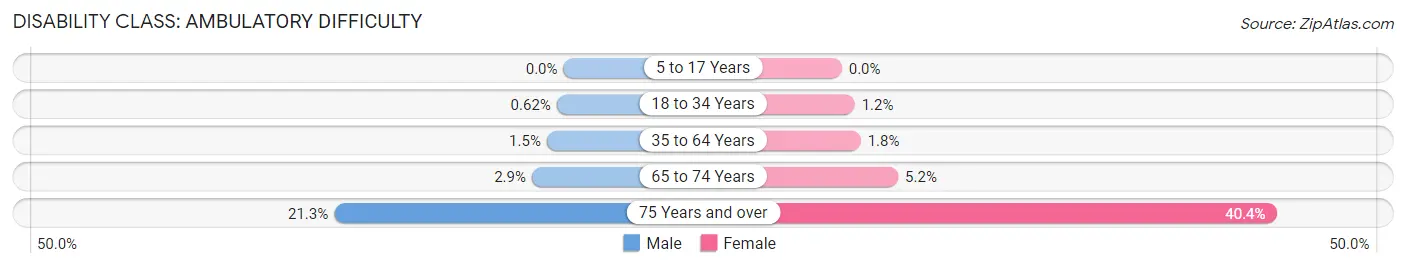
| Age Bracket | Male | Female |
| 5 to 17 Years | 0 (0.0%) | 0 (0.0%) |
| 18 to 34 Years | 10 (0.6%) | 21 (1.2%) |
| 35 to 64 Years | 55 (1.5%) | 64 (1.8%) |
| 65 to 74 Years | 32 (2.9%) | 55 (5.2%) |
| 75 Years and over | 63 (21.3%) | 249 (40.4%) |
Disability Class: Self-Care Difficulty
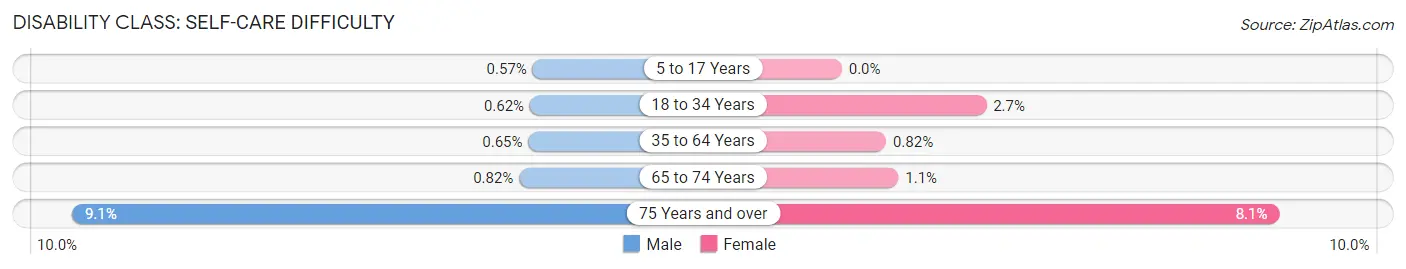
| Age Bracket | Male | Female |
| 5 to 17 Years | 12 (0.6%) | 0 (0.0%) |
| 18 to 34 Years | 10 (0.6%) | 47 (2.7%) |
| 35 to 64 Years | 23 (0.6%) | 30 (0.8%) |
| 65 to 74 Years | 9 (0.8%) | 11 (1.1%) |
| 75 Years and over | 27 (9.1%) | 50 (8.1%) |
Technology Access in Springboro
Computing Device Access in Springboro
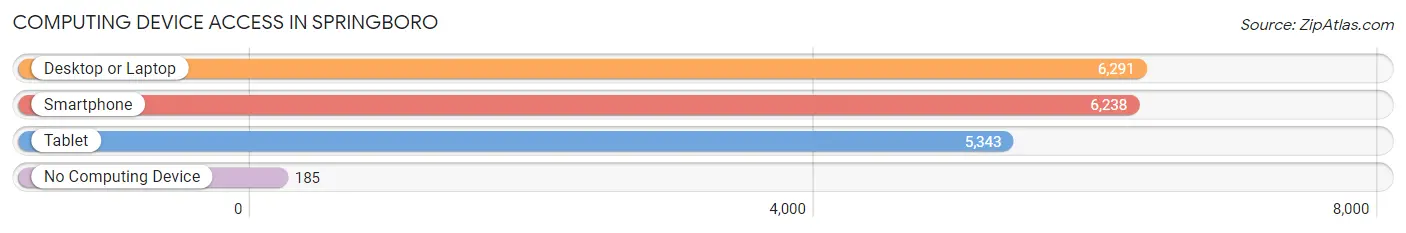
| Device Type | # Households | % Households |
| Desktop or Laptop | 6,291 | 93.2% |
| Smartphone | 6,238 | 92.4% |
| Tablet | 5,343 | 79.2% |
| No Computing Device | 185 | 2.7% |
| Total | 6,750 | 100.0% |
Internet Access in Springboro
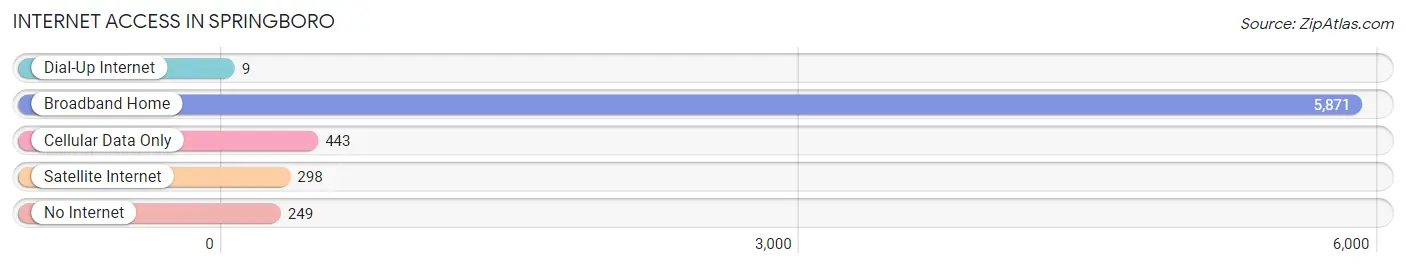
| Internet Type | # Households | % Households |
| Dial-Up Internet | 9 | 0.1% |
| Broadband Home | 5,871 | 87.0% |
| Cellular Data Only | 443 | 6.6% |
| Satellite Internet | 298 | 4.4% |
| No Internet | 249 | 3.7% |
| Total | 6,750 | 100.0% |
Springboro Summary
History
Springboro, Ohio is a city located in Warren and Montgomery counties in the southwestern part of the state. It is part of the Dayton metropolitan area and is located about 25 miles south of Dayton. The city was founded in 1815 by Jonathan Wright, a Revolutionary War veteran, and was originally known as Springborough. The name was changed to Springboro in 1837.
The city was an important stop on the Underground Railroad, with many of the city’s residents helping to hide and transport escaped slaves. The city was also home to a number of prominent abolitionists, including the Reverend John Rankin, who was a leader in the anti-slavery movement.
In the late 19th century, Springboro became a popular summer resort destination for wealthy families from Cincinnati and Dayton. The city was home to several large resorts, including the Springboro Hotel, which was built in 1876 and was one of the largest hotels in the state at the time.
The city was also home to a number of manufacturing businesses, including the Springboro Manufacturing Company, which produced agricultural implements, and the Springboro Foundry, which produced cast iron products.
Geography
Springboro is located in southwestern Ohio, about 25 miles south of Dayton. The city is situated in both Warren and Montgomery counties, with the majority of the city located in Warren County. The city covers an area of approximately 10.5 square miles, with a population of 17,409 as of the 2010 census.
The city is located in the Miami Valley region of Ohio, which is characterized by rolling hills and fertile farmland. The city is situated along the Little Miami River, which flows through the city and is a popular destination for fishing and canoeing.
Economy
The economy of Springboro is largely based on manufacturing and retail. The city is home to a number of manufacturing businesses, including the Springboro Manufacturing Company, which produces agricultural implements, and the Springboro Foundry, which produces cast iron products.
The city is also home to a number of retail businesses, including a number of antique stores, specialty shops, and restaurants. The city is also home to a number of corporate offices, including the headquarters of the Dayton Power and Light Company.
Demographics
As of the 2010 census, the population of Springboro was 17,409. The racial makeup of the city was 92.3% White, 3.3% African American, 0.3% Native American, 1.7% Asian, 0.1% Pacific Islander, and 2.3% from other races. Hispanic or Latino of any race were 3.2% of the population.
The median household income in Springboro was $76,845, and the median family income was $90,945. The per capita income for the city was $35,945. About 4.2% of families and 5.3% of the population were below the poverty line, including 6.3% of those under age 18 and 4.2% of those age 65 or over.
Common Questions
What is Per Capita Income in Springboro?
Per Capita income in Springboro is $46,606.
What is the Median Family Income in Springboro?
Median Family Income in Springboro is $121,521.
What is the Median Household income in Springboro?
Median Household Income in Springboro is $113,182.
What is Income or Wage Gap in Springboro?
Income or Wage Gap in Springboro is 45.2%.
Women in Springboro earn 54.8 cents for every dollar earned by a man.
What is Inequality or Gini Index in Springboro?
Inequality or Gini Index in Springboro is 0.37.
What is the Total Population of Springboro?
Total Population of Springboro is 19,218.
What is the Total Male Population of Springboro?
Total Male Population of Springboro is 9,428.
What is the Total Female Population of Springboro?
Total Female Population of Springboro is 9,790.
What is the Ratio of Males per 100 Females in Springboro?
There are 96.30 Males per 100 Females in Springboro.
What is the Ratio of Females per 100 Males in Springboro?
There are 103.84 Females per 100 Males in Springboro.
What is the Median Population Age in Springboro?
Median Population Age in Springboro is 37.7 Years.
What is the Average Family Size in Springboro
Average Family Size in Springboro is 3.1 People.
What is the Average Household Size in Springboro
Average Household Size in Springboro is 2.8 People.
How Large is the Labor Force in Springboro?
There are 9,771 People in the Labor Forcein in Springboro.
What is the Percentage of People in the Labor Force in Springboro?
66.8% of People are in the Labor Force in Springboro.
What is the Unemployment Rate in Springboro?
Unemployment Rate in Springboro is 4.6%.