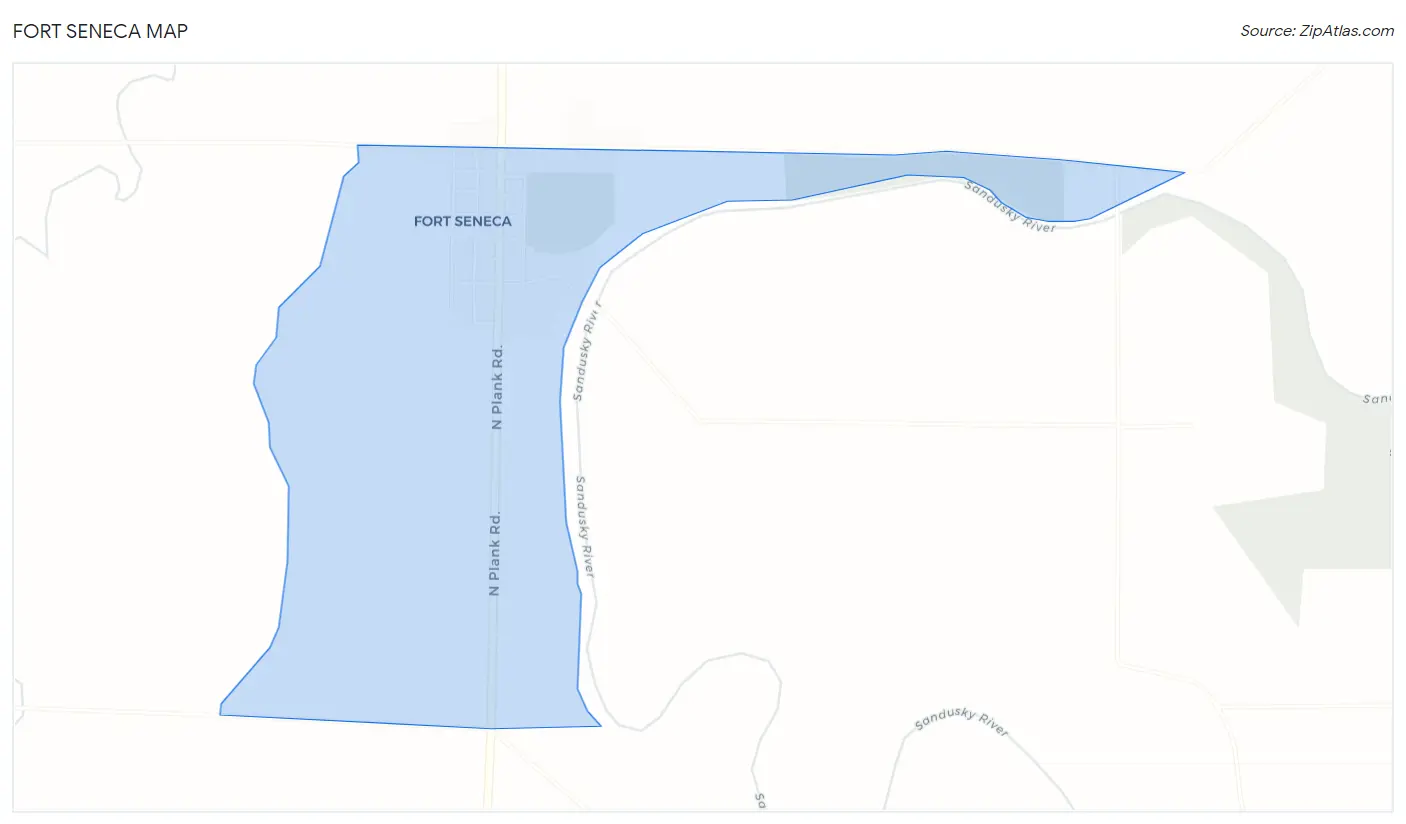
Fort Seneca, OH Map & Demographics
Fort Seneca Map
Fort Seneca Overview
$29,442
PER CAPITA INCOME
$75,595
AVG FAMILY INCOME
$75,119
AVG HOUSEHOLD INCOME
0.28
INEQUALITY / GINI INDEX
118
TOTAL POPULATION
48
MALE POPULATION
70
FEMALE POPULATION
68.57
MALES / 100 FEMALES
145.83
FEMALES / 100 MALES
54.6
MEDIAN AGE
2.5
AVG FAMILY SIZE
2.3
AVG HOUSEHOLD SIZE
47
LABOR FORCE [ PEOPLE ]
44.8%
PERCENT IN LABOR FORCE
14.9%
UNEMPLOYMENT RATE
Income in Fort Seneca
Income Overview in Fort Seneca
Per Capita Income in Fort Seneca is $29,442, while median incomes of families and households are $75,595 and $75,119 respectively.
| Characteristic | Number | Measure |
| Per Capita Income | 118 | $29,442 |
| Median Family Income | 44 | $75,595 |
| Mean Family Income | 44 | $78,064 |
| Median Household Income | 52 | $75,119 |
| Mean Household Income | 52 | $68,377 |
| Income Deficit | 44 | $0 |
| Wage / Income Gap (%) | 118 | 0.00% |
| Wage / Income Gap ($) | 118 | 100.00¢ per $1 |
| Gini / Inequality Index | 118 | 0.28 |
Earnings by Sex in Fort Seneca
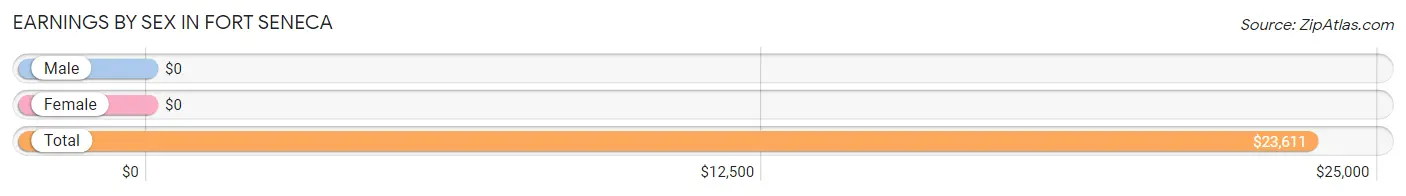
| Sex | Number | Average Earnings |
| Male | 16 (25.0%) | $0 |
| Female | 48 (75.0%) | $0 |
| Total | 64 (100.0%) | $23,611 |
Earnings by Sex by Income Bracket in Fort Seneca
The most common earnings brackets in Fort Seneca are $50,000 to $54,999 for men (10 | 62.5%) and $22,500 to $24,999 for women (18 | 37.5%).
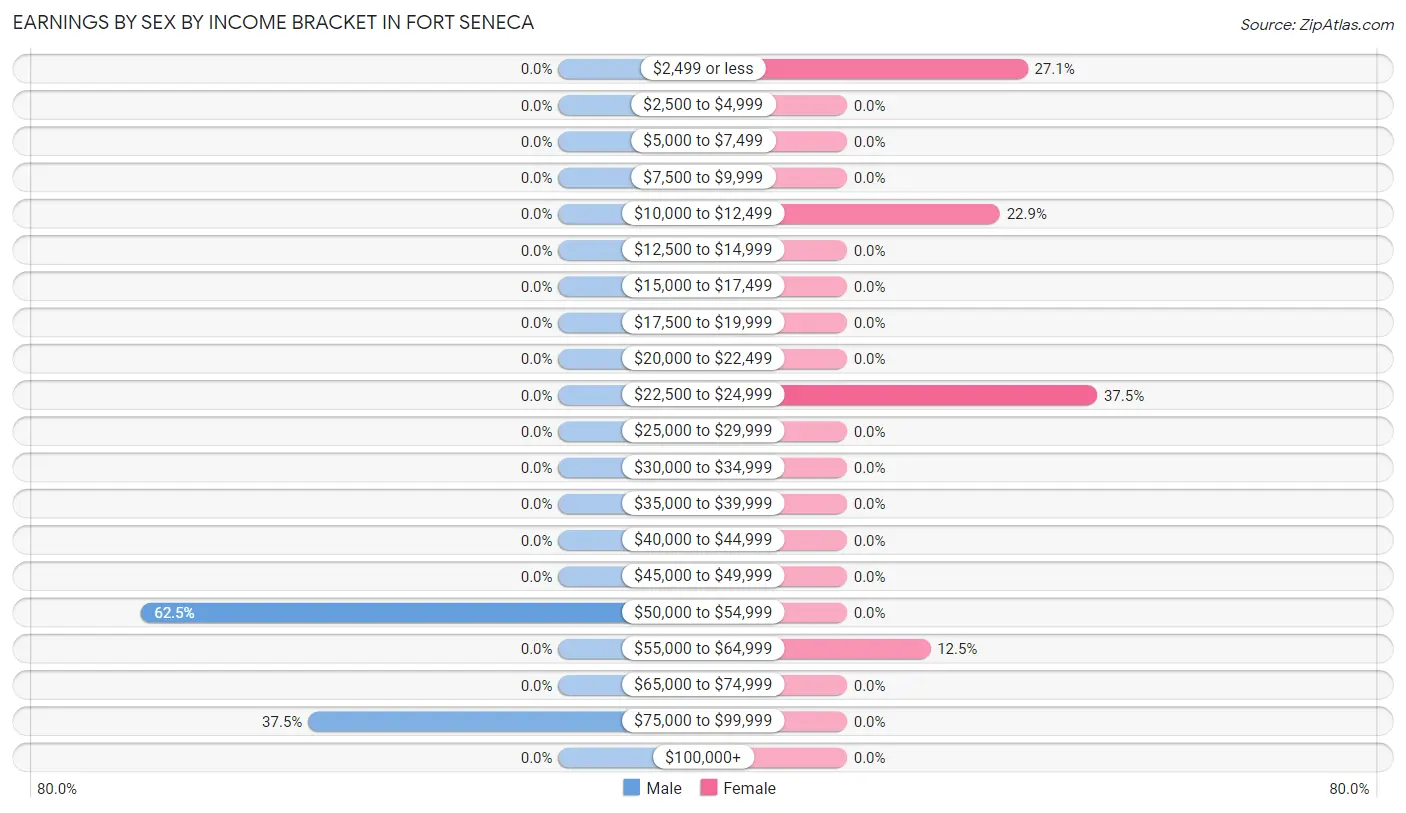
| Income | Male | Female |
| $2,499 or less | 0 (0.0%) | 13 (27.1%) |
| $2,500 to $4,999 | 0 (0.0%) | 0 (0.0%) |
| $5,000 to $7,499 | 0 (0.0%) | 0 (0.0%) |
| $7,500 to $9,999 | 0 (0.0%) | 0 (0.0%) |
| $10,000 to $12,499 | 0 (0.0%) | 11 (22.9%) |
| $12,500 to $14,999 | 0 (0.0%) | 0 (0.0%) |
| $15,000 to $17,499 | 0 (0.0%) | 0 (0.0%) |
| $17,500 to $19,999 | 0 (0.0%) | 0 (0.0%) |
| $20,000 to $22,499 | 0 (0.0%) | 0 (0.0%) |
| $22,500 to $24,999 | 0 (0.0%) | 18 (37.5%) |
| $25,000 to $29,999 | 0 (0.0%) | 0 (0.0%) |
| $30,000 to $34,999 | 0 (0.0%) | 0 (0.0%) |
| $35,000 to $39,999 | 0 (0.0%) | 0 (0.0%) |
| $40,000 to $44,999 | 0 (0.0%) | 0 (0.0%) |
| $45,000 to $49,999 | 0 (0.0%) | 0 (0.0%) |
| $50,000 to $54,999 | 10 (62.5%) | 0 (0.0%) |
| $55,000 to $64,999 | 0 (0.0%) | 6 (12.5%) |
| $65,000 to $74,999 | 0 (0.0%) | 0 (0.0%) |
| $75,000 to $99,999 | 6 (37.5%) | 0 (0.0%) |
| $100,000+ | 0 (0.0%) | 0 (0.0%) |
| Total | 16 (100.0%) | 48 (100.0%) |
Earnings by Sex by Educational Attainment in Fort Seneca
| Educational Attainment | Male Income | Female Income |
| Less than High School | - | - |
| High School Diploma | - | - |
| College or Associate's Degree | - | - |
| Bachelor's Degree | - | - |
| Graduate Degree | - | - |
| Total | - | - |
Family Income in Fort Seneca
Family Income Brackets in Fort Seneca
According to the Fort Seneca family income data, there are 21 families falling into the $75,000 to $99,999 income range, which is the most common income bracket and makes up 47.7% of all families.
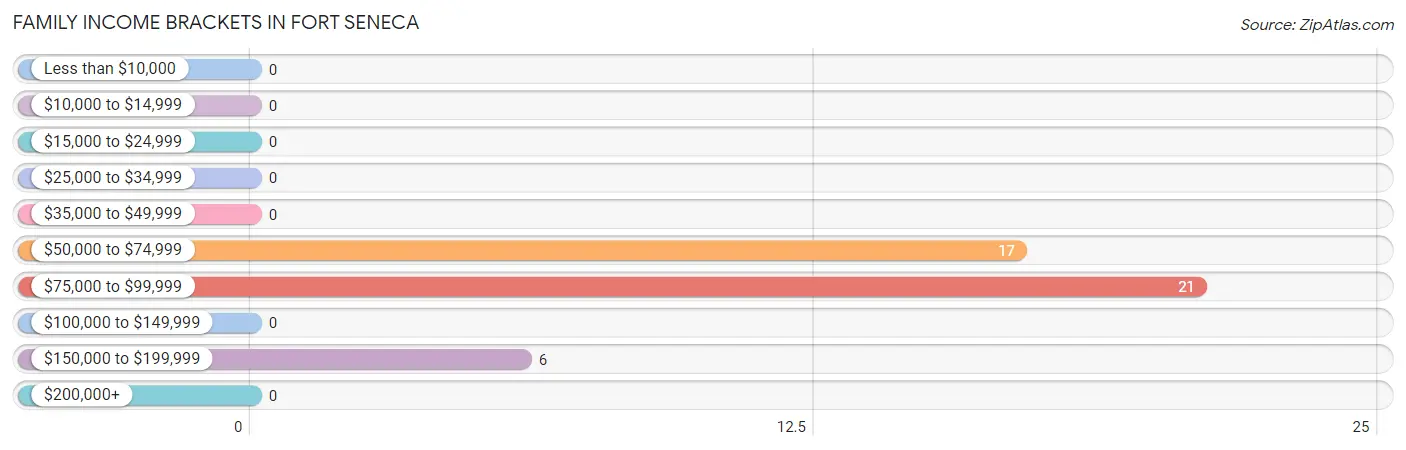
| Income Bracket | # Families | % Families |
| Less than $10,000 | 0 | 0.0% |
| $10,000 to $14,999 | 0 | 0.0% |
| $15,000 to $24,999 | 0 | 0.0% |
| $25,000 to $34,999 | 0 | 0.0% |
| $35,000 to $49,999 | 0 | 0.0% |
| $50,000 to $74,999 | 17 | 38.6% |
| $75,000 to $99,999 | 21 | 47.7% |
| $100,000 to $149,999 | 0 | 0.0% |
| $150,000 to $199,999 | 6 | 13.6% |
| $200,000+ | 0 | 0.0% |
Family Income by Famaliy Size in Fort Seneca
2-person families (29 | 65.9%) account for the highest median family income in Fort Seneca with $75,774 per family, while 2-person families (29 | 65.9%) have the highest median income of $37,887 per family member.
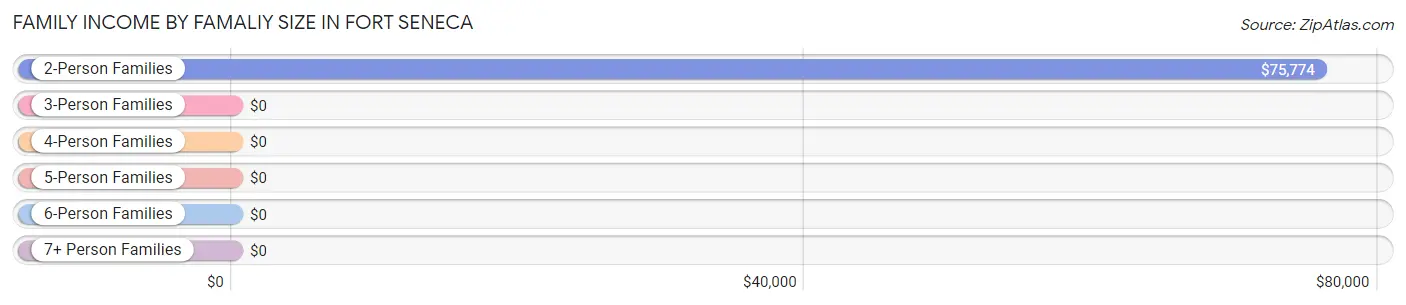
| Income Bracket | # Families | Median Income |
| 2-Person Families | 29 (65.9%) | $75,774 |
| 3-Person Families | 9 (20.4%) | $0 |
| 4-Person Families | 0 (0.0%) | $0 |
| 5-Person Families | 6 (13.6%) | $0 |
| 6-Person Families | 0 (0.0%) | $0 |
| 7+ Person Families | 0 (0.0%) | $0 |
| Total | 44 (100.0%) | $75,595 |
Family Income by Number of Earners in Fort Seneca
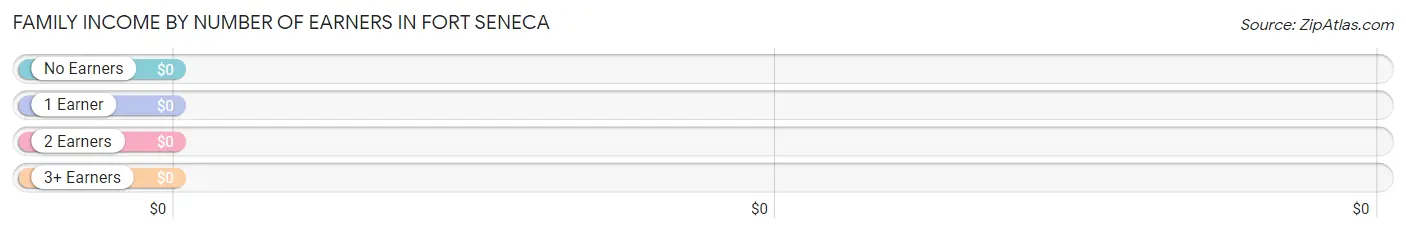
| Number of Earners | # Families | Median Income |
| No Earners | 8 (18.2%) | $0 |
| 1 Earner | 20 (45.5%) | $0 |
| 2 Earners | 10 (22.7%) | $0 |
| 3+ Earners | 6 (13.6%) | $0 |
| Total | 44 (100.0%) | $75,595 |
Household Income in Fort Seneca
Household Income Brackets in Fort Seneca
With 21 households falling in the category, the $75,000 to $99,999 income range is the most frequent in Fort Seneca, accounting for 40.4% of all households.
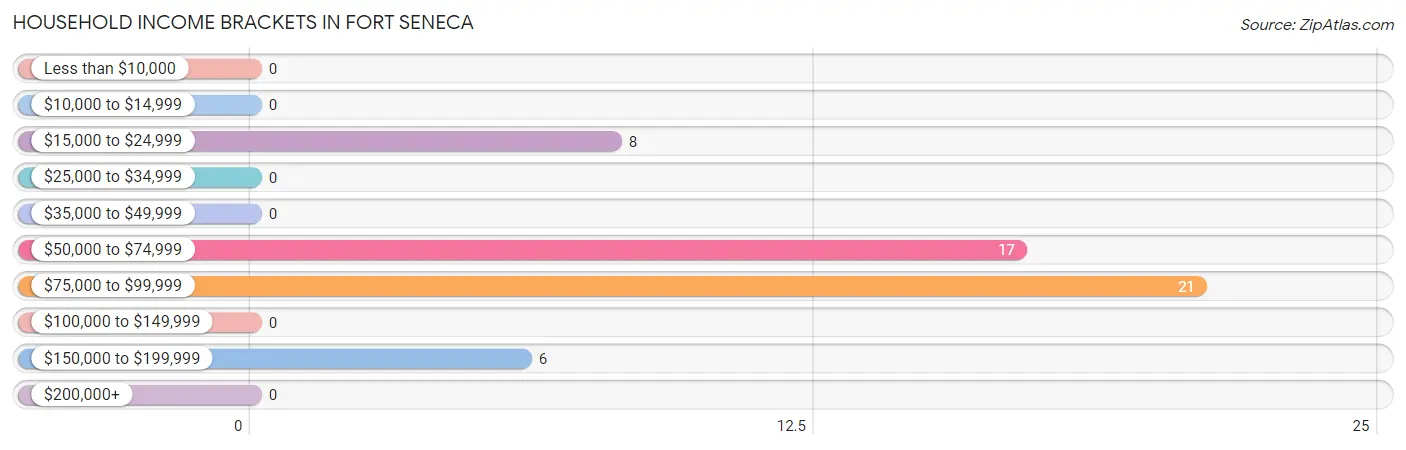
| Income Bracket | # Households | % Households |
| Less than $10,000 | 0 | 0.0% |
| $10,000 to $14,999 | 0 | 0.0% |
| $15,000 to $24,999 | 8 | 15.4% |
| $25,000 to $34,999 | 0 | 0.0% |
| $35,000 to $49,999 | 0 | 0.0% |
| $50,000 to $74,999 | 17 | 32.7% |
| $75,000 to $99,999 | 21 | 40.4% |
| $100,000 to $149,999 | 0 | 0.0% |
| $150,000 to $199,999 | 6 | 11.5% |
| $200,000+ | 0 | 0.0% |
Household Income by Householder Age in Fort Seneca
The median household income in Fort Seneca is $75,119, with the highest median household income of $54,028 found in the 45 to 64 years age bracket for the primary householder. A total of 27 households (51.9%) fall into this category.
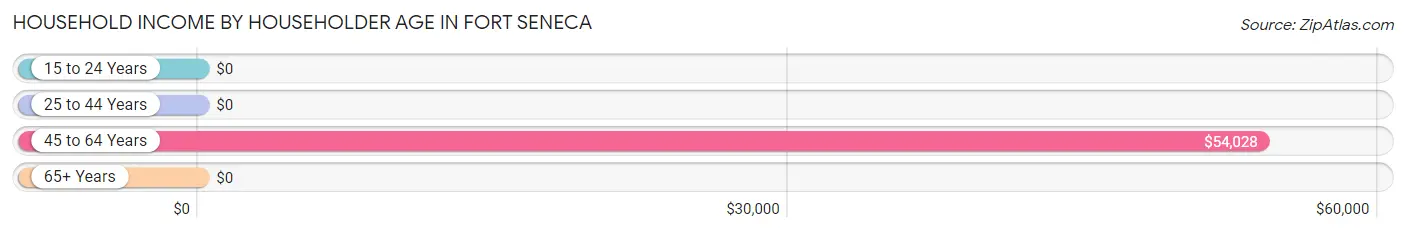
| Income Bracket | # Households | Median Income |
| 15 to 24 Years | 0 (0.0%) | $0 |
| 25 to 44 Years | 6 (11.5%) | $0 |
| 45 to 64 Years | 27 (51.9%) | $54,028 |
| 65+ Years | 19 (36.5%) | $0 |
| Total | 52 (100.0%) | $75,119 |
Poverty in Fort Seneca
Income Below Poverty by Sex and Age in Fort Seneca
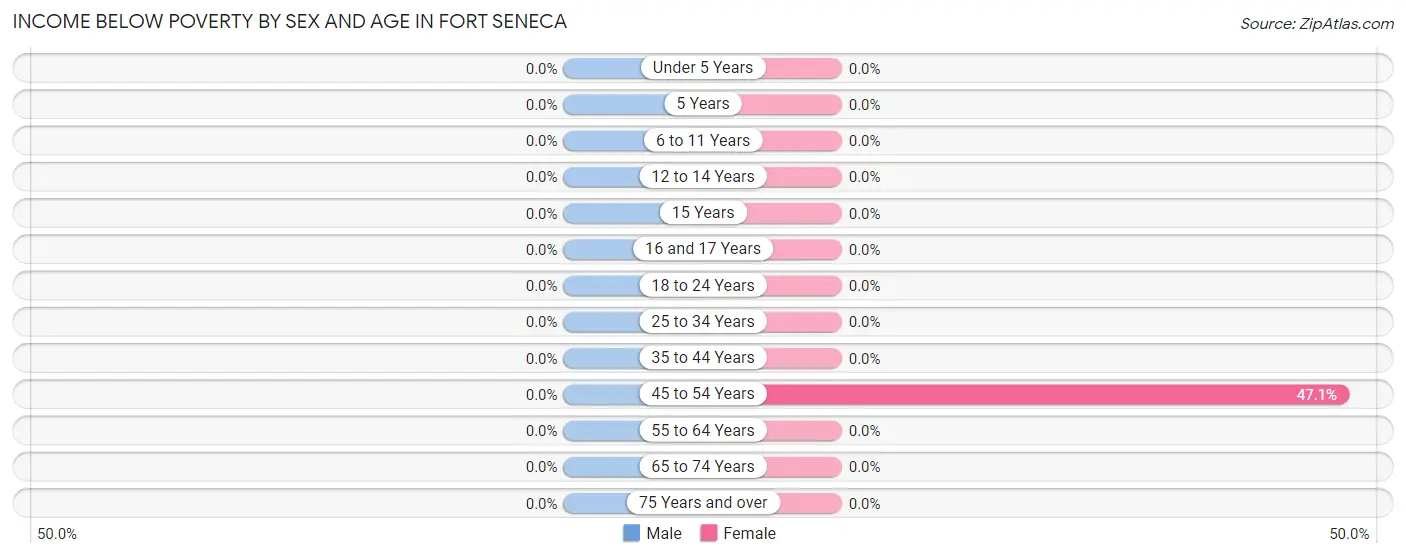
| Age Bracket | Male | Female |
| Under 5 Years | 0 (0.0%) | 0 (0.0%) |
| 5 Years | 0 (0.0%) | 0 (0.0%) |
| 6 to 11 Years | 0 (0.0%) | 0 (0.0%) |
| 12 to 14 Years | 0 (0.0%) | 0 (0.0%) |
| 15 Years | 0 (0.0%) | 0 (0.0%) |
| 16 and 17 Years | 0 (0.0%) | 0 (0.0%) |
| 18 to 24 Years | 0 (0.0%) | 0 (0.0%) |
| 25 to 34 Years | 0 (0.0%) | 0 (0.0%) |
| 35 to 44 Years | 0 (0.0%) | 0 (0.0%) |
| 45 to 54 Years | 0 (0.0%) | 8 (47.1%) |
| 55 to 64 Years | 0 (0.0%) | 0 (0.0%) |
| 65 to 74 Years | 0 (0.0%) | 0 (0.0%) |
| 75 Years and over | 0 (0.0%) | 0 (0.0%) |
| Total | 0 (0.0%) | 8 (11.4%) |
Income Above Poverty by Sex and Age in Fort Seneca
According to the poverty statistics in Fort Seneca, males aged 12 to 14 years and females aged 6 to 11 years are the age groups that are most secure financially, with 100.0% of males and 100.0% of females in these age groups living above the poverty line.
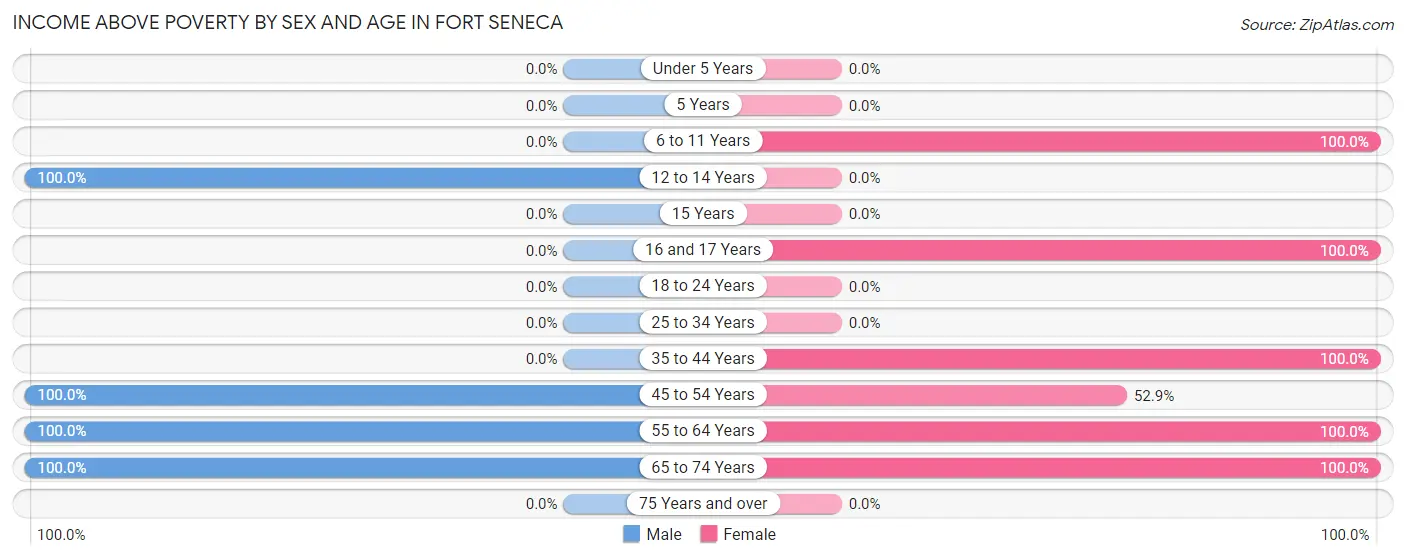
| Age Bracket | Male | Female |
| Under 5 Years | 0 (0.0%) | 0 (0.0%) |
| 5 Years | 0 (0.0%) | 0 (0.0%) |
| 6 to 11 Years | 0 (0.0%) | 7 (100.0%) |
| 12 to 14 Years | 6 (100.0%) | 0 (0.0%) |
| 15 Years | 0 (0.0%) | 0 (0.0%) |
| 16 and 17 Years | 0 (0.0%) | 13 (100.0%) |
| 18 to 24 Years | 0 (0.0%) | 0 (0.0%) |
| 25 to 34 Years | 0 (0.0%) | 0 (0.0%) |
| 35 to 44 Years | 0 (0.0%) | 6 (100.0%) |
| 45 to 54 Years | 13 (100.0%) | 9 (52.9%) |
| 55 to 64 Years | 10 (100.0%) | 20 (100.0%) |
| 65 to 74 Years | 19 (100.0%) | 7 (100.0%) |
| 75 Years and over | 0 (0.0%) | 0 (0.0%) |
| Total | 48 (100.0%) | 62 (88.6%) |
Income Below Poverty Among Married-Couple Families in Fort Seneca
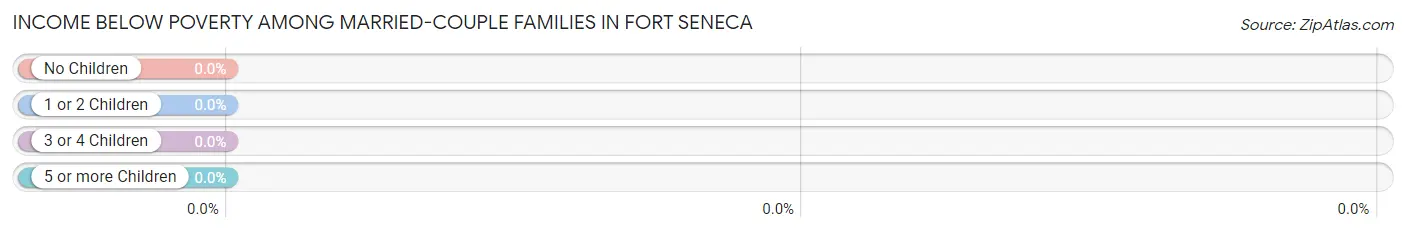
| Children | Above Poverty | Below Poverty |
| No Children | 29 (100.0%) | 0 (0.0%) |
| 1 or 2 Children | 9 (100.0%) | 0 (0.0%) |
| 3 or 4 Children | 6 (100.0%) | 0 (0.0%) |
| 5 or more Children | 0 (0.0%) | 0 (0.0%) |
| Total | 44 (100.0%) | 0 (0.0%) |
Income Below Poverty Among Single-Parent Households in Fort Seneca
| Children | Single Father | Single Mother |
| No Children | 0 (0.0%) | 0 (0.0%) |
| 1 or 2 Children | 0 (0.0%) | 0 (0.0%) |
| 3 or 4 Children | 0 (0.0%) | 0 (0.0%) |
| 5 or more Children | 0 (0.0%) | 0 (0.0%) |
| Total | 0 (0.0%) | 0 (0.0%) |
Income Below Poverty Among Married-Couple vs Single-Parent Households in Fort Seneca
| Children | Married-Couple Families | Single-Parent Households |
| No Children | 0 (0.0%) | 0 (0.0%) |
| 1 or 2 Children | 0 (0.0%) | 0 (0.0%) |
| 3 or 4 Children | 0 (0.0%) | 0 (0.0%) |
| 5 or more Children | 0 (0.0%) | 0 (0.0%) |
| Total | 0 (0.0%) | 0 (0.0%) |
Race in Fort Seneca
The most populous races in Fort Seneca are , and White / Caucasian (118 | 100.0%).
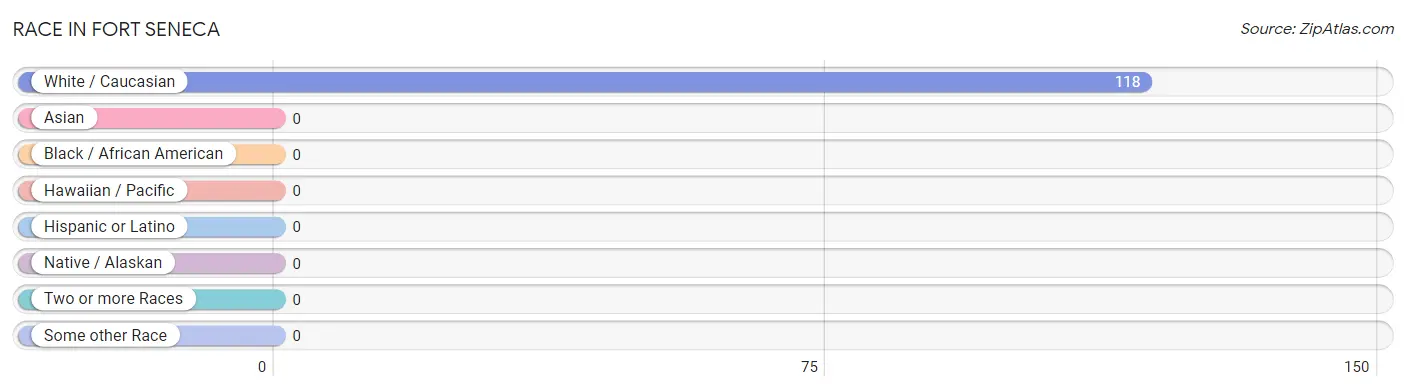
| Race | # Population | % Population |
| Asian | 0 | 0.0% |
| Black / African American | 0 | 0.0% |
| Hawaiian / Pacific | 0 | 0.0% |
| Hispanic or Latino | 0 | 0.0% |
| Native / Alaskan | 0 | 0.0% |
| White / Caucasian | 118 | 100.0% |
| Two or more Races | 0 | 0.0% |
| Some other Race | 0 | 0.0% |
| Total | 118 | 100.0% |
Ancestry in Fort Seneca
The most populous ancestries reported in Fort Seneca are German (50 | 42.4%), American (11 | 9.3%), Swiss (10 | 8.5%), Irish (9 | 7.6%), and Italian (8 | 6.8%), together accounting for 74.6% of all Fort Seneca residents.
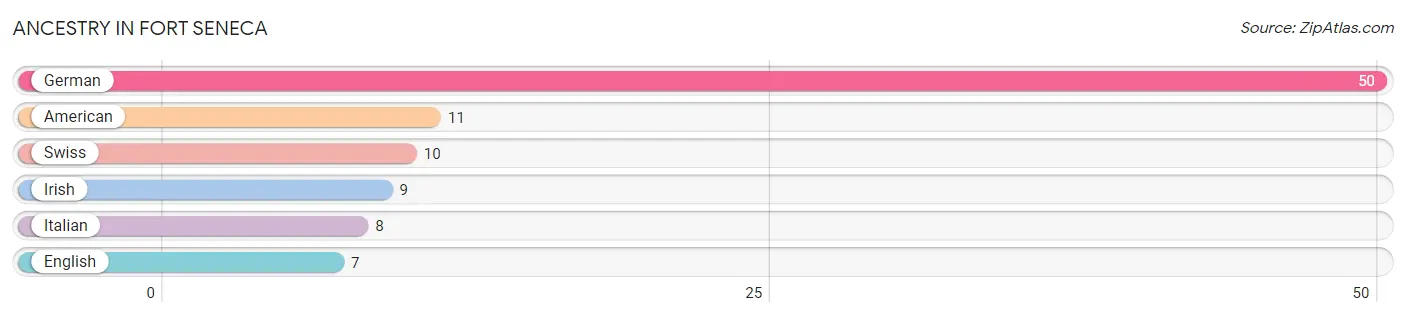
| Ancestry | # Population | % Population |
| American | 11 | 9.3% |
| English | 7 | 5.9% |
| German | 50 | 42.4% |
| Irish | 9 | 7.6% |
| Italian | 8 | 6.8% |
| Swiss | 10 | 8.5% | View All 6 Rows |
Immigrants in Fort Seneca

| Immigration Origin | # Population | % Population | View All 0 Rows |
Sex and Age in Fort Seneca
Sex and Age in Fort Seneca
The most populous age groups in Fort Seneca are 70 to 74 Years (19 | 39.6%) for men and 60 to 64 Years (20 | 28.6%) for women.
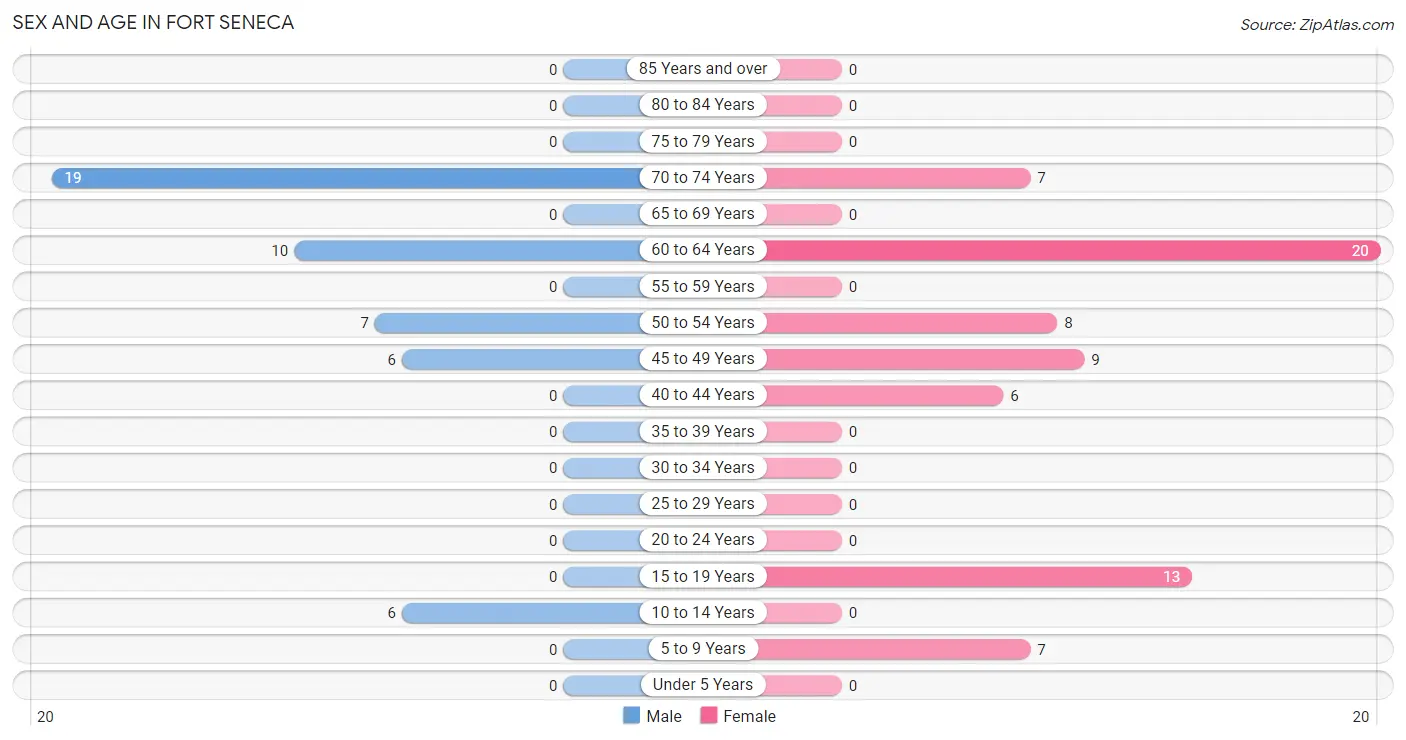
| Age Bracket | Male | Female |
| Under 5 Years | 0 (0.0%) | 0 (0.0%) |
| 5 to 9 Years | 0 (0.0%) | 7 (10.0%) |
| 10 to 14 Years | 6 (12.5%) | 0 (0.0%) |
| 15 to 19 Years | 0 (0.0%) | 13 (18.6%) |
| 20 to 24 Years | 0 (0.0%) | 0 (0.0%) |
| 25 to 29 Years | 0 (0.0%) | 0 (0.0%) |
| 30 to 34 Years | 0 (0.0%) | 0 (0.0%) |
| 35 to 39 Years | 0 (0.0%) | 0 (0.0%) |
| 40 to 44 Years | 0 (0.0%) | 6 (8.6%) |
| 45 to 49 Years | 6 (12.5%) | 9 (12.9%) |
| 50 to 54 Years | 7 (14.6%) | 8 (11.4%) |
| 55 to 59 Years | 0 (0.0%) | 0 (0.0%) |
| 60 to 64 Years | 10 (20.8%) | 20 (28.6%) |
| 65 to 69 Years | 0 (0.0%) | 0 (0.0%) |
| 70 to 74 Years | 19 (39.6%) | 7 (10.0%) |
| 75 to 79 Years | 0 (0.0%) | 0 (0.0%) |
| 80 to 84 Years | 0 (0.0%) | 0 (0.0%) |
| 85 Years and over | 0 (0.0%) | 0 (0.0%) |
| Total | 48 (100.0%) | 70 (100.0%) |
Families and Households in Fort Seneca
Median Family Size in Fort Seneca
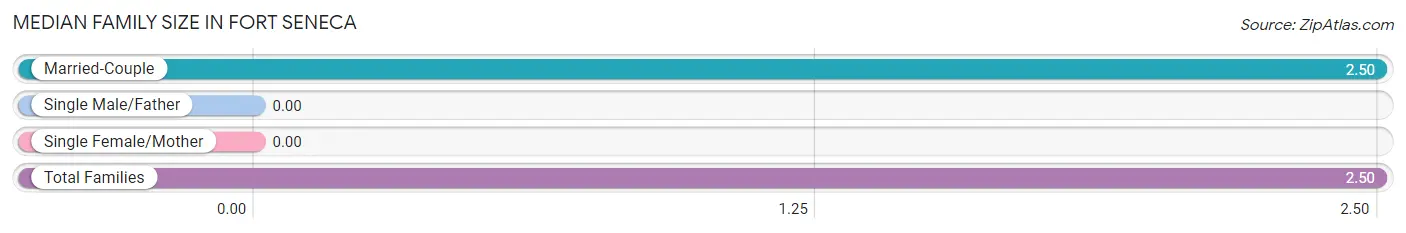
| Family Type | # Families | Family Size |
| Married-Couple | 44 (100.0%) | 2.50 |
| Single Male/Father | 0 (0.0%) | - |
| Single Female/Mother | 0 (0.0%) | - |
| Total Families | 44 (100.0%) | 2.50 |
Median Household Size in Fort Seneca
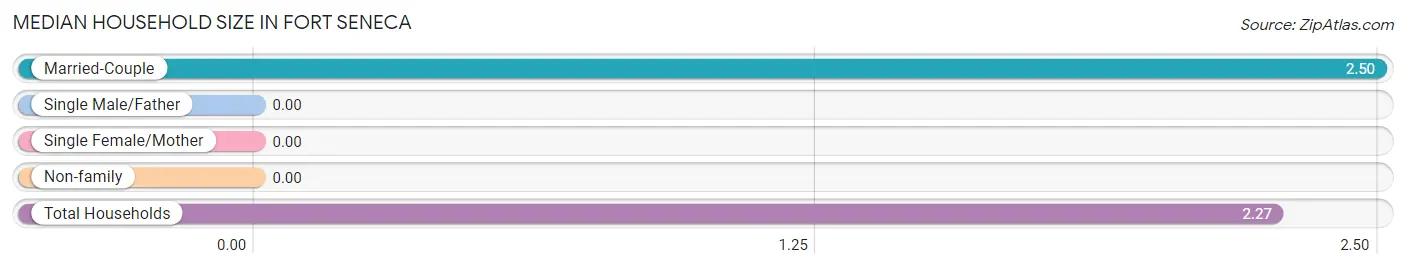
| Household Type | # Households | Household Size |
| Married-Couple | 44 (84.6%) | 2.50 |
| Single Male/Father | 0 (0.0%) | - |
| Single Female/Mother | 0 (0.0%) | - |
| Non-family | 8 (15.4%) | - |
| Total Households | 52 (100.0%) | 2.27 |
Household Size by Marriage Status in Fort Seneca
Out of a total of 52 households in Fort Seneca, 44 (84.6%) are family households, while 8 (15.4%) are nonfamily households. The most numerous type of family households are 2-person households, comprising 29, and the most common type of nonfamily households are 1-person households, comprising 8.
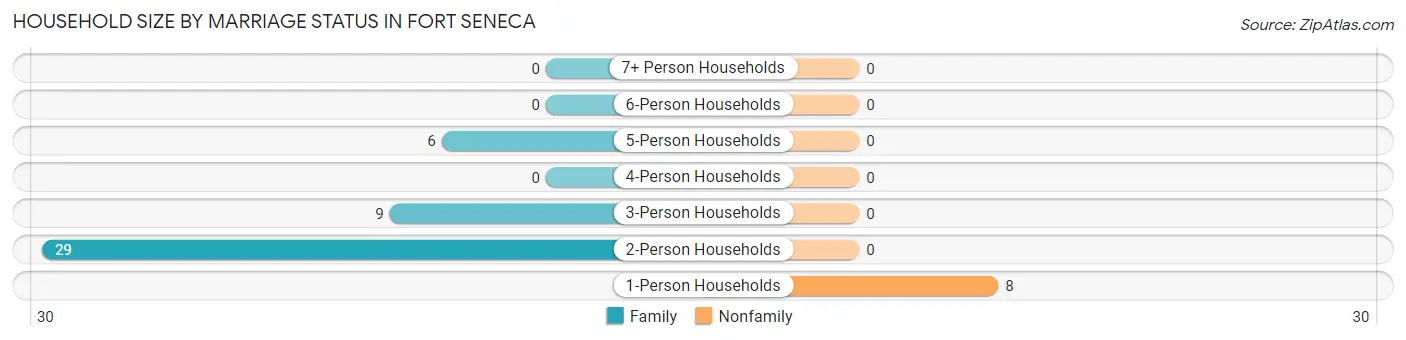
| Household Size | Family Households | Nonfamily Households |
| 1-Person Households | - | 8 (15.4%) |
| 2-Person Households | 29 (55.8%) | 0 (0.0%) |
| 3-Person Households | 9 (17.3%) | 0 (0.0%) |
| 4-Person Households | 0 (0.0%) | 0 (0.0%) |
| 5-Person Households | 6 (11.5%) | 0 (0.0%) |
| 6-Person Households | 0 (0.0%) | 0 (0.0%) |
| 7+ Person Households | 0 (0.0%) | 0 (0.0%) |
| Total | 44 (84.6%) | 8 (15.4%) |
Female Fertility in Fort Seneca
Fertility by Age in Fort Seneca
| Age Bracket | Women with Births | Births / 1,000 Women |
| 15 to 19 years | 0 (0.0%) | 0.0 |
| 20 to 34 years | 0 (0.0%) | 0.0 |
| 35 to 50 years | 0 (0.0%) | 0.0 |
| Total | 0 (0.0%) | 0.0 |
Fertility by Age by Marriage Status in Fort Seneca
| Age Bracket | Married | Unmarried |
| 15 to 19 years | 0 (0.0%) | 0 (0.0%) |
| 20 to 34 years | 0 (0.0%) | 0 (0.0%) |
| 35 to 50 years | 0 (0.0%) | 0 (0.0%) |
| Total | 0 (0.0%) | 0 (0.0%) |
Fertility by Education in Fort Seneca
| Educational Attainment | Women with Births | Births / 1,000 Women |
| Less than High School | 0 (0.0%) | 0.0 |
| High School Diploma | 0 (0.0%) | 0.0 |
| College or Associate's Degree | 0 (0.0%) | 0.0 |
| Bachelor's Degree | 0 (0.0%) | 0.0 |
| Graduate Degree | 0 (0.0%) | 0.0 |
| Total | 0 (0.0%) | 0.0 |
Fertility by Education by Marriage Status in Fort Seneca
| Educational Attainment | Married | Unmarried |
| Less than High School | 0 (0.0%) | 0 (0.0%) |
| High School Diploma | 0 (0.0%) | 0 (0.0%) |
| College or Associate's Degree | 0 (0.0%) | 0 (0.0%) |
| Bachelor's Degree | 0 (0.0%) | 0 (0.0%) |
| Graduate Degree | 0 (0.0%) | 0 (0.0%) |
| Total | 0 (0.0%) | 0 (0.0%) |
Employment Characteristics in Fort Seneca
Employment by Class of Employer in Fort Seneca
Among the 40 employed individuals in Fort Seneca, private company employees (34 | 85.0%), and state government employees (6 | 15.0%) make up the most common classes of employment.
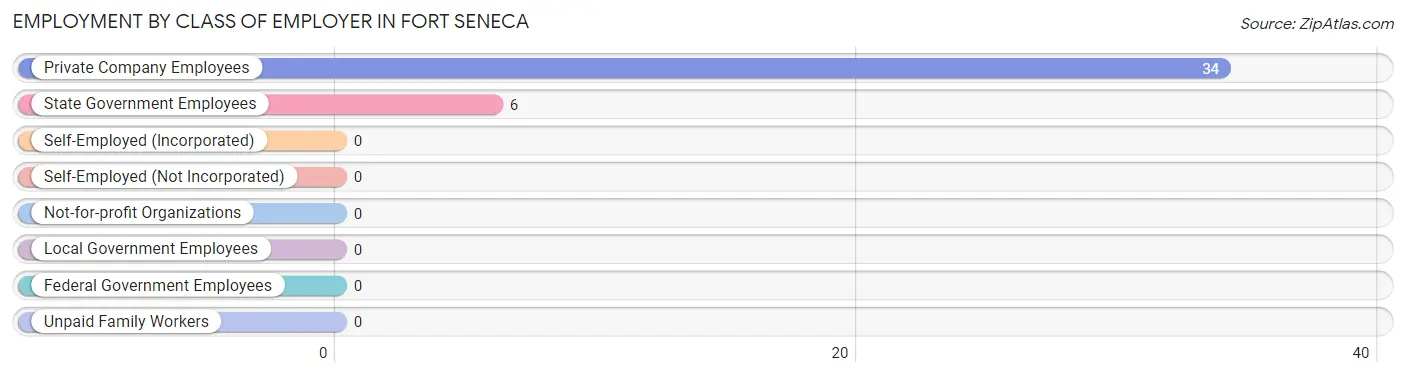
| Employer Class | # Employees | % Employees |
| Private Company Employees | 34 | 85.0% |
| Self-Employed (Incorporated) | 0 | 0.0% |
| Self-Employed (Not Incorporated) | 0 | 0.0% |
| Not-for-profit Organizations | 0 | 0.0% |
| Local Government Employees | 0 | 0.0% |
| State Government Employees | 6 | 15.0% |
| Federal Government Employees | 0 | 0.0% |
| Unpaid Family Workers | 0 | 0.0% |
| Total | 40 | 100.0% |
Employment Status by Age in Fort Seneca
According to the labor force statistics for Fort Seneca, out of the total population over 16 years of age (105), 44.8% or 47 individuals are in the labor force, with 14.9% or 7 of them unemployed. The age group with the highest labor force participation rate is 35 to 44 years, with 100.0% or 6 individuals in the labor force. Within the labor force, the 16 to 19 years age range has the highest percentage of unemployed individuals, with 100.0% or 7 of them being unemployed.
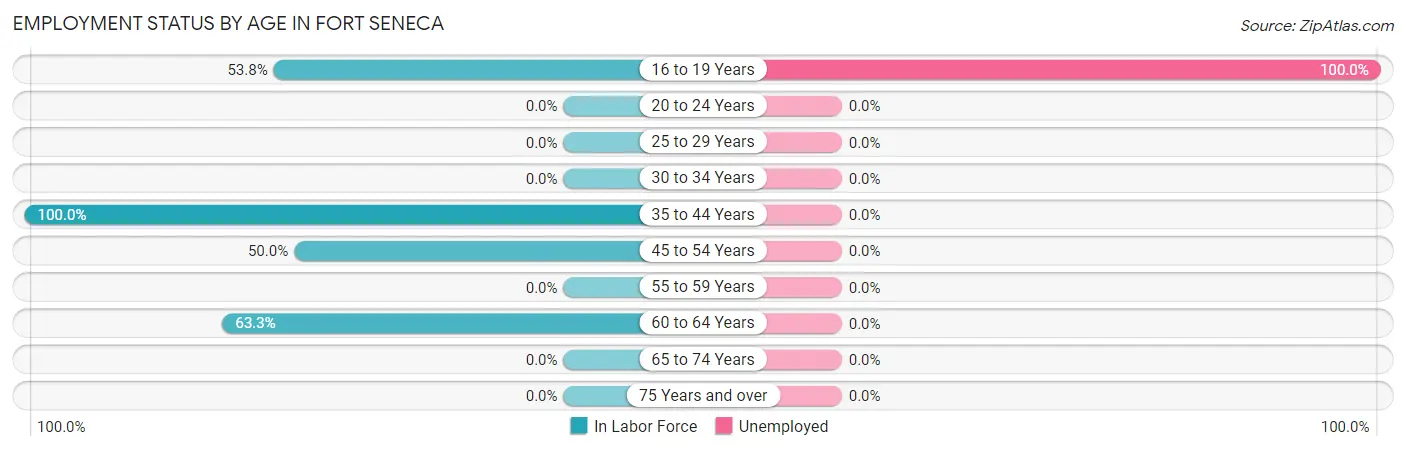
| Age Bracket | In Labor Force | Unemployed |
| 16 to 19 Years | 7 (53.8%) | 7 (100.0%) |
| 20 to 24 Years | 0 (0.0%) | 0 (0.0%) |
| 25 to 29 Years | 0 (0.0%) | 0 (0.0%) |
| 30 to 34 Years | 0 (0.0%) | 0 (0.0%) |
| 35 to 44 Years | 6 (100.0%) | 0 (0.0%) |
| 45 to 54 Years | 15 (50.0%) | 0 (0.0%) |
| 55 to 59 Years | 0 (0.0%) | 0 (0.0%) |
| 60 to 64 Years | 19 (63.3%) | 0 (0.0%) |
| 65 to 74 Years | 0 (0.0%) | 0 (0.0%) |
| 75 Years and over | 0 (0.0%) | 0 (0.0%) |
| Total | 47 (44.8%) | 7 (14.9%) |
Employment Status by Educational Attainment in Fort Seneca
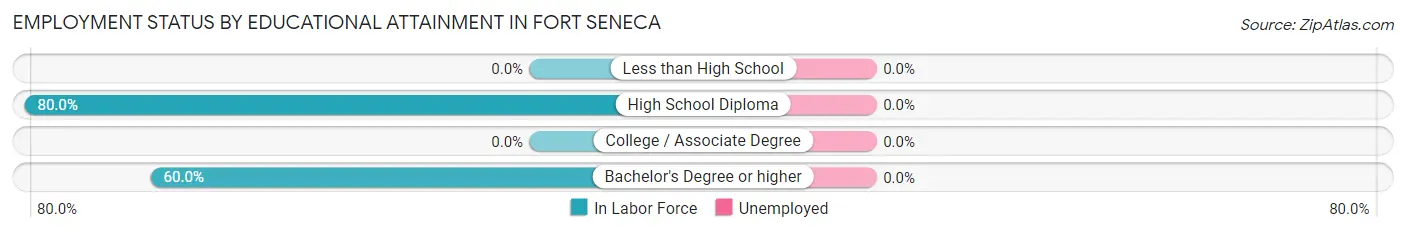
| Educational Attainment | In Labor Force | Unemployed |
| Less than High School | 0 (0.0%) | 0 (0.0%) |
| High School Diploma | 28 (80.0%) | 0 (0.0%) |
| College / Associate Degree | 0 (0.0%) | 0 (0.0%) |
| Bachelor's Degree or higher | 12 (60.0%) | 0 (0.0%) |
| Total | 40 (60.6%) | 0 (0.0%) |
Employment Occupations by Sex in Fort Seneca
Management, Business, Science and Arts Occupations
The most common Management, Business, Science and Arts occupations in Fort Seneca are Business & Financial (10 | 25.0%), Computers, Engineering & Science (6 | 15.0%), Architecture & Engineering (6 | 15.0%), Community & Social Service (6 | 15.0%), and Education Instruction & Library (6 | 15.0%).
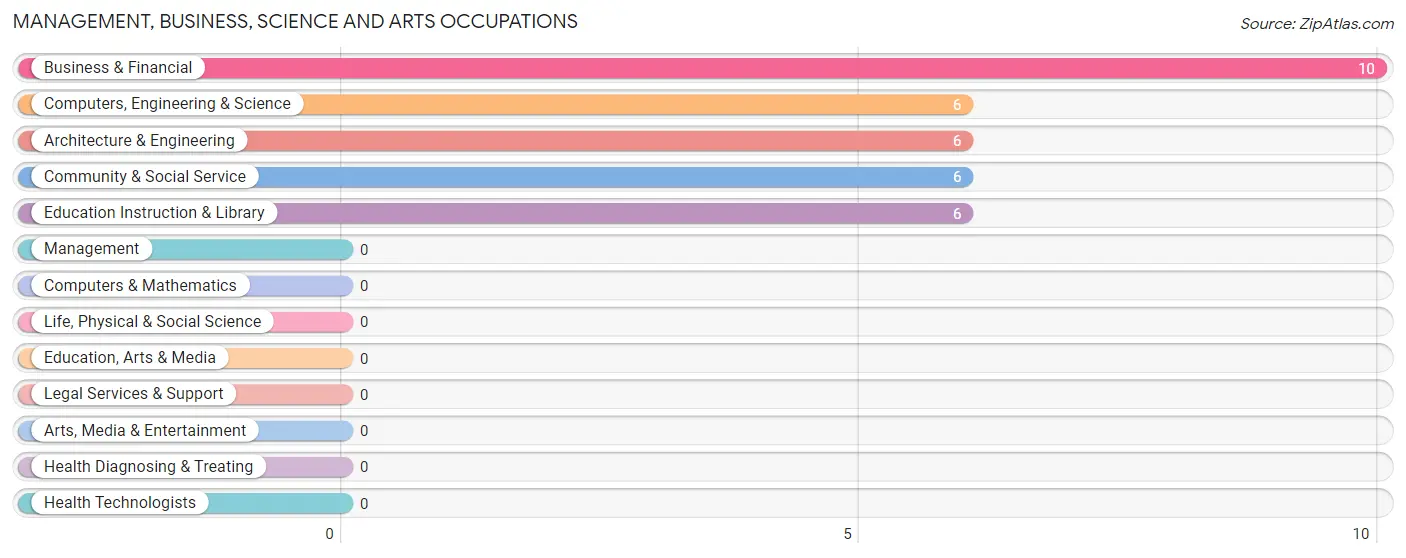
Management, Business, Science and Arts Occupations by Sex
Within the Management, Business, Science and Arts occupations in Fort Seneca, the most male-oriented occupations are Business & Financial (100.0%), Computers, Engineering & Science (100.0%), and Architecture & Engineering (100.0%), while the most female-oriented occupations are Community & Social Service (100.0%), and Education Instruction & Library (100.0%).
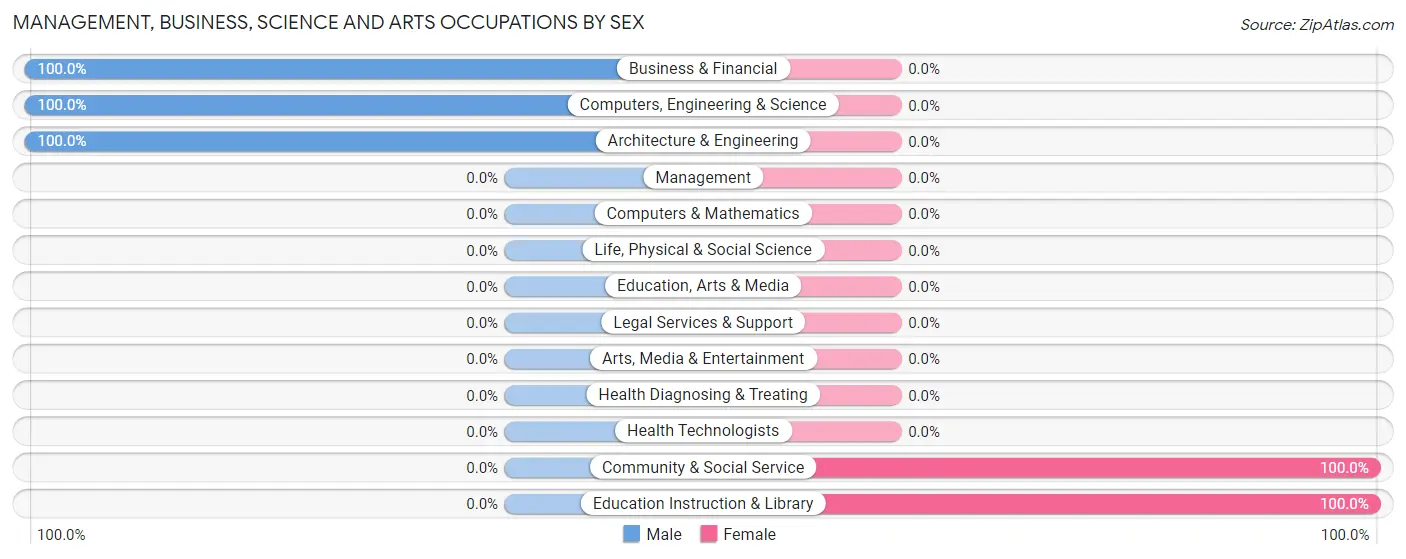
| Occupation | Male | Female |
| Management | 0 (0.0%) | 0 (0.0%) |
| Business & Financial | 10 (100.0%) | 0 (0.0%) |
| Computers, Engineering & Science | 6 (100.0%) | 0 (0.0%) |
| Computers & Mathematics | 0 (0.0%) | 0 (0.0%) |
| Architecture & Engineering | 6 (100.0%) | 0 (0.0%) |
| Life, Physical & Social Science | 0 (0.0%) | 0 (0.0%) |
| Community & Social Service | 0 (0.0%) | 6 (100.0%) |
| Education, Arts & Media | 0 (0.0%) | 0 (0.0%) |
| Legal Services & Support | 0 (0.0%) | 0 (0.0%) |
| Education Instruction & Library | 0 (0.0%) | 6 (100.0%) |
| Arts, Media & Entertainment | 0 (0.0%) | 0 (0.0%) |
| Health Diagnosing & Treating | 0 (0.0%) | 0 (0.0%) |
| Health Technologists | 0 (0.0%) | 0 (0.0%) |
| Total (Category) | 16 (72.7%) | 6 (27.3%) |
| Total (Overall) | 16 (40.0%) | 24 (60.0%) |
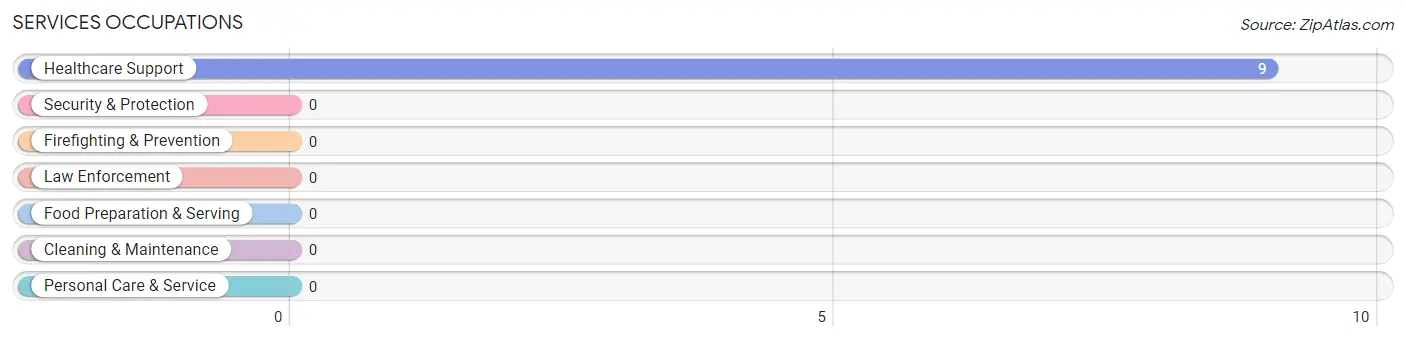
Services Occupations
The most common Services occupations in Fort Seneca are , and Healthcare Support (9 | 22.5%).
Services Occupations by Sex
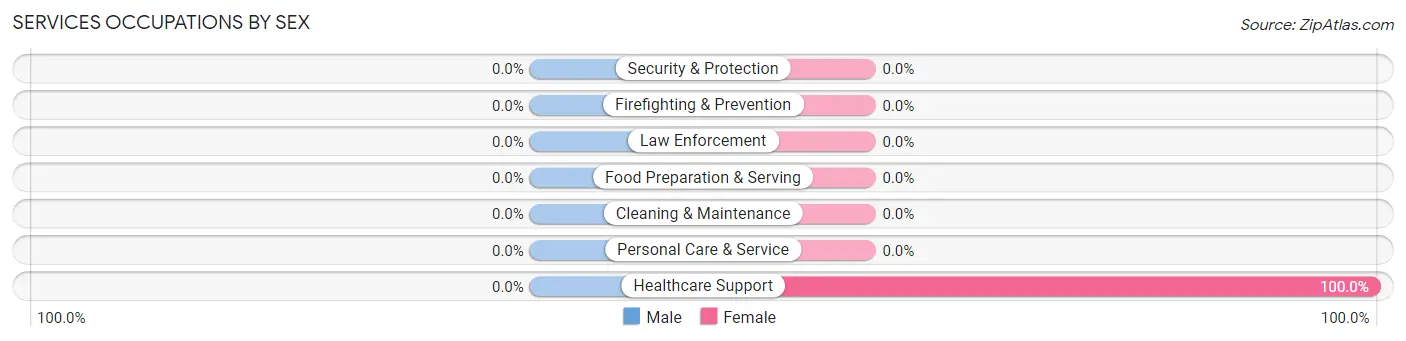
| Occupation | Male | Female |
| Healthcare Support | 0 (0.0%) | 9 (100.0%) |
| Security & Protection | 0 (0.0%) | 0 (0.0%) |
| Firefighting & Prevention | 0 (0.0%) | 0 (0.0%) |
| Law Enforcement | 0 (0.0%) | 0 (0.0%) |
| Food Preparation & Serving | 0 (0.0%) | 0 (0.0%) |
| Cleaning & Maintenance | 0 (0.0%) | 0 (0.0%) |
| Personal Care & Service | 0 (0.0%) | 0 (0.0%) |
| Total (Category) | 0 (0.0%) | 9 (100.0%) |
| Total (Overall) | 16 (40.0%) | 24 (60.0%) |
Sales and Office Occupations
Sales and Office Occupations by Sex
| Occupation | Male | Female |
| Sales & Related | 0 (0.0%) | 0 (0.0%) |
| Office & Administration | 0 (0.0%) | 0 (0.0%) |
| Total (Category) | 0 (0.0%) | 0 (0.0%) |
| Total (Overall) | 16 (40.0%) | 24 (60.0%) |
Natural Resources, Construction and Maintenance Occupations
Natural Resources, Construction and Maintenance Occupations by Sex
| Occupation | Male | Female |
| Farming, Fishing & Forestry | 0 (0.0%) | 0 (0.0%) |
| Construction & Extraction | 0 (0.0%) | 0 (0.0%) |
| Installation, Maintenance & Repair | 0 (0.0%) | 0 (0.0%) |
| Total (Category) | 0 (0.0%) | 0 (0.0%) |
| Total (Overall) | 16 (40.0%) | 24 (60.0%) |
Production, Transportation and Moving Occupations
The most common Production, Transportation and Moving occupations in Fort Seneca are , and Production (9 | 22.5%).
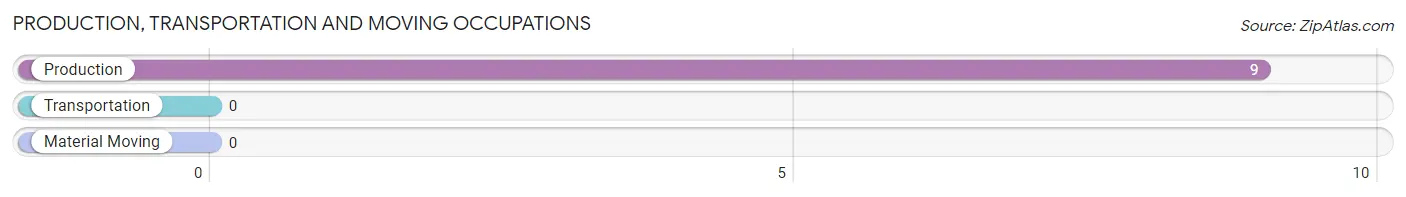
Production, Transportation and Moving Occupations by Sex
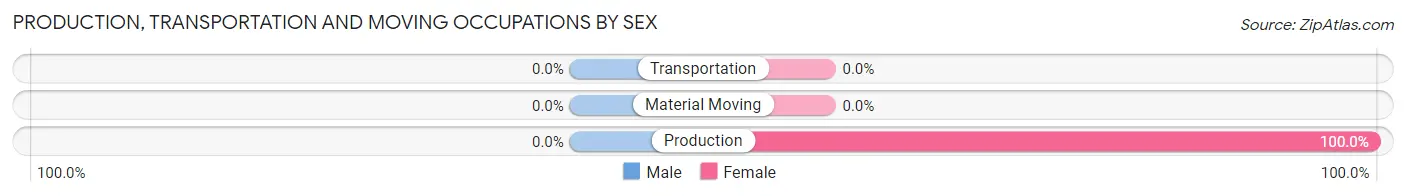
| Occupation | Male | Female |
| Production | 0 (0.0%) | 9 (100.0%) |
| Transportation | 0 (0.0%) | 0 (0.0%) |
| Material Moving | 0 (0.0%) | 0 (0.0%) |
| Total (Category) | 0 (0.0%) | 9 (100.0%) |
| Total (Overall) | 16 (40.0%) | 24 (60.0%) |
Employment Industries by Sex in Fort Seneca
Employment Industries in Fort Seneca
The major employment industries in Fort Seneca include Manufacturing (25 | 62.5%), Health Care & Social Assistance (9 | 22.5%), and Educational Services (6 | 15.0%).
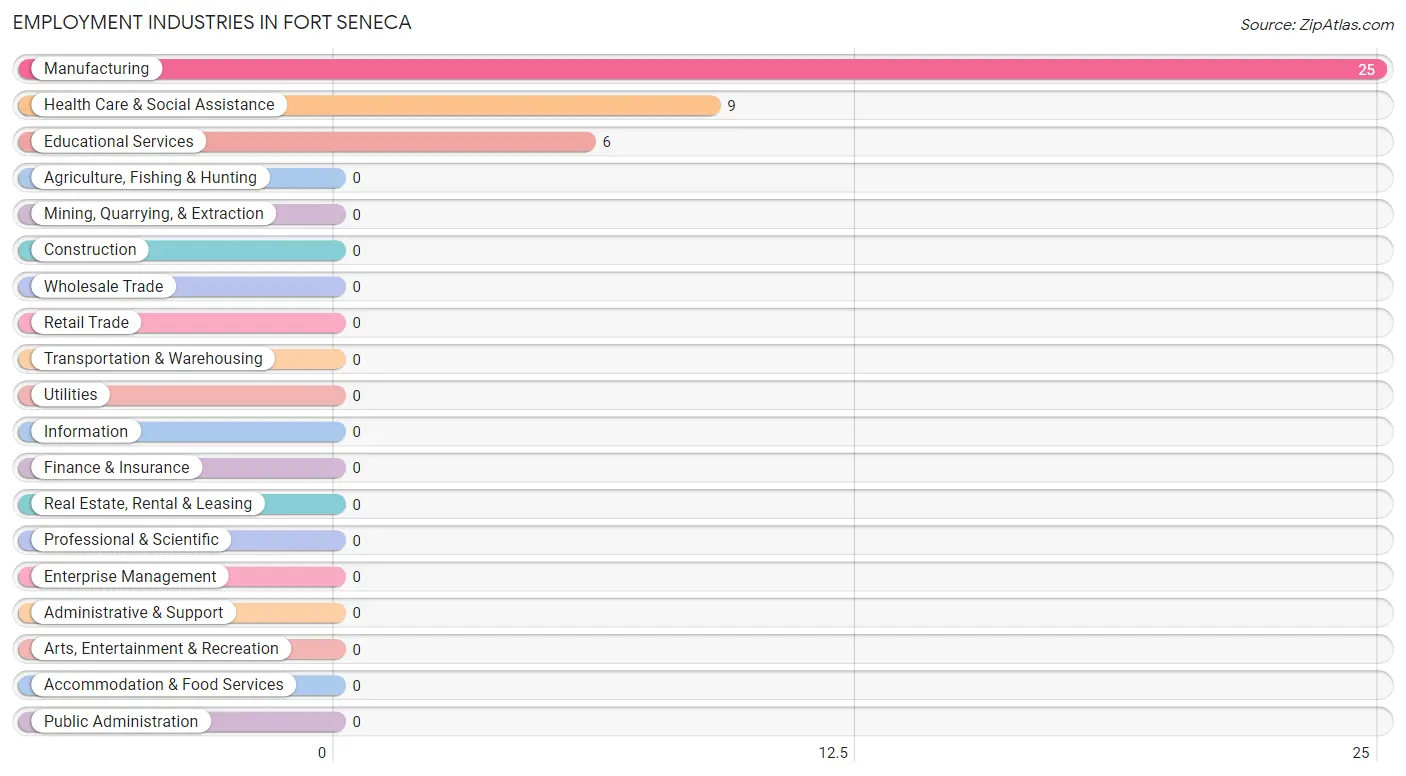
Employment Industries by Sex in Fort Seneca
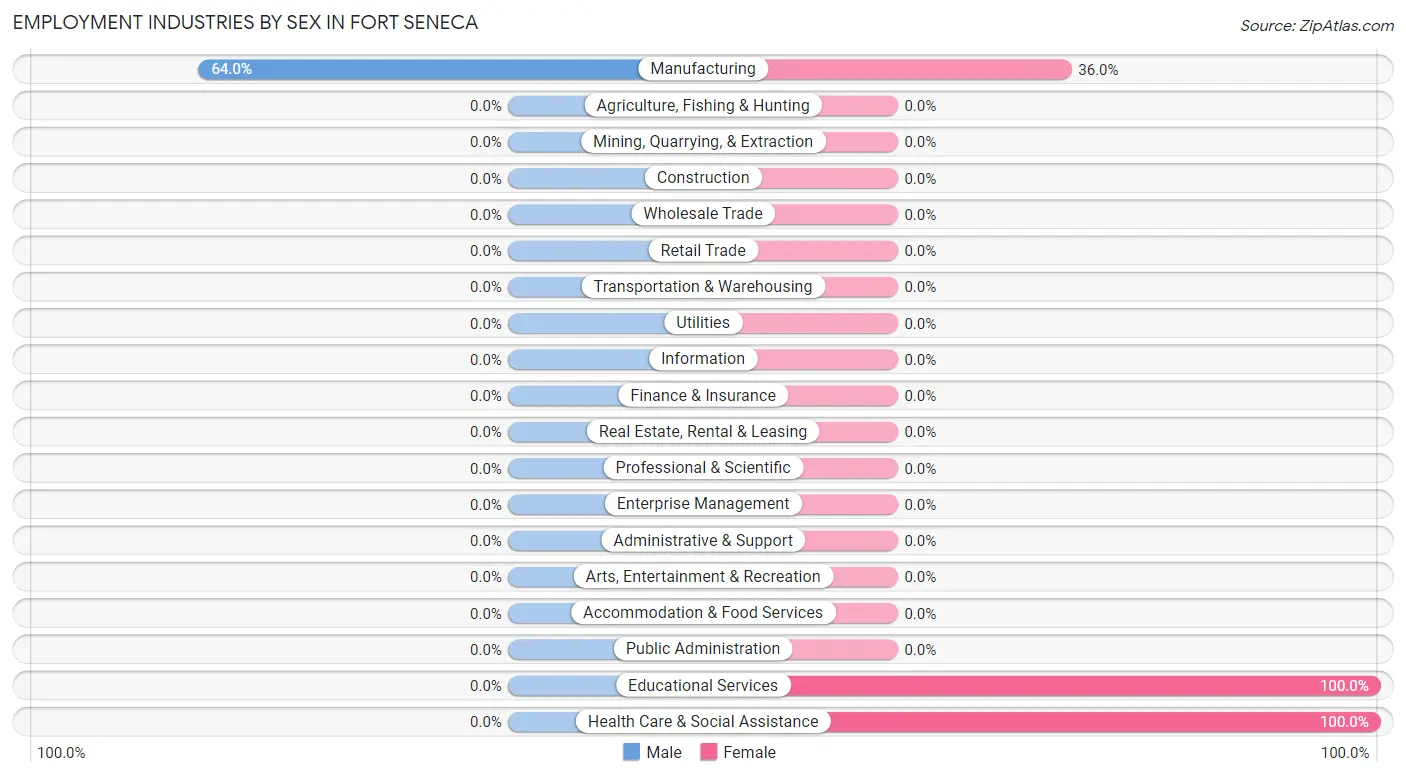
| Industry | Male | Female |
| Agriculture, Fishing & Hunting | 0 (0.0%) | 0 (0.0%) |
| Mining, Quarrying, & Extraction | 0 (0.0%) | 0 (0.0%) |
| Construction | 0 (0.0%) | 0 (0.0%) |
| Manufacturing | 16 (64.0%) | 9 (36.0%) |
| Wholesale Trade | 0 (0.0%) | 0 (0.0%) |
| Retail Trade | 0 (0.0%) | 0 (0.0%) |
| Transportation & Warehousing | 0 (0.0%) | 0 (0.0%) |
| Utilities | 0 (0.0%) | 0 (0.0%) |
| Information | 0 (0.0%) | 0 (0.0%) |
| Finance & Insurance | 0 (0.0%) | 0 (0.0%) |
| Real Estate, Rental & Leasing | 0 (0.0%) | 0 (0.0%) |
| Professional & Scientific | 0 (0.0%) | 0 (0.0%) |
| Enterprise Management | 0 (0.0%) | 0 (0.0%) |
| Administrative & Support | 0 (0.0%) | 0 (0.0%) |
| Educational Services | 0 (0.0%) | 6 (100.0%) |
| Health Care & Social Assistance | 0 (0.0%) | 9 (100.0%) |
| Arts, Entertainment & Recreation | 0 (0.0%) | 0 (0.0%) |
| Accommodation & Food Services | 0 (0.0%) | 0 (0.0%) |
| Public Administration | 0 (0.0%) | 0 (0.0%) |
| Total | 16 (40.0%) | 24 (60.0%) |
Education in Fort Seneca
School Enrollment in Fort Seneca
The most common levels of schooling among the 26 students in Fort Seneca are high school (13 | 50.0%), kindergarten (7 | 26.9%), and middle school (6 | 23.1%).
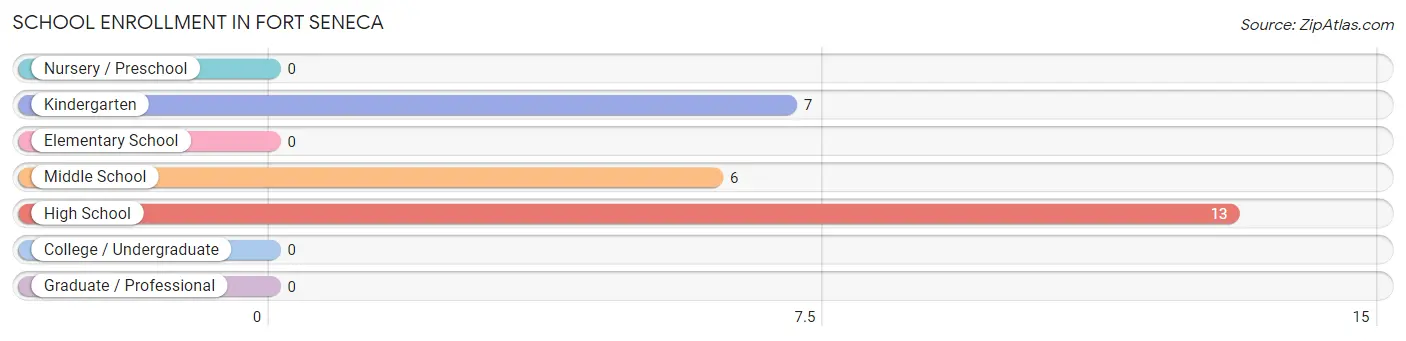
| School Level | # Students | % Students |
| Nursery / Preschool | 0 | 0.0% |
| Kindergarten | 7 | 26.9% |
| Elementary School | 0 | 0.0% |
| Middle School | 6 | 23.1% |
| High School | 13 | 50.0% |
| College / Undergraduate | 0 | 0.0% |
| Graduate / Professional | 0 | 0.0% |
| Total | 26 | 100.0% |
School Enrollment by Age by Funding Source in Fort Seneca
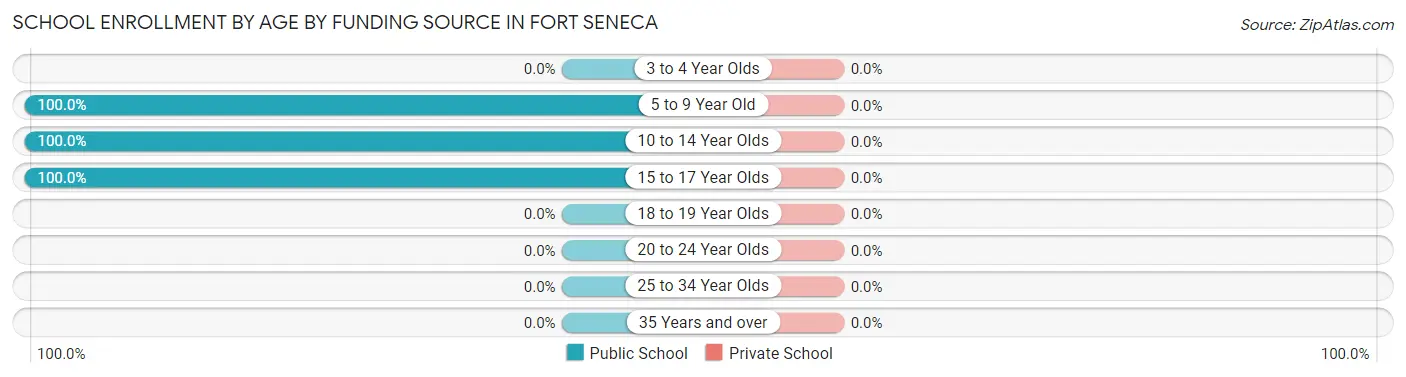
| Age Bracket | Public School | Private School |
| 3 to 4 Year Olds | 0 (0.0%) | 0 (0.0%) |
| 5 to 9 Year Old | 7 (100.0%) | 0 (0.0%) |
| 10 to 14 Year Olds | 6 (100.0%) | 0 (0.0%) |
| 15 to 17 Year Olds | 13 (100.0%) | 0 (0.0%) |
| 18 to 19 Year Olds | 0 (0.0%) | 0 (0.0%) |
| 20 to 24 Year Olds | 0 (0.0%) | 0 (0.0%) |
| 25 to 34 Year Olds | 0 (0.0%) | 0 (0.0%) |
| 35 Years and over | 0 (0.0%) | 0 (0.0%) |
| Total | 26 (100.0%) | 0 (0.0%) |
Educational Attainment by Field of Study in Fort Seneca
Computers & mathematics (8 | 28.6%), business (8 | 28.6%), engineering (6 | 21.4%), and education (6 | 21.4%) are the most common fields of study among 28 individuals in Fort Seneca who have obtained a bachelor's degree or higher.
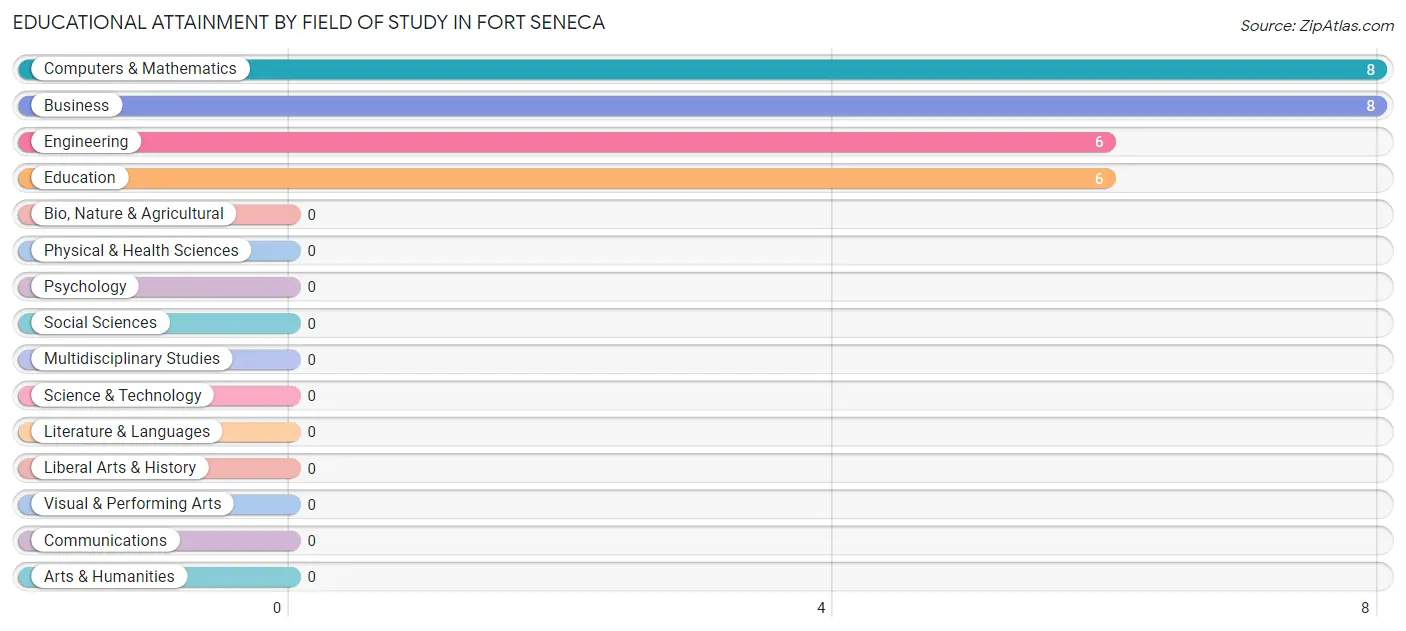
| Field of Study | # Graduates | % Graduates |
| Computers & Mathematics | 8 | 28.6% |
| Bio, Nature & Agricultural | 0 | 0.0% |
| Physical & Health Sciences | 0 | 0.0% |
| Psychology | 0 | 0.0% |
| Social Sciences | 0 | 0.0% |
| Engineering | 6 | 21.4% |
| Multidisciplinary Studies | 0 | 0.0% |
| Science & Technology | 0 | 0.0% |
| Business | 8 | 28.6% |
| Education | 6 | 21.4% |
| Literature & Languages | 0 | 0.0% |
| Liberal Arts & History | 0 | 0.0% |
| Visual & Performing Arts | 0 | 0.0% |
| Communications | 0 | 0.0% |
| Arts & Humanities | 0 | 0.0% |
| Total | 28 | 100.0% |
Transportation & Commute in Fort Seneca
Vehicle Availability by Sex in Fort Seneca
The most prevalent vehicle ownership categories in Fort Seneca are males with 2 vehicles (10, accounting for 62.5%) and females with 2 vehicles (18, making up 41.7%).
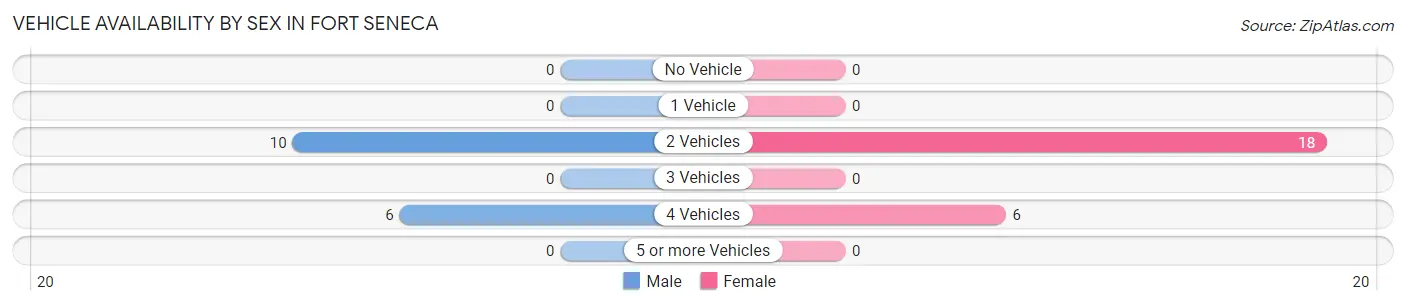
| Vehicles Available | Male | Female |
| No Vehicle | 0 (0.0%) | 0 (0.0%) |
| 1 Vehicle | 0 (0.0%) | 0 (0.0%) |
| 2 Vehicles | 10 (62.5%) | 18 (75.0%) |
| 3 Vehicles | 0 (0.0%) | 0 (0.0%) |
| 4 Vehicles | 6 (37.5%) | 6 (25.0%) |
| 5 or more Vehicles | 0 (0.0%) | 0 (0.0%) |
| Total | 16 (100.0%) | 24 (100.0%) |
Commute Time in Fort Seneca
The most frequently occuring commute durations in Fort Seneca are 10 to 14 minutes (15 commuters, 44.1%), 25 to 29 minutes (10 commuters, 29.4%), and 20 to 24 minutes (9 commuters, 26.5%).
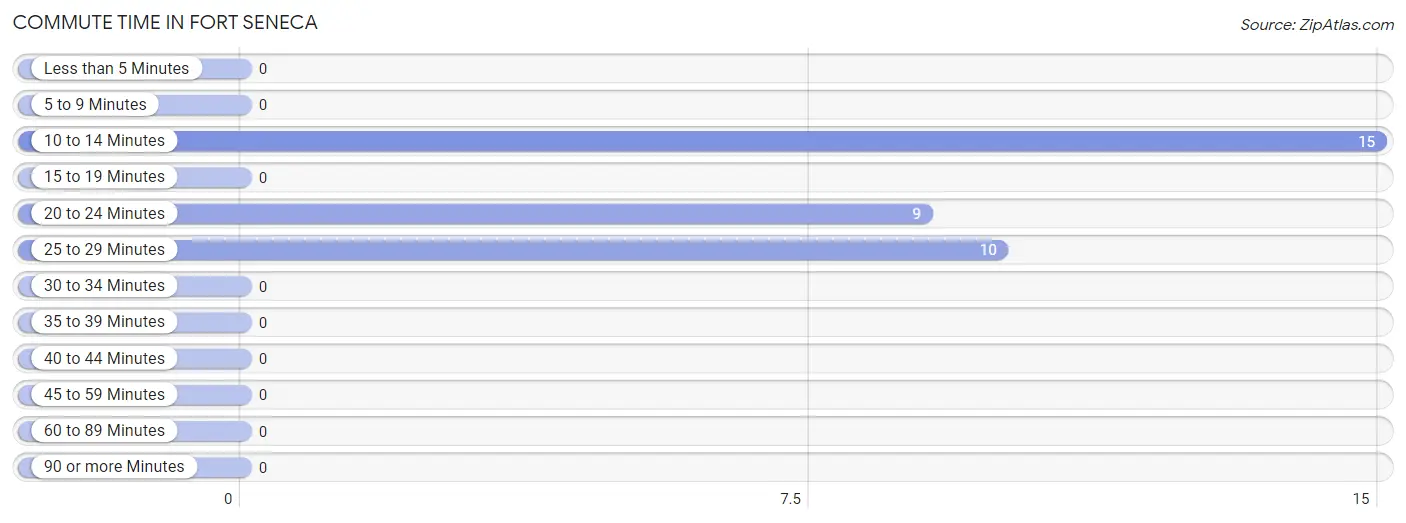
| Commute Time | # Commuters | % Commuters |
| Less than 5 Minutes | 0 | 0.0% |
| 5 to 9 Minutes | 0 | 0.0% |
| 10 to 14 Minutes | 15 | 44.1% |
| 15 to 19 Minutes | 0 | 0.0% |
| 20 to 24 Minutes | 9 | 26.5% |
| 25 to 29 Minutes | 10 | 29.4% |
| 30 to 34 Minutes | 0 | 0.0% |
| 35 to 39 Minutes | 0 | 0.0% |
| 40 to 44 Minutes | 0 | 0.0% |
| 45 to 59 Minutes | 0 | 0.0% |
| 60 to 89 Minutes | 0 | 0.0% |
| 90 or more Minutes | 0 | 0.0% |
Commute Time by Sex in Fort Seneca
The most common commute times in Fort Seneca are 25 to 29 minutes (10 commuters, 62.5%) for males and 10 to 14 minutes (9 commuters, 50.0%) for females.
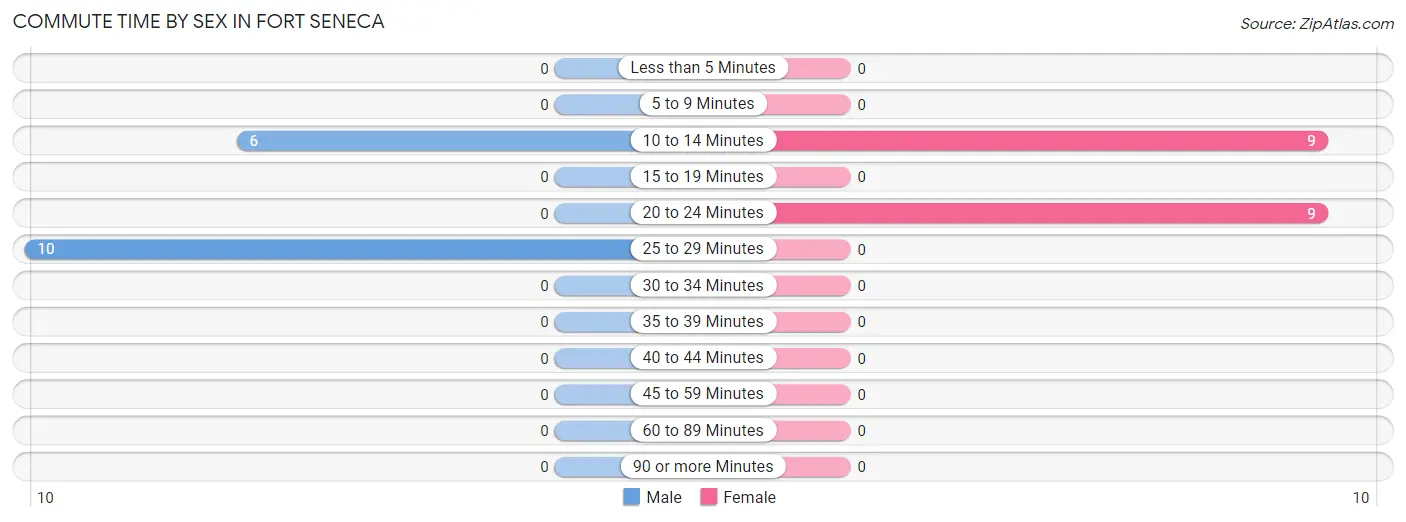
| Commute Time | Male | Female |
| Less than 5 Minutes | 0 (0.0%) | 0 (0.0%) |
| 5 to 9 Minutes | 0 (0.0%) | 0 (0.0%) |
| 10 to 14 Minutes | 6 (37.5%) | 9 (50.0%) |
| 15 to 19 Minutes | 0 (0.0%) | 0 (0.0%) |
| 20 to 24 Minutes | 0 (0.0%) | 9 (50.0%) |
| 25 to 29 Minutes | 10 (62.5%) | 0 (0.0%) |
| 30 to 34 Minutes | 0 (0.0%) | 0 (0.0%) |
| 35 to 39 Minutes | 0 (0.0%) | 0 (0.0%) |
| 40 to 44 Minutes | 0 (0.0%) | 0 (0.0%) |
| 45 to 59 Minutes | 0 (0.0%) | 0 (0.0%) |
| 60 to 89 Minutes | 0 (0.0%) | 0 (0.0%) |
| 90 or more Minutes | 0 (0.0%) | 0 (0.0%) |
Time of Departure to Work by Sex in Fort Seneca
The most frequent times of departure to work in Fort Seneca are 5:00 AM to 5:29 AM (10, 62.5%) for males and 6:30 AM to 6:59 AM (9, 50.0%) for females.
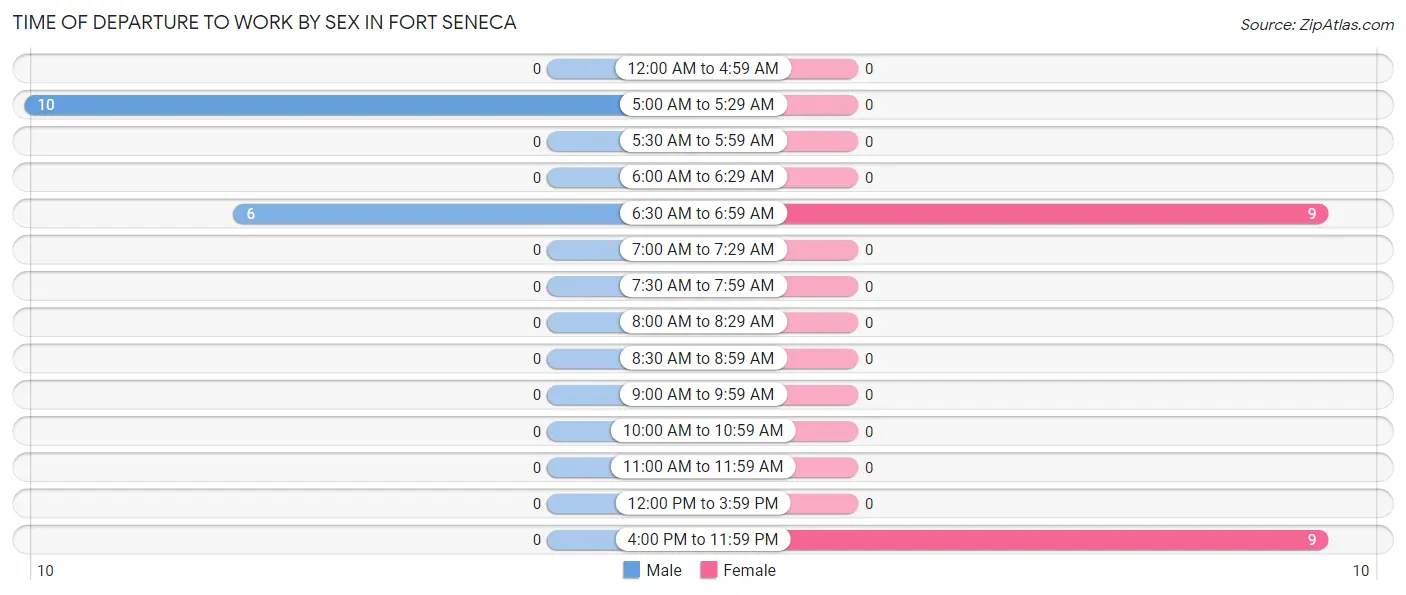
| Time of Departure | Male | Female |
| 12:00 AM to 4:59 AM | 0 (0.0%) | 0 (0.0%) |
| 5:00 AM to 5:29 AM | 10 (62.5%) | 0 (0.0%) |
| 5:30 AM to 5:59 AM | 0 (0.0%) | 0 (0.0%) |
| 6:00 AM to 6:29 AM | 0 (0.0%) | 0 (0.0%) |
| 6:30 AM to 6:59 AM | 6 (37.5%) | 9 (50.0%) |
| 7:00 AM to 7:29 AM | 0 (0.0%) | 0 (0.0%) |
| 7:30 AM to 7:59 AM | 0 (0.0%) | 0 (0.0%) |
| 8:00 AM to 8:29 AM | 0 (0.0%) | 0 (0.0%) |
| 8:30 AM to 8:59 AM | 0 (0.0%) | 0 (0.0%) |
| 9:00 AM to 9:59 AM | 0 (0.0%) | 0 (0.0%) |
| 10:00 AM to 10:59 AM | 0 (0.0%) | 0 (0.0%) |
| 11:00 AM to 11:59 AM | 0 (0.0%) | 0 (0.0%) |
| 12:00 PM to 3:59 PM | 0 (0.0%) | 0 (0.0%) |
| 4:00 PM to 11:59 PM | 0 (0.0%) | 9 (50.0%) |
| Total | 16 (100.0%) | 18 (100.0%) |
Housing Occupancy in Fort Seneca
Occupancy by Ownership in Fort Seneca
Of the total 52 dwellings in Fort Seneca, owner-occupied units account for 34 (65.4%), while renter-occupied units make up 18 (34.6%).
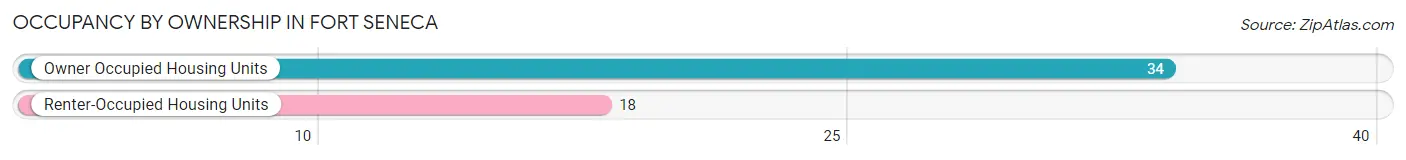
| Occupancy | # Housing Units | % Housing Units |
| Owner Occupied Housing Units | 34 | 65.4% |
| Renter-Occupied Housing Units | 18 | 34.6% |
| Total Occupied Housing Units | 52 | 100.0% |
Occupancy by Household Size in Fort Seneca
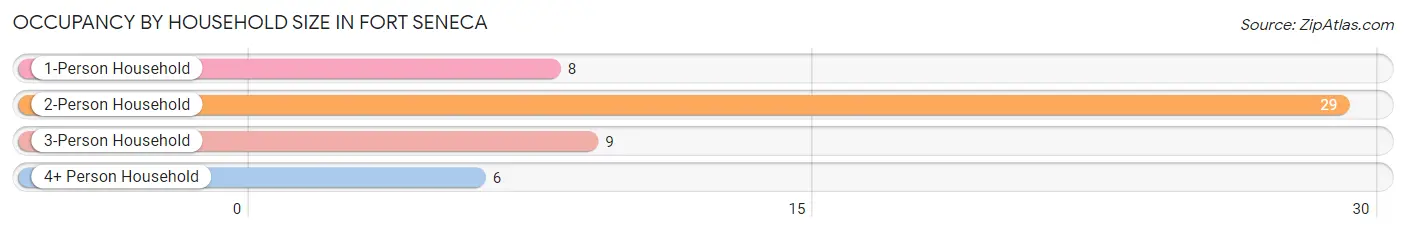
| Household Size | # Housing Units | % Housing Units |
| 1-Person Household | 8 | 15.4% |
| 2-Person Household | 29 | 55.8% |
| 3-Person Household | 9 | 17.3% |
| 4+ Person Household | 6 | 11.5% |
| Total Housing Units | 52 | 100.0% |
Occupancy by Ownership by Household Size in Fort Seneca
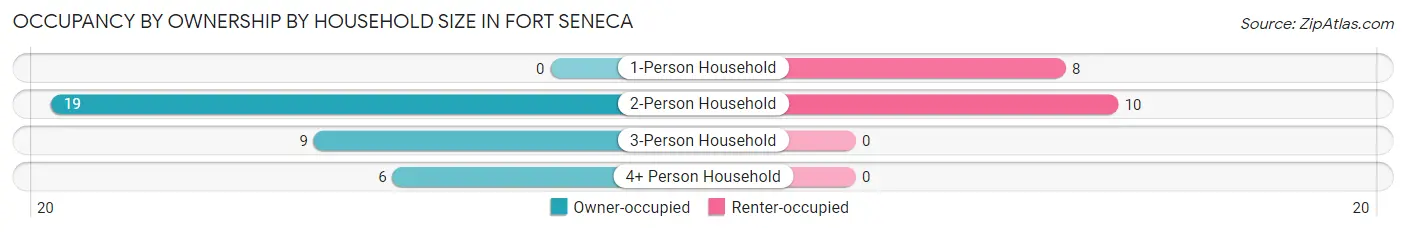
| Household Size | Owner-occupied | Renter-occupied |
| 1-Person Household | 0 (0.0%) | 8 (100.0%) |
| 2-Person Household | 19 (65.5%) | 10 (34.5%) |
| 3-Person Household | 9 (100.0%) | 0 (0.0%) |
| 4+ Person Household | 6 (100.0%) | 0 (0.0%) |
| Total Housing Units | 34 (65.4%) | 18 (34.6%) |
Occupancy by Educational Attainment in Fort Seneca
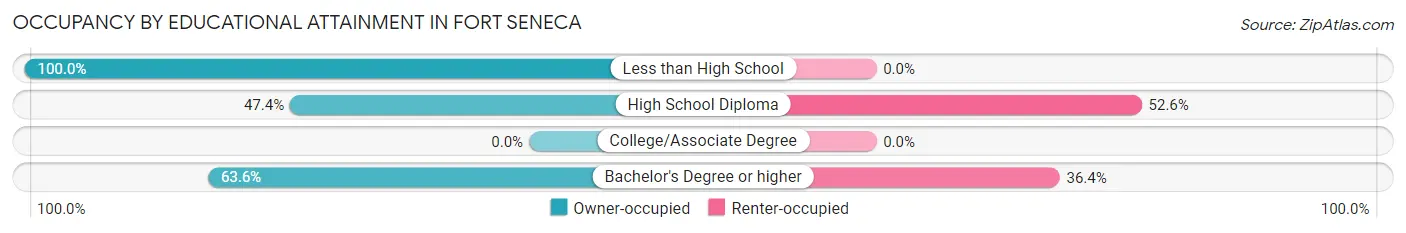
| Household Size | Owner-occupied | Renter-occupied |
| Less than High School | 11 (100.0%) | 0 (0.0%) |
| High School Diploma | 9 (47.4%) | 10 (52.6%) |
| College/Associate Degree | 0 (0.0%) | 0 (0.0%) |
| Bachelor's Degree or higher | 14 (63.6%) | 8 (36.4%) |
Occupancy by Age of Householder in Fort Seneca
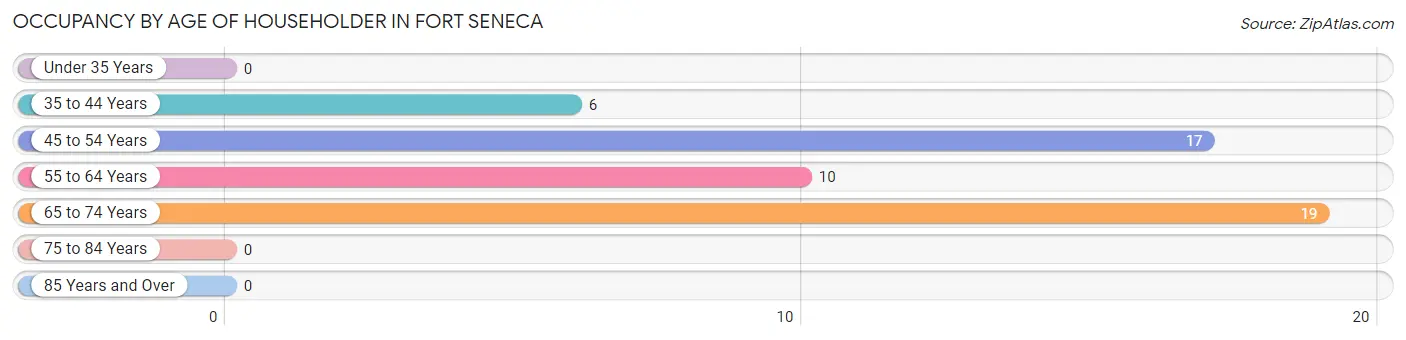
| Age Bracket | # Households | % Households |
| Under 35 Years | 0 | 0.0% |
| 35 to 44 Years | 6 | 11.5% |
| 45 to 54 Years | 17 | 32.7% |
| 55 to 64 Years | 10 | 19.2% |
| 65 to 74 Years | 19 | 36.5% |
| 75 to 84 Years | 0 | 0.0% |
| 85 Years and Over | 0 | 0.0% |
| Total | 52 | 100.0% |
Housing Finances in Fort Seneca
Median Income by Occupancy in Fort Seneca
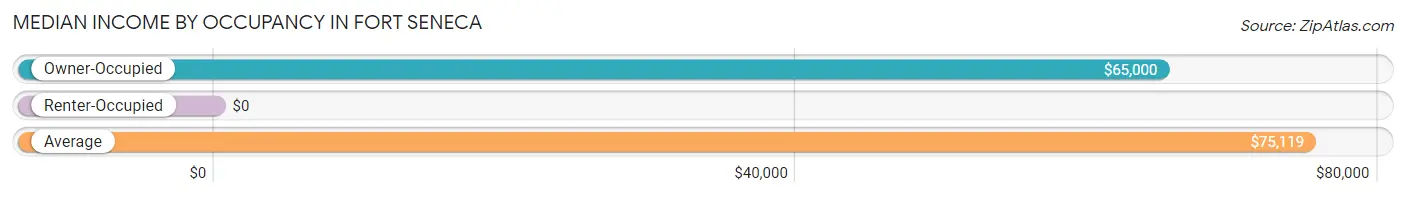
| Occupancy Type | # Households | Median Income |
| Owner-Occupied | 34 (65.4%) | $65,000 |
| Renter-Occupied | 18 (34.6%) | $0 |
| Average | 52 (100.0%) | $75,119 |
Occupancy by Householder Income Bracket in Fort Seneca
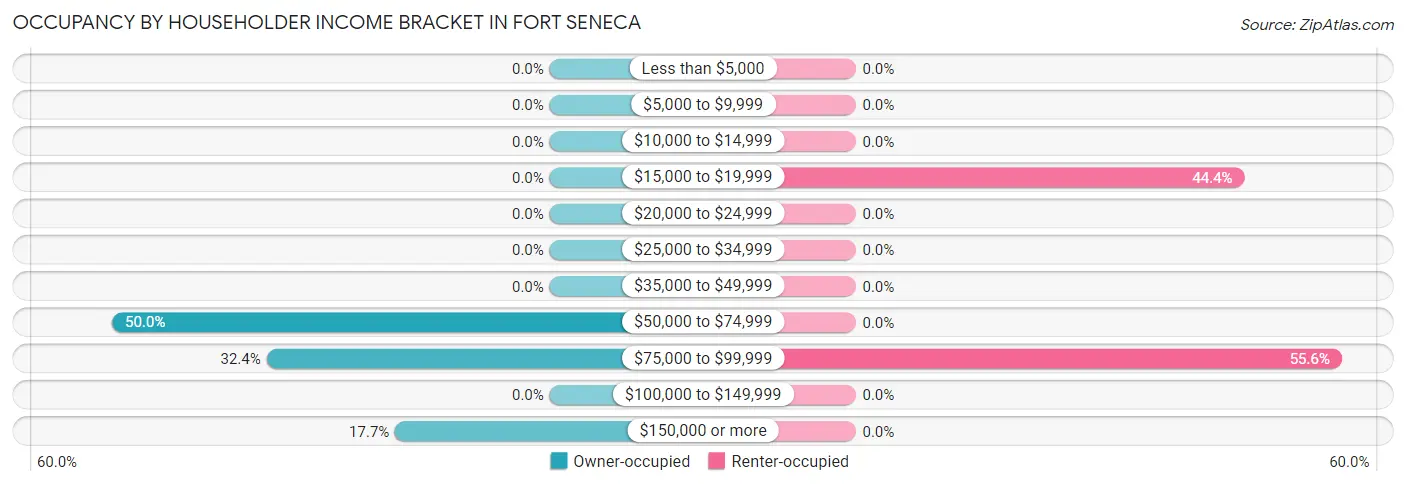
| Income Bracket | Owner-occupied | Renter-occupied |
| Less than $5,000 | 0 (0.0%) | 0 (0.0%) |
| $5,000 to $9,999 | 0 (0.0%) | 0 (0.0%) |
| $10,000 to $14,999 | 0 (0.0%) | 0 (0.0%) |
| $15,000 to $19,999 | 0 (0.0%) | 8 (44.4%) |
| $20,000 to $24,999 | 0 (0.0%) | 0 (0.0%) |
| $25,000 to $34,999 | 0 (0.0%) | 0 (0.0%) |
| $35,000 to $49,999 | 0 (0.0%) | 0 (0.0%) |
| $50,000 to $74,999 | 17 (50.0%) | 0 (0.0%) |
| $75,000 to $99,999 | 11 (32.4%) | 10 (55.6%) |
| $100,000 to $149,999 | 0 (0.0%) | 0 (0.0%) |
| $150,000 or more | 6 (17.6%) | 0 (0.0%) |
| Total | 34 (100.0%) | 18 (100.0%) |
Monthly Housing Cost Tiers in Fort Seneca
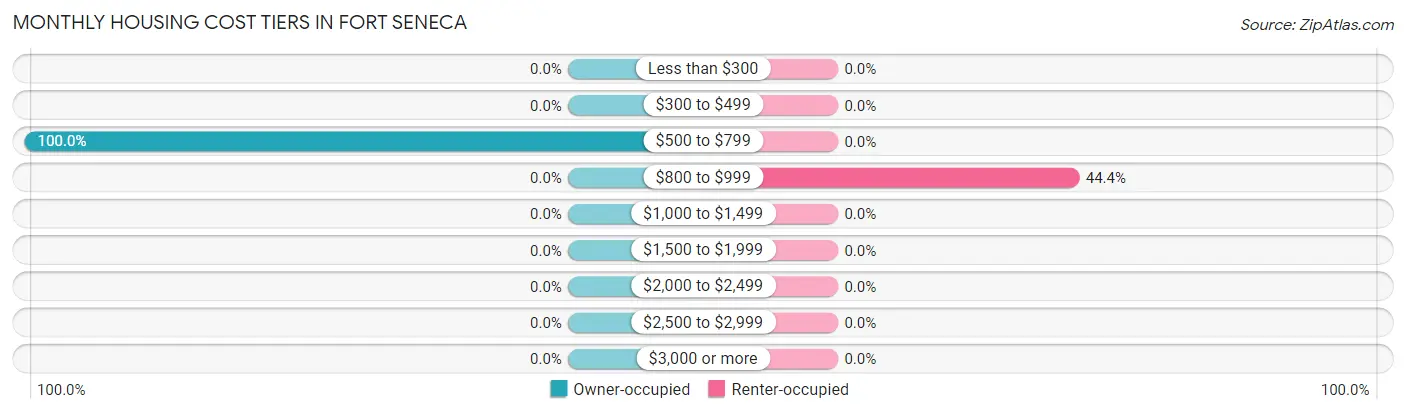
| Monthly Cost | Owner-occupied | Renter-occupied |
| Less than $300 | 0 (0.0%) | 0 (0.0%) |
| $300 to $499 | 0 (0.0%) | 0 (0.0%) |
| $500 to $799 | 34 (100.0%) | 0 (0.0%) |
| $800 to $999 | 0 (0.0%) | 8 (44.4%) |
| $1,000 to $1,499 | 0 (0.0%) | 0 (0.0%) |
| $1,500 to $1,999 | 0 (0.0%) | 0 (0.0%) |
| $2,000 to $2,499 | 0 (0.0%) | 0 (0.0%) |
| $2,500 to $2,999 | 0 (0.0%) | 0 (0.0%) |
| $3,000 or more | 0 (0.0%) | 0 (0.0%) |
| Total | 34 (100.0%) | 18 (100.0%) |
Physical Housing Characteristics in Fort Seneca
Housing Structures in Fort Seneca
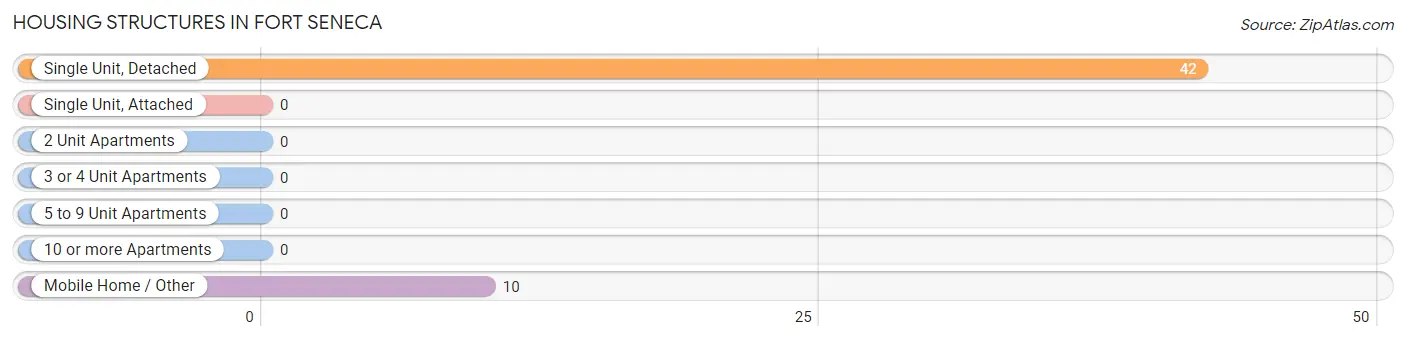
| Structure Type | # Housing Units | % Housing Units |
| Single Unit, Detached | 42 | 80.8% |
| Single Unit, Attached | 0 | 0.0% |
| 2 Unit Apartments | 0 | 0.0% |
| 3 or 4 Unit Apartments | 0 | 0.0% |
| 5 to 9 Unit Apartments | 0 | 0.0% |
| 10 or more Apartments | 0 | 0.0% |
| Mobile Home / Other | 10 | 19.2% |
| Total | 52 | 100.0% |
Housing Structures by Occupancy in Fort Seneca
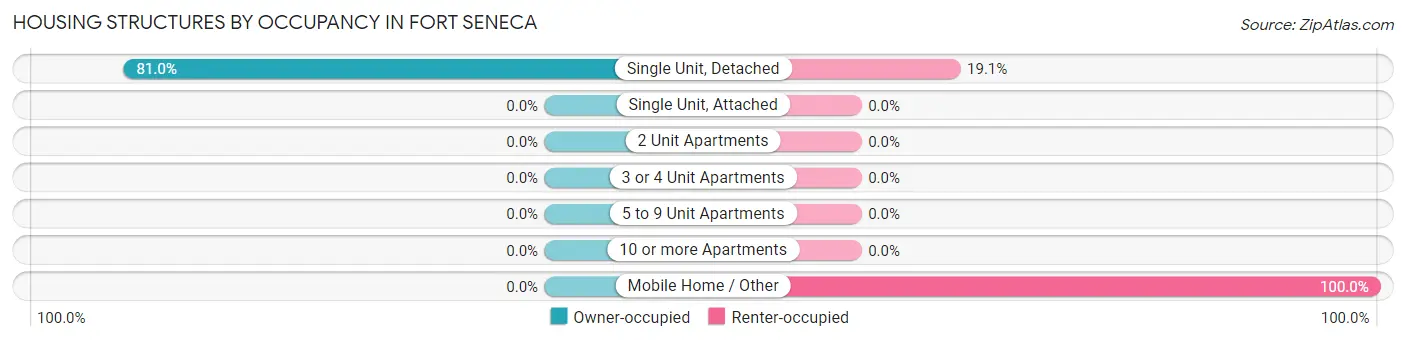
| Structure Type | Owner-occupied | Renter-occupied |
| Single Unit, Detached | 34 (80.9%) | 8 (19.1%) |
| Single Unit, Attached | 0 (0.0%) | 0 (0.0%) |
| 2 Unit Apartments | 0 (0.0%) | 0 (0.0%) |
| 3 or 4 Unit Apartments | 0 (0.0%) | 0 (0.0%) |
| 5 to 9 Unit Apartments | 0 (0.0%) | 0 (0.0%) |
| 10 or more Apartments | 0 (0.0%) | 0 (0.0%) |
| Mobile Home / Other | 0 (0.0%) | 10 (100.0%) |
| Total | 34 (65.4%) | 18 (34.6%) |
Housing Structures by Number of Rooms in Fort Seneca
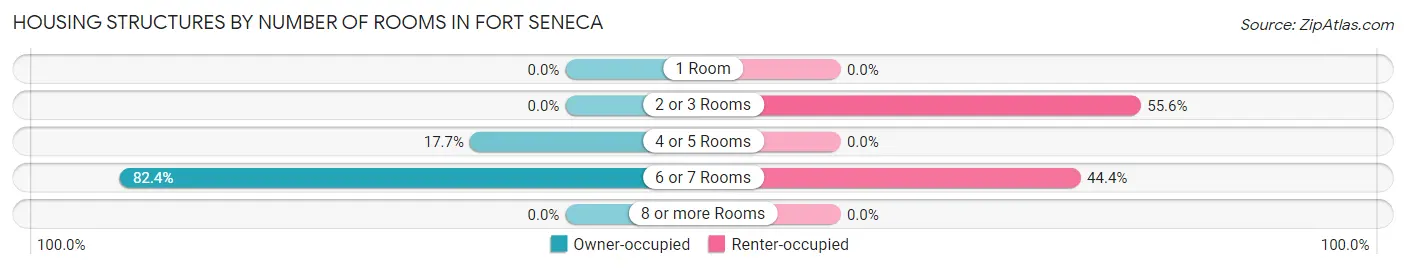
| Number of Rooms | Owner-occupied | Renter-occupied |
| 1 Room | 0 (0.0%) | 0 (0.0%) |
| 2 or 3 Rooms | 0 (0.0%) | 10 (55.6%) |
| 4 or 5 Rooms | 6 (17.6%) | 0 (0.0%) |
| 6 or 7 Rooms | 28 (82.4%) | 8 (44.4%) |
| 8 or more Rooms | 0 (0.0%) | 0 (0.0%) |
| Total | 34 (100.0%) | 18 (100.0%) |
Housing Structure by Heating Type in Fort Seneca
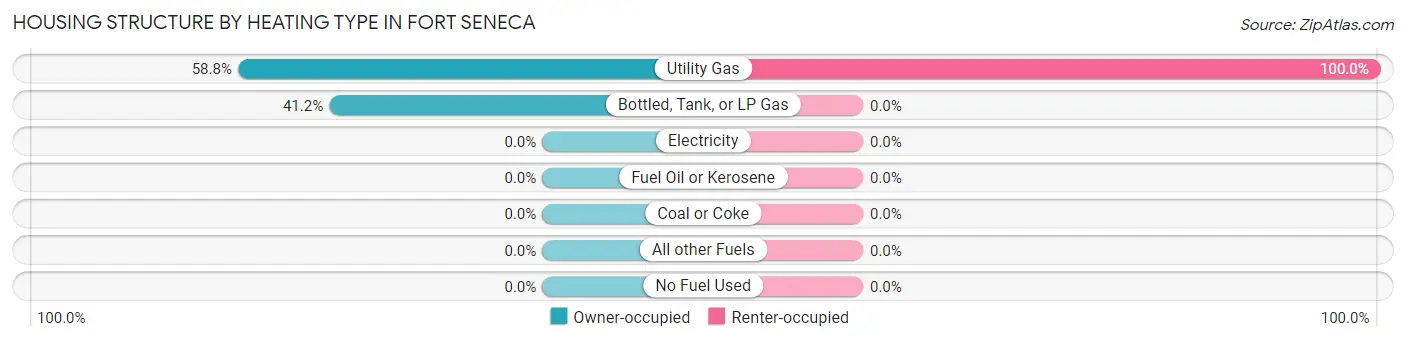
| Heating Type | Owner-occupied | Renter-occupied |
| Utility Gas | 20 (58.8%) | 18 (100.0%) |
| Bottled, Tank, or LP Gas | 14 (41.2%) | 0 (0.0%) |
| Electricity | 0 (0.0%) | 0 (0.0%) |
| Fuel Oil or Kerosene | 0 (0.0%) | 0 (0.0%) |
| Coal or Coke | 0 (0.0%) | 0 (0.0%) |
| All other Fuels | 0 (0.0%) | 0 (0.0%) |
| No Fuel Used | 0 (0.0%) | 0 (0.0%) |
| Total | 34 (100.0%) | 18 (100.0%) |
Household Vehicle Usage in Fort Seneca
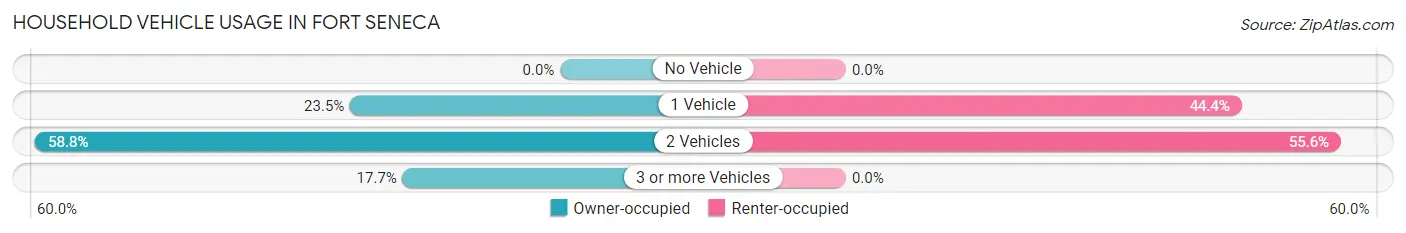
| Vehicles per Household | Owner-occupied | Renter-occupied |
| No Vehicle | 0 (0.0%) | 0 (0.0%) |
| 1 Vehicle | 8 (23.5%) | 8 (44.4%) |
| 2 Vehicles | 20 (58.8%) | 10 (55.6%) |
| 3 or more Vehicles | 6 (17.6%) | 0 (0.0%) |
| Total | 34 (100.0%) | 18 (100.0%) |
Real Estate & Mortgages in Fort Seneca
Real Estate and Mortgage Overview in Fort Seneca
| Characteristic | Without Mortgage | With Mortgage |
| Housing Units | 0 | 34 |
| Median Property Value | - | - |
| Median Household Income | - | - |
| Monthly Housing Costs | - | - |
| Real Estate Taxes | - | - |
Property Value by Mortgage Status in Fort Seneca
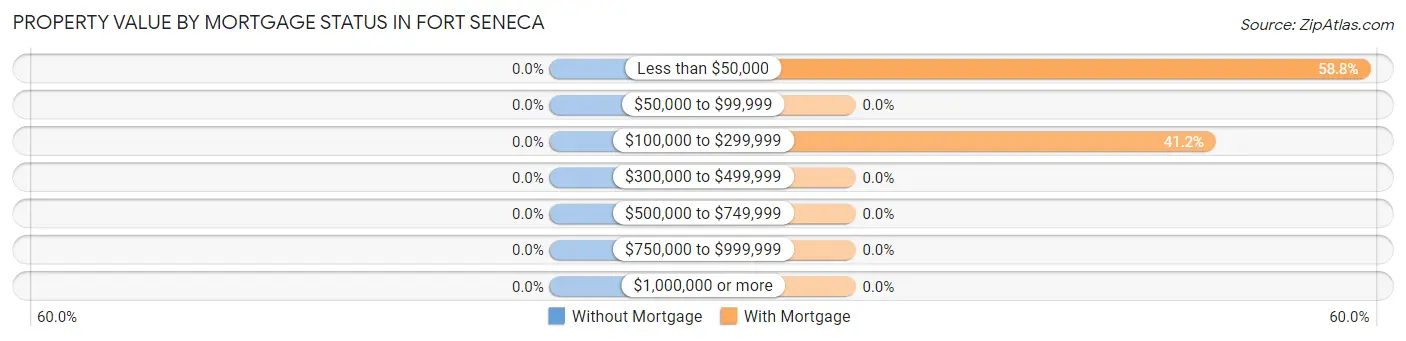
| Property Value | Without Mortgage | With Mortgage |
| Less than $50,000 | 0 (0.0%) | 20 (58.8%) |
| $50,000 to $99,999 | 0 (0.0%) | 0 (0.0%) |
| $100,000 to $299,999 | 0 (0.0%) | 14 (41.2%) |
| $300,000 to $499,999 | 0 (0.0%) | 0 (0.0%) |
| $500,000 to $749,999 | 0 (0.0%) | 0 (0.0%) |
| $750,000 to $999,999 | 0 (0.0%) | 0 (0.0%) |
| $1,000,000 or more | 0 (0.0%) | 0 (0.0%) |
| Total | 0 (0.0%) | 34 (100.0%) |
Household Income by Mortgage Status in Fort Seneca
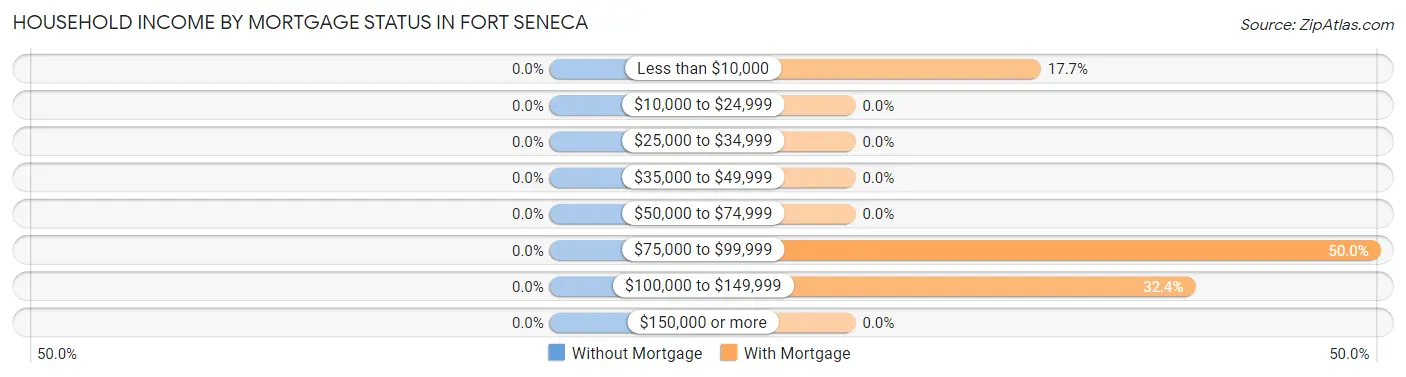
| Household Income | Without Mortgage | With Mortgage |
| Less than $10,000 | 0 (0.0%) | 6 (17.6%) |
| $10,000 to $24,999 | 0 (0.0%) | 0 (0.0%) |
| $25,000 to $34,999 | 0 (0.0%) | 0 (0.0%) |
| $35,000 to $49,999 | 0 (0.0%) | 0 (0.0%) |
| $50,000 to $74,999 | 0 (0.0%) | 0 (0.0%) |
| $75,000 to $99,999 | 0 (0.0%) | 17 (50.0%) |
| $100,000 to $149,999 | 0 (0.0%) | 11 (32.4%) |
| $150,000 or more | 0 (0.0%) | 0 (0.0%) |
| Total | 0 (0.0%) | 34 (100.0%) |
Property Value to Household Income Ratio in Fort Seneca
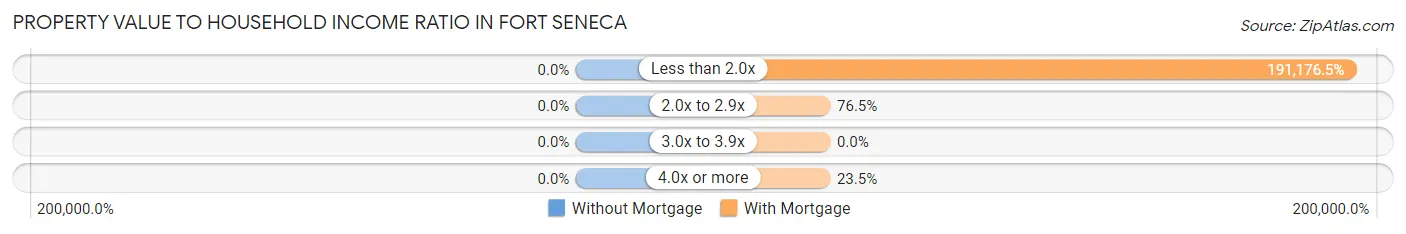
| Value-to-Income Ratio | Without Mortgage | With Mortgage |
| Less than 2.0x | 0 (0.0%) | 65,000 (191,176.5%) |
| 2.0x to 2.9x | 0 (0.0%) | 26 (76.5%) |
| 3.0x to 3.9x | 0 (0.0%) | 0 (0.0%) |
| 4.0x or more | 0 (0.0%) | 8 (23.5%) |
| Total | 0 (0.0%) | 34 (100.0%) |
Real Estate Taxes by Mortgage Status in Fort Seneca
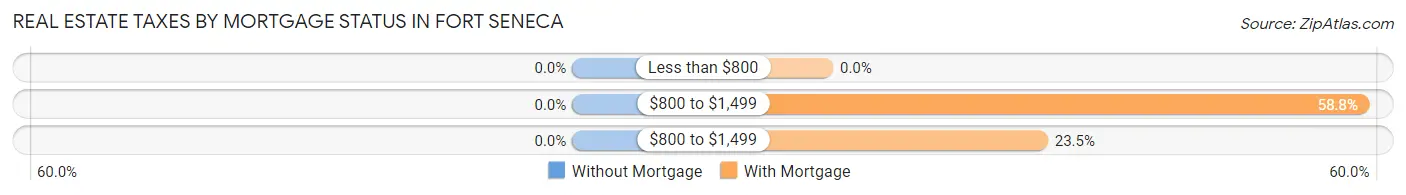
| Property Taxes | Without Mortgage | With Mortgage |
| Less than $800 | 0 (0.0%) | 0 (0.0%) |
| $800 to $1,499 | 0 (0.0%) | 20 (58.8%) |
| $800 to $1,499 | 0 (0.0%) | 8 (23.5%) |
| Total | 0 (0.0%) | 34 (100.0%) |
Health & Disability in Fort Seneca
Health Insurance Coverage by Age in Fort Seneca
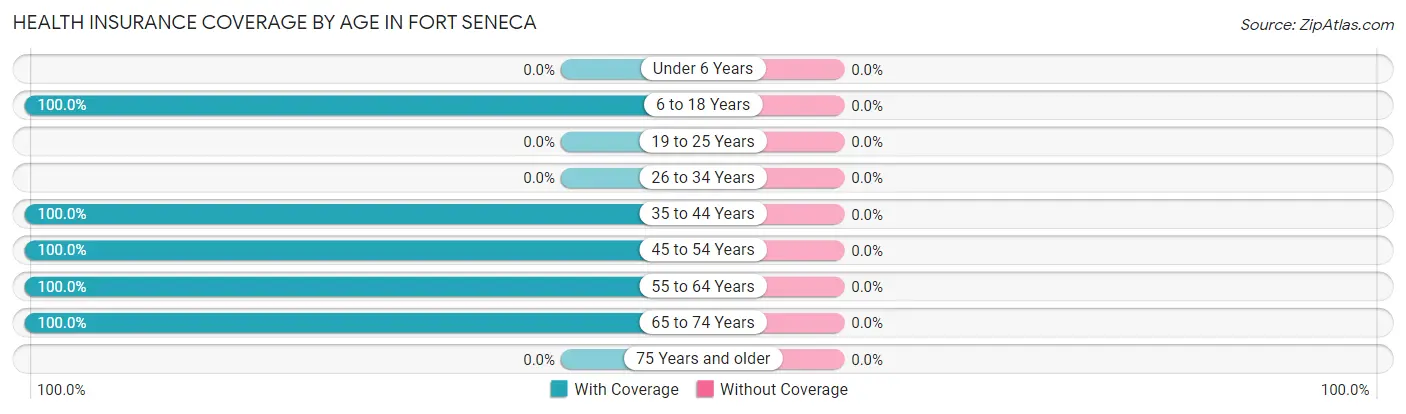
| Age Bracket | With Coverage | Without Coverage |
| Under 6 Years | 0 (0.0%) | 0 (0.0%) |
| 6 to 18 Years | 26 (100.0%) | 0 (0.0%) |
| 19 to 25 Years | 0 (0.0%) | 0 (0.0%) |
| 26 to 34 Years | 0 (0.0%) | 0 (0.0%) |
| 35 to 44 Years | 6 (100.0%) | 0 (0.0%) |
| 45 to 54 Years | 30 (100.0%) | 0 (0.0%) |
| 55 to 64 Years | 30 (100.0%) | 0 (0.0%) |
| 65 to 74 Years | 26 (100.0%) | 0 (0.0%) |
| 75 Years and older | 0 (0.0%) | 0 (0.0%) |
| Total | 118 (100.0%) | 0 (0.0%) |
Health Insurance Coverage by Citizenship Status in Fort Seneca
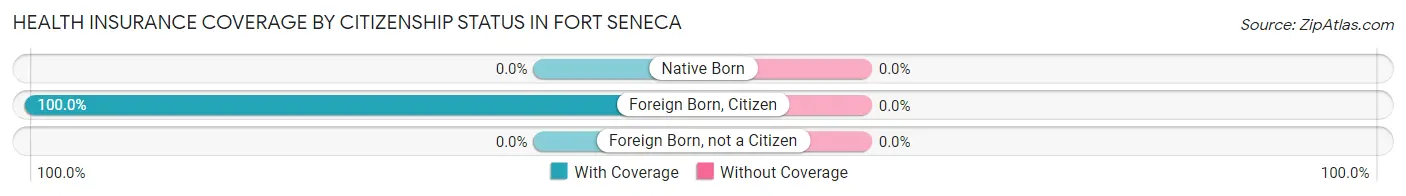
| Citizenship Status | With Coverage | Without Coverage |
| Native Born | 0 (0.0%) | 0 (0.0%) |
| Foreign Born, Citizen | 26 (100.0%) | 0 (0.0%) |
| Foreign Born, not a Citizen | 0 (0.0%) | 0 (0.0%) |
Health Insurance Coverage by Household Income in Fort Seneca
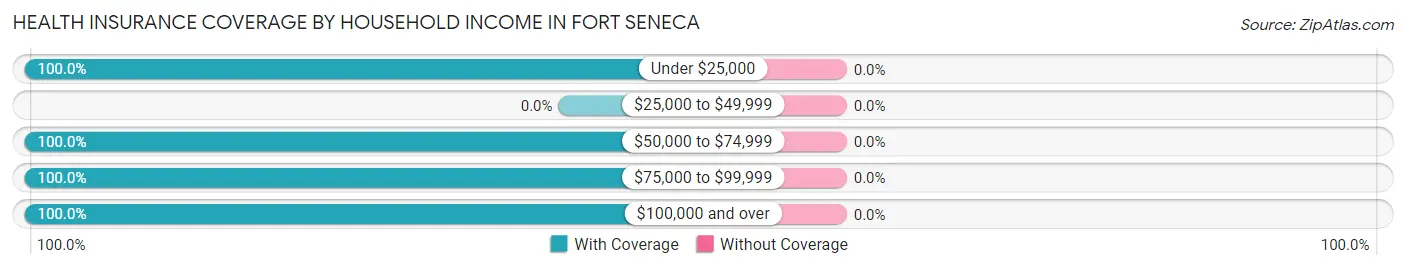
| Household Income | With Coverage | Without Coverage |
| Under $25,000 | 8 (100.0%) | 0 (0.0%) |
| $25,000 to $49,999 | 0 (0.0%) | 0 (0.0%) |
| $50,000 to $74,999 | 38 (100.0%) | 0 (0.0%) |
| $75,000 to $99,999 | 41 (100.0%) | 0 (0.0%) |
| $100,000 and over | 31 (100.0%) | 0 (0.0%) |
Public vs Private Health Insurance Coverage by Age in Fort Seneca
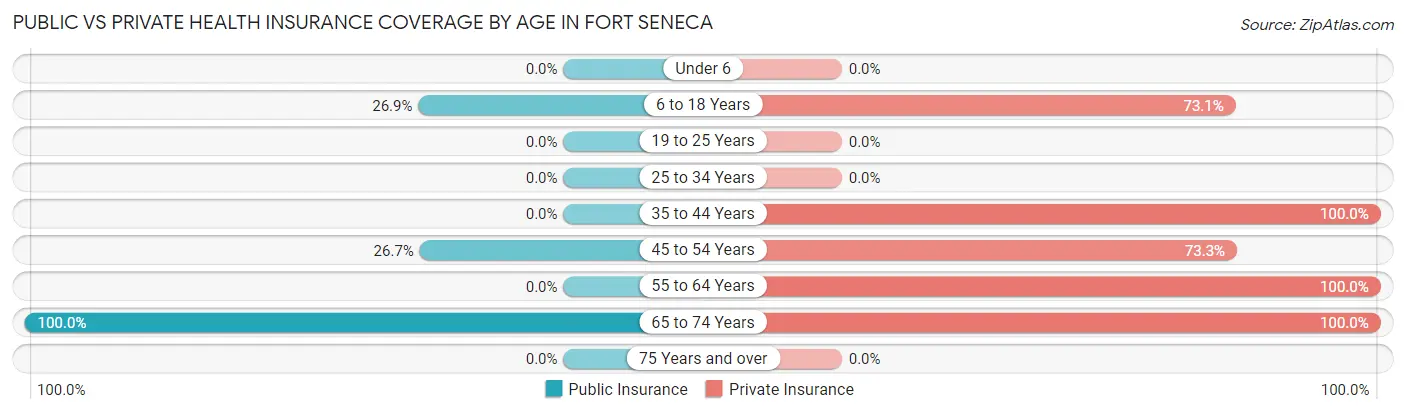
| Age Bracket | Public Insurance | Private Insurance |
| Under 6 | 0 (0.0%) | 0 (0.0%) |
| 6 to 18 Years | 7 (26.9%) | 19 (73.1%) |
| 19 to 25 Years | 0 (0.0%) | 0 (0.0%) |
| 25 to 34 Years | 0 (0.0%) | 0 (0.0%) |
| 35 to 44 Years | 0 (0.0%) | 6 (100.0%) |
| 45 to 54 Years | 8 (26.7%) | 22 (73.3%) |
| 55 to 64 Years | 0 (0.0%) | 30 (100.0%) |
| 65 to 74 Years | 26 (100.0%) | 26 (100.0%) |
| 75 Years and over | 0 (0.0%) | 0 (0.0%) |
| Total | 41 (34.7%) | 103 (87.3%) |
Disability Status by Sex by Age in Fort Seneca
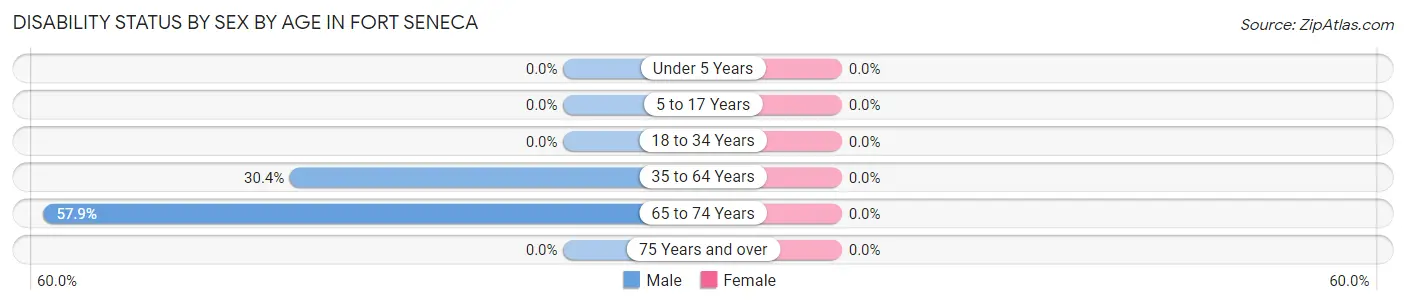
| Age Bracket | Male | Female |
| Under 5 Years | 0 (0.0%) | 0 (0.0%) |
| 5 to 17 Years | 0 (0.0%) | 0 (0.0%) |
| 18 to 34 Years | 0 (0.0%) | 0 (0.0%) |
| 35 to 64 Years | 7 (30.4%) | 0 (0.0%) |
| 65 to 74 Years | 11 (57.9%) | 0 (0.0%) |
| 75 Years and over | 0 (0.0%) | 0 (0.0%) |
Disability Class by Sex by Age in Fort Seneca
Disability Class: Hearing Difficulty
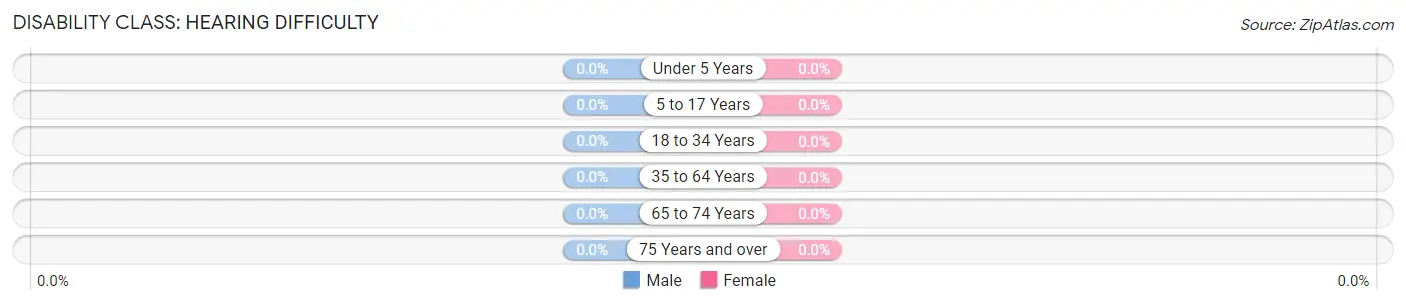
| Age Bracket | Male | Female |
| Under 5 Years | 0 (0.0%) | 0 (0.0%) |
| 5 to 17 Years | 0 (0.0%) | 0 (0.0%) |
| 18 to 34 Years | 0 (0.0%) | 0 (0.0%) |
| 35 to 64 Years | 0 (0.0%) | 0 (0.0%) |
| 65 to 74 Years | 0 (0.0%) | 0 (0.0%) |
| 75 Years and over | 0 (0.0%) | 0 (0.0%) |
Disability Class: Vision Difficulty
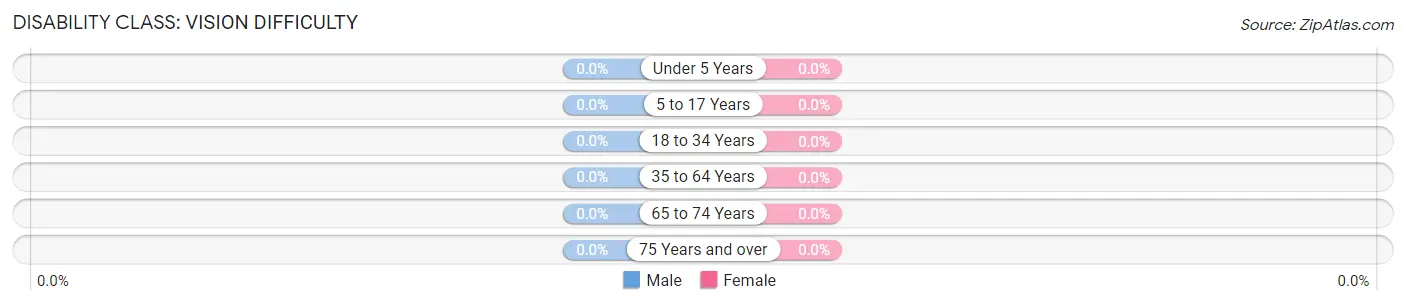
| Age Bracket | Male | Female |
| Under 5 Years | 0 (0.0%) | 0 (0.0%) |
| 5 to 17 Years | 0 (0.0%) | 0 (0.0%) |
| 18 to 34 Years | 0 (0.0%) | 0 (0.0%) |
| 35 to 64 Years | 0 (0.0%) | 0 (0.0%) |
| 65 to 74 Years | 0 (0.0%) | 0 (0.0%) |
| 75 Years and over | 0 (0.0%) | 0 (0.0%) |
Disability Class: Cognitive Difficulty
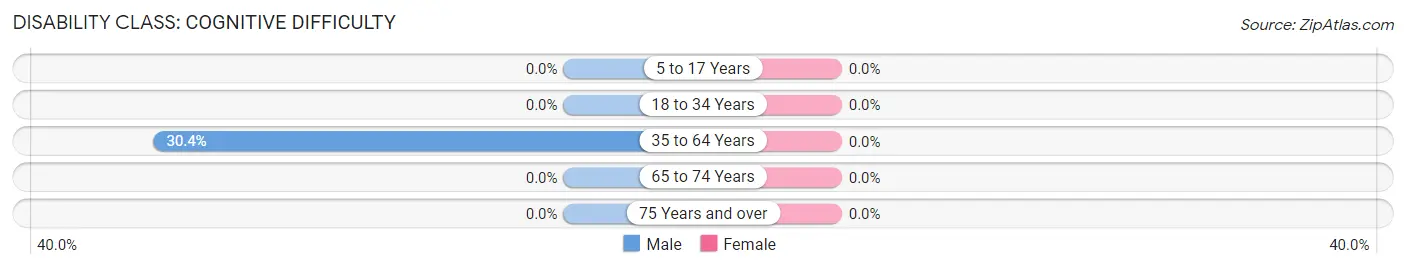
| Age Bracket | Male | Female |
| 5 to 17 Years | 0 (0.0%) | 0 (0.0%) |
| 18 to 34 Years | 0 (0.0%) | 0 (0.0%) |
| 35 to 64 Years | 7 (30.4%) | 0 (0.0%) |
| 65 to 74 Years | 0 (0.0%) | 0 (0.0%) |
| 75 Years and over | 0 (0.0%) | 0 (0.0%) |
Disability Class: Ambulatory Difficulty
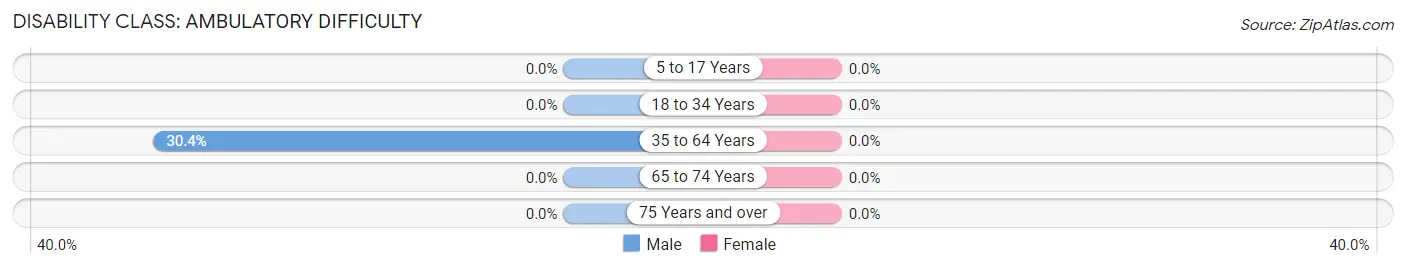
| Age Bracket | Male | Female |
| 5 to 17 Years | 0 (0.0%) | 0 (0.0%) |
| 18 to 34 Years | 0 (0.0%) | 0 (0.0%) |
| 35 to 64 Years | 7 (30.4%) | 0 (0.0%) |
| 65 to 74 Years | 0 (0.0%) | 0 (0.0%) |
| 75 Years and over | 0 (0.0%) | 0 (0.0%) |
Disability Class: Self-Care Difficulty
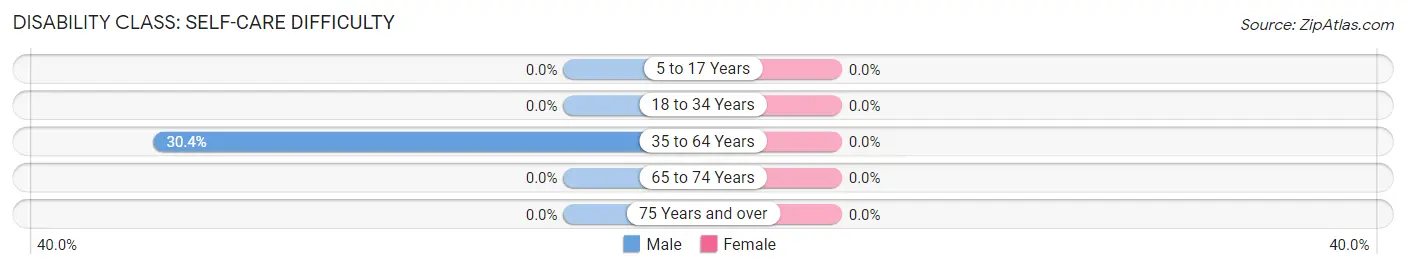
| Age Bracket | Male | Female |
| 5 to 17 Years | 0 (0.0%) | 0 (0.0%) |
| 18 to 34 Years | 0 (0.0%) | 0 (0.0%) |
| 35 to 64 Years | 7 (30.4%) | 0 (0.0%) |
| 65 to 74 Years | 0 (0.0%) | 0 (0.0%) |
| 75 Years and over | 0 (0.0%) | 0 (0.0%) |
Technology Access in Fort Seneca
Computing Device Access in Fort Seneca
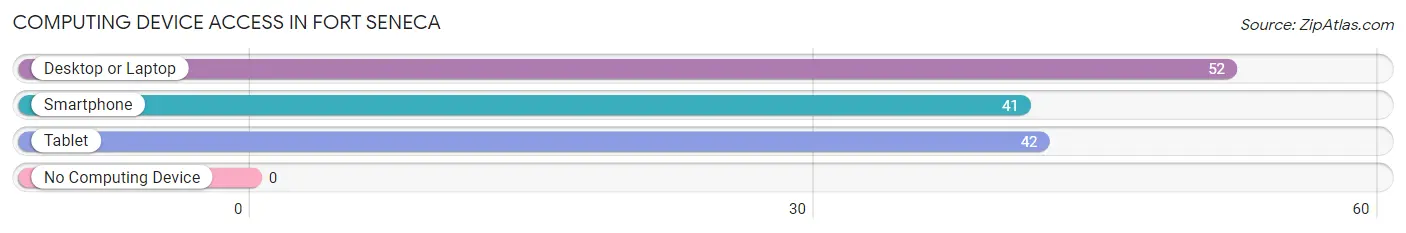
| Device Type | # Households | % Households |
| Desktop or Laptop | 52 | 100.0% |
| Smartphone | 41 | 78.8% |
| Tablet | 42 | 80.8% |
| No Computing Device | 0 | 0.0% |
| Total | 52 | 100.0% |
Internet Access in Fort Seneca
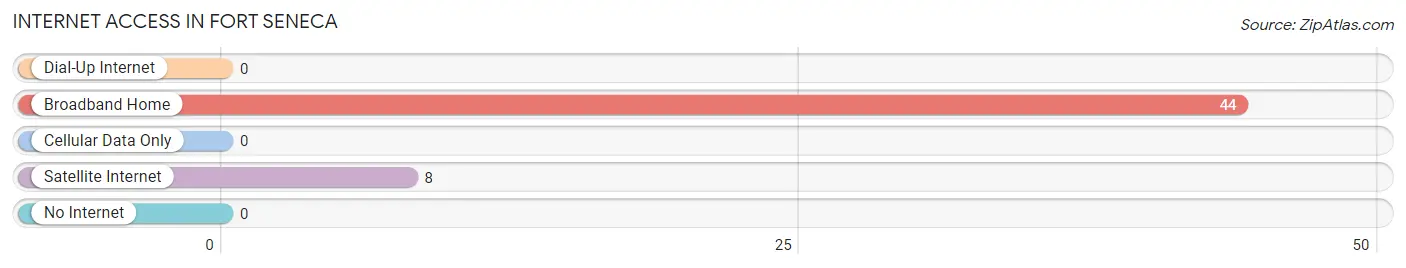
| Internet Type | # Households | % Households |
| Dial-Up Internet | 0 | 0.0% |
| Broadband Home | 44 | 84.6% |
| Cellular Data Only | 0 | 0.0% |
| Satellite Internet | 8 | 15.4% |
| No Internet | 0 | 0.0% |
| Total | 52 | 100.0% |
Fort Seneca Summary
History
Fort Seneca is a small unincorporated community located in Seneca County, Ohio. It is situated on the banks of the Sandusky River, approximately five miles south of Tiffin. The area was first settled in the early 1800s by a group of settlers from Pennsylvania. The settlement was originally known as “Seneca Town” and was located on the east side of the river. In 1812, the settlement was renamed “Fort Seneca” in honor of the Native American tribe that had once inhabited the area.
The town was a popular stop for travelers on the Sandusky River, as it was the only place between Tiffin and Fremont where travelers could find food and lodging. In 1817, a post office was established in the town, and in 1820, a ferry was built to cross the river. The ferry was operated by a man named John B. Smith, who also ran a store and a tavern in the town.
In 1825, a bridge was built across the river, and the town began to grow. A school was built in 1827, and a church was established in 1829. The town also had a blacksmith shop, a sawmill, and a gristmill.
In 1835, the town was incorporated as a village. The village was home to a variety of businesses, including a tannery, a woolen mill, a distillery, and a brickyard. The village also had a number of stores, including a general store, a drug store, and a hardware store.
In 1854, the village was connected to the outside world by the Sandusky, Dayton & Cincinnati Railroad. This allowed the village to become a shipping point for agricultural products, such as grain, hay, and livestock.
In 1871, the village was destroyed by a tornado. The village was rebuilt, but it never regained its former prosperity. In 1887, the village was annexed by the city of Tiffin.
Geography
Fort Seneca is located in Seneca County, Ohio. It is situated on the banks of the Sandusky River, approximately five miles south of Tiffin. The village is located in a rural area, surrounded by farmland. The terrain is mostly flat, with some rolling hills. The climate is humid continental, with hot summers and cold winters.
Economy
The economy of Fort Seneca is largely based on agriculture. The area is home to a number of farms, which produce a variety of crops, including corn, soybeans, wheat, and hay. Livestock is also raised in the area, including cattle, hogs, and sheep.
The village is also home to a number of small businesses, including a general store, a hardware store, and a drug store. There is also a post office in the village.
Demographics
As of the 2010 census, the population of Fort Seneca was 545. The racial makeup of the village was 97.3% White, 0.7% African American, 0.2% Native American, 0.2% Asian, and 1.6% from two or more races. Hispanic or Latino of any race were 0.7% of the population.
The median household income in Fort Seneca was $41,250, and the median family income was $45,000. The per capita income was $18,945. About 8.3% of families and 10.2% of the population were below the poverty line, including 14.3% of those under age 18 and 6.3% of those age 65 or over.
Common Questions
What is Per Capita Income in Fort Seneca?
Per Capita income in Fort Seneca is $29,442.
What is the Median Family Income in Fort Seneca?
Median Family Income in Fort Seneca is $75,595.
What is the Median Household income in Fort Seneca?
Median Household Income in Fort Seneca is $75,119.
What is Inequality or Gini Index in Fort Seneca?
Inequality or Gini Index in Fort Seneca is 0.28.
What is the Total Population of Fort Seneca?
Total Population of Fort Seneca is 118.
What is the Total Male Population of Fort Seneca?
Total Male Population of Fort Seneca is 48.
What is the Total Female Population of Fort Seneca?
Total Female Population of Fort Seneca is 70.
What is the Ratio of Males per 100 Females in Fort Seneca?
There are 68.57 Males per 100 Females in Fort Seneca.
What is the Ratio of Females per 100 Males in Fort Seneca?
There are 145.83 Females per 100 Males in Fort Seneca.
What is the Median Population Age in Fort Seneca?
Median Population Age in Fort Seneca is 54.6 Years.
What is the Average Family Size in Fort Seneca
Average Family Size in Fort Seneca is 2.5 People.
What is the Average Household Size in Fort Seneca
Average Household Size in Fort Seneca is 2.3 People.
How Large is the Labor Force in Fort Seneca?
There are 47 People in the Labor Forcein in Fort Seneca.
What is the Percentage of People in the Labor Force in Fort Seneca?
44.8% of People are in the Labor Force in Fort Seneca.
What is the Unemployment Rate in Fort Seneca?
Unemployment Rate in Fort Seneca is 14.9%.