Limestone, NY Map & Demographics
Limestone Map
Limestone Overview
$27,983
PER CAPITA INCOME
$68,750
AVG FAMILY INCOME
51.3%
WAGE / INCOME GAP [ % ]
48.7¢/ $1
WAGE / INCOME GAP [ $ ]
0.43
INEQUALITY / GINI INDEX
426
TOTAL POPULATION
201
MALE POPULATION
225
FEMALE POPULATION
89.33
MALES / 100 FEMALES
111.94
FEMALES / 100 MALES
41.8
MEDIAN AGE
3.1
AVG FAMILY SIZE
2.4
AVG HOUSEHOLD SIZE
186
LABOR FORCE [ PEOPLE ]
54.4%
PERCENT IN LABOR FORCE
Limestone Zip Codes
Limestone Area Codes
Income in Limestone
Income Overview in Limestone
| Characteristic | Number | Measure |
| Per Capita Income | 426 | $27,983 |
| Median Family Income | 104 | $68,750 |
| Mean Family Income | 104 | $82,038 |
| Median Household Income | 176 | $0 |
| Mean Household Income | 176 | $65,231 |
| Income Deficit | 104 | $0 |
| Wage / Income Gap (%) | 426 | 51.32% |
| Wage / Income Gap ($) | 426 | 48.68¢ per $1 |
| Gini / Inequality Index | 426 | 0.43 |
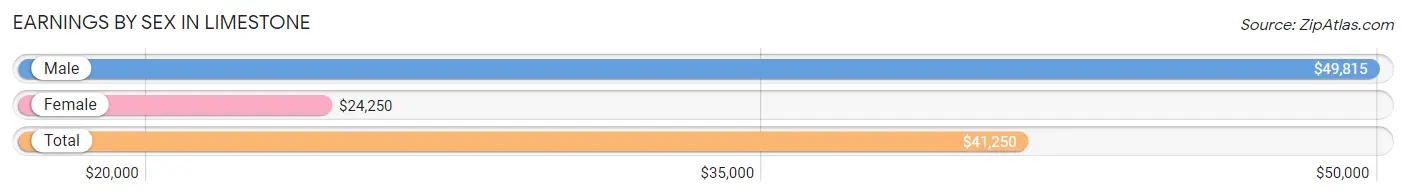
Earnings by Sex in Limestone
Average Earnings in Limestone are $41,250, $49,815 for men and $24,250 for women, a difference of 51.3%.
| Sex | Number | Average Earnings |
| Male | 102 (49.3%) | $49,815 |
| Female | 105 (50.7%) | $24,250 |
| Total | 207 (100.0%) | $41,250 |
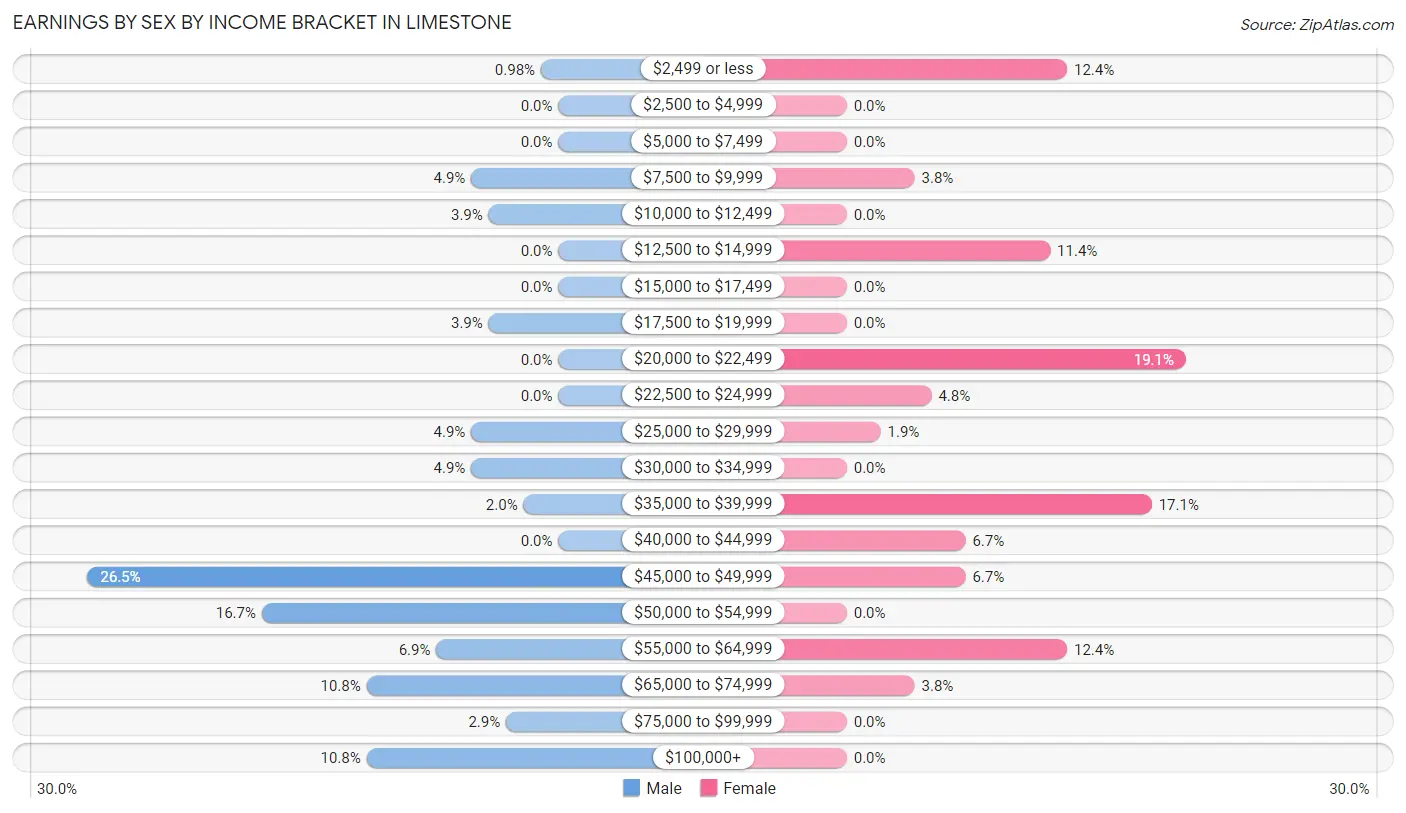
Earnings by Sex by Income Bracket in Limestone
The most common earnings brackets in Limestone are $45,000 to $49,999 for men (27 | 26.5%) and $20,000 to $22,499 for women (20 | 19.1%).
| Income | Male | Female |
| $2,499 or less | 1 (1.0%) | 13 (12.4%) |
| $2,500 to $4,999 | 0 (0.0%) | 0 (0.0%) |
| $5,000 to $7,499 | 0 (0.0%) | 0 (0.0%) |
| $7,500 to $9,999 | 5 (4.9%) | 4 (3.8%) |
| $10,000 to $12,499 | 4 (3.9%) | 0 (0.0%) |
| $12,500 to $14,999 | 0 (0.0%) | 12 (11.4%) |
| $15,000 to $17,499 | 0 (0.0%) | 0 (0.0%) |
| $17,500 to $19,999 | 4 (3.9%) | 0 (0.0%) |
| $20,000 to $22,499 | 0 (0.0%) | 20 (19.1%) |
| $22,500 to $24,999 | 0 (0.0%) | 5 (4.8%) |
| $25,000 to $29,999 | 5 (4.9%) | 2 (1.9%) |
| $30,000 to $34,999 | 5 (4.9%) | 0 (0.0%) |
| $35,000 to $39,999 | 2 (2.0%) | 18 (17.1%) |
| $40,000 to $44,999 | 0 (0.0%) | 7 (6.7%) |
| $45,000 to $49,999 | 27 (26.5%) | 7 (6.7%) |
| $50,000 to $54,999 | 17 (16.7%) | 0 (0.0%) |
| $55,000 to $64,999 | 7 (6.9%) | 13 (12.4%) |
| $65,000 to $74,999 | 11 (10.8%) | 4 (3.8%) |
| $75,000 to $99,999 | 3 (2.9%) | 0 (0.0%) |
| $100,000+ | 11 (10.8%) | 0 (0.0%) |
| Total | 102 (100.0%) | 105 (100.0%) |
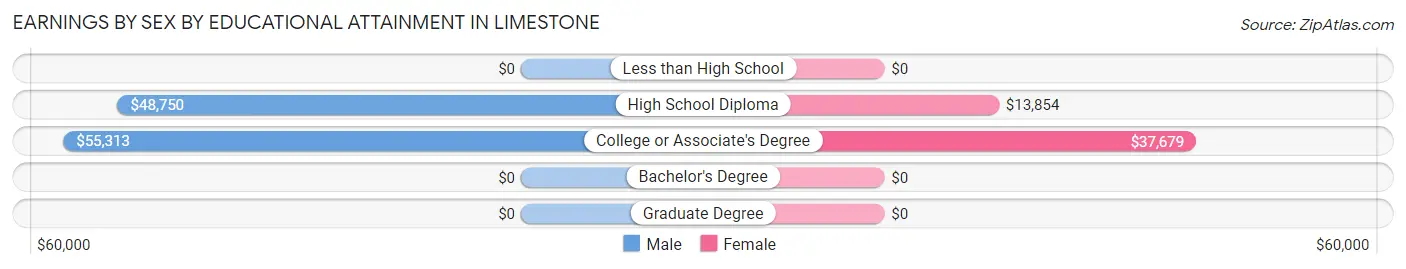
Earnings by Sex by Educational Attainment in Limestone
Average earnings in Limestone are $49,861 for men and $35,682 for women, a difference of 28.4%. Men with an educational attainment of college or associate's degree enjoy the highest average annual earnings of $55,313, while those with high school diploma education earn the least with $48,750. Women with an educational attainment of college or associate's degree earn the most with the average annual earnings of $37,679, while those with high school diploma education have the smallest earnings of $13,854.
| Educational Attainment | Male Income | Female Income |
| Less than High School | - | - |
| High School Diploma | $48,750 | $13,854 |
| College or Associate's Degree | $55,313 | $37,679 |
| Bachelor's Degree | - | - |
| Graduate Degree | - | - |
| Total | $49,861 | $35,682 |
Family Income in Limestone
Family Income Brackets in Limestone
According to the Limestone family income data, there are 31 families falling into the $100,000 to $149,999 income range, which is the most common income bracket and makes up 29.8% of all families.
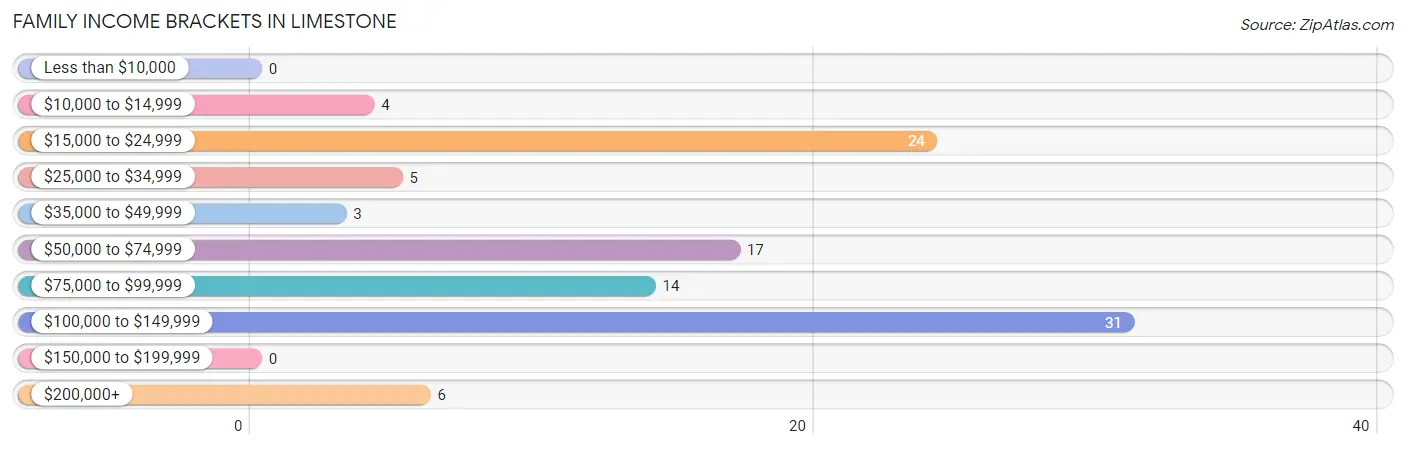
| Income Bracket | # Families | % Families |
| Less than $10,000 | 0 | 0.0% |
| $10,000 to $14,999 | 4 | 3.8% |
| $15,000 to $24,999 | 24 | 23.1% |
| $25,000 to $34,999 | 5 | 4.8% |
| $35,000 to $49,999 | 3 | 2.9% |
| $50,000 to $74,999 | 17 | 16.3% |
| $75,000 to $99,999 | 14 | 13.5% |
| $100,000 to $149,999 | 31 | 29.8% |
| $150,000 to $199,999 | 0 | 0.0% |
| $200,000+ | 6 | 5.8% |
Family Income by Famaliy Size in Limestone
4-person families (19 | 18.3%) account for the highest median family income in Limestone with $111,563 per family, while 3-person families (37 | 35.6%) have the highest median income of $33,073 per family member.
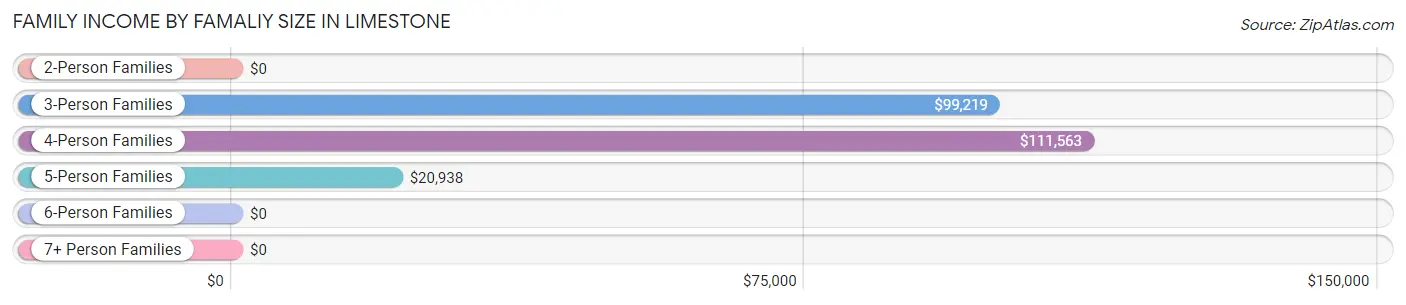
| Income Bracket | # Families | Median Income |
| 2-Person Families | 35 (33.7%) | $0 |
| 3-Person Families | 37 (35.6%) | $99,219 |
| 4-Person Families | 19 (18.3%) | $111,563 |
| 5-Person Families | 11 (10.6%) | $20,938 |
| 6-Person Families | 2 (1.9%) | $0 |
| 7+ Person Families | 0 (0.0%) | $0 |
| Total | 104 (100.0%) | $68,750 |
Family Income by Number of Earners in Limestone
The median family income in Limestone is $68,750, with families comprising 3+ earners (20) having the highest median family income of $140,625, while families with 1 earner (39) have the lowest median family income of $24,750, accounting for 19.2% and 37.5% of families, respectively.
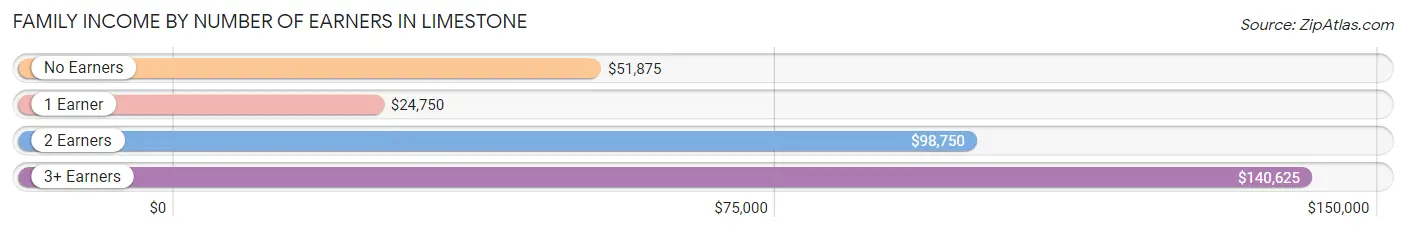
| Number of Earners | # Families | Median Income |
| No Earners | 11 (10.6%) | $51,875 |
| 1 Earner | 39 (37.5%) | $24,750 |
| 2 Earners | 34 (32.7%) | $98,750 |
| 3+ Earners | 20 (19.2%) | $140,625 |
| Total | 104 (100.0%) | $68,750 |
Household Income in Limestone
Household Income Brackets in Limestone
With 31 households falling in the category, the $100,000 to $149,999 income range is the most frequent in Limestone, accounting for 17.6% of all households.
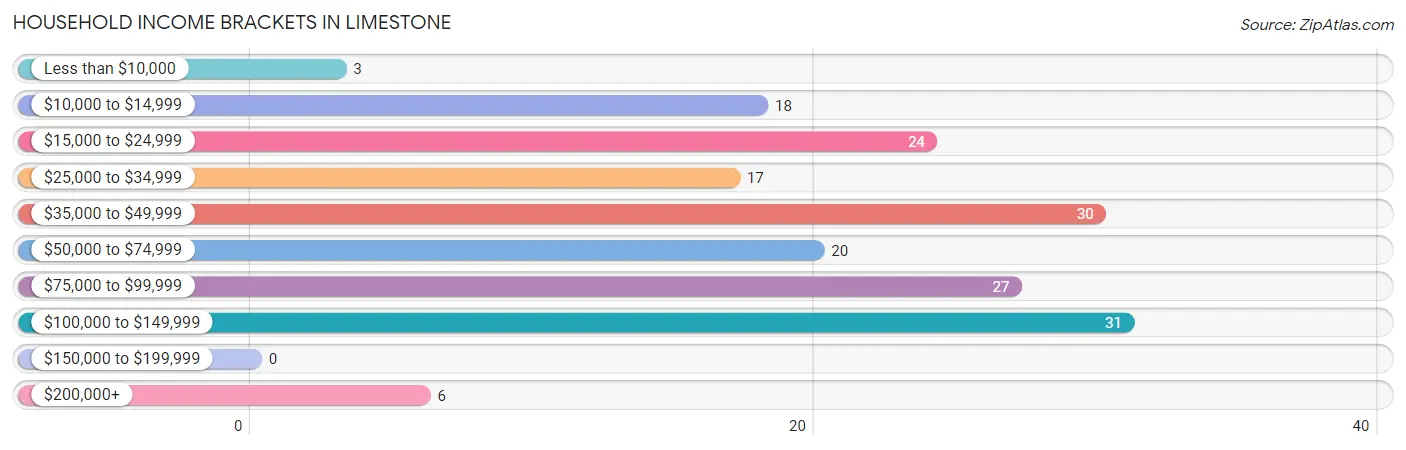
| Income Bracket | # Households | % Households |
| Less than $10,000 | 3 | 1.7% |
| $10,000 to $14,999 | 18 | 10.2% |
| $15,000 to $24,999 | 24 | 13.6% |
| $25,000 to $34,999 | 17 | 9.7% |
| $35,000 to $49,999 | 30 | 17.0% |
| $50,000 to $74,999 | 20 | 11.4% |
| $75,000 to $99,999 | 27 | 15.3% |
| $100,000 to $149,999 | 31 | 17.6% |
| $150,000 to $199,999 | 0 | 0.0% |
| $200,000+ | 6 | 3.4% |
Household Income by Householder Age in Limestone
The median household income in Limestone is $0, with the highest median household income of $98,906 found in the 45 to 64 years age bracket for the primary householder. A total of 65 households (36.9%) fall into this category.
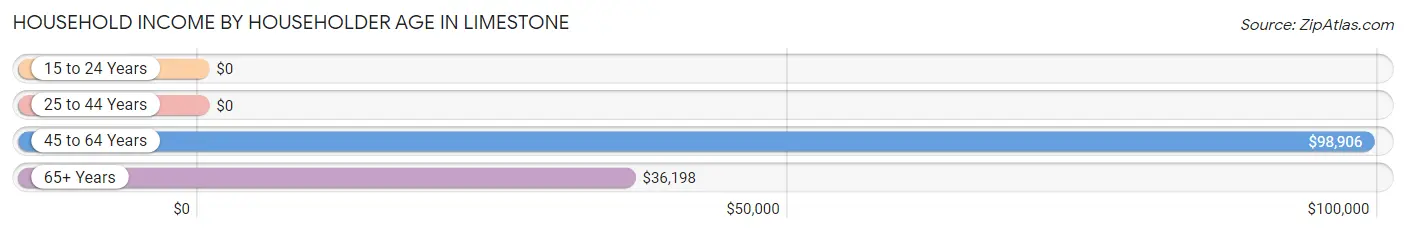
| Income Bracket | # Households | Median Income |
| 15 to 24 Years | 0 (0.0%) | $0 |
| 25 to 44 Years | 58 (33.0%) | $0 |
| 45 to 64 Years | 65 (36.9%) | $98,906 |
| 65+ Years | 53 (30.1%) | $36,198 |
| Total | 176 (100.0%) | $0 |
Poverty in Limestone
Income Below Poverty by Sex and Age in Limestone
With 17.9% poverty level for males and 22.4% for females among the residents of Limestone, 5 year old males and 25 to 34 year old females are the most vulnerable to poverty, with 8 males (100.0%) and 19 females (54.3%) in their respective age groups living below the poverty level.
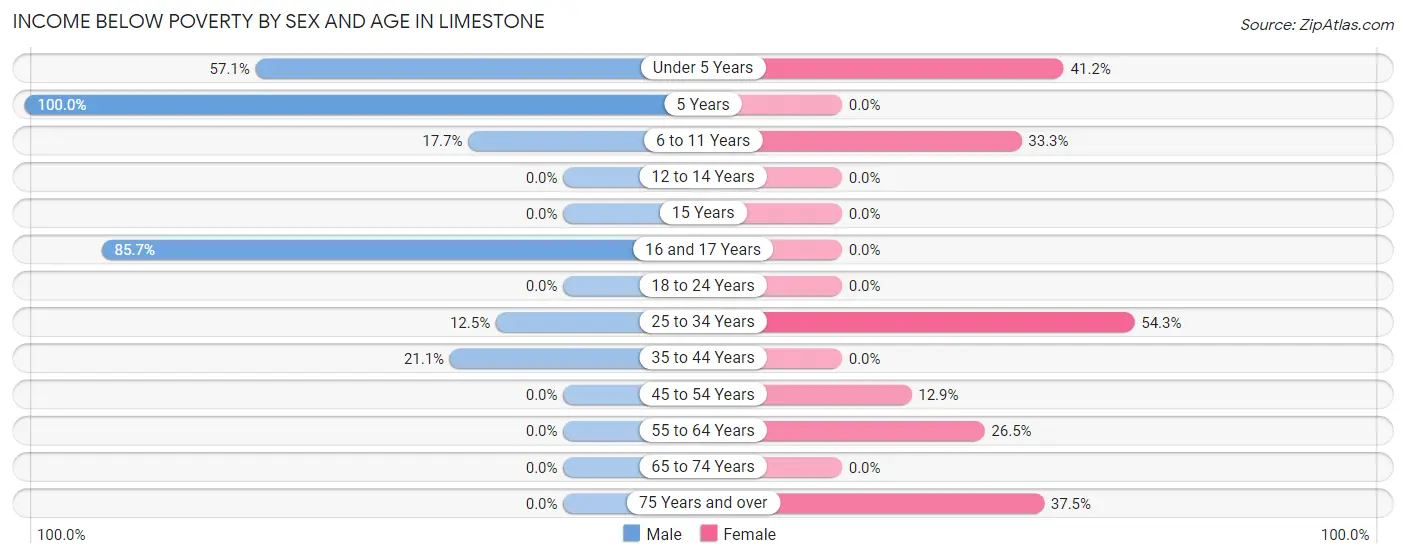
| Age Bracket | Male | Female |
| Under 5 Years | 4 (57.1%) | 7 (41.2%) |
| 5 Years | 8 (100.0%) | 0 (0.0%) |
| 6 to 11 Years | 3 (17.6%) | 8 (33.3%) |
| 12 to 14 Years | 0 (0.0%) | 0 (0.0%) |
| 15 Years | 0 (0.0%) | 0 (0.0%) |
| 16 and 17 Years | 12 (85.7%) | 0 (0.0%) |
| 18 to 24 Years | 0 (0.0%) | 0 (0.0%) |
| 25 to 34 Years | 4 (12.5%) | 19 (54.3%) |
| 35 to 44 Years | 4 (21.0%) | 0 (0.0%) |
| 45 to 54 Years | 0 (0.0%) | 4 (12.9%) |
| 55 to 64 Years | 0 (0.0%) | 9 (26.5%) |
| 65 to 74 Years | 0 (0.0%) | 0 (0.0%) |
| 75 Years and over | 0 (0.0%) | 3 (37.5%) |
| Total | 35 (17.9%) | 50 (22.4%) |
Income Above Poverty by Sex and Age in Limestone
According to the poverty statistics in Limestone, males aged 12 to 14 years and females aged 18 to 24 years are the age groups that are most secure financially, with 100.0% of males and 100.0% of females in these age groups living above the poverty line.
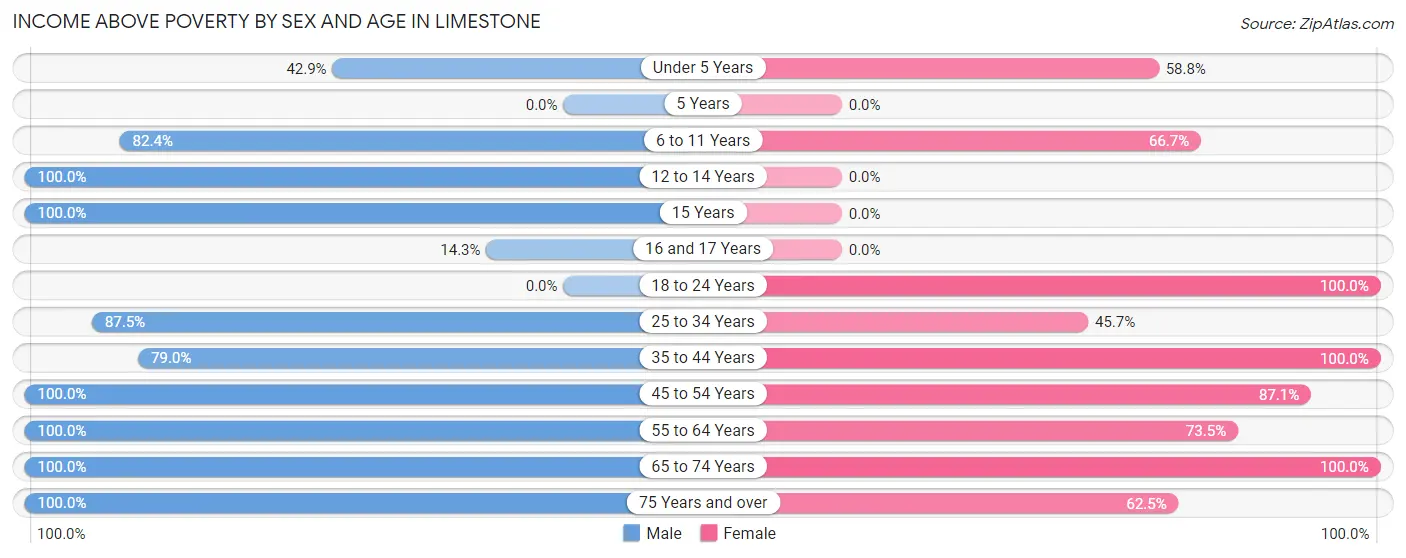
| Age Bracket | Male | Female |
| Under 5 Years | 3 (42.9%) | 10 (58.8%) |
| 5 Years | 0 (0.0%) | 0 (0.0%) |
| 6 to 11 Years | 14 (82.4%) | 16 (66.7%) |
| 12 to 14 Years | 2 (100.0%) | 0 (0.0%) |
| 15 Years | 6 (100.0%) | 0 (0.0%) |
| 16 and 17 Years | 2 (14.3%) | 0 (0.0%) |
| 18 to 24 Years | 0 (0.0%) | 13 (100.0%) |
| 25 to 34 Years | 28 (87.5%) | 16 (45.7%) |
| 35 to 44 Years | 15 (78.9%) | 24 (100.0%) |
| 45 to 54 Years | 28 (100.0%) | 27 (87.1%) |
| 55 to 64 Years | 40 (100.0%) | 25 (73.5%) |
| 65 to 74 Years | 10 (100.0%) | 37 (100.0%) |
| 75 Years and over | 12 (100.0%) | 5 (62.5%) |
| Total | 160 (82.1%) | 173 (77.6%) |
Income Below Poverty Among Married-Couple Families in Limestone
The poverty statistics for married-couple families in Limestone show that 8.7% or 8 of the total 92 families live below the poverty line. Families with 3 or 4 children have the highest poverty rate of 100.0%, comprising of 8 families. On the other hand, families with no children have the lowest poverty rate of 0.0%, which includes 0 families.
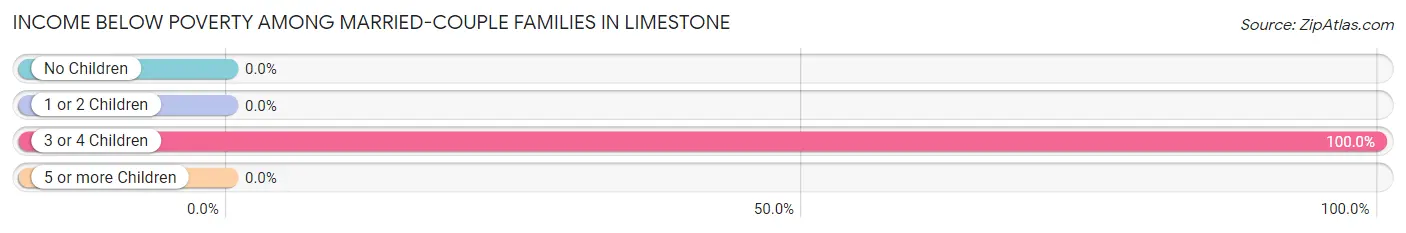
| Children | Above Poverty | Below Poverty |
| No Children | 51 (100.0%) | 0 (0.0%) |
| 1 or 2 Children | 33 (100.0%) | 0 (0.0%) |
| 3 or 4 Children | 0 (0.0%) | 8 (100.0%) |
| 5 or more Children | 0 (0.0%) | 0 (0.0%) |
| Total | 84 (91.3%) | 8 (8.7%) |
Income Below Poverty Among Single-Parent Households in Limestone
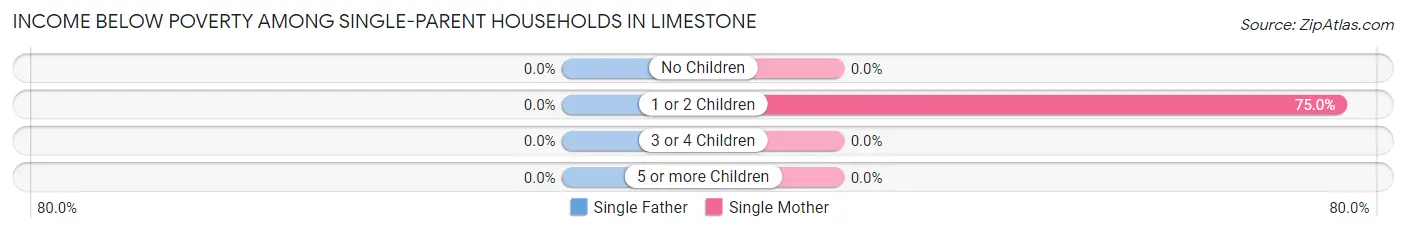
| Children | Single Father | Single Mother |
| No Children | 0 (0.0%) | 0 (0.0%) |
| 1 or 2 Children | 0 (0.0%) | 9 (75.0%) |
| 3 or 4 Children | 0 (0.0%) | 0 (0.0%) |
| 5 or more Children | 0 (0.0%) | 0 (0.0%) |
| Total | 0 (0.0%) | 9 (75.0%) |
Income Below Poverty Among Married-Couple vs Single-Parent Households in Limestone
The poverty data for Limestone shows that 8 of the married-couple family households (8.7%) and 9 of the single-parent households (75.0%) are living below the poverty level. Within the married-couple family households, those with 3 or 4 children have the highest poverty rate, with 8 households (100.0%) falling below the poverty line. Among the single-parent households, those with 1 or 2 children have the highest poverty rate, with 9 household (75.0%) living below poverty.
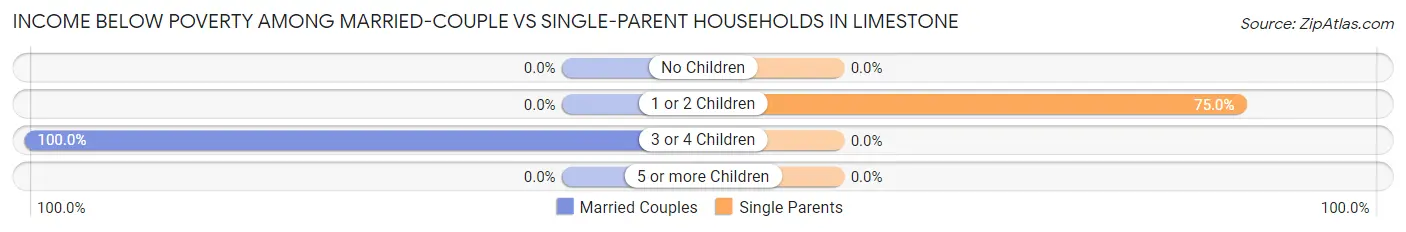
| Children | Married-Couple Families | Single-Parent Households |
| No Children | 0 (0.0%) | 0 (0.0%) |
| 1 or 2 Children | 0 (0.0%) | 9 (75.0%) |
| 3 or 4 Children | 8 (100.0%) | 0 (0.0%) |
| 5 or more Children | 0 (0.0%) | 0 (0.0%) |
| Total | 8 (8.7%) | 9 (75.0%) |
Race in Limestone
The most populous races in Limestone are White / Caucasian (401 | 94.1%), Some other Race (13 | 3.0%), and Two or more Races (7 | 1.6%).
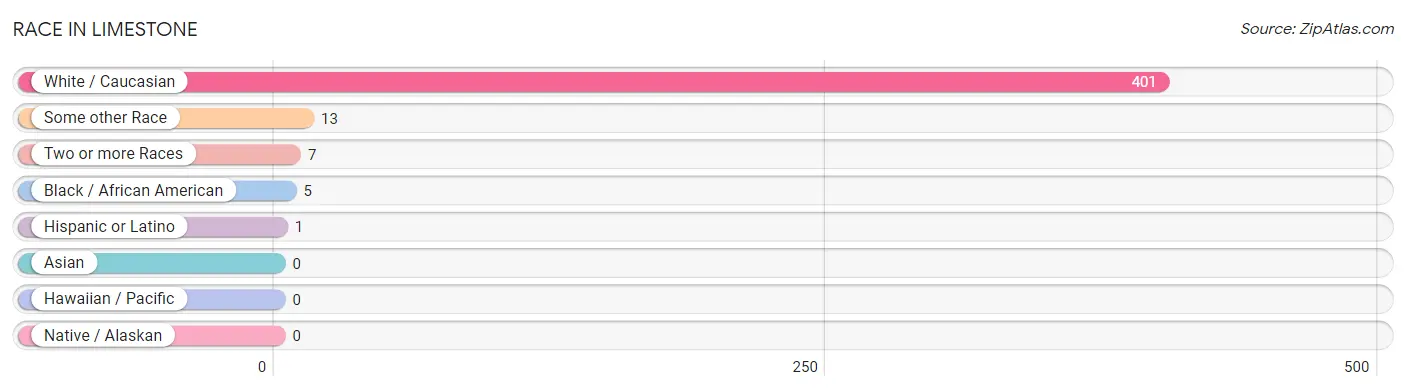
| Race | # Population | % Population |
| Asian | 0 | 0.0% |
| Black / African American | 5 | 1.2% |
| Hawaiian / Pacific | 0 | 0.0% |
| Hispanic or Latino | 1 | 0.2% |
| Native / Alaskan | 0 | 0.0% |
| White / Caucasian | 401 | 94.1% |
| Two or more Races | 7 | 1.6% |
| Some other Race | 13 | 3.0% |
| Total | 426 | 100.0% |
Ancestry in Limestone
The most populous ancestries reported in Limestone are Irish (146 | 34.3%), German (99 | 23.2%), Italian (57 | 13.4%), English (43 | 10.1%), and American (14 | 3.3%), together accounting for 84.3% of all Limestone residents.
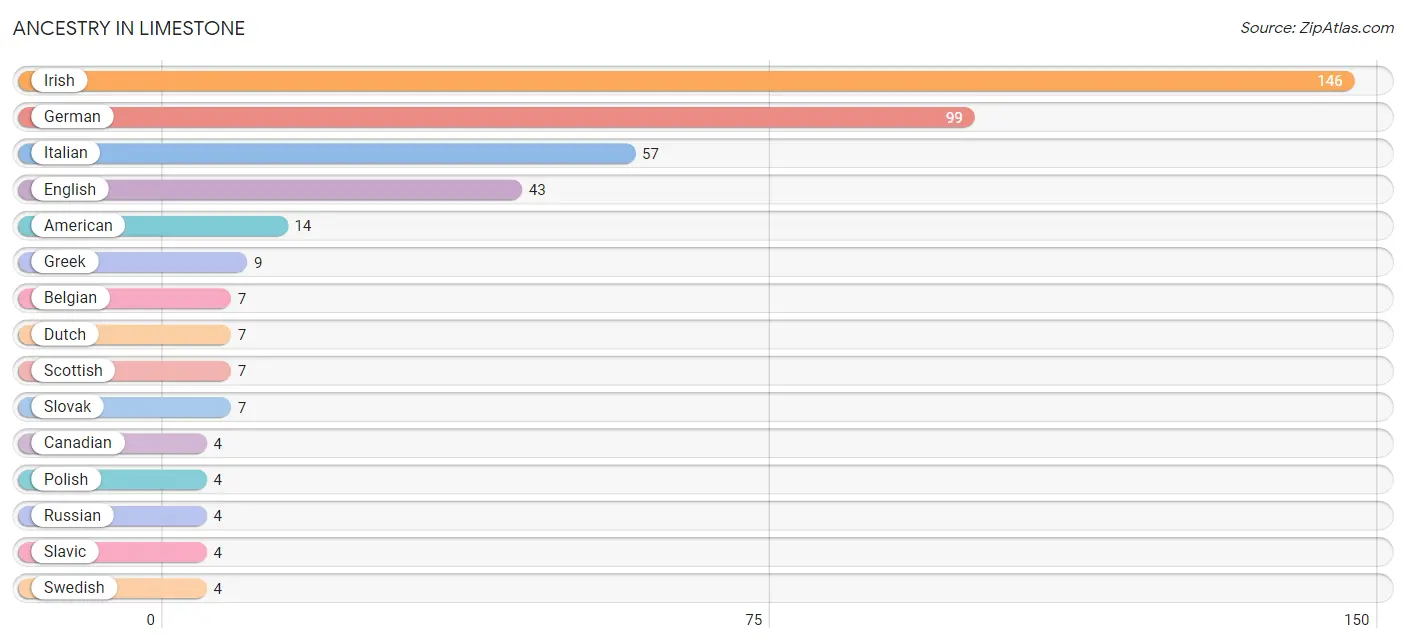
| Ancestry | # Population | % Population |
| American | 14 | 3.3% |
| Belgian | 7 | 1.6% |
| Canadian | 4 | 0.9% |
| Dutch | 7 | 1.6% |
| English | 43 | 10.1% |
| German | 99 | 23.2% |
| Greek | 9 | 2.1% |
| Irish | 146 | 34.3% |
| Italian | 57 | 13.4% |
| Pennsylvania German | 3 | 0.7% |
| Polish | 4 | 0.9% |
| Russian | 4 | 0.9% |
| Scottish | 7 | 1.6% |
| Serbian | 3 | 0.7% |
| Slavic | 4 | 0.9% |
| Slovak | 7 | 1.6% |
| Swedish | 4 | 0.9% | View All 17 Rows |
Immigrants in Limestone

| Immigration Origin | # Population | % Population | View All 0 Rows |
Sex and Age in Limestone
Sex and Age in Limestone
The most populous age groups in Limestone are 15 to 19 Years (24 | 11.9%) for men and 70 to 74 Years (27 | 12.0%) for women.
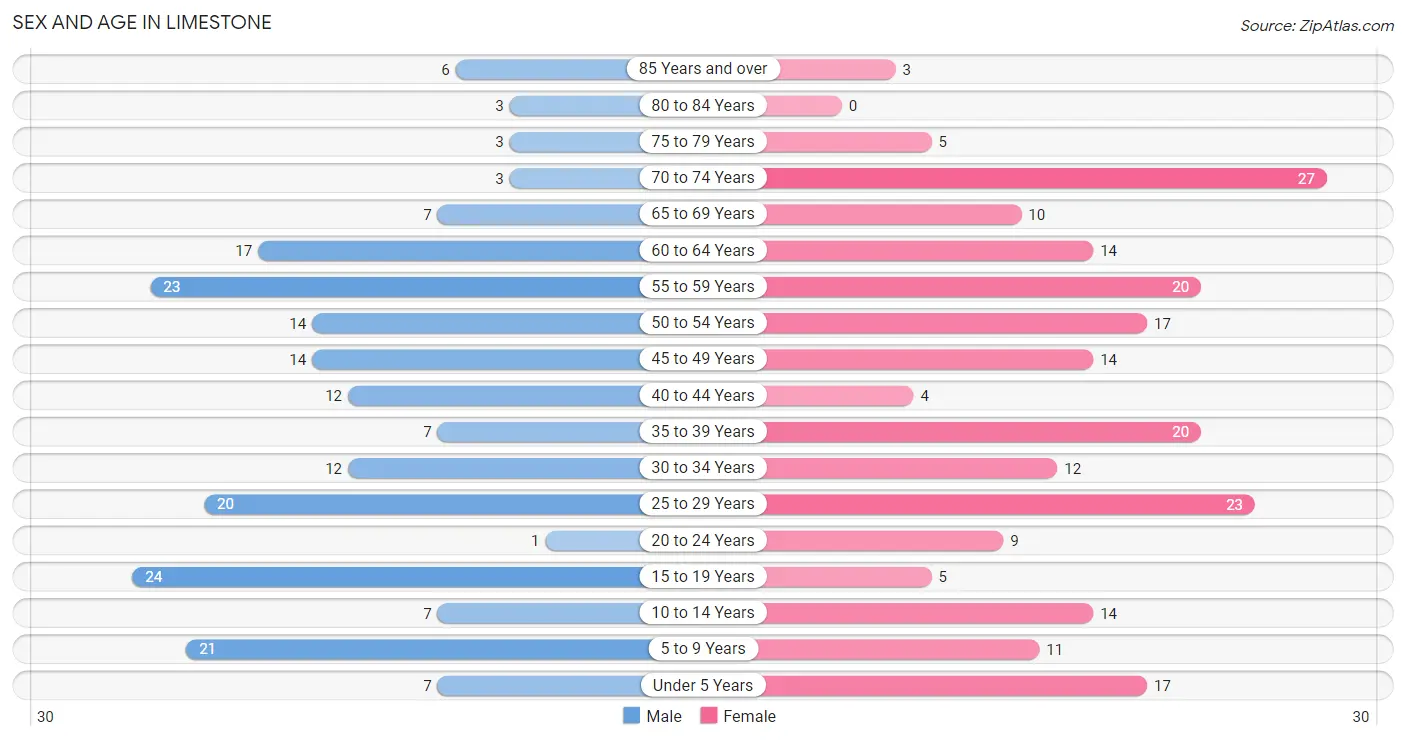
| Age Bracket | Male | Female |
| Under 5 Years | 7 (3.5%) | 17 (7.6%) |
| 5 to 9 Years | 21 (10.4%) | 11 (4.9%) |
| 10 to 14 Years | 7 (3.5%) | 14 (6.2%) |
| 15 to 19 Years | 24 (11.9%) | 5 (2.2%) |
| 20 to 24 Years | 1 (0.5%) | 9 (4.0%) |
| 25 to 29 Years | 20 (10.0%) | 23 (10.2%) |
| 30 to 34 Years | 12 (6.0%) | 12 (5.3%) |
| 35 to 39 Years | 7 (3.5%) | 20 (8.9%) |
| 40 to 44 Years | 12 (6.0%) | 4 (1.8%) |
| 45 to 49 Years | 14 (7.0%) | 14 (6.2%) |
| 50 to 54 Years | 14 (7.0%) | 17 (7.6%) |
| 55 to 59 Years | 23 (11.4%) | 20 (8.9%) |
| 60 to 64 Years | 17 (8.5%) | 14 (6.2%) |
| 65 to 69 Years | 7 (3.5%) | 10 (4.4%) |
| 70 to 74 Years | 3 (1.5%) | 27 (12.0%) |
| 75 to 79 Years | 3 (1.5%) | 5 (2.2%) |
| 80 to 84 Years | 3 (1.5%) | 0 (0.0%) |
| 85 Years and over | 6 (3.0%) | 3 (1.3%) |
| Total | 201 (100.0%) | 225 (100.0%) |
Families and Households in Limestone
Median Family Size in Limestone
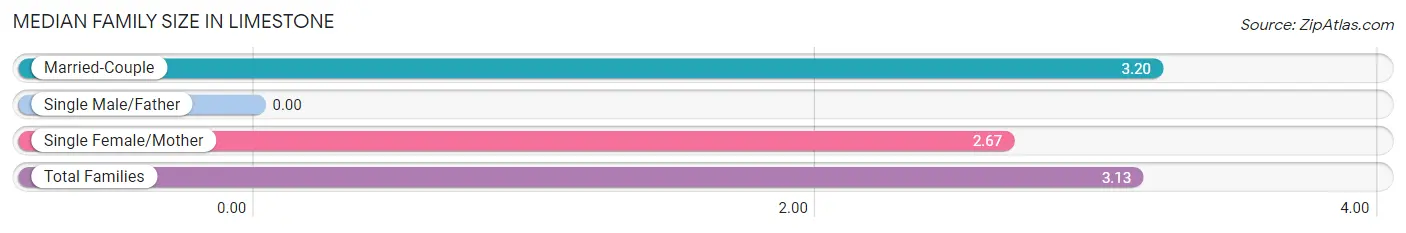
| Family Type | # Families | Family Size |
| Married-Couple | 92 (88.5%) | 3.20 |
| Single Male/Father | 0 (0.0%) | - |
| Single Female/Mother | 12 (11.5%) | 2.67 |
| Total Families | 104 (100.0%) | 3.13 |
Median Household Size in Limestone
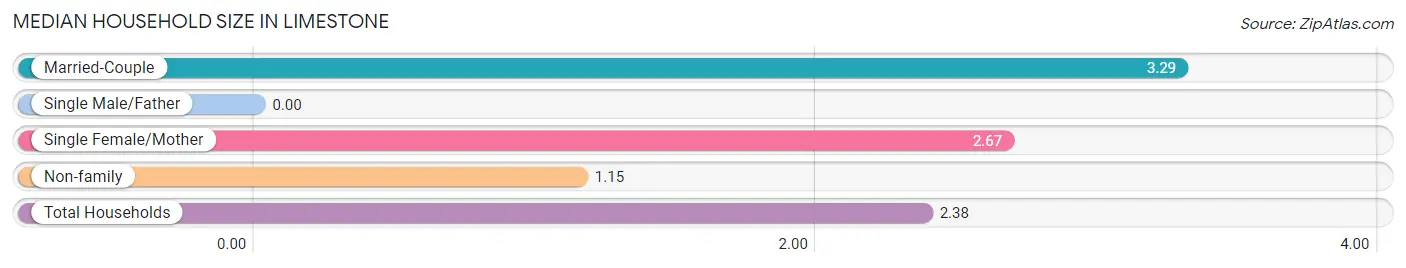
| Household Type | # Households | Household Size |
| Married-Couple | 92 (52.3%) | 3.29 |
| Single Male/Father | 0 (0.0%) | - |
| Single Female/Mother | 12 (6.8%) | 2.67 |
| Non-family | 72 (40.9%) | 1.15 |
| Total Households | 176 (100.0%) | 2.38 |
Household Size by Marriage Status in Limestone
Out of a total of 176 households in Limestone, 104 (59.1%) are family households, while 72 (40.9%) are nonfamily households. The most numerous type of family households are 3-person households, comprising 48, and the most common type of nonfamily households are 1-person households, comprising 62.
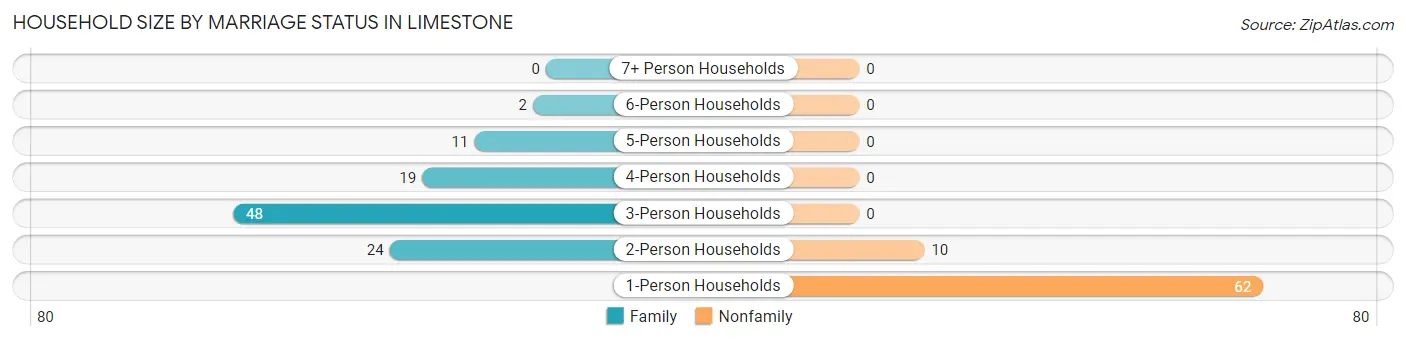
| Household Size | Family Households | Nonfamily Households |
| 1-Person Households | - | 62 (35.2%) |
| 2-Person Households | 24 (13.6%) | 10 (5.7%) |
| 3-Person Households | 48 (27.3%) | 0 (0.0%) |
| 4-Person Households | 19 (10.8%) | 0 (0.0%) |
| 5-Person Households | 11 (6.2%) | 0 (0.0%) |
| 6-Person Households | 2 (1.1%) | 0 (0.0%) |
| 7+ Person Households | 0 (0.0%) | 0 (0.0%) |
| Total | 104 (59.1%) | 72 (40.9%) |
Female Fertility in Limestone
Fertility by Age in Limestone
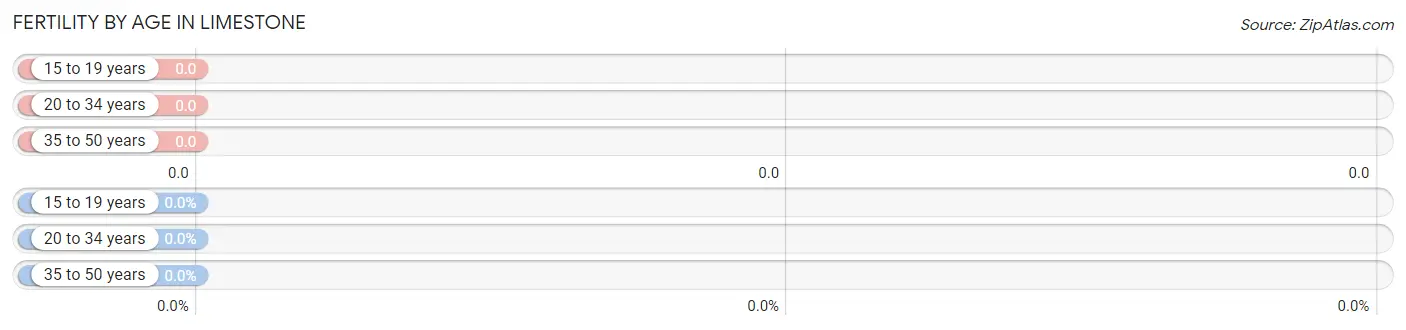
| Age Bracket | Women with Births | Births / 1,000 Women |
| 15 to 19 years | 0 (0.0%) | 0.0 |
| 20 to 34 years | 0 (0.0%) | 0.0 |
| 35 to 50 years | 0 (0.0%) | 0.0 |
| Total | 0 (0.0%) | 0.0 |
Fertility by Age by Marriage Status in Limestone
| Age Bracket | Married | Unmarried |
| 15 to 19 years | 0 (0.0%) | 0 (0.0%) |
| 20 to 34 years | 0 (0.0%) | 0 (0.0%) |
| 35 to 50 years | 0 (0.0%) | 0 (0.0%) |
| Total | 0 (0.0%) | 0 (0.0%) |
Fertility by Education in Limestone
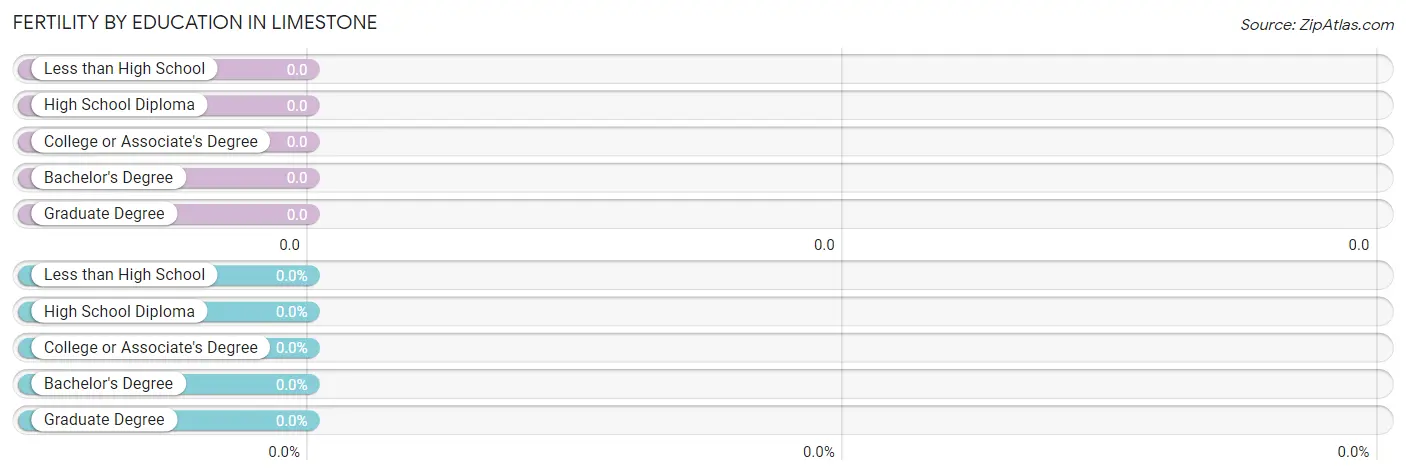
| Educational Attainment | Women with Births | Births / 1,000 Women |
| Less than High School | 0 (0.0%) | 0.0 |
| High School Diploma | 0 (0.0%) | 0.0 |
| College or Associate's Degree | 0 (0.0%) | 0.0 |
| Bachelor's Degree | 0 (0.0%) | 0.0 |
| Graduate Degree | 0 (0.0%) | 0.0 |
| Total | 0 (0.0%) | 0.0 |
Fertility by Education by Marriage Status in Limestone
| Educational Attainment | Married | Unmarried |
| Less than High School | 0 (0.0%) | 0 (0.0%) |
| High School Diploma | 0 (0.0%) | 0 (0.0%) |
| College or Associate's Degree | 0 (0.0%) | 0 (0.0%) |
| Bachelor's Degree | 0 (0.0%) | 0 (0.0%) |
| Graduate Degree | 0 (0.0%) | 0 (0.0%) |
| Total | 0 (0.0%) | 0 (0.0%) |
Employment Characteristics in Limestone
Employment by Class of Employer in Limestone
Among the 186 employed individuals in Limestone, private company employees (126 | 67.7%), not-for-profit organizations (28 | 15.0%), and local government employees (17 | 9.1%) make up the most common classes of employment.
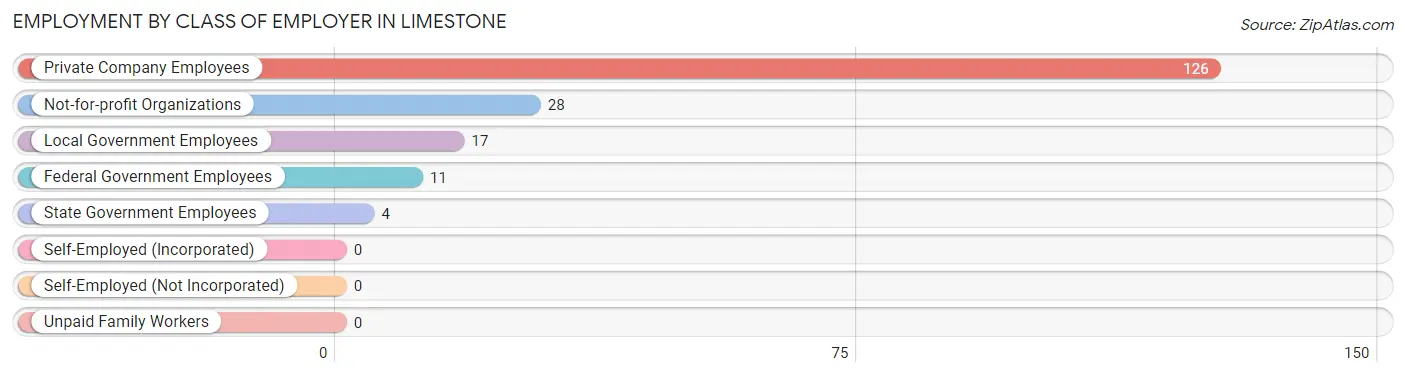
| Employer Class | # Employees | % Employees |
| Private Company Employees | 126 | 67.7% |
| Self-Employed (Incorporated) | 0 | 0.0% |
| Self-Employed (Not Incorporated) | 0 | 0.0% |
| Not-for-profit Organizations | 28 | 15.0% |
| Local Government Employees | 17 | 9.1% |
| State Government Employees | 4 | 2.1% |
| Federal Government Employees | 11 | 5.9% |
| Unpaid Family Workers | 0 | 0.0% |
| Total | 186 | 100.0% |
Employment Status by Age in Limestone
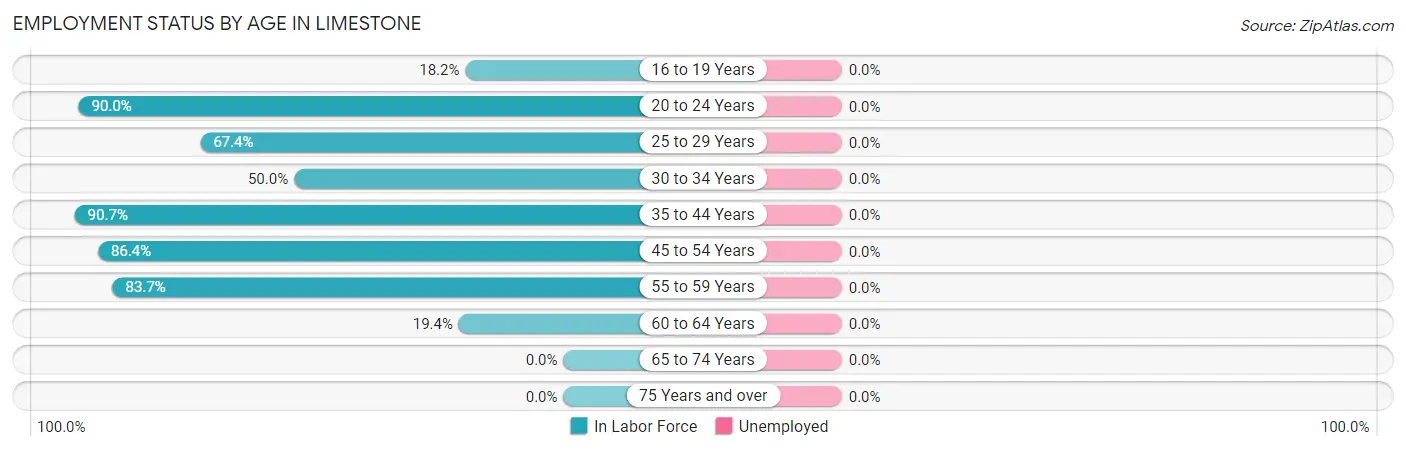
| Age Bracket | In Labor Force | Unemployed |
| 16 to 19 Years | 4 (18.2%) | 0 (0.0%) |
| 20 to 24 Years | 9 (90.0%) | 0 (0.0%) |
| 25 to 29 Years | 29 (67.4%) | 0 (0.0%) |
| 30 to 34 Years | 12 (50.0%) | 0 (0.0%) |
| 35 to 44 Years | 39 (90.7%) | 0 (0.0%) |
| 45 to 54 Years | 51 (86.4%) | 0 (0.0%) |
| 55 to 59 Years | 36 (83.7%) | 0 (0.0%) |
| 60 to 64 Years | 6 (19.4%) | 0 (0.0%) |
| 65 to 74 Years | 0 (0.0%) | 0 (0.0%) |
| 75 Years and over | 0 (0.0%) | 0 (0.0%) |
| Total | 186 (54.4%) | 0 (0.0%) |
Employment Status by Educational Attainment in Limestone
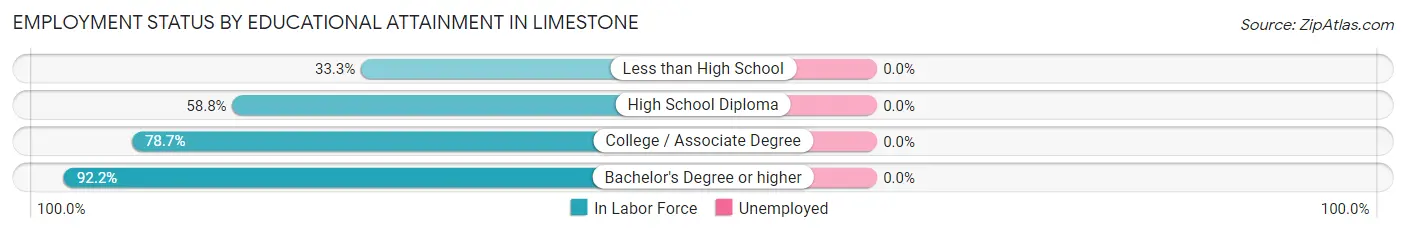
| Educational Attainment | In Labor Force | Unemployed |
| Less than High School | 6 (33.3%) | 0 (0.0%) |
| High School Diploma | 50 (58.8%) | 0 (0.0%) |
| College / Associate Degree | 70 (78.7%) | 0 (0.0%) |
| Bachelor's Degree or higher | 47 (92.2%) | 0 (0.0%) |
| Total | 173 (71.2%) | 0 (0.0%) |
Employment Occupations by Sex in Limestone
Management, Business, Science and Arts Occupations
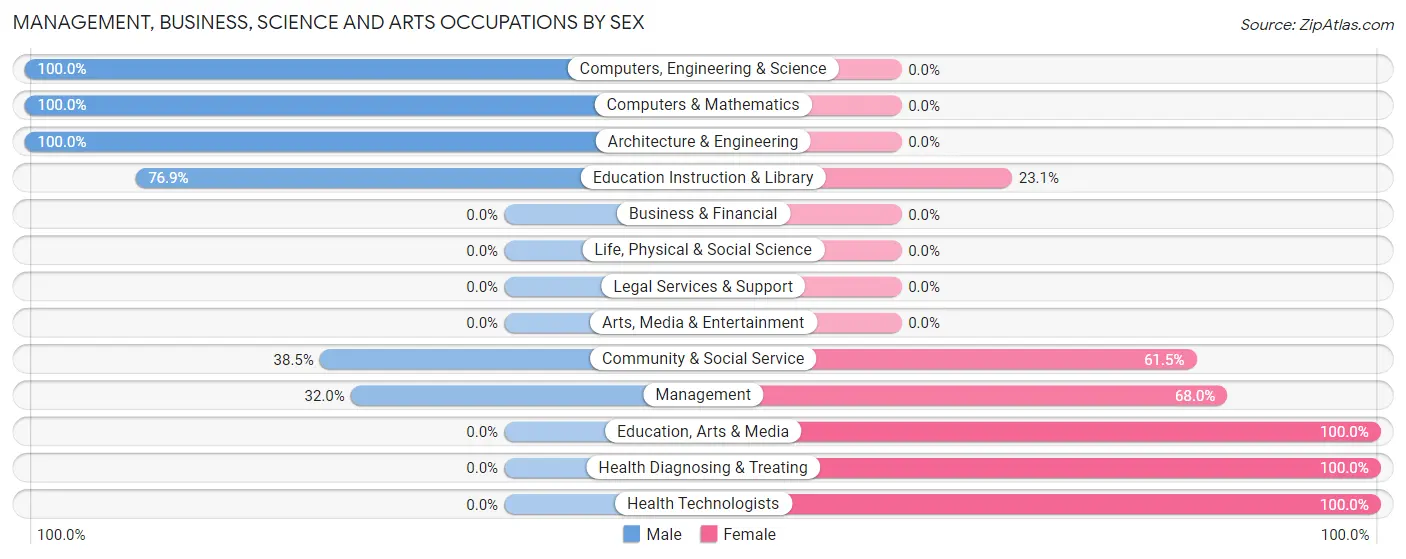
The most common Management, Business, Science and Arts occupations in Limestone are Community & Social Service (26 | 14.0%), Management (25 | 13.4%), Education, Arts & Media (13 | 7.0%), Education Instruction & Library (13 | 7.0%), and Computers, Engineering & Science (10 | 5.4%).
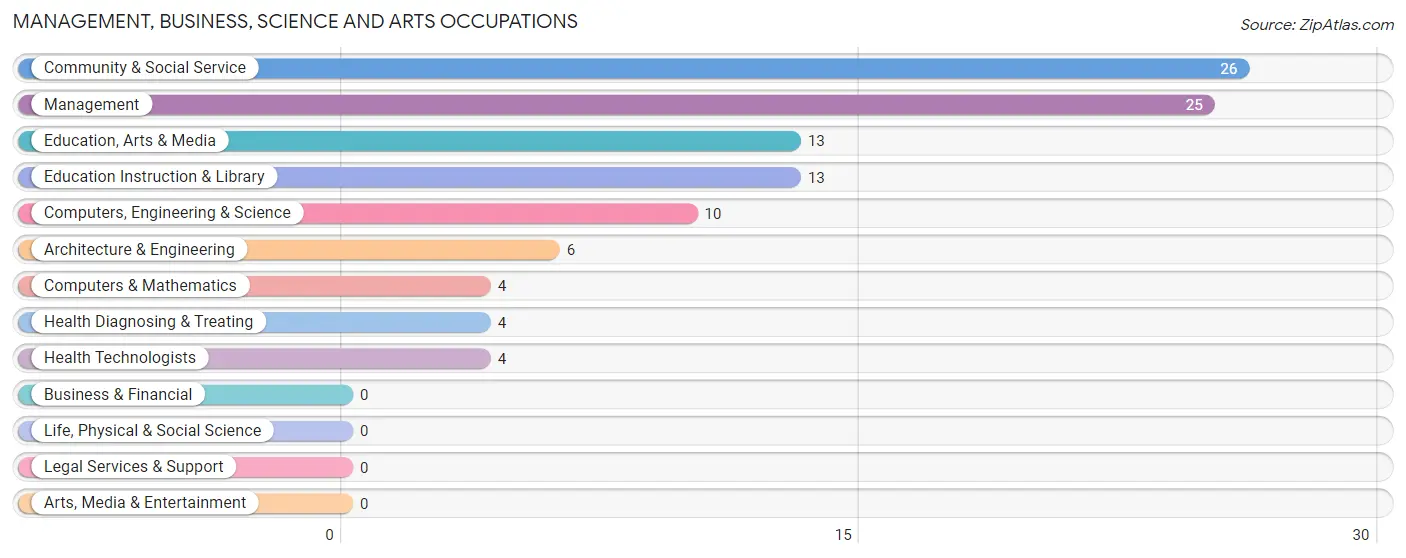
Management, Business, Science and Arts Occupations by Sex
Within the Management, Business, Science and Arts occupations in Limestone, the most male-oriented occupations are Computers, Engineering & Science (100.0%), Computers & Mathematics (100.0%), and Architecture & Engineering (100.0%), while the most female-oriented occupations are Education, Arts & Media (100.0%), Health Diagnosing & Treating (100.0%), and Health Technologists (100.0%).
| Occupation | Male | Female |
| Management | 8 (32.0%) | 17 (68.0%) |
| Business & Financial | 0 (0.0%) | 0 (0.0%) |
| Computers, Engineering & Science | 10 (100.0%) | 0 (0.0%) |
| Computers & Mathematics | 4 (100.0%) | 0 (0.0%) |
| Architecture & Engineering | 6 (100.0%) | 0 (0.0%) |
| Life, Physical & Social Science | 0 (0.0%) | 0 (0.0%) |
| Community & Social Service | 10 (38.5%) | 16 (61.5%) |
| Education, Arts & Media | 0 (0.0%) | 13 (100.0%) |
| Legal Services & Support | 0 (0.0%) | 0 (0.0%) |
| Education Instruction & Library | 10 (76.9%) | 3 (23.1%) |
| Arts, Media & Entertainment | 0 (0.0%) | 0 (0.0%) |
| Health Diagnosing & Treating | 0 (0.0%) | 4 (100.0%) |
| Health Technologists | 0 (0.0%) | 4 (100.0%) |
| Total (Category) | 28 (43.1%) | 37 (56.9%) |
| Total (Overall) | 94 (50.5%) | 92 (49.5%) |
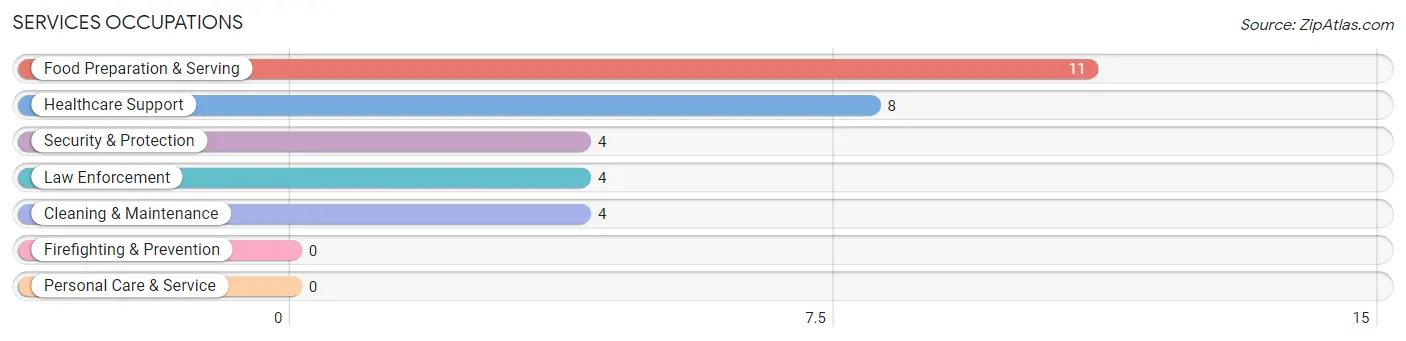
Services Occupations
The most common Services occupations in Limestone are Food Preparation & Serving (11 | 5.9%), Healthcare Support (8 | 4.3%), Security & Protection (4 | 2.1%), Law Enforcement (4 | 2.1%), and Cleaning & Maintenance (4 | 2.1%).
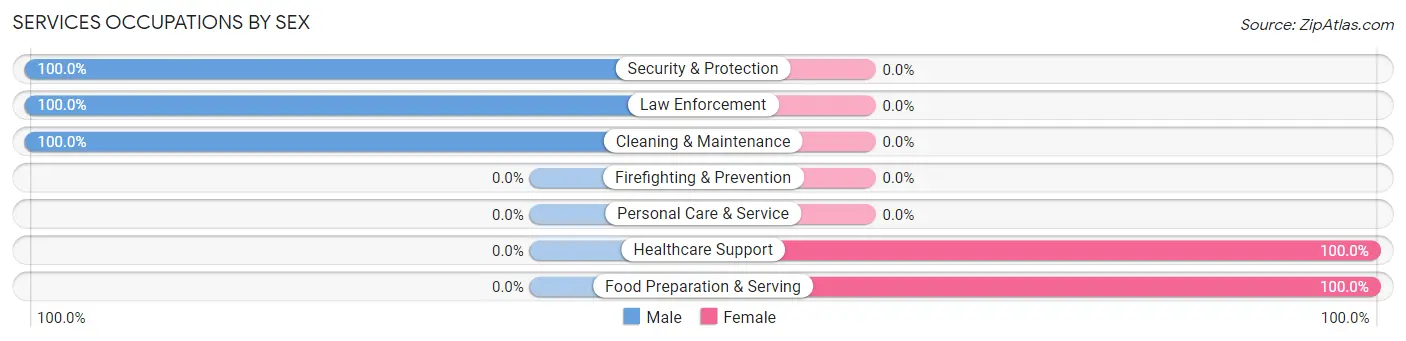
Services Occupations by Sex
Within the Services occupations in Limestone, the most male-oriented occupations are Security & Protection (100.0%), Law Enforcement (100.0%), and Cleaning & Maintenance (100.0%), while the most female-oriented occupations are Healthcare Support (100.0%), and Food Preparation & Serving (100.0%).
| Occupation | Male | Female |
| Healthcare Support | 0 (0.0%) | 8 (100.0%) |
| Security & Protection | 4 (100.0%) | 0 (0.0%) |
| Firefighting & Prevention | 0 (0.0%) | 0 (0.0%) |
| Law Enforcement | 4 (100.0%) | 0 (0.0%) |
| Food Preparation & Serving | 0 (0.0%) | 11 (100.0%) |
| Cleaning & Maintenance | 4 (100.0%) | 0 (0.0%) |
| Personal Care & Service | 0 (0.0%) | 0 (0.0%) |
| Total (Category) | 8 (29.6%) | 19 (70.4%) |
| Total (Overall) | 94 (50.5%) | 92 (49.5%) |
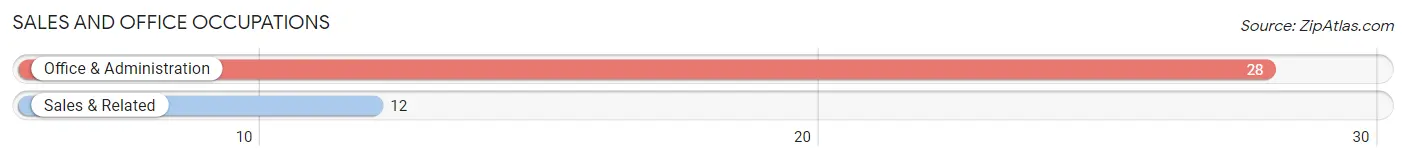
Sales and Office Occupations
The most common Sales and Office occupations in Limestone are Office & Administration (28 | 15.0%), and Sales & Related (12 | 6.5%).
Sales and Office Occupations by Sex
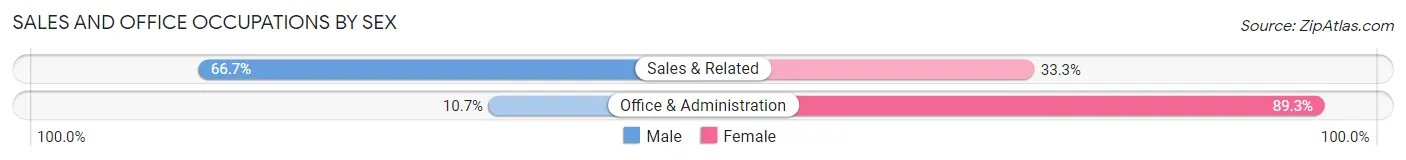
| Occupation | Male | Female |
| Sales & Related | 8 (66.7%) | 4 (33.3%) |
| Office & Administration | 3 (10.7%) | 25 (89.3%) |
| Total (Category) | 11 (27.5%) | 29 (72.5%) |
| Total (Overall) | 94 (50.5%) | 92 (49.5%) |
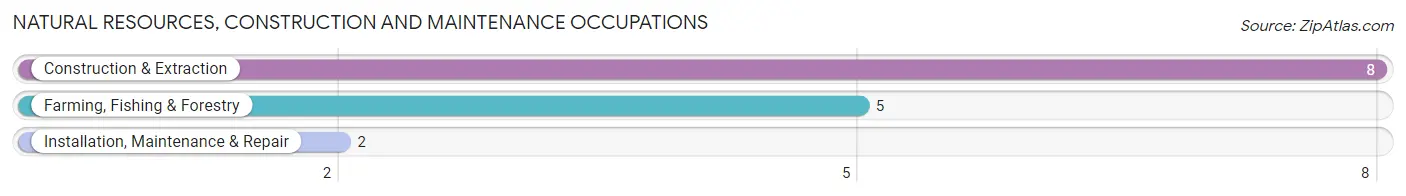
Natural Resources, Construction and Maintenance Occupations
The most common Natural Resources, Construction and Maintenance occupations in Limestone are Construction & Extraction (8 | 4.3%), Farming, Fishing & Forestry (5 | 2.7%), and Installation, Maintenance & Repair (2 | 1.1%).
Natural Resources, Construction and Maintenance Occupations by Sex
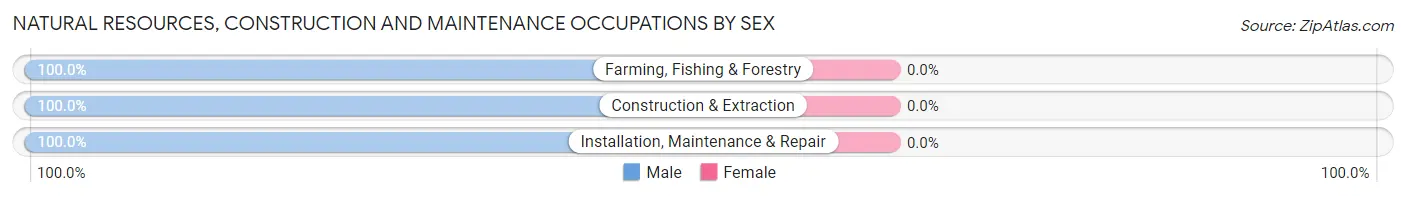
| Occupation | Male | Female |
| Farming, Fishing & Forestry | 5 (100.0%) | 0 (0.0%) |
| Construction & Extraction | 8 (100.0%) | 0 (0.0%) |
| Installation, Maintenance & Repair | 2 (100.0%) | 0 (0.0%) |
| Total (Category) | 15 (100.0%) | 0 (0.0%) |
| Total (Overall) | 94 (50.5%) | 92 (49.5%) |
Production, Transportation and Moving Occupations
The most common Production, Transportation and Moving occupations in Limestone are Production (27 | 14.5%), and Material Moving (12 | 6.5%).
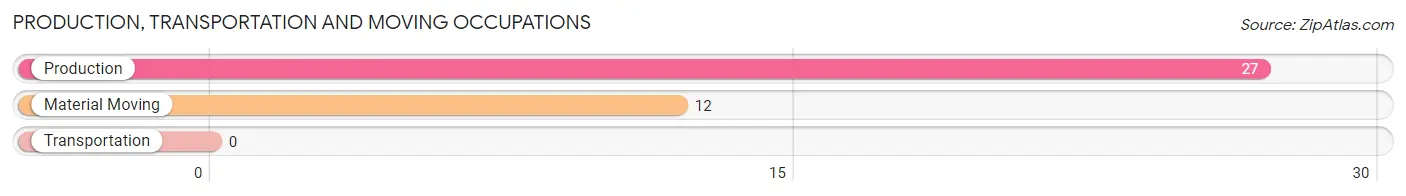
Production, Transportation and Moving Occupations by Sex
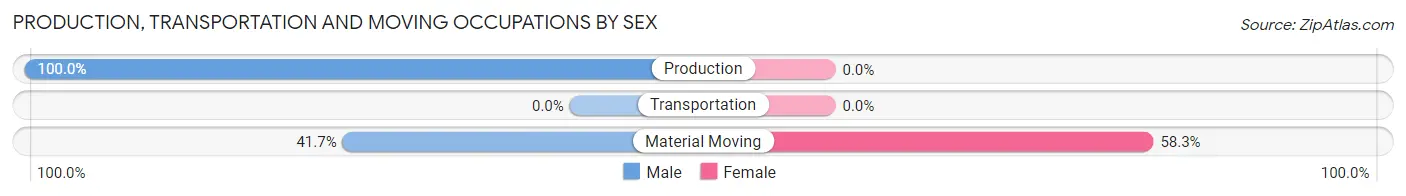
| Occupation | Male | Female |
| Production | 27 (100.0%) | 0 (0.0%) |
| Transportation | 0 (0.0%) | 0 (0.0%) |
| Material Moving | 5 (41.7%) | 7 (58.3%) |
| Total (Category) | 32 (82.1%) | 7 (17.9%) |
| Total (Overall) | 94 (50.5%) | 92 (49.5%) |
Employment Industries by Sex in Limestone
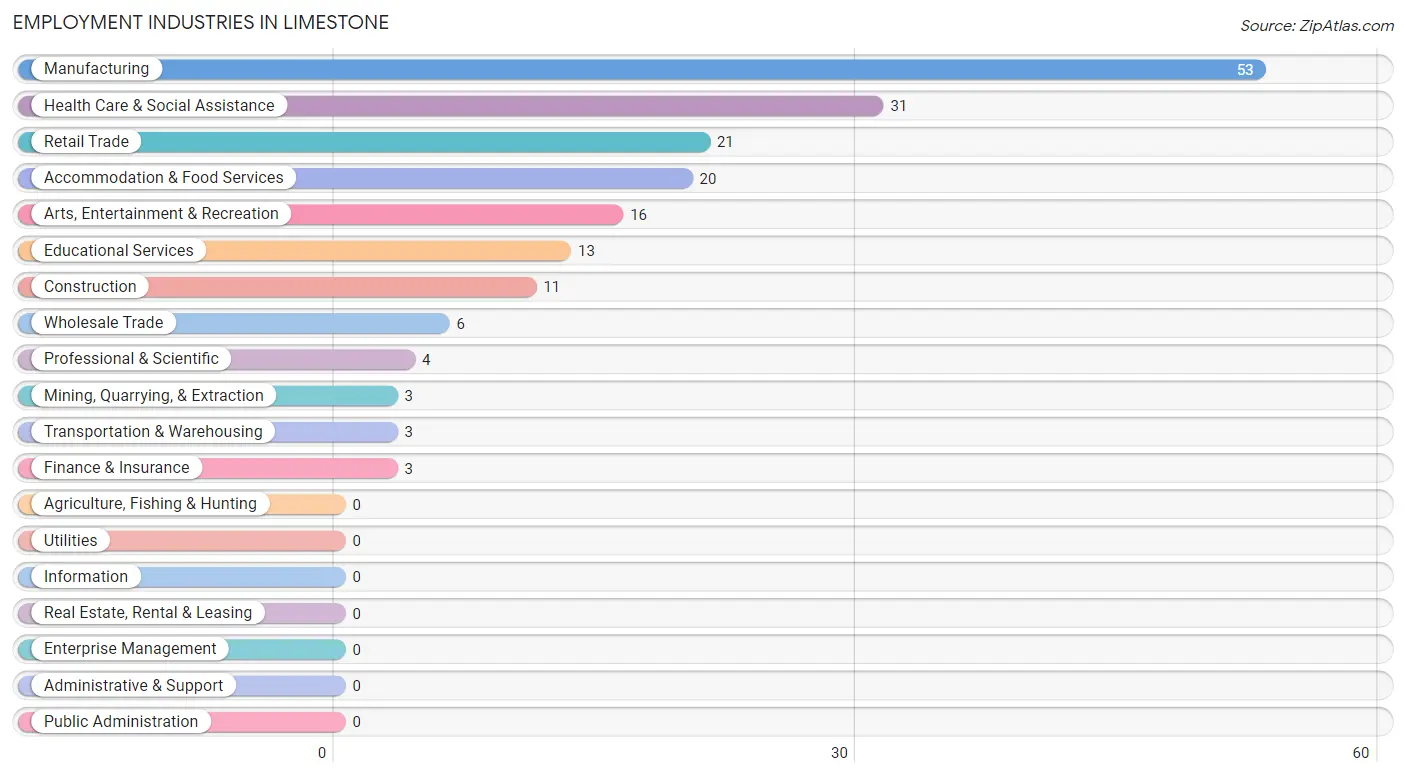
Employment Industries in Limestone
The major employment industries in Limestone include Manufacturing (53 | 28.5%), Health Care & Social Assistance (31 | 16.7%), Retail Trade (21 | 11.3%), Accommodation & Food Services (20 | 10.7%), and Arts, Entertainment & Recreation (16 | 8.6%).
Employment Industries by Sex in Limestone
The Limestone industries that see more men than women are Mining, Quarrying, & Extraction (100.0%), Construction (100.0%), and Transportation & Warehousing (100.0%), whereas the industries that tend to have a higher number of women are Wholesale Trade (100.0%), Finance & Insurance (100.0%), and Health Care & Social Assistance (100.0%).
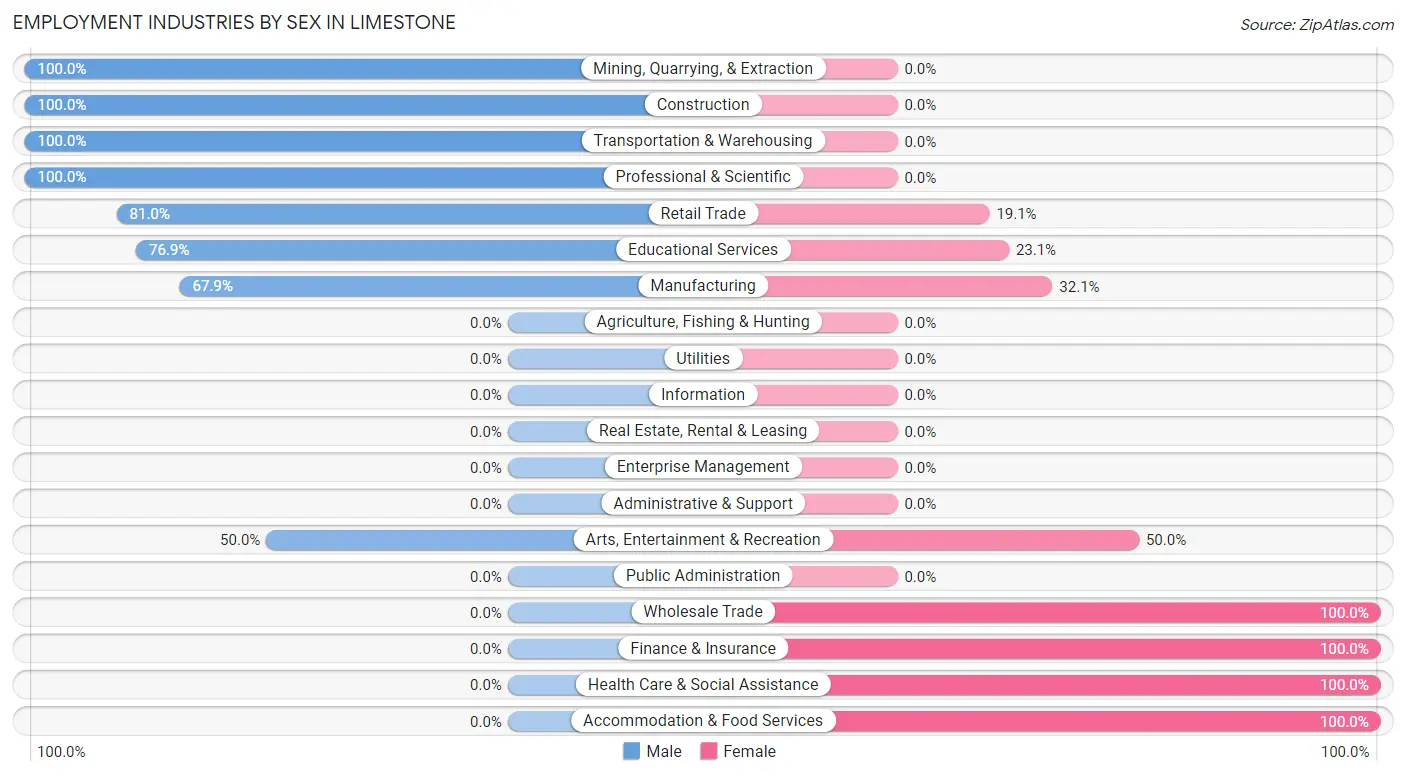
| Industry | Male | Female |
| Agriculture, Fishing & Hunting | 0 (0.0%) | 0 (0.0%) |
| Mining, Quarrying, & Extraction | 3 (100.0%) | 0 (0.0%) |
| Construction | 11 (100.0%) | 0 (0.0%) |
| Manufacturing | 36 (67.9%) | 17 (32.1%) |
| Wholesale Trade | 0 (0.0%) | 6 (100.0%) |
| Retail Trade | 17 (80.9%) | 4 (19.1%) |
| Transportation & Warehousing | 3 (100.0%) | 0 (0.0%) |
| Utilities | 0 (0.0%) | 0 (0.0%) |
| Information | 0 (0.0%) | 0 (0.0%) |
| Finance & Insurance | 0 (0.0%) | 3 (100.0%) |
| Real Estate, Rental & Leasing | 0 (0.0%) | 0 (0.0%) |
| Professional & Scientific | 4 (100.0%) | 0 (0.0%) |
| Enterprise Management | 0 (0.0%) | 0 (0.0%) |
| Administrative & Support | 0 (0.0%) | 0 (0.0%) |
| Educational Services | 10 (76.9%) | 3 (23.1%) |
| Health Care & Social Assistance | 0 (0.0%) | 31 (100.0%) |
| Arts, Entertainment & Recreation | 8 (50.0%) | 8 (50.0%) |
| Accommodation & Food Services | 0 (0.0%) | 20 (100.0%) |
| Public Administration | 0 (0.0%) | 0 (0.0%) |
| Total | 94 (50.5%) | 92 (49.5%) |
Education in Limestone
School Enrollment in Limestone
The most common levels of schooling among the 108 students in Limestone are high school (27 | 25.0%), elementary school (23 | 21.3%), and nursery / preschool (18 | 16.7%).
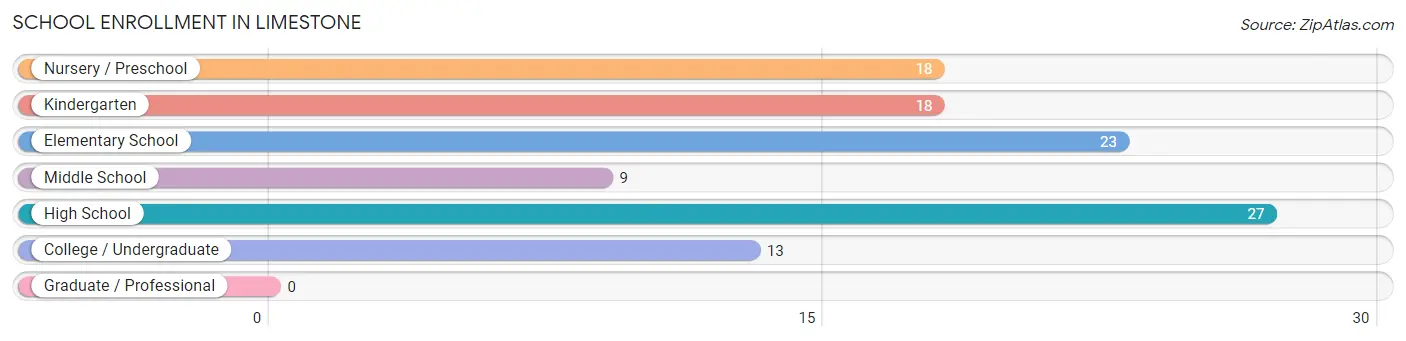
| School Level | # Students | % Students |
| Nursery / Preschool | 18 | 16.7% |
| Kindergarten | 18 | 16.7% |
| Elementary School | 23 | 21.3% |
| Middle School | 9 | 8.3% |
| High School | 27 | 25.0% |
| College / Undergraduate | 13 | 12.0% |
| Graduate / Professional | 0 | 0.0% |
| Total | 108 | 100.0% |
School Enrollment by Age by Funding Source in Limestone
Out of a total of 108 students who are enrolled in schools in Limestone, 14 (13.0%) attend a private institution, while the remaining 94 (87.0%) are enrolled in public schools. The age group of 20 to 24 year olds has the highest likelihood of being enrolled in private schools, with 9 (100.0% in the age bracket) enrolled. Conversely, the age group of 5 to 9 year old has the lowest likelihood of being enrolled in a private school, with 32 (100.0% in the age bracket) attending a public institution.
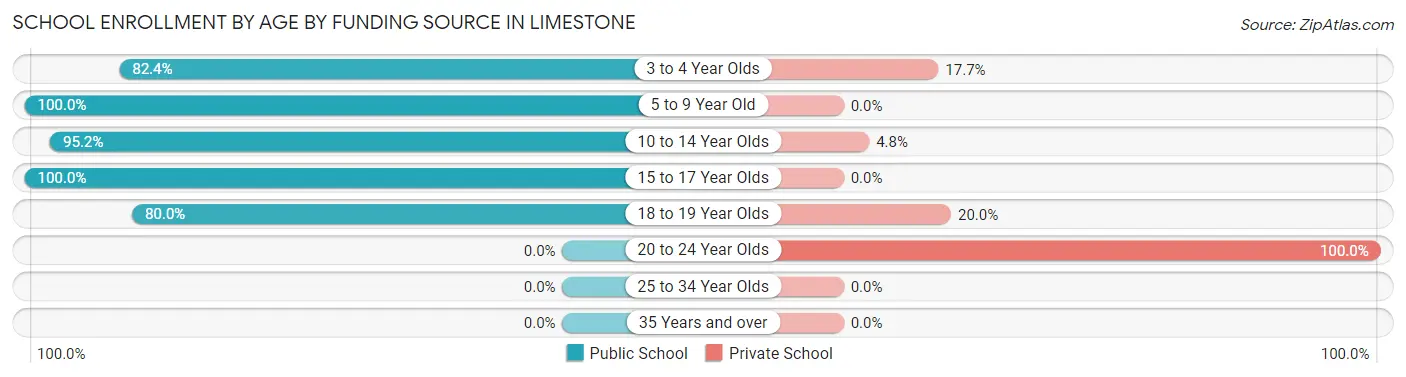
| Age Bracket | Public School | Private School |
| 3 to 4 Year Olds | 14 (82.4%) | 3 (17.6%) |
| 5 to 9 Year Old | 32 (100.0%) | 0 (0.0%) |
| 10 to 14 Year Olds | 20 (95.2%) | 1 (4.8%) |
| 15 to 17 Year Olds | 24 (100.0%) | 0 (0.0%) |
| 18 to 19 Year Olds | 4 (80.0%) | 1 (20.0%) |
| 20 to 24 Year Olds | 0 (0.0%) | 9 (100.0%) |
| 25 to 34 Year Olds | 0 (0.0%) | 0 (0.0%) |
| 35 Years and over | 0 (0.0%) | 0 (0.0%) |
| Total | 94 (87.0%) | 14 (13.0%) |
Educational Attainment by Field of Study in Limestone
Business (20 | 37.7%), education (12 | 22.6%), computers & mathematics (5 | 9.4%), bio, nature & agricultural (4 | 7.5%), and psychology (4 | 7.5%) are the most common fields of study among 53 individuals in Limestone who have obtained a bachelor's degree or higher.
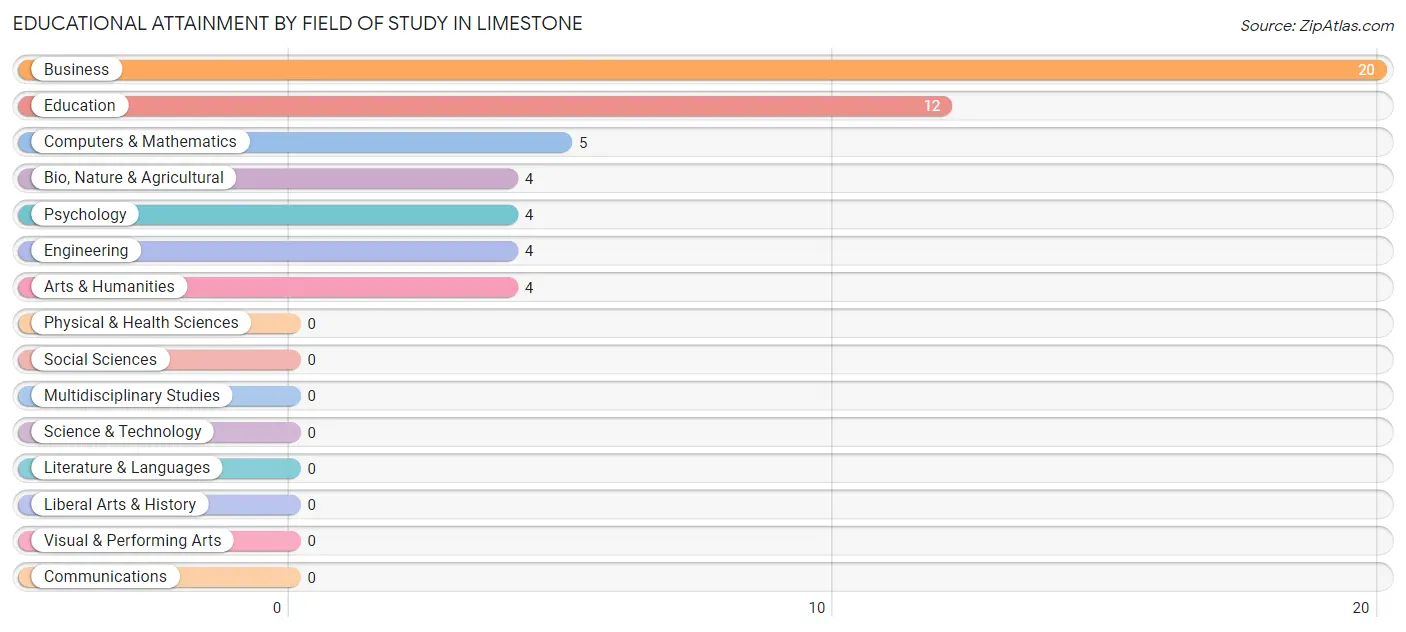
| Field of Study | # Graduates | % Graduates |
| Computers & Mathematics | 5 | 9.4% |
| Bio, Nature & Agricultural | 4 | 7.5% |
| Physical & Health Sciences | 0 | 0.0% |
| Psychology | 4 | 7.5% |
| Social Sciences | 0 | 0.0% |
| Engineering | 4 | 7.5% |
| Multidisciplinary Studies | 0 | 0.0% |
| Science & Technology | 0 | 0.0% |
| Business | 20 | 37.7% |
| Education | 12 | 22.6% |
| Literature & Languages | 0 | 0.0% |
| Liberal Arts & History | 0 | 0.0% |
| Visual & Performing Arts | 0 | 0.0% |
| Communications | 0 | 0.0% |
| Arts & Humanities | 4 | 7.5% |
| Total | 53 | 100.0% |
Transportation & Commute in Limestone
Vehicle Availability by Sex in Limestone
The most prevalent vehicle ownership categories in Limestone are males with 2 vehicles (38, accounting for 40.4%) and females with 2 vehicles (46, making up 41.3%).
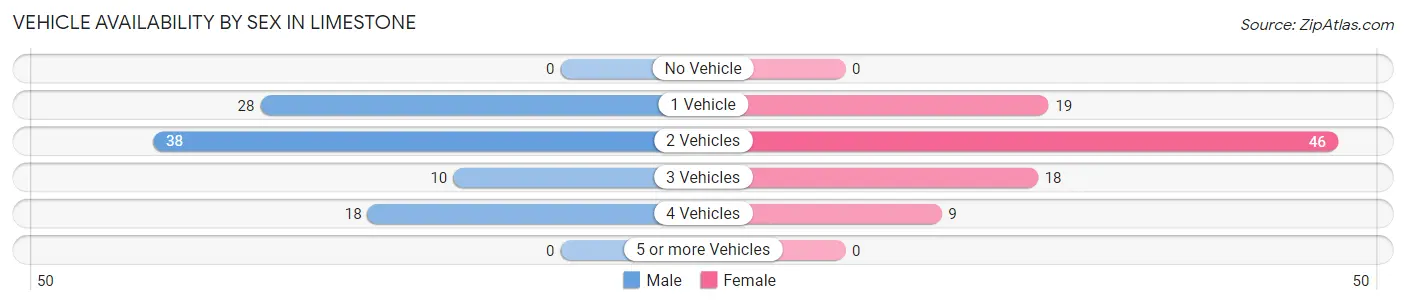
| Vehicles Available | Male | Female |
| No Vehicle | 0 (0.0%) | 0 (0.0%) |
| 1 Vehicle | 28 (29.8%) | 19 (20.6%) |
| 2 Vehicles | 38 (40.4%) | 46 (50.0%) |
| 3 Vehicles | 10 (10.6%) | 18 (19.6%) |
| 4 Vehicles | 18 (19.2%) | 9 (9.8%) |
| 5 or more Vehicles | 0 (0.0%) | 0 (0.0%) |
| Total | 94 (100.0%) | 92 (100.0%) |
Commute Time in Limestone
The most frequently occuring commute durations in Limestone are 10 to 14 minutes (60 commuters, 32.3%), 20 to 24 minutes (60 commuters, 32.3%), and 30 to 34 minutes (28 commuters, 15.0%).
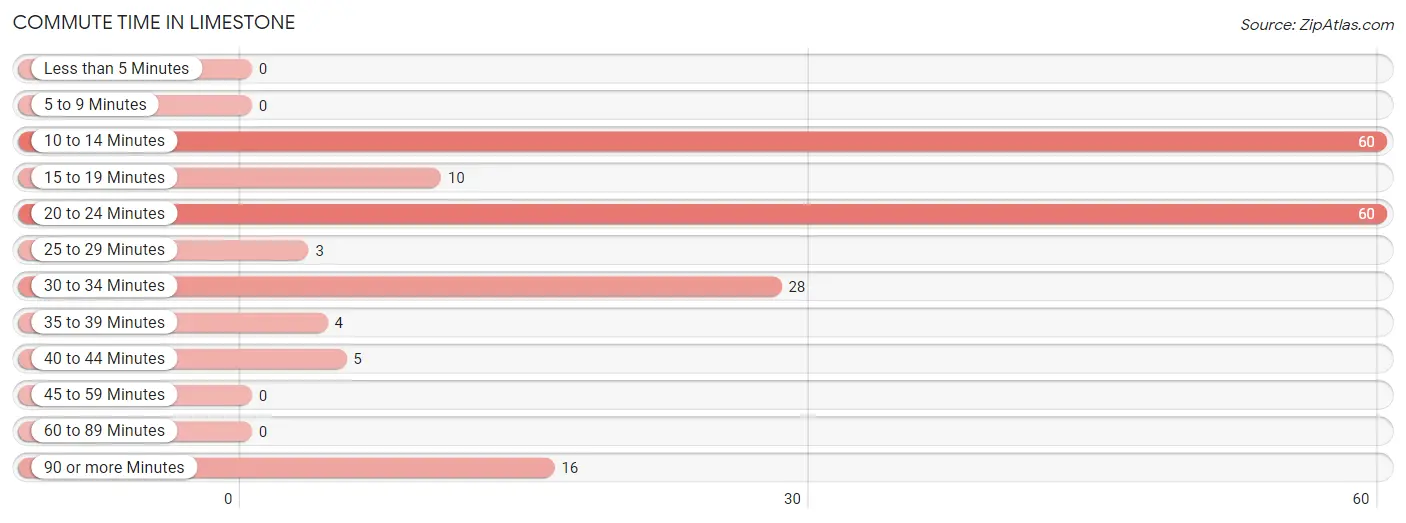
| Commute Time | # Commuters | % Commuters |
| Less than 5 Minutes | 0 | 0.0% |
| 5 to 9 Minutes | 0 | 0.0% |
| 10 to 14 Minutes | 60 | 32.3% |
| 15 to 19 Minutes | 10 | 5.4% |
| 20 to 24 Minutes | 60 | 32.3% |
| 25 to 29 Minutes | 3 | 1.6% |
| 30 to 34 Minutes | 28 | 15.0% |
| 35 to 39 Minutes | 4 | 2.1% |
| 40 to 44 Minutes | 5 | 2.7% |
| 45 to 59 Minutes | 0 | 0.0% |
| 60 to 89 Minutes | 0 | 0.0% |
| 90 or more Minutes | 16 | 8.6% |
Commute Time by Sex in Limestone
The most common commute times in Limestone are 20 to 24 minutes (30 commuters, 31.9%) for males and 10 to 14 minutes (49 commuters, 53.3%) for females.
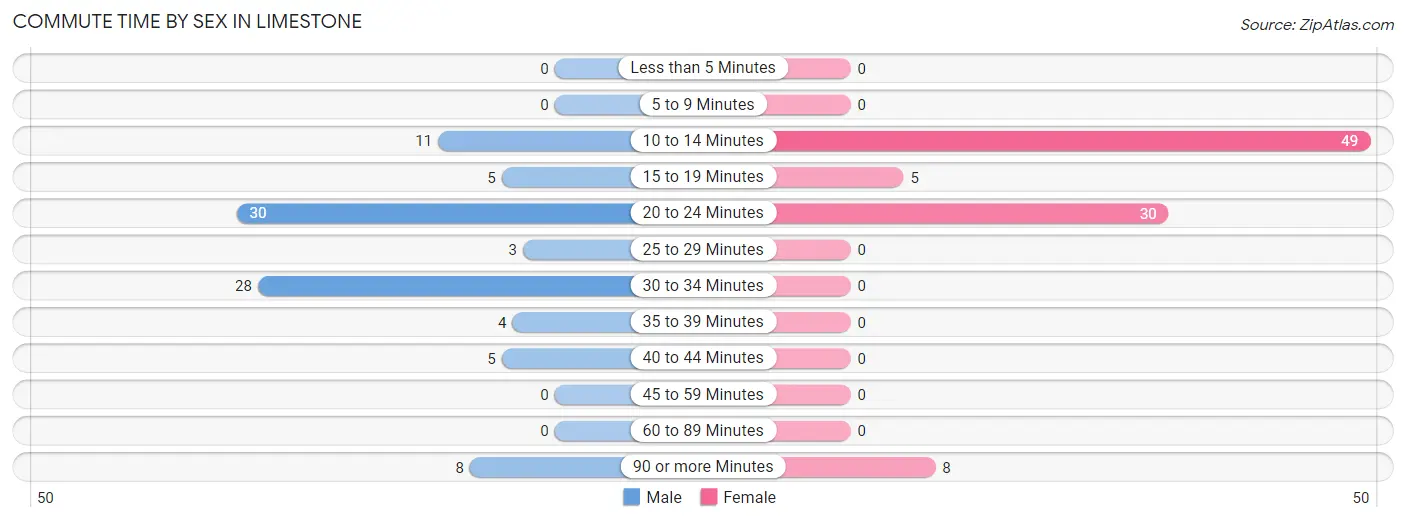
| Commute Time | Male | Female |
| Less than 5 Minutes | 0 (0.0%) | 0 (0.0%) |
| 5 to 9 Minutes | 0 (0.0%) | 0 (0.0%) |
| 10 to 14 Minutes | 11 (11.7%) | 49 (53.3%) |
| 15 to 19 Minutes | 5 (5.3%) | 5 (5.4%) |
| 20 to 24 Minutes | 30 (31.9%) | 30 (32.6%) |
| 25 to 29 Minutes | 3 (3.2%) | 0 (0.0%) |
| 30 to 34 Minutes | 28 (29.8%) | 0 (0.0%) |
| 35 to 39 Minutes | 4 (4.3%) | 0 (0.0%) |
| 40 to 44 Minutes | 5 (5.3%) | 0 (0.0%) |
| 45 to 59 Minutes | 0 (0.0%) | 0 (0.0%) |
| 60 to 89 Minutes | 0 (0.0%) | 0 (0.0%) |
| 90 or more Minutes | 8 (8.5%) | 8 (8.7%) |
Time of Departure to Work by Sex in Limestone
The most frequent times of departure to work in Limestone are 6:30 AM to 6:59 AM (17, 18.1%) for males and 7:30 AM to 7:59 AM (25, 27.2%) for females.
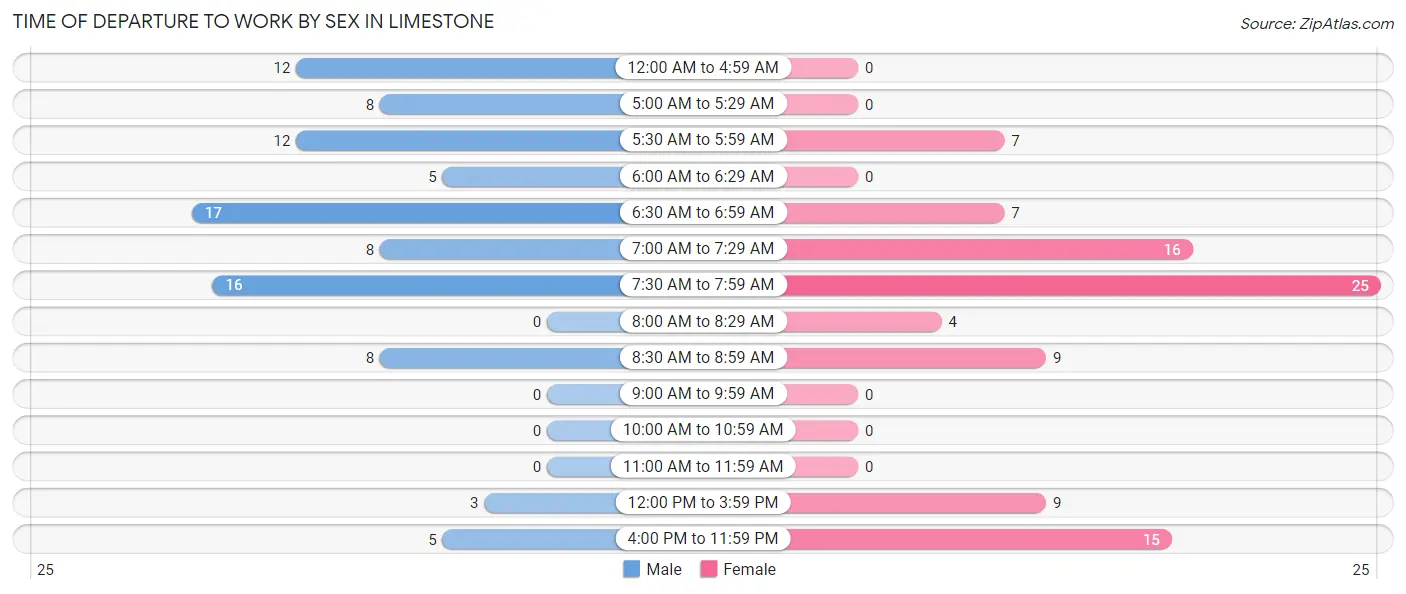
| Time of Departure | Male | Female |
| 12:00 AM to 4:59 AM | 12 (12.8%) | 0 (0.0%) |
| 5:00 AM to 5:29 AM | 8 (8.5%) | 0 (0.0%) |
| 5:30 AM to 5:59 AM | 12 (12.8%) | 7 (7.6%) |
| 6:00 AM to 6:29 AM | 5 (5.3%) | 0 (0.0%) |
| 6:30 AM to 6:59 AM | 17 (18.1%) | 7 (7.6%) |
| 7:00 AM to 7:29 AM | 8 (8.5%) | 16 (17.4%) |
| 7:30 AM to 7:59 AM | 16 (17.0%) | 25 (27.2%) |
| 8:00 AM to 8:29 AM | 0 (0.0%) | 4 (4.3%) |
| 8:30 AM to 8:59 AM | 8 (8.5%) | 9 (9.8%) |
| 9:00 AM to 9:59 AM | 0 (0.0%) | 0 (0.0%) |
| 10:00 AM to 10:59 AM | 0 (0.0%) | 0 (0.0%) |
| 11:00 AM to 11:59 AM | 0 (0.0%) | 0 (0.0%) |
| 12:00 PM to 3:59 PM | 3 (3.2%) | 9 (9.8%) |
| 4:00 PM to 11:59 PM | 5 (5.3%) | 15 (16.3%) |
| Total | 94 (100.0%) | 92 (100.0%) |
Housing Occupancy in Limestone
Occupancy by Ownership in Limestone
Of the total 176 dwellings in Limestone, owner-occupied units account for 141 (80.1%), while renter-occupied units make up 35 (19.9%).
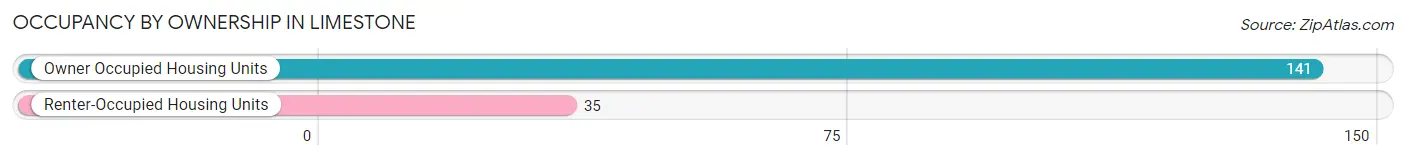
| Occupancy | # Housing Units | % Housing Units |
| Owner Occupied Housing Units | 141 | 80.1% |
| Renter-Occupied Housing Units | 35 | 19.9% |
| Total Occupied Housing Units | 176 | 100.0% |
Occupancy by Household Size in Limestone
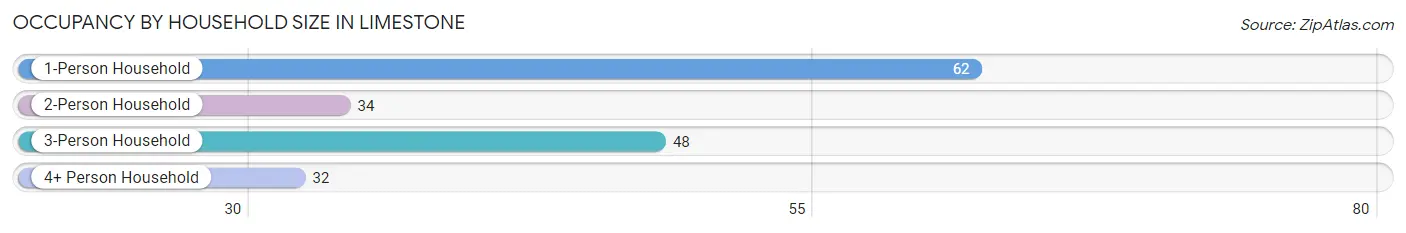
| Household Size | # Housing Units | % Housing Units |
| 1-Person Household | 62 | 35.2% |
| 2-Person Household | 34 | 19.3% |
| 3-Person Household | 48 | 27.3% |
| 4+ Person Household | 32 | 18.2% |
| Total Housing Units | 176 | 100.0% |
Occupancy by Ownership by Household Size in Limestone
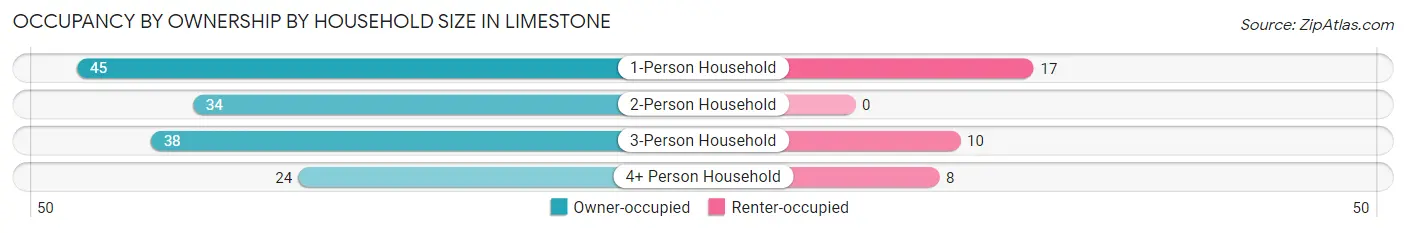
| Household Size | Owner-occupied | Renter-occupied |
| 1-Person Household | 45 (72.6%) | 17 (27.4%) |
| 2-Person Household | 34 (100.0%) | 0 (0.0%) |
| 3-Person Household | 38 (79.2%) | 10 (20.8%) |
| 4+ Person Household | 24 (75.0%) | 8 (25.0%) |
| Total Housing Units | 141 (80.1%) | 35 (19.9%) |
Occupancy by Educational Attainment in Limestone
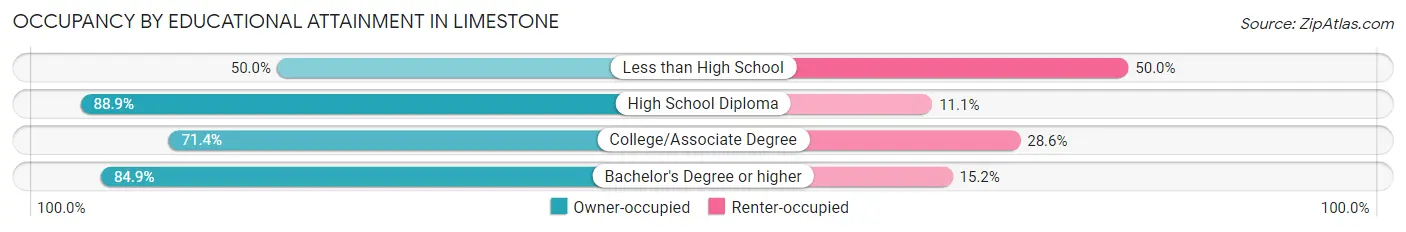
| Household Size | Owner-occupied | Renter-occupied |
| Less than High School | 4 (50.0%) | 4 (50.0%) |
| High School Diploma | 64 (88.9%) | 8 (11.1%) |
| College/Associate Degree | 45 (71.4%) | 18 (28.6%) |
| Bachelor's Degree or higher | 28 (84.9%) | 5 (15.1%) |
Occupancy by Age of Householder in Limestone
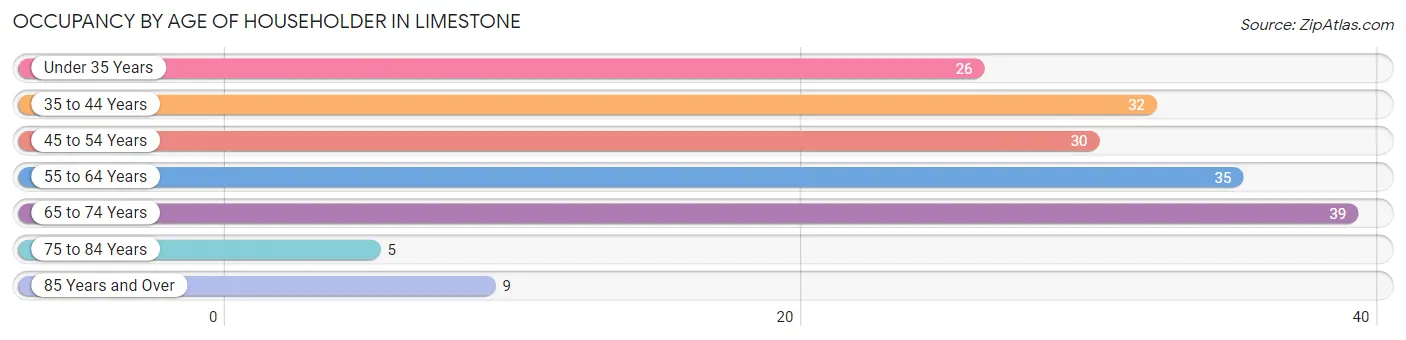
| Age Bracket | # Households | % Households |
| Under 35 Years | 26 | 14.8% |
| 35 to 44 Years | 32 | 18.2% |
| 45 to 54 Years | 30 | 17.1% |
| 55 to 64 Years | 35 | 19.9% |
| 65 to 74 Years | 39 | 22.2% |
| 75 to 84 Years | 5 | 2.8% |
| 85 Years and Over | 9 | 5.1% |
| Total | 176 | 100.0% |
Housing Finances in Limestone
Median Income by Occupancy in Limestone
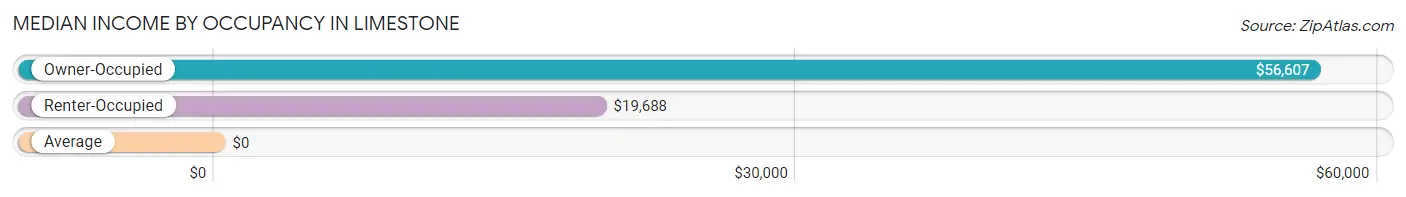
| Occupancy Type | # Households | Median Income |
| Owner-Occupied | 141 (80.1%) | $56,607 |
| Renter-Occupied | 35 (19.9%) | $19,688 |
| Average | 176 (100.0%) | $0 |
Occupancy by Householder Income Bracket in Limestone
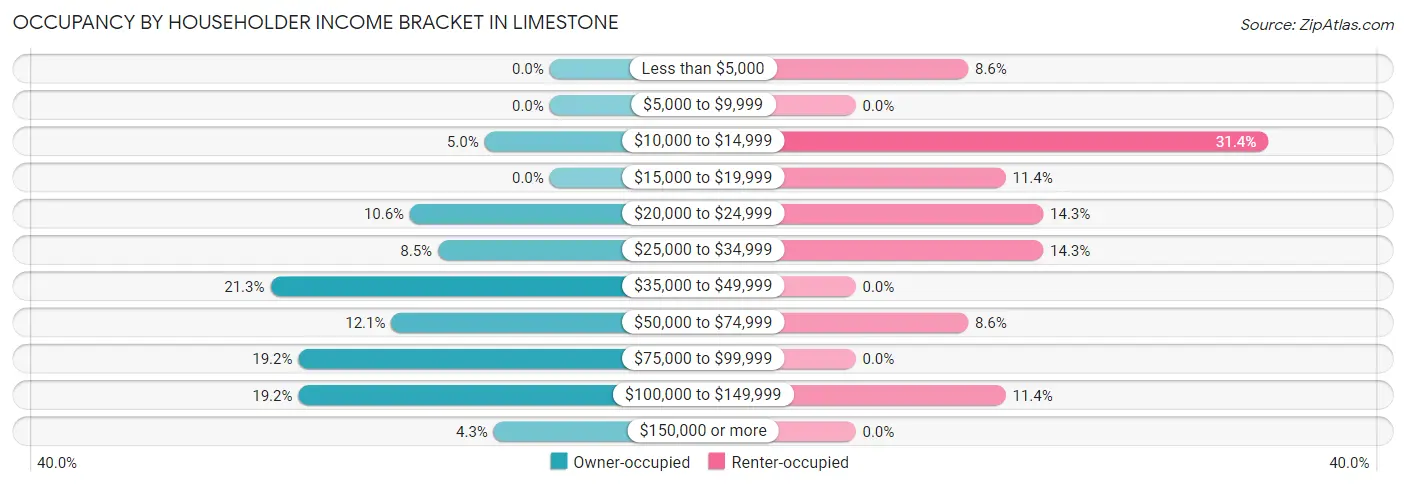
| Income Bracket | Owner-occupied | Renter-occupied |
| Less than $5,000 | 0 (0.0%) | 3 (8.6%) |
| $5,000 to $9,999 | 0 (0.0%) | 0 (0.0%) |
| $10,000 to $14,999 | 7 (5.0%) | 11 (31.4%) |
| $15,000 to $19,999 | 0 (0.0%) | 4 (11.4%) |
| $20,000 to $24,999 | 15 (10.6%) | 5 (14.3%) |
| $25,000 to $34,999 | 12 (8.5%) | 5 (14.3%) |
| $35,000 to $49,999 | 30 (21.3%) | 0 (0.0%) |
| $50,000 to $74,999 | 17 (12.1%) | 3 (8.6%) |
| $75,000 to $99,999 | 27 (19.2%) | 0 (0.0%) |
| $100,000 to $149,999 | 27 (19.2%) | 4 (11.4%) |
| $150,000 or more | 6 (4.3%) | 0 (0.0%) |
| Total | 141 (100.0%) | 35 (100.0%) |
Monthly Housing Cost Tiers in Limestone
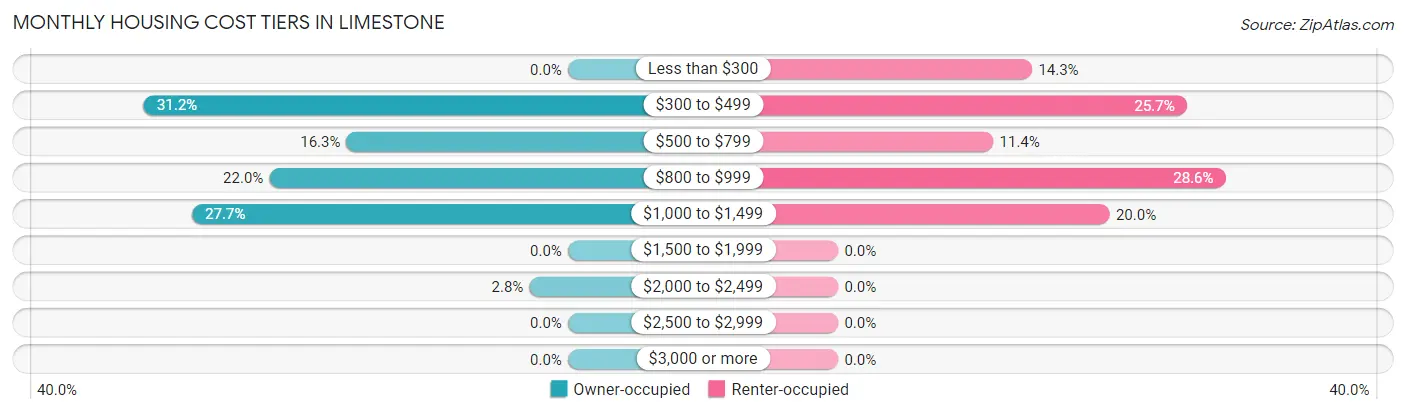
| Monthly Cost | Owner-occupied | Renter-occupied |
| Less than $300 | 0 (0.0%) | 5 (14.3%) |
| $300 to $499 | 44 (31.2%) | 9 (25.7%) |
| $500 to $799 | 23 (16.3%) | 4 (11.4%) |
| $800 to $999 | 31 (22.0%) | 10 (28.6%) |
| $1,000 to $1,499 | 39 (27.7%) | 7 (20.0%) |
| $1,500 to $1,999 | 0 (0.0%) | 0 (0.0%) |
| $2,000 to $2,499 | 4 (2.8%) | 0 (0.0%) |
| $2,500 to $2,999 | 0 (0.0%) | 0 (0.0%) |
| $3,000 or more | 0 (0.0%) | 0 (0.0%) |
| Total | 141 (100.0%) | 35 (100.0%) |
Physical Housing Characteristics in Limestone
Housing Structures in Limestone
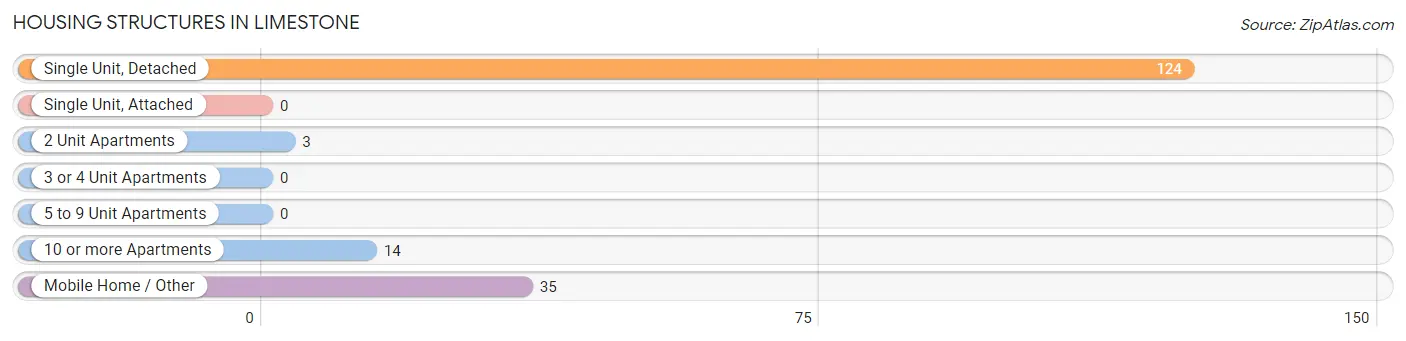
| Structure Type | # Housing Units | % Housing Units |
| Single Unit, Detached | 124 | 70.5% |
| Single Unit, Attached | 0 | 0.0% |
| 2 Unit Apartments | 3 | 1.7% |
| 3 or 4 Unit Apartments | 0 | 0.0% |
| 5 to 9 Unit Apartments | 0 | 0.0% |
| 10 or more Apartments | 14 | 8.0% |
| Mobile Home / Other | 35 | 19.9% |
| Total | 176 | 100.0% |
Housing Structures by Occupancy in Limestone
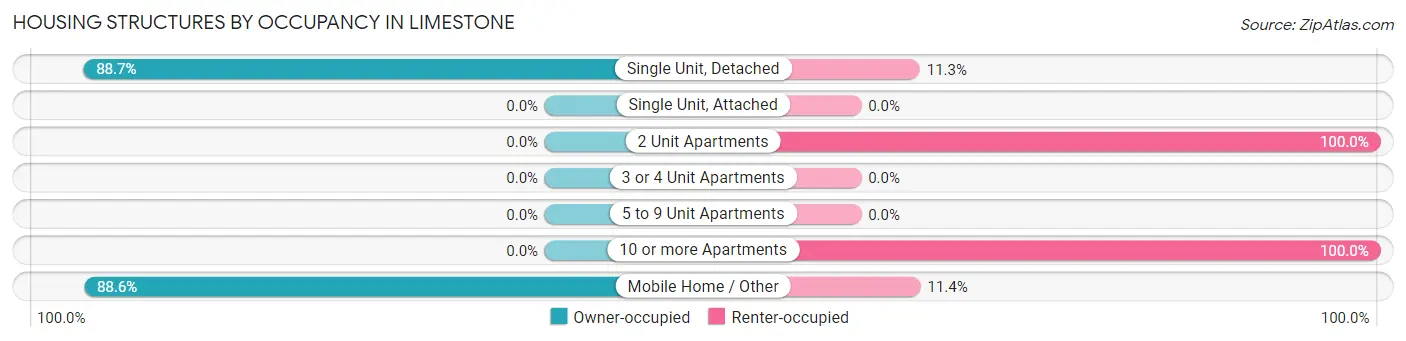
| Structure Type | Owner-occupied | Renter-occupied |
| Single Unit, Detached | 110 (88.7%) | 14 (11.3%) |
| Single Unit, Attached | 0 (0.0%) | 0 (0.0%) |
| 2 Unit Apartments | 0 (0.0%) | 3 (100.0%) |
| 3 or 4 Unit Apartments | 0 (0.0%) | 0 (0.0%) |
| 5 to 9 Unit Apartments | 0 (0.0%) | 0 (0.0%) |
| 10 or more Apartments | 0 (0.0%) | 14 (100.0%) |
| Mobile Home / Other | 31 (88.6%) | 4 (11.4%) |
| Total | 141 (80.1%) | 35 (19.9%) |
Housing Structures by Number of Rooms in Limestone
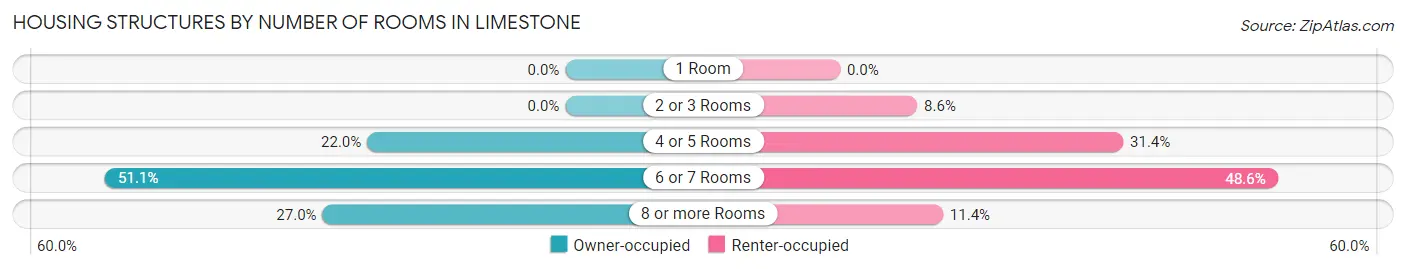
| Number of Rooms | Owner-occupied | Renter-occupied |
| 1 Room | 0 (0.0%) | 0 (0.0%) |
| 2 or 3 Rooms | 0 (0.0%) | 3 (8.6%) |
| 4 or 5 Rooms | 31 (22.0%) | 11 (31.4%) |
| 6 or 7 Rooms | 72 (51.1%) | 17 (48.6%) |
| 8 or more Rooms | 38 (27.0%) | 4 (11.4%) |
| Total | 141 (100.0%) | 35 (100.0%) |
Housing Structure by Heating Type in Limestone
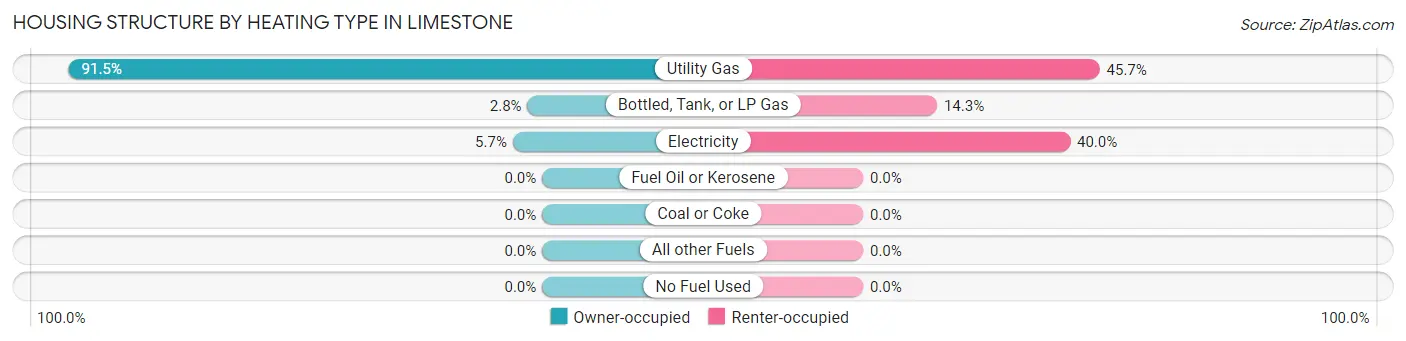
| Heating Type | Owner-occupied | Renter-occupied |
| Utility Gas | 129 (91.5%) | 16 (45.7%) |
| Bottled, Tank, or LP Gas | 4 (2.8%) | 5 (14.3%) |
| Electricity | 8 (5.7%) | 14 (40.0%) |
| Fuel Oil or Kerosene | 0 (0.0%) | 0 (0.0%) |
| Coal or Coke | 0 (0.0%) | 0 (0.0%) |
| All other Fuels | 0 (0.0%) | 0 (0.0%) |
| No Fuel Used | 0 (0.0%) | 0 (0.0%) |
| Total | 141 (100.0%) | 35 (100.0%) |
Household Vehicle Usage in Limestone
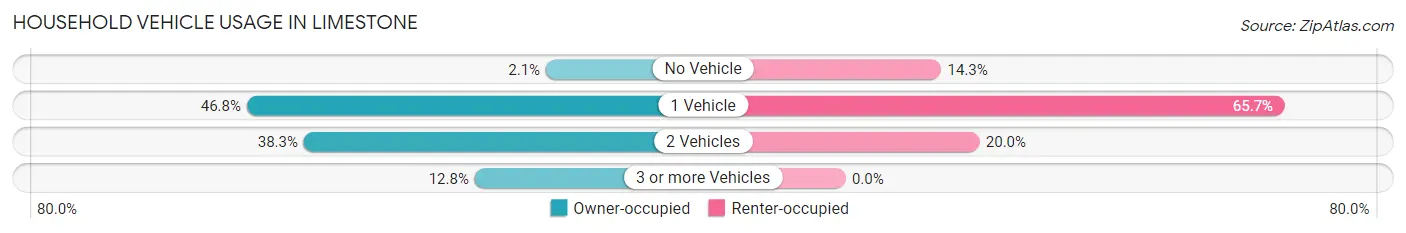
| Vehicles per Household | Owner-occupied | Renter-occupied |
| No Vehicle | 3 (2.1%) | 5 (14.3%) |
| 1 Vehicle | 66 (46.8%) | 23 (65.7%) |
| 2 Vehicles | 54 (38.3%) | 7 (20.0%) |
| 3 or more Vehicles | 18 (12.8%) | 0 (0.0%) |
| Total | 141 (100.0%) | 35 (100.0%) |
Real Estate & Mortgages in Limestone
Real Estate and Mortgage Overview in Limestone
| Characteristic | Without Mortgage | With Mortgage |
| Housing Units | 39 | 102 |
| Median Property Value | $95,000 | $60,000 |
| Median Household Income | $44,583 | $0 |
| Monthly Housing Costs | $433 | $0 |
| Real Estate Taxes | $1,458 | $4 |
Property Value by Mortgage Status in Limestone
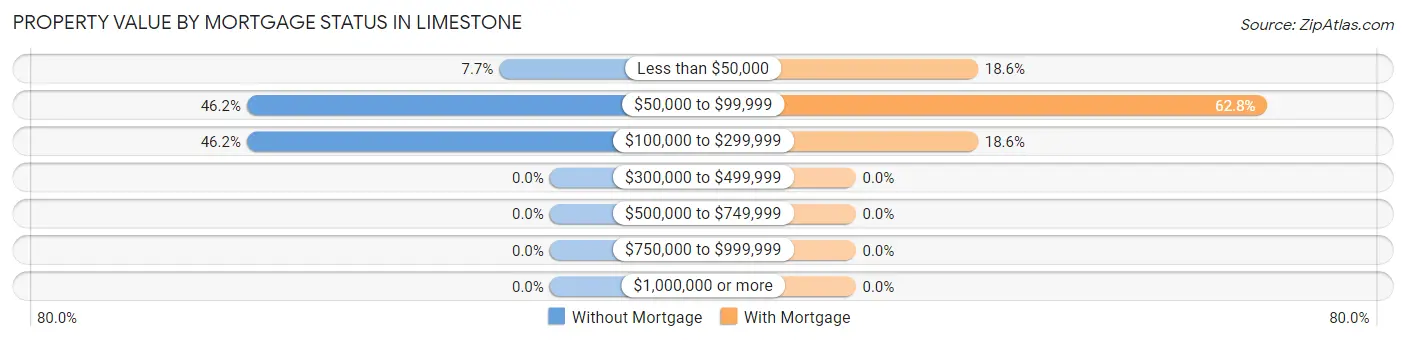
| Property Value | Without Mortgage | With Mortgage |
| Less than $50,000 | 3 (7.7%) | 19 (18.6%) |
| $50,000 to $99,999 | 18 (46.2%) | 64 (62.7%) |
| $100,000 to $299,999 | 18 (46.2%) | 19 (18.6%) |
| $300,000 to $499,999 | 0 (0.0%) | 0 (0.0%) |
| $500,000 to $749,999 | 0 (0.0%) | 0 (0.0%) |
| $750,000 to $999,999 | 0 (0.0%) | 0 (0.0%) |
| $1,000,000 or more | 0 (0.0%) | 0 (0.0%) |
| Total | 39 (100.0%) | 102 (100.0%) |
Household Income by Mortgage Status in Limestone
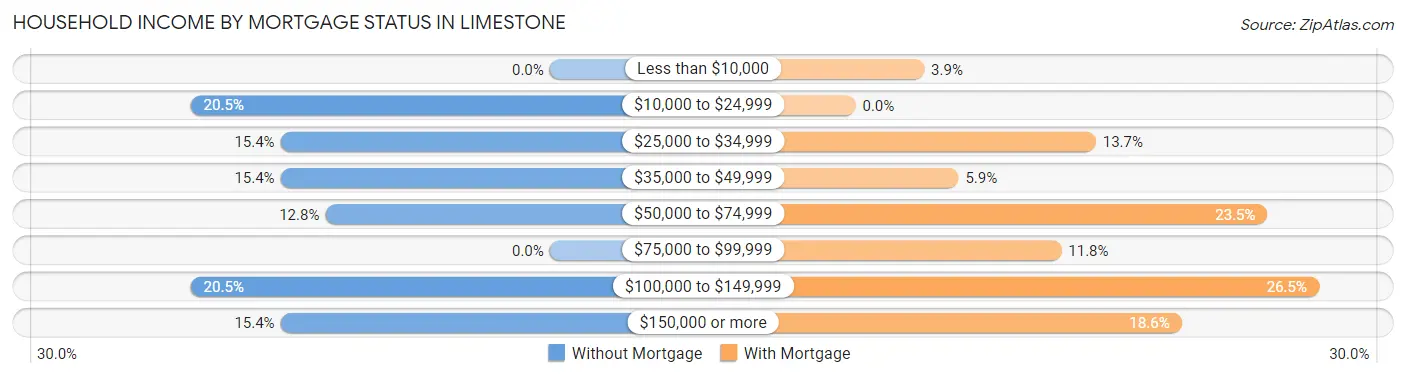
| Household Income | Without Mortgage | With Mortgage |
| Less than $10,000 | 0 (0.0%) | 4 (3.9%) |
| $10,000 to $24,999 | 8 (20.5%) | 0 (0.0%) |
| $25,000 to $34,999 | 6 (15.4%) | 14 (13.7%) |
| $35,000 to $49,999 | 6 (15.4%) | 6 (5.9%) |
| $50,000 to $74,999 | 5 (12.8%) | 24 (23.5%) |
| $75,000 to $99,999 | 0 (0.0%) | 12 (11.8%) |
| $100,000 to $149,999 | 8 (20.5%) | 27 (26.5%) |
| $150,000 or more | 6 (15.4%) | 19 (18.6%) |
| Total | 39 (100.0%) | 102 (100.0%) |
Property Value to Household Income Ratio in Limestone
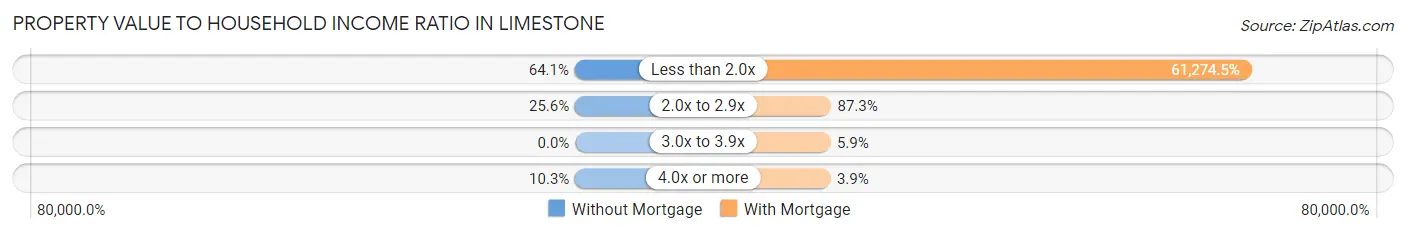
| Value-to-Income Ratio | Without Mortgage | With Mortgage |
| Less than 2.0x | 25 (64.1%) | 62,500 (61,274.5%) |
| 2.0x to 2.9x | 10 (25.6%) | 89 (87.3%) |
| 3.0x to 3.9x | 0 (0.0%) | 6 (5.9%) |
| 4.0x or more | 4 (10.3%) | 4 (3.9%) |
| Total | 39 (100.0%) | 102 (100.0%) |
Real Estate Taxes by Mortgage Status in Limestone
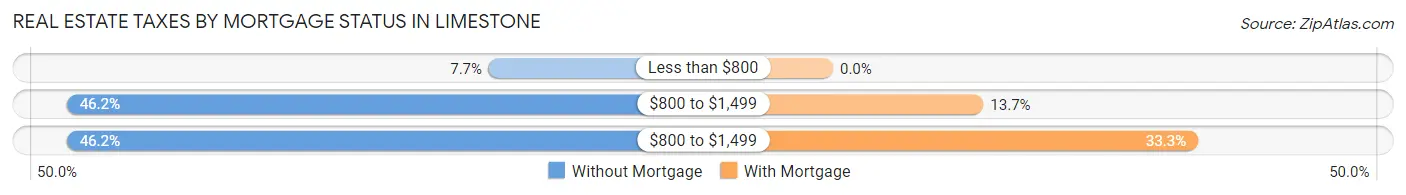
| Property Taxes | Without Mortgage | With Mortgage |
| Less than $800 | 3 (7.7%) | 0 (0.0%) |
| $800 to $1,499 | 18 (46.2%) | 14 (13.7%) |
| $800 to $1,499 | 18 (46.2%) | 34 (33.3%) |
| Total | 39 (100.0%) | 102 (100.0%) |
Health & Disability in Limestone
Health Insurance Coverage by Age in Limestone
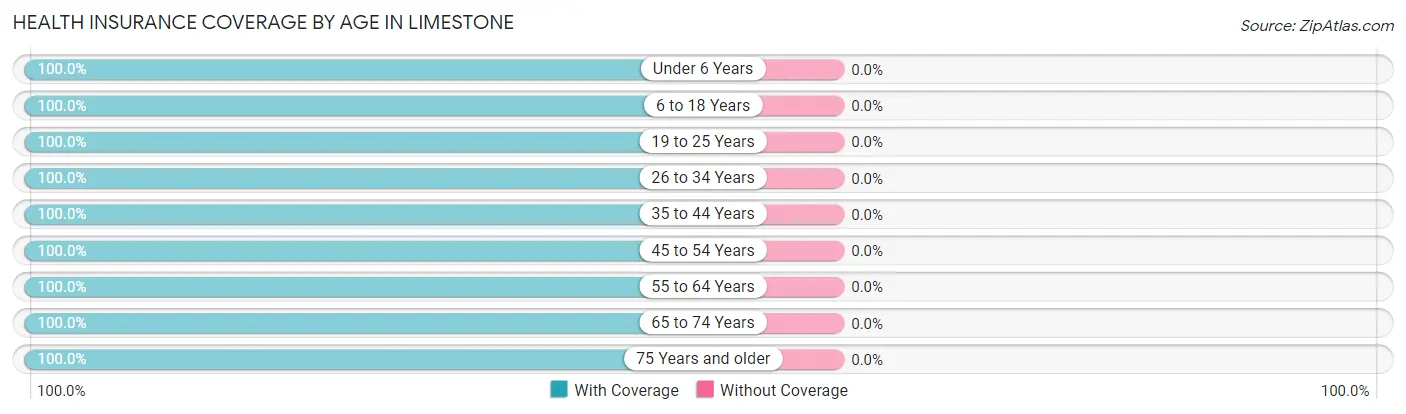
| Age Bracket | With Coverage | Without Coverage |
| Under 6 Years | 32 (100.0%) | 0 (0.0%) |
| 6 to 18 Years | 63 (100.0%) | 0 (0.0%) |
| 19 to 25 Years | 13 (100.0%) | 0 (0.0%) |
| 26 to 34 Years | 67 (100.0%) | 0 (0.0%) |
| 35 to 44 Years | 43 (100.0%) | 0 (0.0%) |
| 45 to 54 Years | 59 (100.0%) | 0 (0.0%) |
| 55 to 64 Years | 74 (100.0%) | 0 (0.0%) |
| 65 to 74 Years | 47 (100.0%) | 0 (0.0%) |
| 75 Years and older | 20 (100.0%) | 0 (0.0%) |
| Total | 418 (100.0%) | 0 (0.0%) |
Health Insurance Coverage by Citizenship Status in Limestone
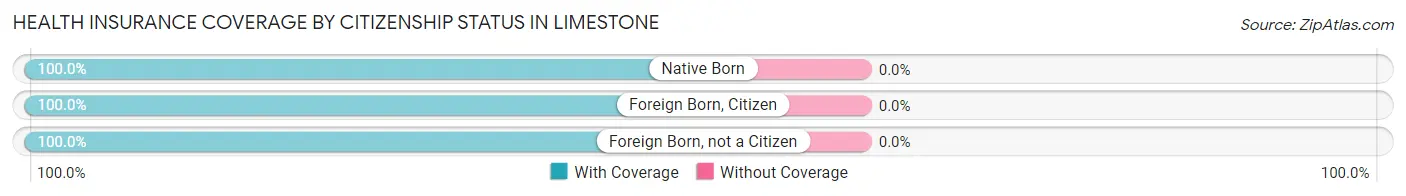
| Citizenship Status | With Coverage | Without Coverage |
| Native Born | 32 (100.0%) | 0 (0.0%) |
| Foreign Born, Citizen | 63 (100.0%) | 0 (0.0%) |
| Foreign Born, not a Citizen | 13 (100.0%) | 0 (0.0%) |
Health Insurance Coverage by Household Income in Limestone
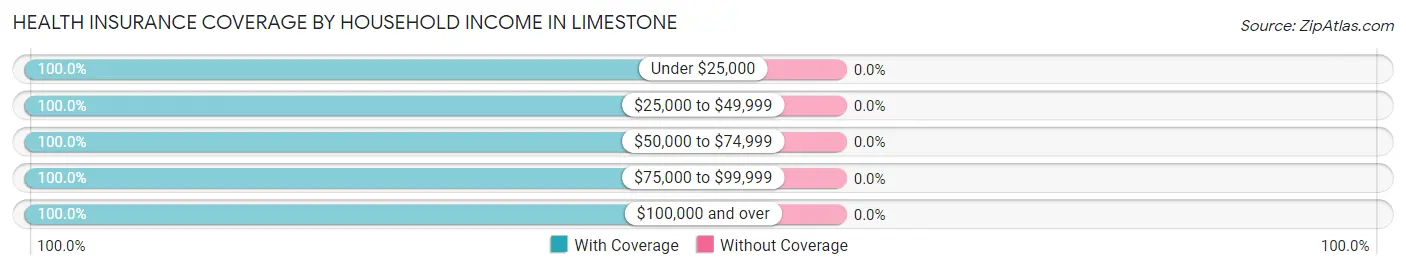
| Household Income | With Coverage | Without Coverage |
| Under $25,000 | 108 (100.0%) | 0 (0.0%) |
| $25,000 to $49,999 | 66 (100.0%) | 0 (0.0%) |
| $50,000 to $74,999 | 57 (100.0%) | 0 (0.0%) |
| $75,000 to $99,999 | 69 (100.0%) | 0 (0.0%) |
| $100,000 and over | 118 (100.0%) | 0 (0.0%) |
Public vs Private Health Insurance Coverage by Age in Limestone
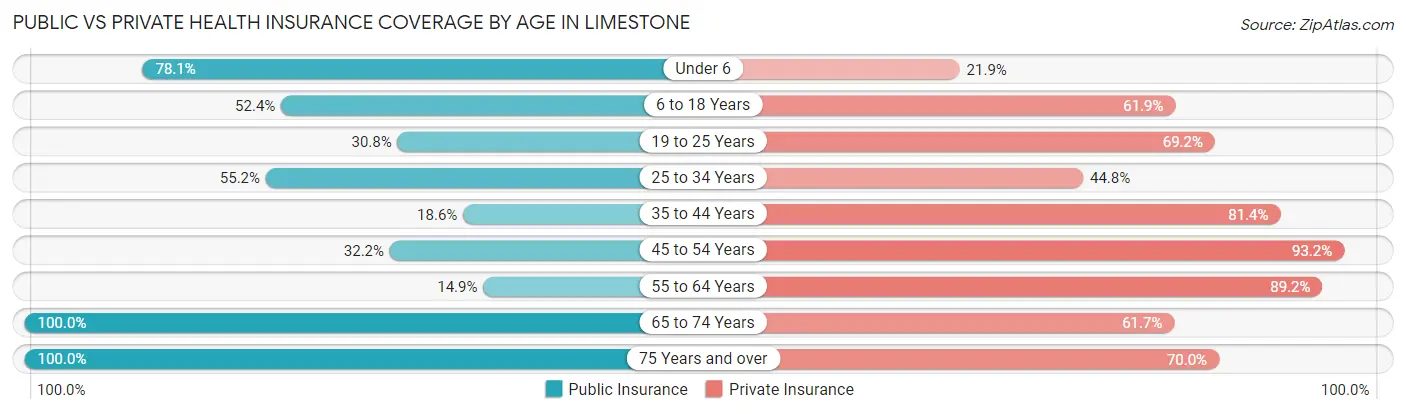
| Age Bracket | Public Insurance | Private Insurance |
| Under 6 | 25 (78.1%) | 7 (21.9%) |
| 6 to 18 Years | 33 (52.4%) | 39 (61.9%) |
| 19 to 25 Years | 4 (30.8%) | 9 (69.2%) |
| 25 to 34 Years | 37 (55.2%) | 30 (44.8%) |
| 35 to 44 Years | 8 (18.6%) | 35 (81.4%) |
| 45 to 54 Years | 19 (32.2%) | 55 (93.2%) |
| 55 to 64 Years | 11 (14.9%) | 66 (89.2%) |
| 65 to 74 Years | 47 (100.0%) | 29 (61.7%) |
| 75 Years and over | 20 (100.0%) | 14 (70.0%) |
| Total | 204 (48.8%) | 284 (67.9%) |
Disability Status by Sex by Age in Limestone
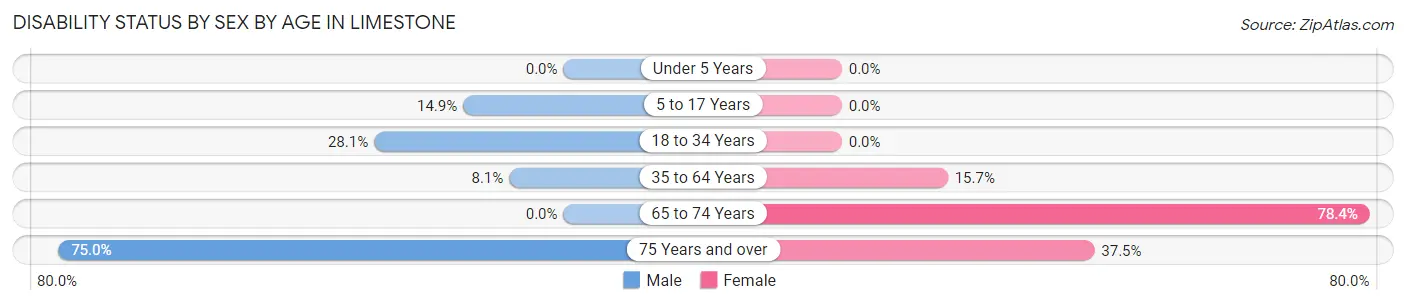
| Age Bracket | Male | Female |
| Under 5 Years | 0 (0.0%) | 0 (0.0%) |
| 5 to 17 Years | 7 (14.9%) | 0 (0.0%) |
| 18 to 34 Years | 9 (28.1%) | 0 (0.0%) |
| 35 to 64 Years | 7 (8.1%) | 14 (15.7%) |
| 65 to 74 Years | 0 (0.0%) | 29 (78.4%) |
| 75 Years and over | 9 (75.0%) | 3 (37.5%) |
Disability Class by Sex by Age in Limestone
Disability Class: Hearing Difficulty
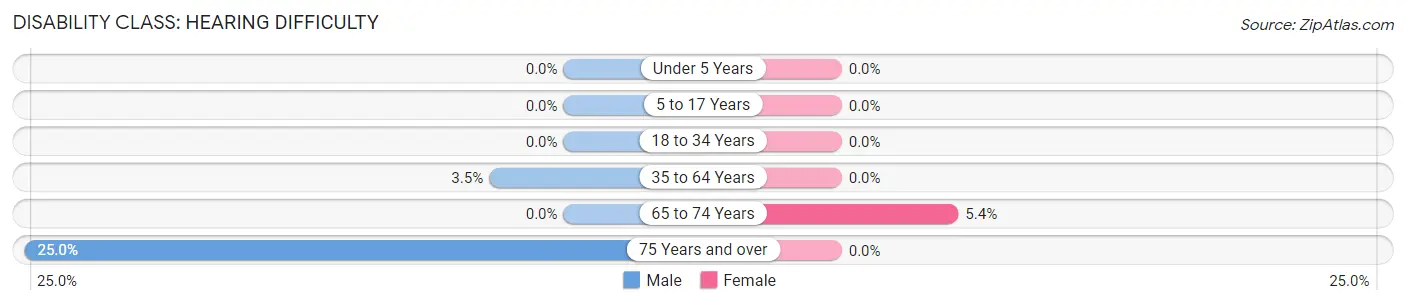
| Age Bracket | Male | Female |
| Under 5 Years | 0 (0.0%) | 0 (0.0%) |
| 5 to 17 Years | 0 (0.0%) | 0 (0.0%) |
| 18 to 34 Years | 0 (0.0%) | 0 (0.0%) |
| 35 to 64 Years | 3 (3.5%) | 0 (0.0%) |
| 65 to 74 Years | 0 (0.0%) | 2 (5.4%) |
| 75 Years and over | 3 (25.0%) | 0 (0.0%) |
Disability Class: Vision Difficulty
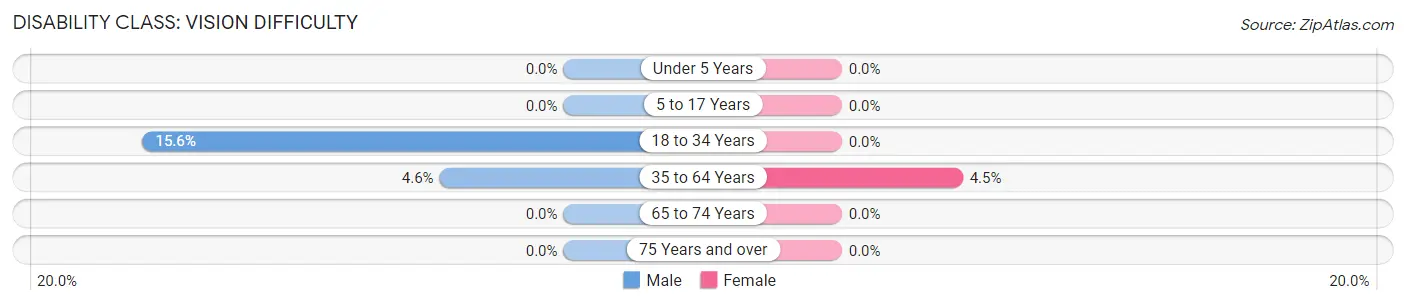
| Age Bracket | Male | Female |
| Under 5 Years | 0 (0.0%) | 0 (0.0%) |
| 5 to 17 Years | 0 (0.0%) | 0 (0.0%) |
| 18 to 34 Years | 5 (15.6%) | 0 (0.0%) |
| 35 to 64 Years | 4 (4.6%) | 4 (4.5%) |
| 65 to 74 Years | 0 (0.0%) | 0 (0.0%) |
| 75 Years and over | 0 (0.0%) | 0 (0.0%) |
Disability Class: Cognitive Difficulty
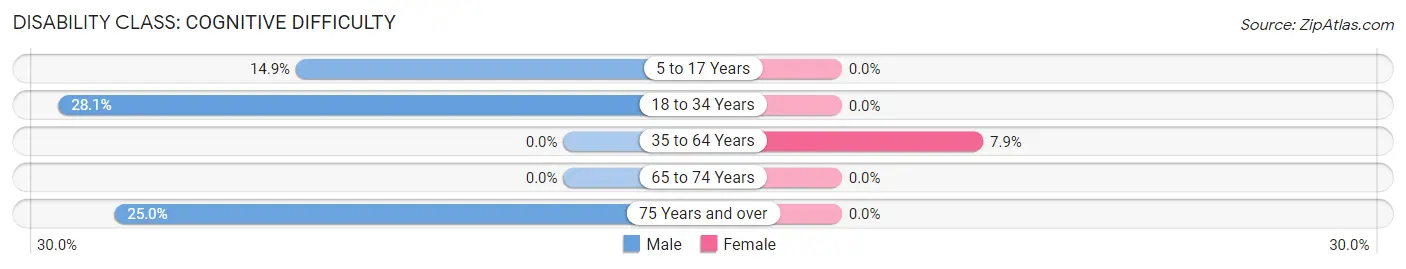
| Age Bracket | Male | Female |
| 5 to 17 Years | 7 (14.9%) | 0 (0.0%) |
| 18 to 34 Years | 9 (28.1%) | 0 (0.0%) |
| 35 to 64 Years | 0 (0.0%) | 7 (7.9%) |
| 65 to 74 Years | 0 (0.0%) | 0 (0.0%) |
| 75 Years and over | 3 (25.0%) | 0 (0.0%) |
Disability Class: Ambulatory Difficulty
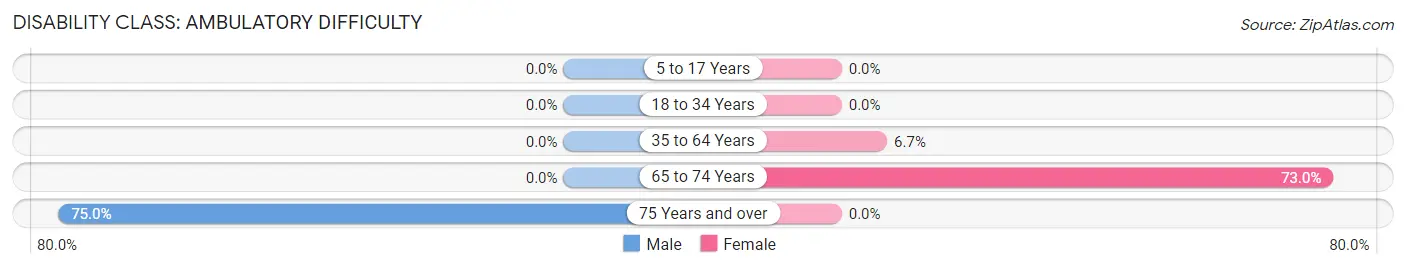
| Age Bracket | Male | Female |
| 5 to 17 Years | 0 (0.0%) | 0 (0.0%) |
| 18 to 34 Years | 0 (0.0%) | 0 (0.0%) |
| 35 to 64 Years | 0 (0.0%) | 6 (6.7%) |
| 65 to 74 Years | 0 (0.0%) | 27 (73.0%) |
| 75 Years and over | 9 (75.0%) | 0 (0.0%) |
Disability Class: Self-Care Difficulty
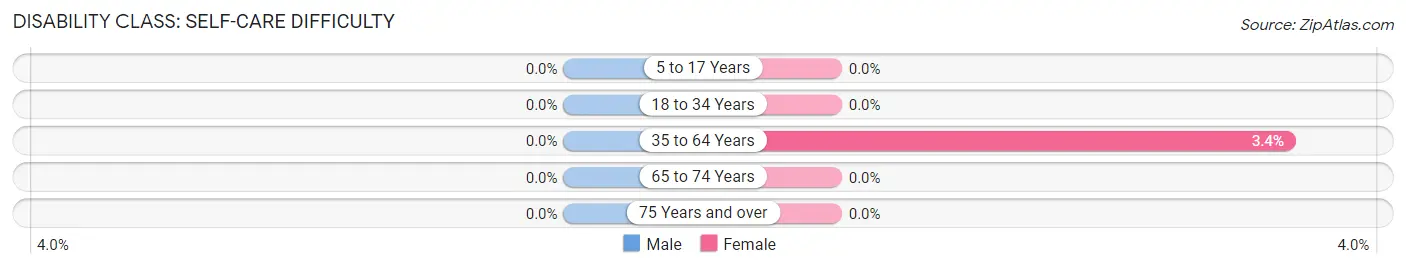
| Age Bracket | Male | Female |
| 5 to 17 Years | 0 (0.0%) | 0 (0.0%) |
| 18 to 34 Years | 0 (0.0%) | 0 (0.0%) |
| 35 to 64 Years | 0 (0.0%) | 3 (3.4%) |
| 65 to 74 Years | 0 (0.0%) | 0 (0.0%) |
| 75 Years and over | 0 (0.0%) | 0 (0.0%) |
Technology Access in Limestone
Computing Device Access in Limestone
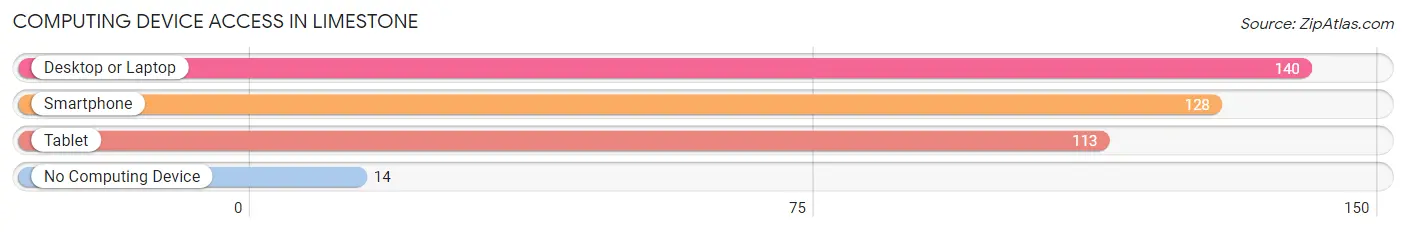
| Device Type | # Households | % Households |
| Desktop or Laptop | 140 | 79.5% |
| Smartphone | 128 | 72.7% |
| Tablet | 113 | 64.2% |
| No Computing Device | 14 | 8.0% |
| Total | 176 | 100.0% |
Internet Access in Limestone
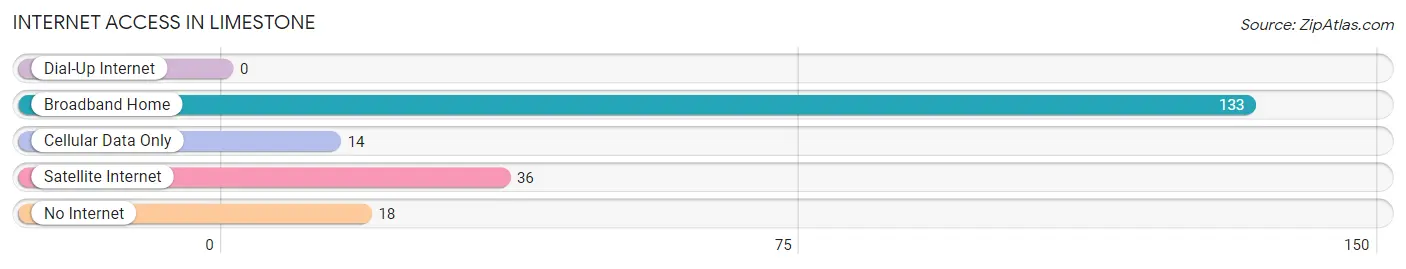
| Internet Type | # Households | % Households |
| Dial-Up Internet | 0 | 0.0% |
| Broadband Home | 133 | 75.6% |
| Cellular Data Only | 14 | 8.0% |
| Satellite Internet | 36 | 20.4% |
| No Internet | 18 | 10.2% |
| Total | 176 | 100.0% |
Limestone Summary
Limestone, New York is a small town located in Cattaraugus County, New York. It is situated in the foothills of the Allegheny Mountains, and is part of the Southern Tier region of the state. The town was founded in 1812 and has a population of approximately 1,000 people.
Geography
Limestone is located in the foothills of the Allegheny Mountains, and is part of the Southern Tier region of New York. The town is situated on the eastern edge of Cattaraugus County, and is bordered by the towns of Great Valley to the north, Franklinville to the east, and Humphrey to the south. The town is approximately 25 miles south of Buffalo, and is situated along the Allegheny River. The town has a total area of 11.2 square miles, of which 11.1 square miles is land and 0.1 square miles is water.
History
Limestone was first settled in 1812 by a group of settlers from Connecticut. The town was originally known as “Limestone Hill”, and was named after the limestone deposits that were found in the area. The town was officially incorporated in 1820, and the first post office was established in 1821.
In the late 19th century, Limestone was a thriving agricultural community. The town was home to several dairy farms, and the local economy was largely based on the production of cheese and butter. The town also had several sawmills, gristmills, and a tannery.
In the early 20th century, the town began to decline as the local economy shifted away from agriculture. The town’s population decreased, and many of the businesses closed. In the late 20th century, the town began to experience a resurgence as the local economy shifted towards tourism. The town is now home to several bed and breakfasts, and is a popular destination for outdoor recreation.
Economy
The economy of Limestone is largely based on tourism and outdoor recreation. The town is home to several bed and breakfasts, and is a popular destination for fishing, hunting, and camping. The town also has several small businesses, including a grocery store, a hardware store, and a gas station.
Demographics
As of the 2010 census, the population of Limestone was 1,000 people. The racial makeup of the town was 97.2% White, 0.7% African American, 0.2% Native American, 0.2% Asian, 0.2% from other races, and 1.7% from two or more races. Hispanic or Latino of any race were 1.2% of the population.
The median household income in Limestone was $41,250, and the median family income was $45,833. The per capita income for the town was $19,945. About 11.2% of families and 14.2% of the population were below the poverty line, including 18.2% of those under age 18 and 8.3% of those age 65 or over.
Limestone is a small town with a rich history and a vibrant economy. The town is home to several bed and breakfasts, and is a popular destination for outdoor recreation. The town has a diverse population, and is a great place to live and work.
Common Questions
What is Per Capita Income in Limestone?
Per Capita income in Limestone is $27,983.
What is the Median Family Income in Limestone?
Median Family Income in Limestone is $68,750.
What is Income or Wage Gap in Limestone?
Income or Wage Gap in Limestone is 51.3%.
Women in Limestone earn 48.7 cents for every dollar earned by a man.
What is Inequality or Gini Index in Limestone?
Inequality or Gini Index in Limestone is 0.43.
What is the Total Population of Limestone?
Total Population of Limestone is 426.
What is the Total Male Population of Limestone?
Total Male Population of Limestone is 201.
What is the Total Female Population of Limestone?
Total Female Population of Limestone is 225.
What is the Ratio of Males per 100 Females in Limestone?
There are 89.33 Males per 100 Females in Limestone.
What is the Ratio of Females per 100 Males in Limestone?
There are 111.94 Females per 100 Males in Limestone.
What is the Median Population Age in Limestone?
Median Population Age in Limestone is 41.8 Years.
What is the Average Family Size in Limestone
Average Family Size in Limestone is 3.1 People.
What is the Average Household Size in Limestone
Average Household Size in Limestone is 2.4 People.
How Large is the Labor Force in Limestone?
There are 186 People in the Labor Forcein in Limestone.
What is the Percentage of People in the Labor Force in Limestone?
54.4% of People are in the Labor Force in Limestone.