Hopewell Junction, NY Map & Demographics
Hopewell Junction Map
Hopewell Junction Overview
$49,726
PER CAPITA INCOME
$124,808
AVG FAMILY INCOME
$103,894
AVG HOUSEHOLD INCOME
0.44
INEQUALITY / GINI INDEX
824
TOTAL POPULATION
355
MALE POPULATION
469
FEMALE POPULATION
75.69
MALES / 100 FEMALES
132.11
FEMALES / 100 MALES
36.8
MEDIAN AGE
3.1
AVG FAMILY SIZE
2.5
AVG HOUSEHOLD SIZE
340
LABOR FORCE [ PEOPLE ]
59.0%
PERCENT IN LABOR FORCE
0.6%
UNEMPLOYMENT RATE
Hopewell Junction Zip Codes
Hopewell Junction Area Codes
Income in Hopewell Junction
Income Overview in Hopewell Junction
Per Capita Income in Hopewell Junction is $49,726, while median incomes of families and households are $124,808 and $103,894 respectively.
| Characteristic | Number | Measure |
| Per Capita Income | 824 | $49,726 |
| Median Family Income | 224 | $124,808 |
| Mean Family Income | 224 | $161,792 |
| Median Household Income | 333 | $103,894 |
| Mean Household Income | 333 | $129,534 |
| Income Deficit | 224 | $0 |
| Wage / Income Gap (%) | 824 | 0.00% |
| Wage / Income Gap ($) | 824 | 100.00¢ per $1 |
| Gini / Inequality Index | 824 | 0.44 |
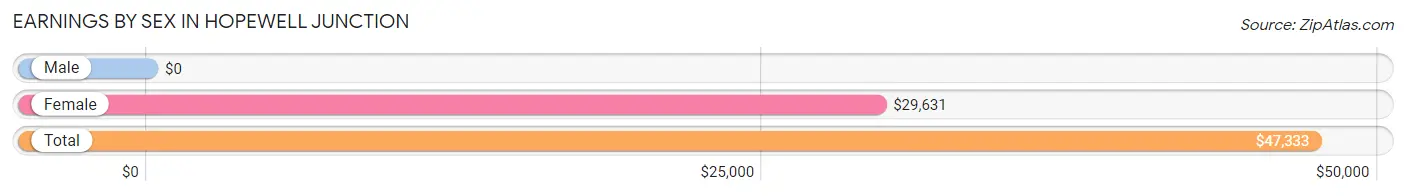
Earnings by Sex in Hopewell Junction
| Sex | Number | Average Earnings |
| Male | 183 (54.1%) | $0 |
| Female | 155 (45.9%) | $29,631 |
| Total | 338 (100.0%) | $47,333 |
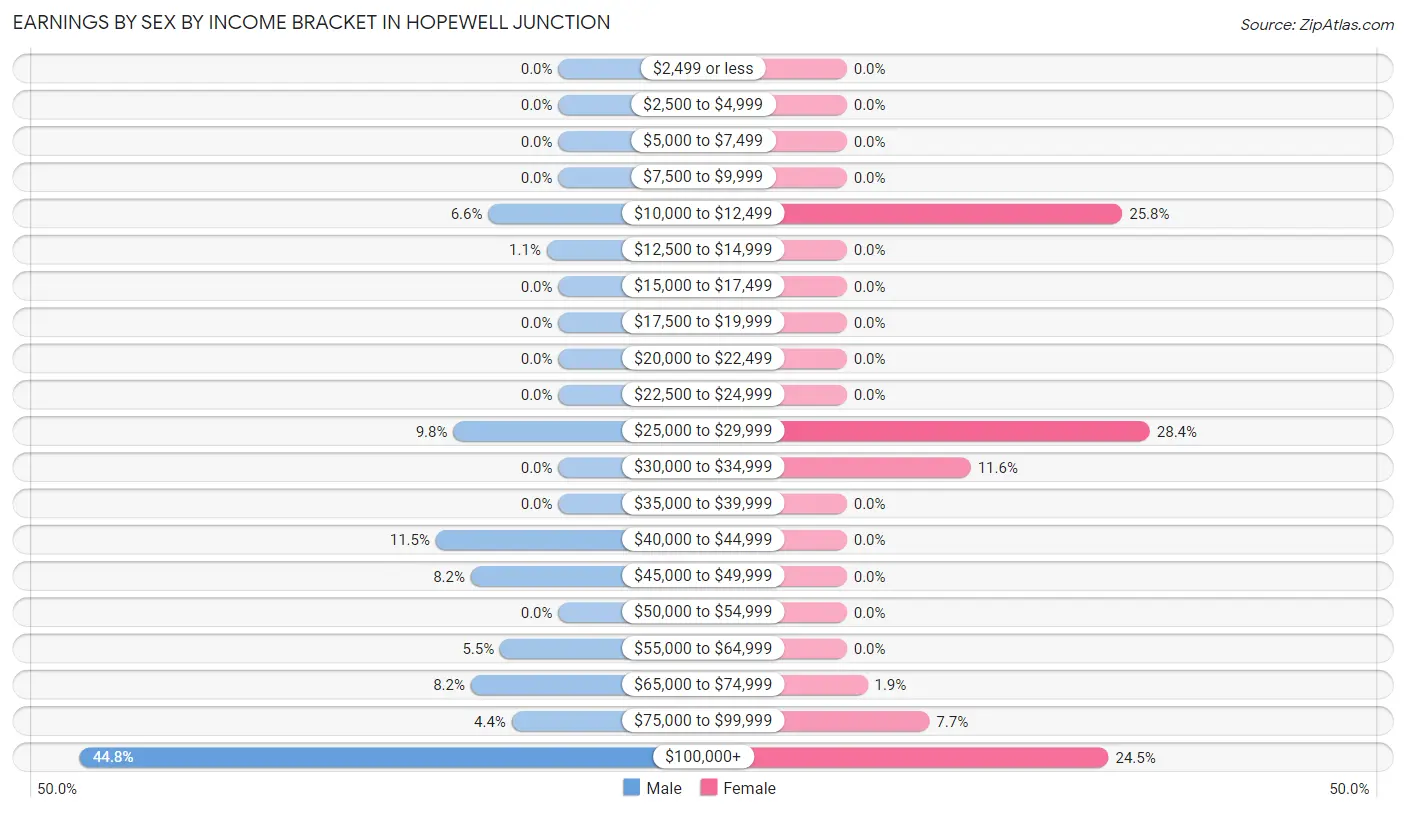
Earnings by Sex by Income Bracket in Hopewell Junction
The most common earnings brackets in Hopewell Junction are $100,000+ for men (82 | 44.8%) and $25,000 to $29,999 for women (44 | 28.4%).
| Income | Male | Female |
| $2,499 or less | 0 (0.0%) | 0 (0.0%) |
| $2,500 to $4,999 | 0 (0.0%) | 0 (0.0%) |
| $5,000 to $7,499 | 0 (0.0%) | 0 (0.0%) |
| $7,500 to $9,999 | 0 (0.0%) | 0 (0.0%) |
| $10,000 to $12,499 | 12 (6.6%) | 40 (25.8%) |
| $12,500 to $14,999 | 2 (1.1%) | 0 (0.0%) |
| $15,000 to $17,499 | 0 (0.0%) | 0 (0.0%) |
| $17,500 to $19,999 | 0 (0.0%) | 0 (0.0%) |
| $20,000 to $22,499 | 0 (0.0%) | 0 (0.0%) |
| $22,500 to $24,999 | 0 (0.0%) | 0 (0.0%) |
| $25,000 to $29,999 | 18 (9.8%) | 44 (28.4%) |
| $30,000 to $34,999 | 0 (0.0%) | 18 (11.6%) |
| $35,000 to $39,999 | 0 (0.0%) | 0 (0.0%) |
| $40,000 to $44,999 | 21 (11.5%) | 0 (0.0%) |
| $45,000 to $49,999 | 15 (8.2%) | 0 (0.0%) |
| $50,000 to $54,999 | 0 (0.0%) | 0 (0.0%) |
| $55,000 to $64,999 | 10 (5.5%) | 0 (0.0%) |
| $65,000 to $74,999 | 15 (8.2%) | 3 (1.9%) |
| $75,000 to $99,999 | 8 (4.4%) | 12 (7.7%) |
| $100,000+ | 82 (44.8%) | 38 (24.5%) |
| Total | 183 (100.0%) | 155 (100.0%) |
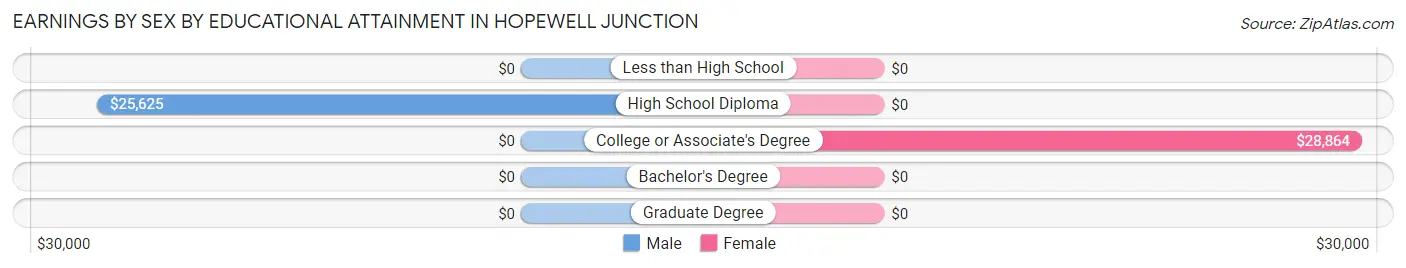
Earnings by Sex by Educational Attainment in Hopewell Junction
Average earnings in Hopewell Junction are $130,057 for men and $29,924 for women, a difference of 77.0%. Men with an educational attainment of high school diploma enjoy the highest average annual earnings of $25,625, while those with high school diploma education earn the least with $25,625. Women with an educational attainment of college or associate's degree earn the most with the average annual earnings of $28,864, while those with college or associate's degree education have the smallest earnings of $28,864.
| Educational Attainment | Male Income | Female Income |
| Less than High School | - | - |
| High School Diploma | $25,625 | $0 |
| College or Associate's Degree | - | - |
| Bachelor's Degree | - | - |
| Graduate Degree | - | - |
| Total | $130,057 | $29,924 |
Family Income in Hopewell Junction
Family Income Brackets in Hopewell Junction
According to the Hopewell Junction family income data, there are 84 families falling into the $200,000+ income range, which is the most common income bracket and makes up 37.5% of all families.
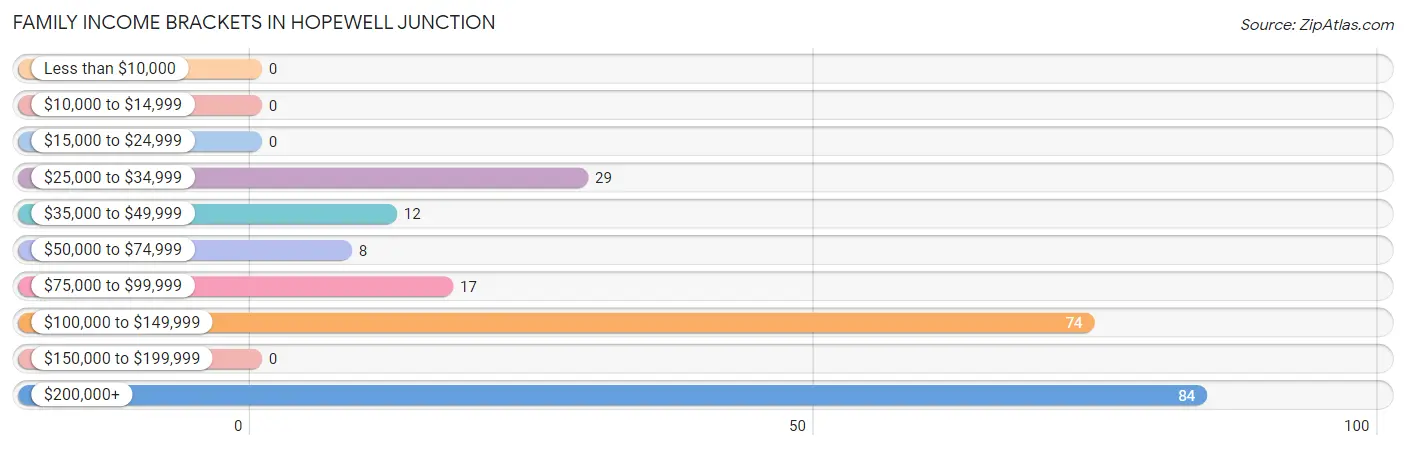
| Income Bracket | # Families | % Families |
| Less than $10,000 | 0 | 0.0% |
| $10,000 to $14,999 | 0 | 0.0% |
| $15,000 to $24,999 | 0 | 0.0% |
| $25,000 to $34,999 | 29 | 12.9% |
| $35,000 to $49,999 | 12 | 5.4% |
| $50,000 to $74,999 | 8 | 3.6% |
| $75,000 to $99,999 | 17 | 7.6% |
| $100,000 to $149,999 | 74 | 33.0% |
| $150,000 to $199,999 | 0 | 0.0% |
| $200,000+ | 84 | 37.5% |
Family Income by Famaliy Size in Hopewell Junction
4-person families (55 | 24.5%) account for the highest median family income in Hopewell Junction with $238,194 per family, while 4-person families (55 | 24.5%) have the highest median income of $59,548 per family member.
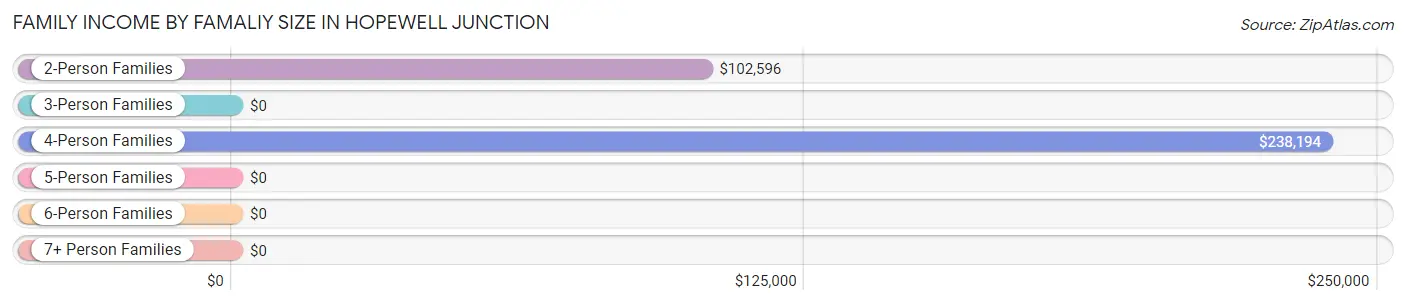
| Income Bracket | # Families | Median Income |
| 2-Person Families | 76 (33.9%) | $102,596 |
| 3-Person Families | 54 (24.1%) | $0 |
| 4-Person Families | 55 (24.5%) | $238,194 |
| 5-Person Families | 31 (13.8%) | $0 |
| 6-Person Families | 8 (3.6%) | $0 |
| 7+ Person Families | 0 (0.0%) | $0 |
| Total | 224 (100.0%) | $124,808 |
Family Income by Number of Earners in Hopewell Junction
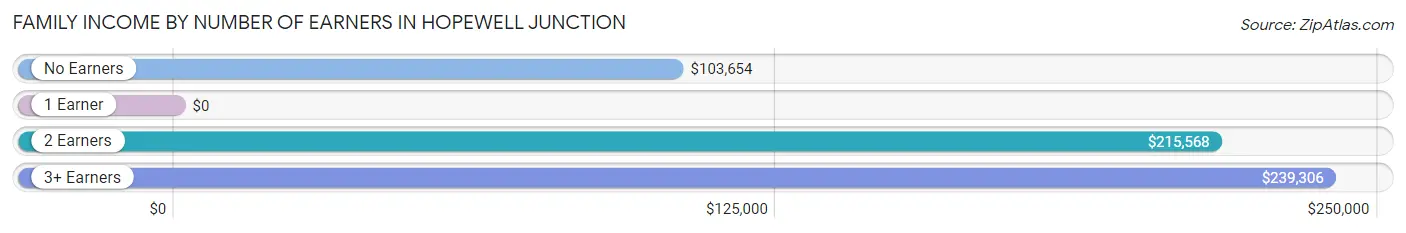
| Number of Earners | # Families | Median Income |
| No Earners | 54 (24.1%) | $103,654 |
| 1 Earner | 82 (36.6%) | $0 |
| 2 Earners | 59 (26.3%) | $215,568 |
| 3+ Earners | 29 (13.0%) | $239,306 |
| Total | 224 (100.0%) | $124,808 |
Household Income in Hopewell Junction
Household Income Brackets in Hopewell Junction
With 86 households falling in the category, the $200,000+ income range is the most frequent in Hopewell Junction, accounting for 25.8% of all households.
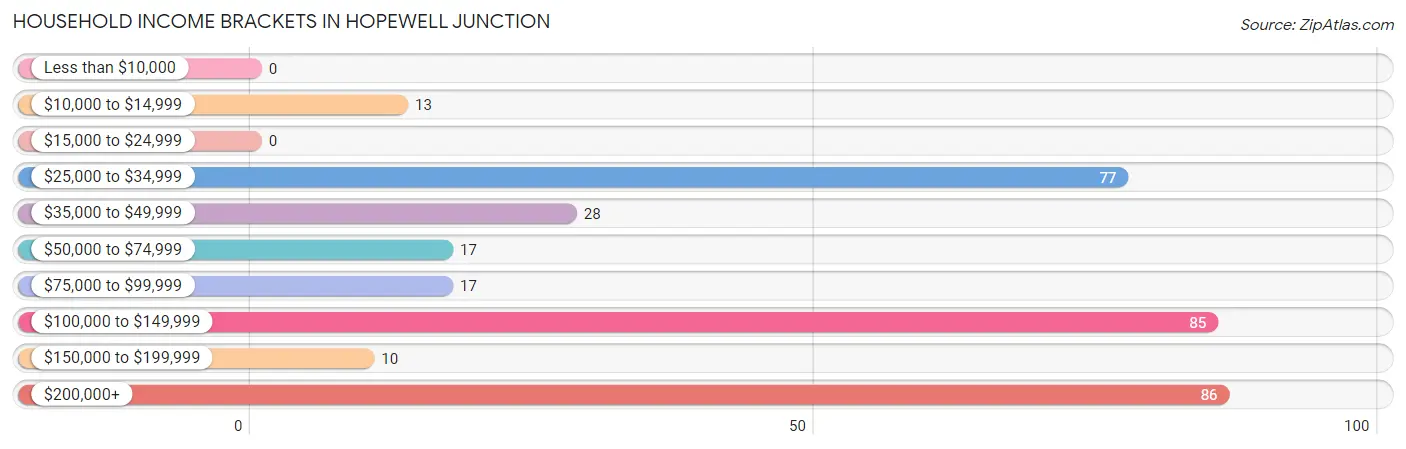
| Income Bracket | # Households | % Households |
| Less than $10,000 | 0 | 0.0% |
| $10,000 to $14,999 | 13 | 3.9% |
| $15,000 to $24,999 | 0 | 0.0% |
| $25,000 to $34,999 | 77 | 23.1% |
| $35,000 to $49,999 | 28 | 8.4% |
| $50,000 to $74,999 | 17 | 5.1% |
| $75,000 to $99,999 | 17 | 5.1% |
| $100,000 to $149,999 | 85 | 25.5% |
| $150,000 to $199,999 | 10 | 3.0% |
| $200,000+ | 86 | 25.8% |
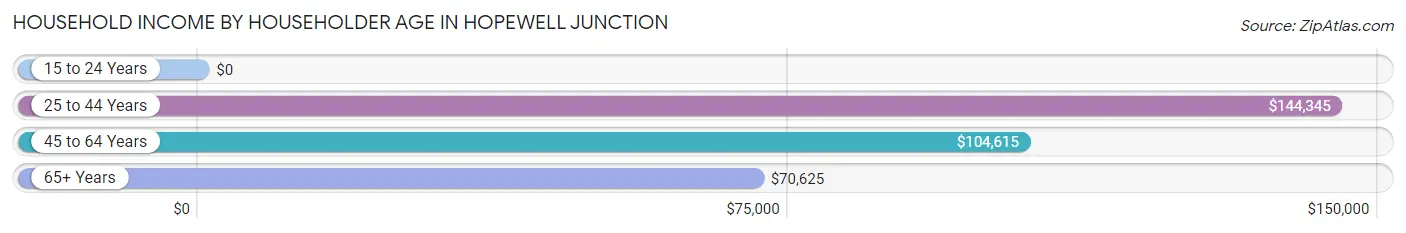
Household Income by Householder Age in Hopewell Junction
The median household income in Hopewell Junction is $103,894, with the highest median household income of $144,345 found in the 25 to 44 years age bracket for the primary householder. A total of 75 households (22.5%) fall into this category.
| Income Bracket | # Households | Median Income |
| 15 to 24 Years | 0 (0.0%) | $0 |
| 25 to 44 Years | 75 (22.5%) | $144,345 |
| 45 to 64 Years | 164 (49.2%) | $104,615 |
| 65+ Years | 94 (28.2%) | $70,625 |
| Total | 333 (100.0%) | $103,894 |
Poverty in Hopewell Junction
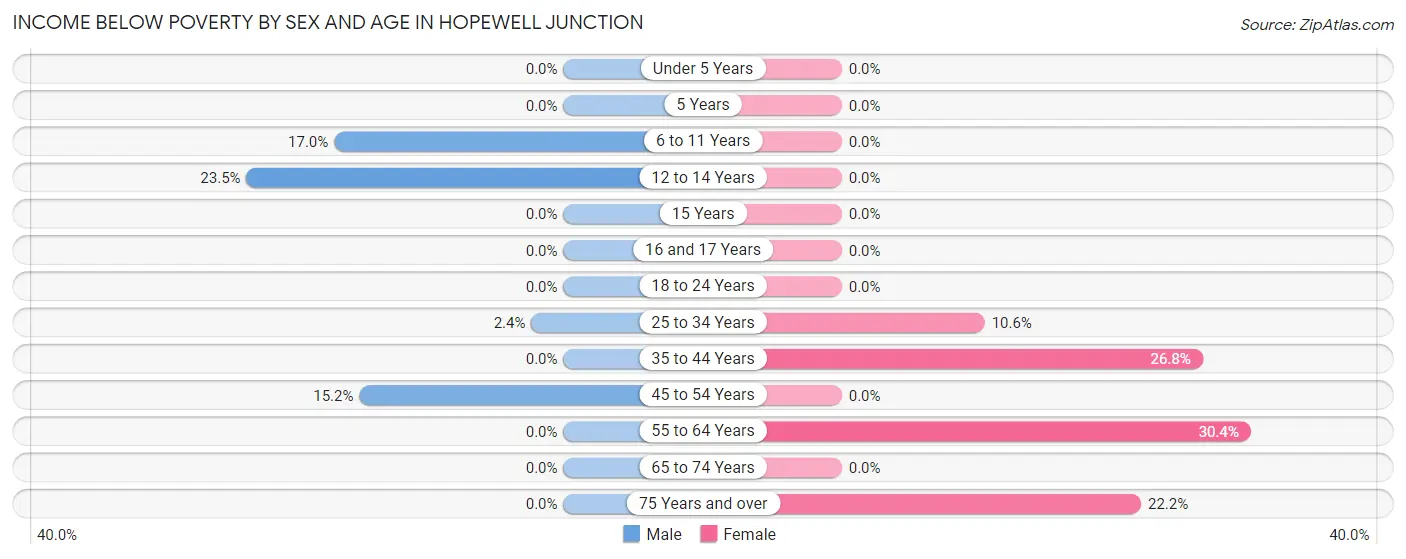
Income Below Poverty by Sex and Age in Hopewell Junction
With 7.6% poverty level for males and 9.6% for females among the residents of Hopewell Junction, 12 to 14 year old males and 55 to 64 year old females are the most vulnerable to poverty, with 8 males (23.5%) and 17 females (30.4%) in their respective age groups living below the poverty level.
| Age Bracket | Male | Female |
| Under 5 Years | 0 (0.0%) | 0 (0.0%) |
| 5 Years | 0 (0.0%) | 0 (0.0%) |
| 6 to 11 Years | 8 (17.0%) | 0 (0.0%) |
| 12 to 14 Years | 8 (23.5%) | 0 (0.0%) |
| 15 Years | 0 (0.0%) | 0 (0.0%) |
| 16 and 17 Years | 0 (0.0%) | 0 (0.0%) |
| 18 to 24 Years | 0 (0.0%) | 0 (0.0%) |
| 25 to 34 Years | 1 (2.4%) | 7 (10.6%) |
| 35 to 44 Years | 0 (0.0%) | 15 (26.8%) |
| 45 to 54 Years | 10 (15.1%) | 0 (0.0%) |
| 55 to 64 Years | 0 (0.0%) | 17 (30.4%) |
| 65 to 74 Years | 0 (0.0%) | 0 (0.0%) |
| 75 Years and over | 0 (0.0%) | 6 (22.2%) |
| Total | 27 (7.6%) | 45 (9.6%) |
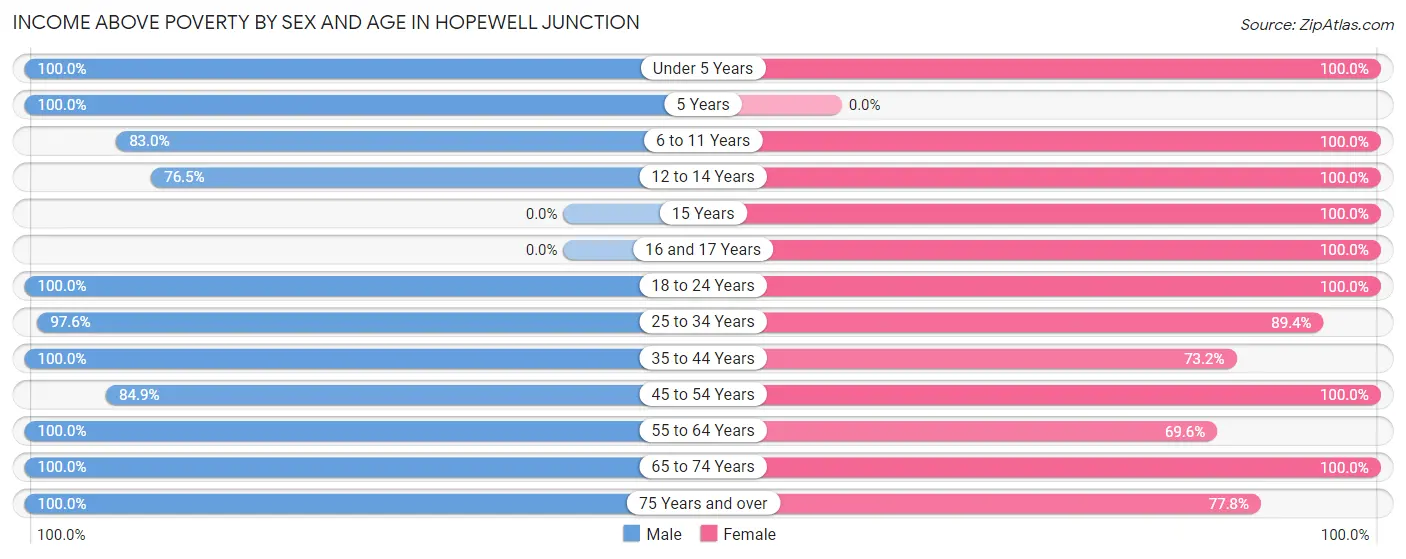
Income Above Poverty by Sex and Age in Hopewell Junction
According to the poverty statistics in Hopewell Junction, males aged under 5 years and females aged under 5 years are the age groups that are most secure financially, with 100.0% of males and 100.0% of females in these age groups living above the poverty line.
| Age Bracket | Male | Female |
| Under 5 Years | 36 (100.0%) | 42 (100.0%) |
| 5 Years | 11 (100.0%) | 0 (0.0%) |
| 6 to 11 Years | 39 (83.0%) | 35 (100.0%) |
| 12 to 14 Years | 26 (76.5%) | 19 (100.0%) |
| 15 Years | 0 (0.0%) | 24 (100.0%) |
| 16 and 17 Years | 0 (0.0%) | 20 (100.0%) |
| 18 to 24 Years | 20 (100.0%) | 11 (100.0%) |
| 25 to 34 Years | 41 (97.6%) | 59 (89.4%) |
| 35 to 44 Years | 34 (100.0%) | 41 (73.2%) |
| 45 to 54 Years | 56 (84.9%) | 64 (100.0%) |
| 55 to 64 Years | 16 (100.0%) | 39 (69.6%) |
| 65 to 74 Years | 41 (100.0%) | 49 (100.0%) |
| 75 Years and over | 8 (100.0%) | 21 (77.8%) |
| Total | 328 (92.4%) | 424 (90.4%) |
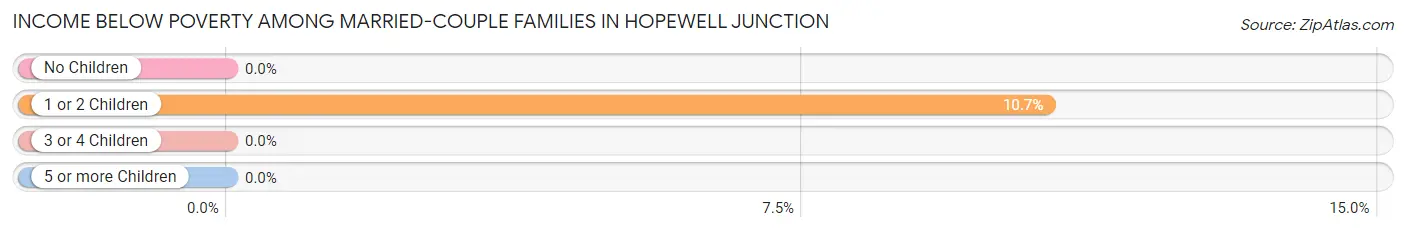
Income Below Poverty Among Married-Couple Families in Hopewell Junction
The poverty statistics for married-couple families in Hopewell Junction show that 4.9% or 8 of the total 165 families live below the poverty line. Families with 1 or 2 children have the highest poverty rate of 10.7%, comprising of 8 families. On the other hand, families with no children have the lowest poverty rate of 0.0%, which includes 0 families.
| Children | Above Poverty | Below Poverty |
| No Children | 59 (100.0%) | 0 (0.0%) |
| 1 or 2 Children | 67 (89.3%) | 8 (10.7%) |
| 3 or 4 Children | 31 (100.0%) | 0 (0.0%) |
| 5 or more Children | 0 (0.0%) | 0 (0.0%) |
| Total | 157 (95.2%) | 8 (4.9%) |
Income Below Poverty Among Single-Parent Households in Hopewell Junction
| Children | Single Father | Single Mother |
| No Children | 0 (0.0%) | 0 (0.0%) |
| 1 or 2 Children | 0 (0.0%) | 0 (0.0%) |
| 3 or 4 Children | 0 (0.0%) | 0 (0.0%) |
| 5 or more Children | 0 (0.0%) | 0 (0.0%) |
| Total | 0 (0.0%) | 0 (0.0%) |
Income Below Poverty Among Married-Couple vs Single-Parent Households in Hopewell Junction
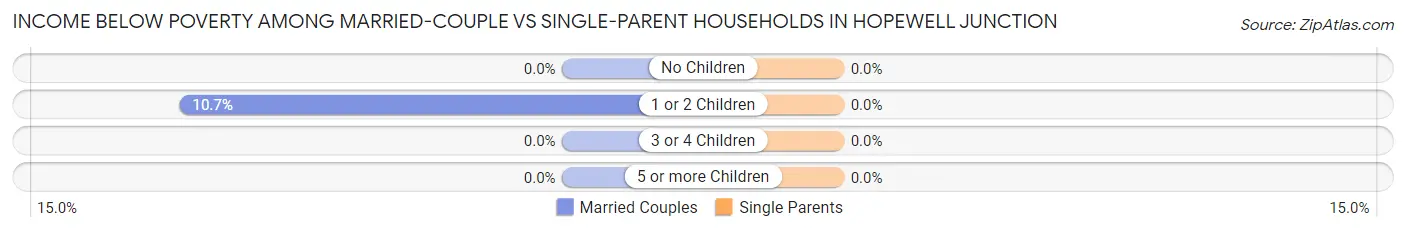
| Children | Married-Couple Families | Single-Parent Households |
| No Children | 0 (0.0%) | 0 (0.0%) |
| 1 or 2 Children | 8 (10.7%) | 0 (0.0%) |
| 3 or 4 Children | 0 (0.0%) | 0 (0.0%) |
| 5 or more Children | 0 (0.0%) | 0 (0.0%) |
| Total | 8 (4.9%) | 0 (0.0%) |
Race in Hopewell Junction
The most populous races in Hopewell Junction are White / Caucasian (556 | 67.5%), Some other Race (180 | 21.8%), and Hispanic or Latino (174 | 21.1%).
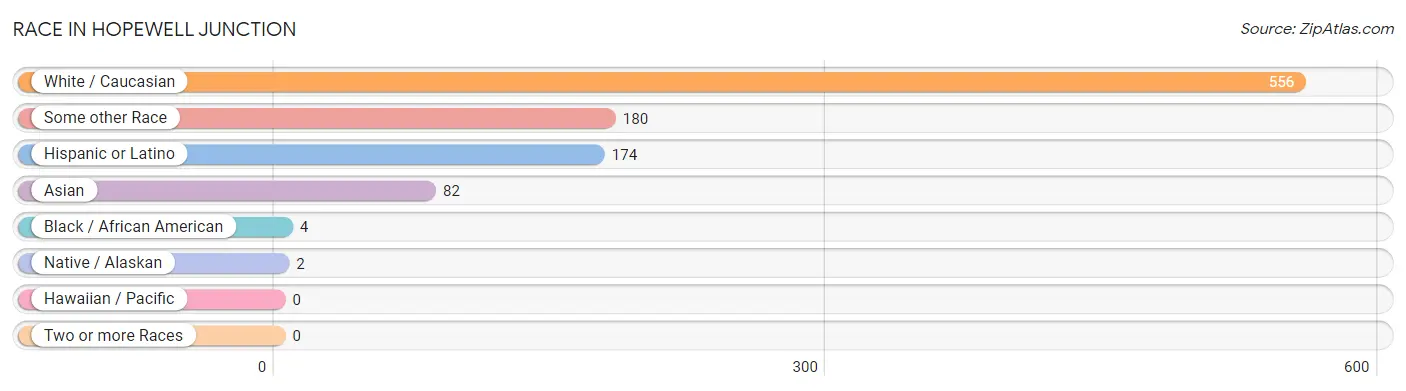
| Race | # Population | % Population |
| Asian | 82 | 10.0% |
| Black / African American | 4 | 0.5% |
| Hawaiian / Pacific | 0 | 0.0% |
| Hispanic or Latino | 174 | 21.1% |
| Native / Alaskan | 2 | 0.2% |
| White / Caucasian | 556 | 67.5% |
| Two or more Races | 0 | 0.0% |
| Some other Race | 180 | 21.8% |
| Total | 824 | 100.0% |
Ancestry in Hopewell Junction
The most populous ancestries reported in Hopewell Junction are Italian (248 | 30.1%), Irish (192 | 23.3%), Ecuadorian (113 | 13.7%), South American (113 | 13.7%), and Polish (57 | 6.9%), together accounting for 87.7% of all Hopewell Junction residents.
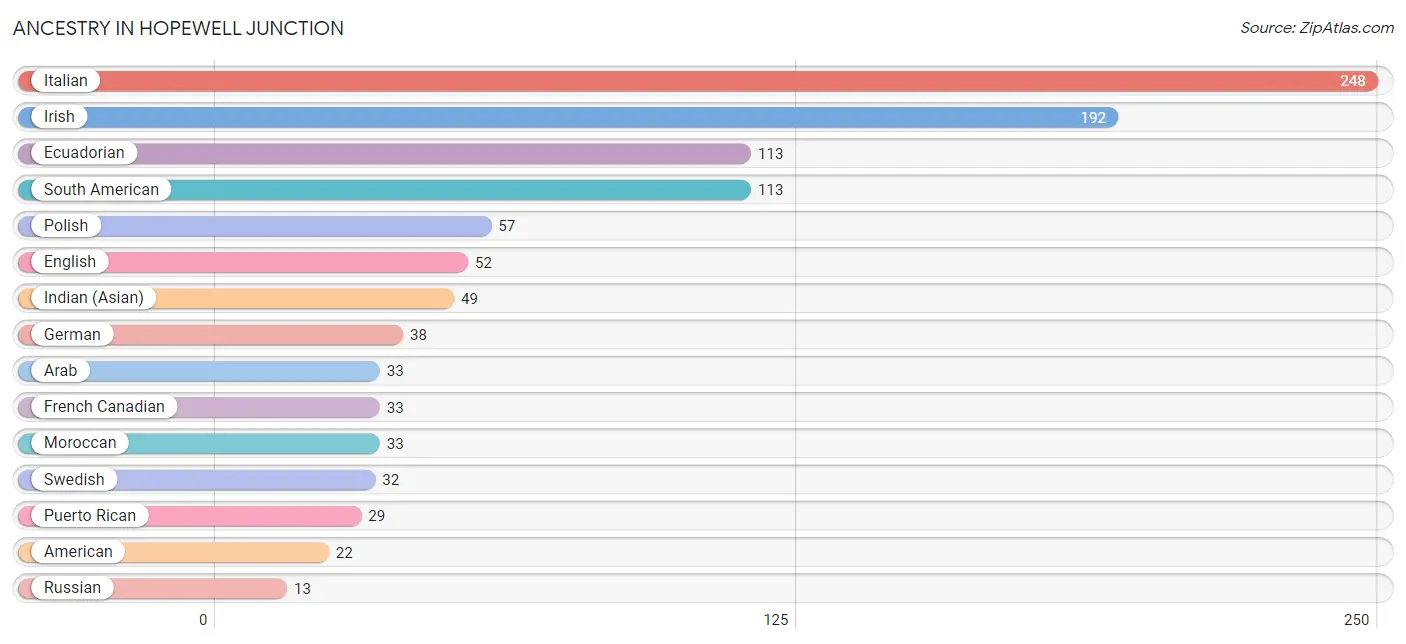
| Ancestry | # Population | % Population |
| American | 22 | 2.7% |
| Arab | 33 | 4.0% |
| Canadian | 8 | 1.0% |
| Central American Indian | 2 | 0.2% |
| Ecuadorian | 113 | 13.7% |
| English | 52 | 6.3% |
| French Canadian | 33 | 4.0% |
| German | 38 | 4.6% |
| Hungarian | 6 | 0.7% |
| Indian (Asian) | 49 | 5.9% |
| Irish | 192 | 23.3% |
| Italian | 248 | 30.1% |
| Moroccan | 33 | 4.0% |
| Polish | 57 | 6.9% |
| Puerto Rican | 29 | 3.5% |
| Russian | 13 | 1.6% |
| Scottish | 9 | 1.1% |
| South American | 113 | 13.7% |
| Swedish | 32 | 3.9% | View All 19 Rows |
Immigrants in Hopewell Junction
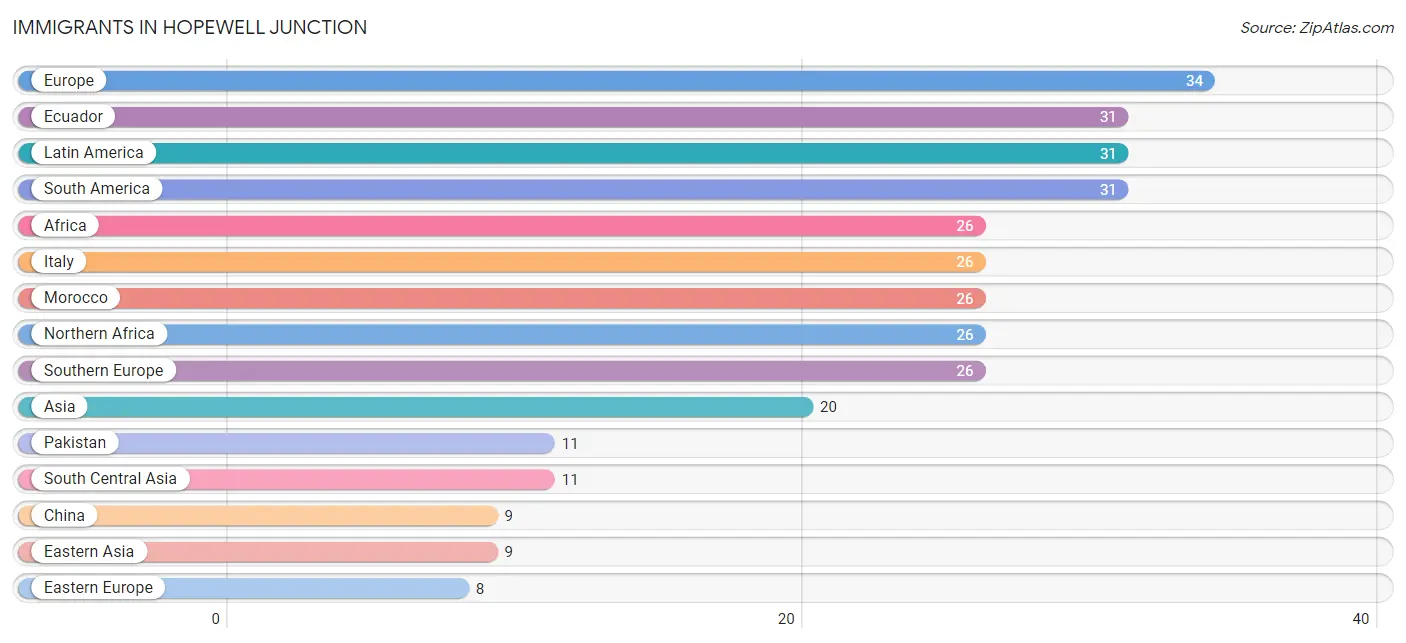
The most numerous immigrant groups reported in Hopewell Junction came from Europe (34 | 4.1%), Ecuador (31 | 3.8%), Latin America (31 | 3.8%), South America (31 | 3.8%), and Africa (26 | 3.2%), together accounting for 18.6% of all Hopewell Junction residents.
| Immigration Origin | # Population | % Population |
| Africa | 26 | 3.2% |
| Asia | 20 | 2.4% |
| China | 9 | 1.1% |
| Eastern Asia | 9 | 1.1% |
| Eastern Europe | 8 | 1.0% |
| Ecuador | 31 | 3.8% |
| Europe | 34 | 4.1% |
| Italy | 26 | 3.2% |
| Latin America | 31 | 3.8% |
| Morocco | 26 | 3.2% |
| Northern Africa | 26 | 3.2% |
| Pakistan | 11 | 1.3% |
| Poland | 8 | 1.0% |
| South America | 31 | 3.8% |
| South Central Asia | 11 | 1.3% |
| Southern Europe | 26 | 3.2% | View All 16 Rows |
Sex and Age in Hopewell Junction
Sex and Age in Hopewell Junction
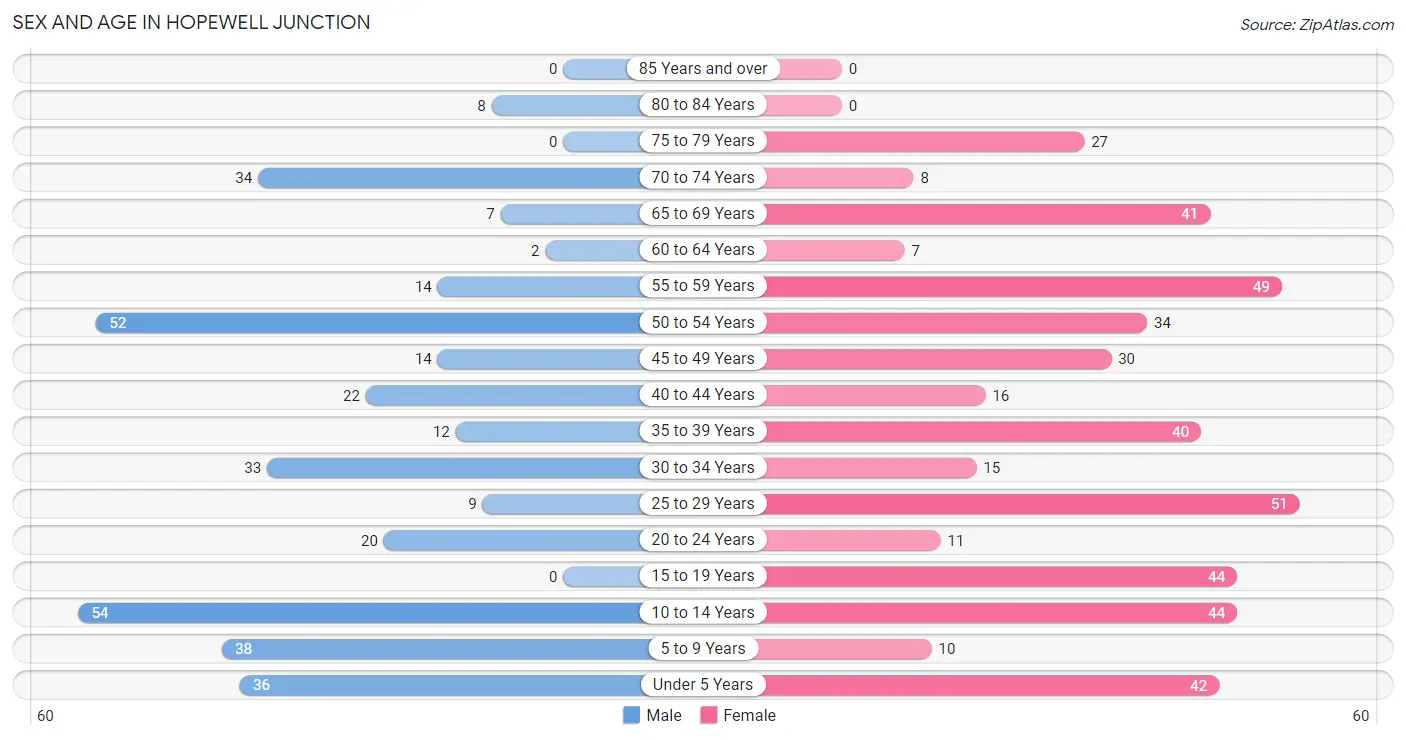
The most populous age groups in Hopewell Junction are 10 to 14 Years (54 | 15.2%) for men and 25 to 29 Years (51 | 10.9%) for women.
| Age Bracket | Male | Female |
| Under 5 Years | 36 (10.1%) | 42 (9.0%) |
| 5 to 9 Years | 38 (10.7%) | 10 (2.1%) |
| 10 to 14 Years | 54 (15.2%) | 44 (9.4%) |
| 15 to 19 Years | 0 (0.0%) | 44 (9.4%) |
| 20 to 24 Years | 20 (5.6%) | 11 (2.4%) |
| 25 to 29 Years | 9 (2.5%) | 51 (10.9%) |
| 30 to 34 Years | 33 (9.3%) | 15 (3.2%) |
| 35 to 39 Years | 12 (3.4%) | 40 (8.5%) |
| 40 to 44 Years | 22 (6.2%) | 16 (3.4%) |
| 45 to 49 Years | 14 (3.9%) | 30 (6.4%) |
| 50 to 54 Years | 52 (14.6%) | 34 (7.2%) |
| 55 to 59 Years | 14 (3.9%) | 49 (10.4%) |
| 60 to 64 Years | 2 (0.6%) | 7 (1.5%) |
| 65 to 69 Years | 7 (2.0%) | 41 (8.7%) |
| 70 to 74 Years | 34 (9.6%) | 8 (1.7%) |
| 75 to 79 Years | 0 (0.0%) | 27 (5.8%) |
| 80 to 84 Years | 8 (2.2%) | 0 (0.0%) |
| 85 Years and over | 0 (0.0%) | 0 (0.0%) |
| Total | 355 (100.0%) | 469 (100.0%) |
Families and Households in Hopewell Junction
Median Family Size in Hopewell Junction
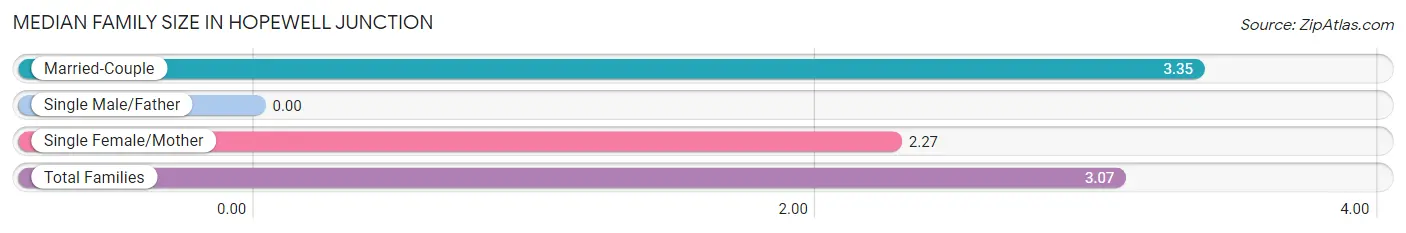
| Family Type | # Families | Family Size |
| Married-Couple | 165 (73.7%) | 3.35 |
| Single Male/Father | 0 (0.0%) | - |
| Single Female/Mother | 59 (26.3%) | 2.27 |
| Total Families | 224 (100.0%) | 3.07 |
Median Household Size in Hopewell Junction
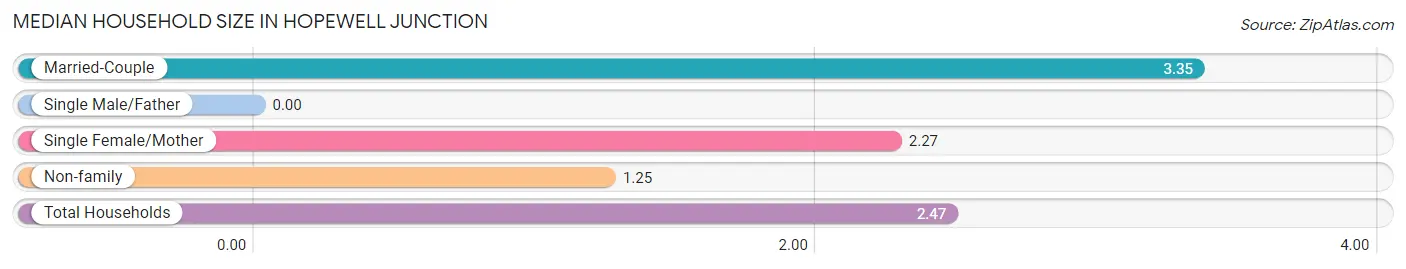
| Household Type | # Households | Household Size |
| Married-Couple | 165 (49.5%) | 3.35 |
| Single Male/Father | 0 (0.0%) | - |
| Single Female/Mother | 59 (17.7%) | 2.27 |
| Non-family | 109 (32.7%) | 1.25 |
| Total Households | 333 (100.0%) | 2.47 |
Household Size by Marriage Status in Hopewell Junction
Out of a total of 333 households in Hopewell Junction, 224 (67.3%) are family households, while 109 (32.7%) are nonfamily households. The most numerous type of family households are 2-person households, comprising 76, and the most common type of nonfamily households are 1-person households, comprising 82.
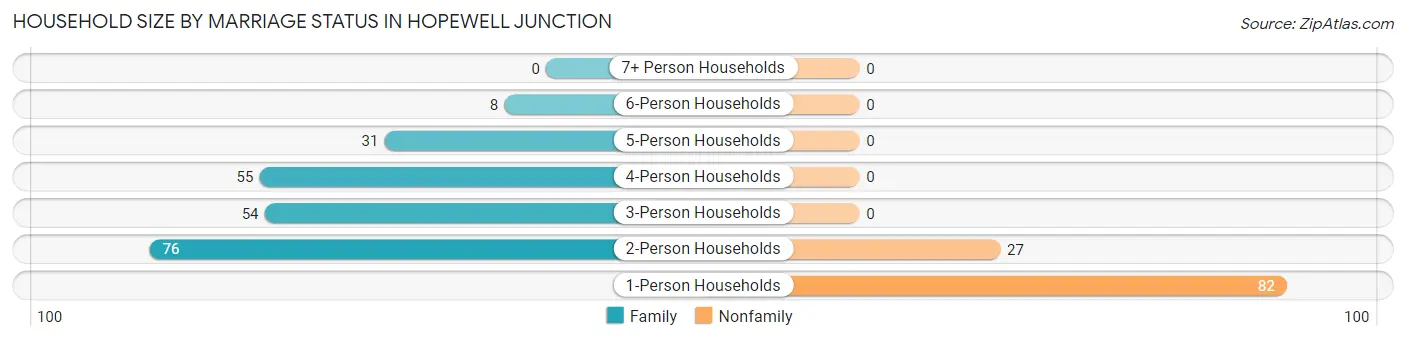
| Household Size | Family Households | Nonfamily Households |
| 1-Person Households | - | 82 (24.6%) |
| 2-Person Households | 76 (22.8%) | 27 (8.1%) |
| 3-Person Households | 54 (16.2%) | 0 (0.0%) |
| 4-Person Households | 55 (16.5%) | 0 (0.0%) |
| 5-Person Households | 31 (9.3%) | 0 (0.0%) |
| 6-Person Households | 8 (2.4%) | 0 (0.0%) |
| 7+ Person Households | 0 (0.0%) | 0 (0.0%) |
| Total | 224 (67.3%) | 109 (32.7%) |
Female Fertility in Hopewell Junction
Fertility by Age in Hopewell Junction
Average fertility rate in Hopewell Junction is 34.0 births per 1,000 women. Women in the age bracket of 20 to 34 years have the highest fertility rate with 104.0 births per 1,000 women. Women in the age bracket of 20 to 34 years acount for 100.0% of all women with births.
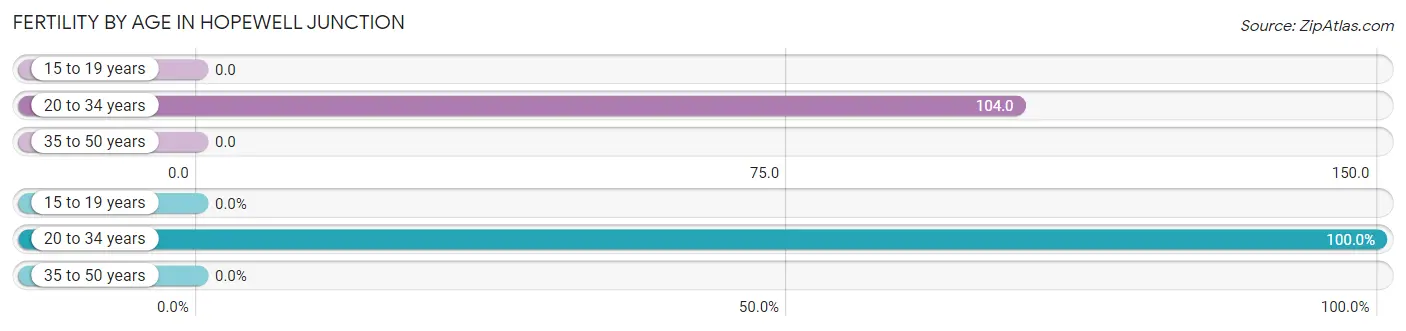
| Age Bracket | Women with Births | Births / 1,000 Women |
| 15 to 19 years | 0 (0.0%) | 0.0 |
| 20 to 34 years | 8 (100.0%) | 104.0 |
| 35 to 50 years | 0 (0.0%) | 0.0 |
| Total | 8 (100.0%) | 34.0 |
Fertility by Age by Marriage Status in Hopewell Junction
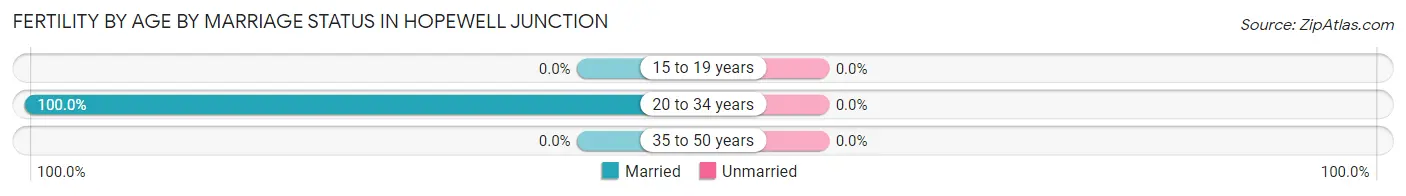
| Age Bracket | Married | Unmarried |
| 15 to 19 years | 0 (0.0%) | 0 (0.0%) |
| 20 to 34 years | 8 (100.0%) | 0 (0.0%) |
| 35 to 50 years | 0 (0.0%) | 0 (0.0%) |
| Total | 8 (100.0%) | 0 (0.0%) |
Fertility by Education in Hopewell Junction
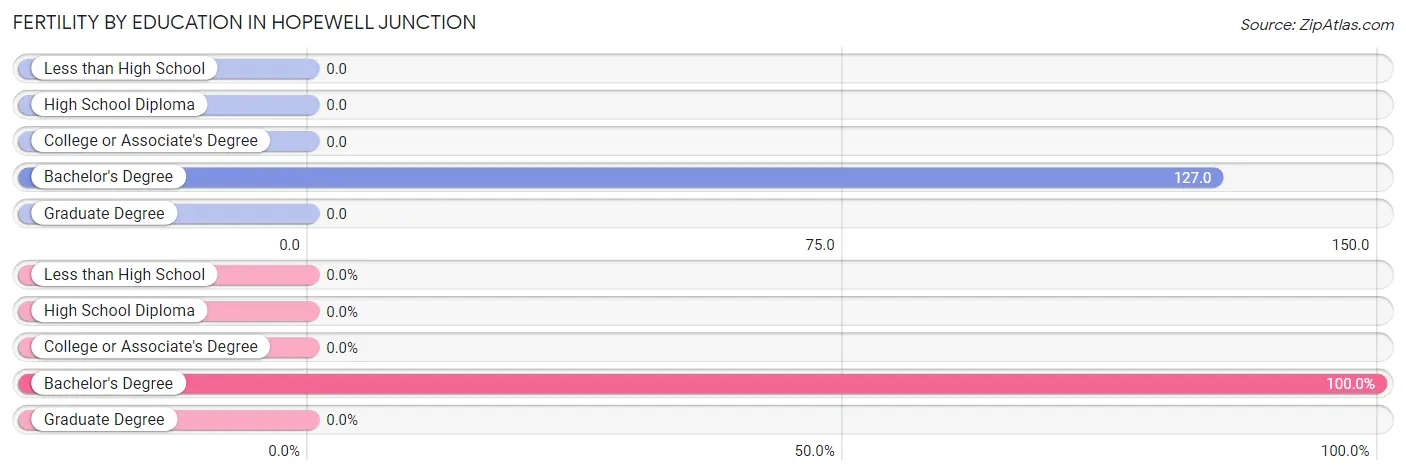
| Educational Attainment | Women with Births | Births / 1,000 Women |
| Less than High School | 0 (0.0%) | 0.0 |
| High School Diploma | 0 (0.0%) | 0.0 |
| College or Associate's Degree | 0 (0.0%) | 0.0 |
| Bachelor's Degree | 8 (100.0%) | 127.0 |
| Graduate Degree | 0 (0.0%) | 0.0 |
| Total | 8 (100.0%) | 34.0 |
Fertility by Education by Marriage Status in Hopewell Junction
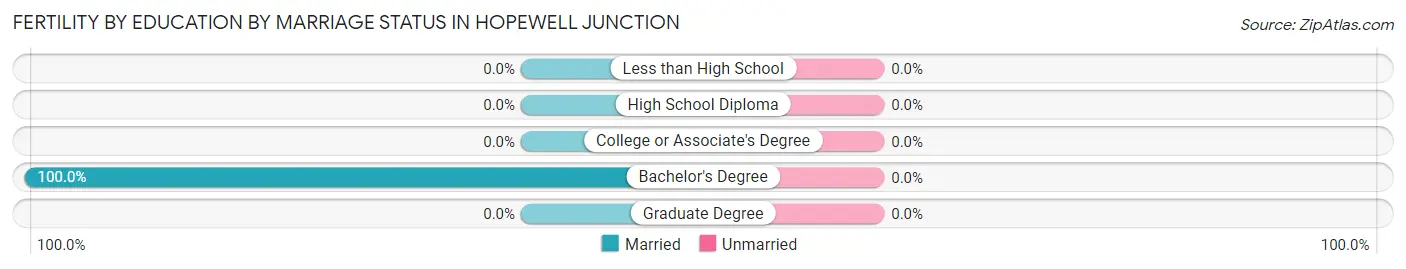
| Educational Attainment | Married | Unmarried |
| Less than High School | 0 (0.0%) | 0 (0.0%) |
| High School Diploma | 0 (0.0%) | 0 (0.0%) |
| College or Associate's Degree | 0 (0.0%) | 0 (0.0%) |
| Bachelor's Degree | 8 (100.0%) | 0 (0.0%) |
| Graduate Degree | 0 (0.0%) | 0 (0.0%) |
| Total | 8 (100.0%) | 0 (0.0%) |
Employment Characteristics in Hopewell Junction
Employment by Class of Employer in Hopewell Junction
Among the 320 employed individuals in Hopewell Junction, private company employees (191 | 59.7%), local government employees (39 | 12.2%), and self-employed (incorporated) (38 | 11.9%) make up the most common classes of employment.
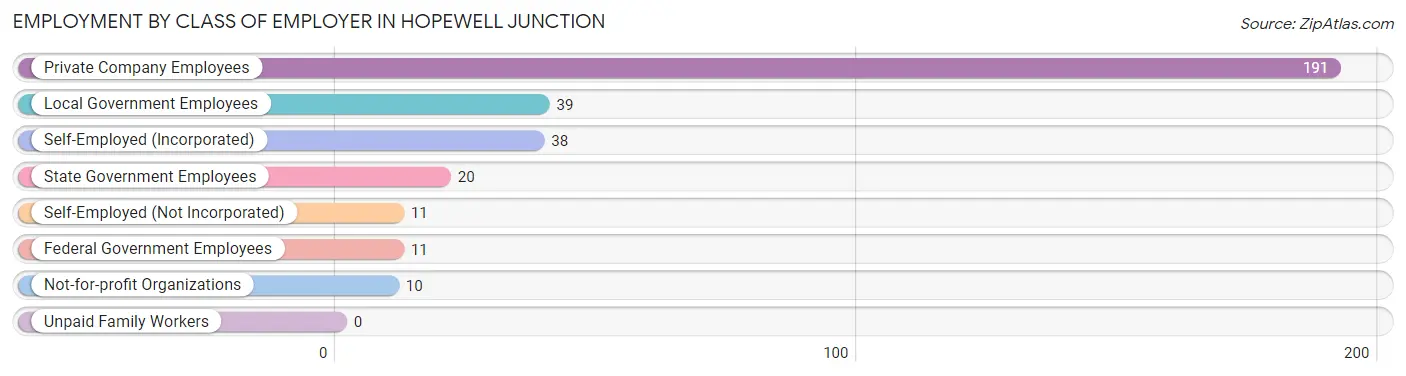
| Employer Class | # Employees | % Employees |
| Private Company Employees | 191 | 59.7% |
| Self-Employed (Incorporated) | 38 | 11.9% |
| Self-Employed (Not Incorporated) | 11 | 3.4% |
| Not-for-profit Organizations | 10 | 3.1% |
| Local Government Employees | 39 | 12.2% |
| State Government Employees | 20 | 6.2% |
| Federal Government Employees | 11 | 3.4% |
| Unpaid Family Workers | 0 | 0.0% |
| Total | 320 | 100.0% |
Employment Status by Age in Hopewell Junction
According to the labor force statistics for Hopewell Junction, out of the total population over 16 years of age (576), 59.0% or 340 individuals are in the labor force, with 0.6% or 2 of them unemployed. The age group with the highest labor force participation rate is 20 to 24 years, with 100.0% or 31 individuals in the labor force. Within the labor force, the 55 to 59 years age range has the highest percentage of unemployed individuals, with 4.3% or 2 of them being unemployed.
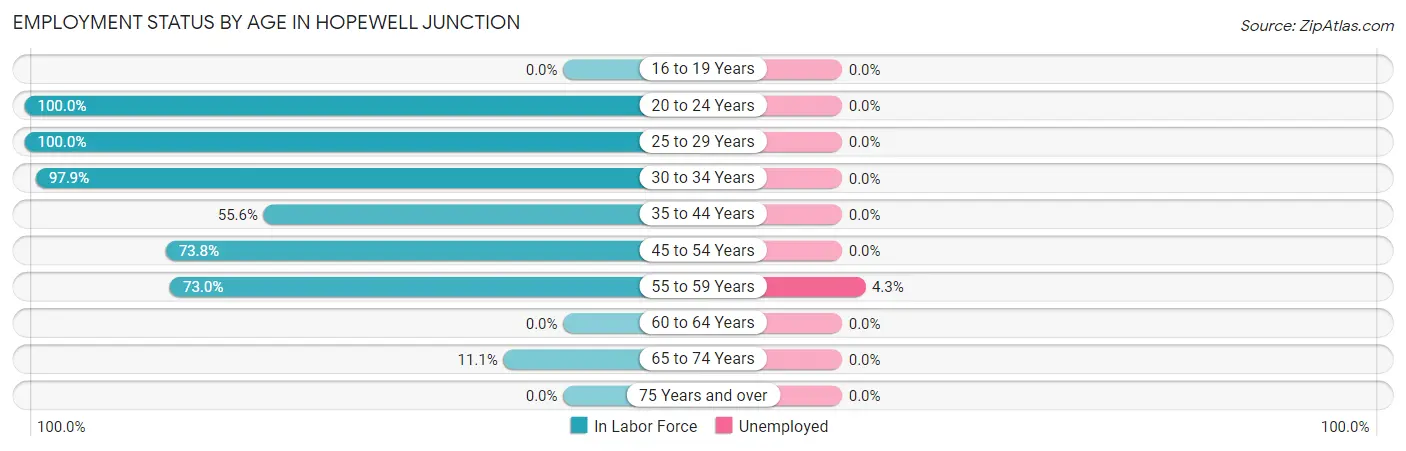
| Age Bracket | In Labor Force | Unemployed |
| 16 to 19 Years | 0 (0.0%) | 0 (0.0%) |
| 20 to 24 Years | 31 (100.0%) | 0 (0.0%) |
| 25 to 29 Years | 60 (100.0%) | 0 (0.0%) |
| 30 to 34 Years | 47 (97.9%) | 0 (0.0%) |
| 35 to 44 Years | 50 (55.6%) | 0 (0.0%) |
| 45 to 54 Years | 96 (73.8%) | 0 (0.0%) |
| 55 to 59 Years | 46 (73.0%) | 2 (4.3%) |
| 60 to 64 Years | 0 (0.0%) | 0 (0.0%) |
| 65 to 74 Years | 10 (11.1%) | 0 (0.0%) |
| 75 Years and over | 0 (0.0%) | 0 (0.0%) |
| Total | 340 (59.0%) | 2 (0.6%) |
Employment Status by Educational Attainment in Hopewell Junction
According to labor force statistics for Hopewell Junction, 74.8% of individuals (299) out of the total population between 25 and 64 years of age (400) are in the labor force, with 0.7% or 2 of them being unemployed. The group with the highest labor force participation rate are those with the educational attainment of bachelor's degree or higher, with 79.8% or 197 individuals in the labor force. Within the labor force, individuals with college / associate degree education have the highest percentage of unemployment, with 2.8% or 2 of them being unemployed.
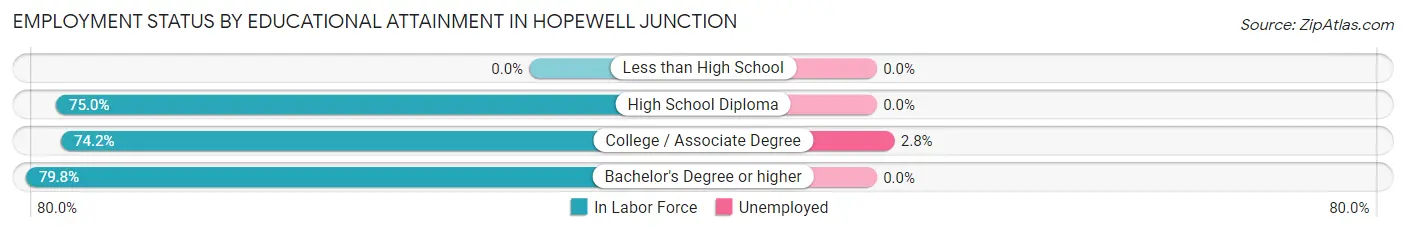
| Educational Attainment | In Labor Force | Unemployed |
| Less than High School | 0 (0.0%) | 0 (0.0%) |
| High School Diploma | 30 (75.0%) | 0 (0.0%) |
| College / Associate Degree | 72 (74.2%) | 3 (2.8%) |
| Bachelor's Degree or higher | 197 (79.8%) | 0 (0.0%) |
| Total | 299 (74.8%) | 3 (0.7%) |
Employment Occupations by Sex in Hopewell Junction
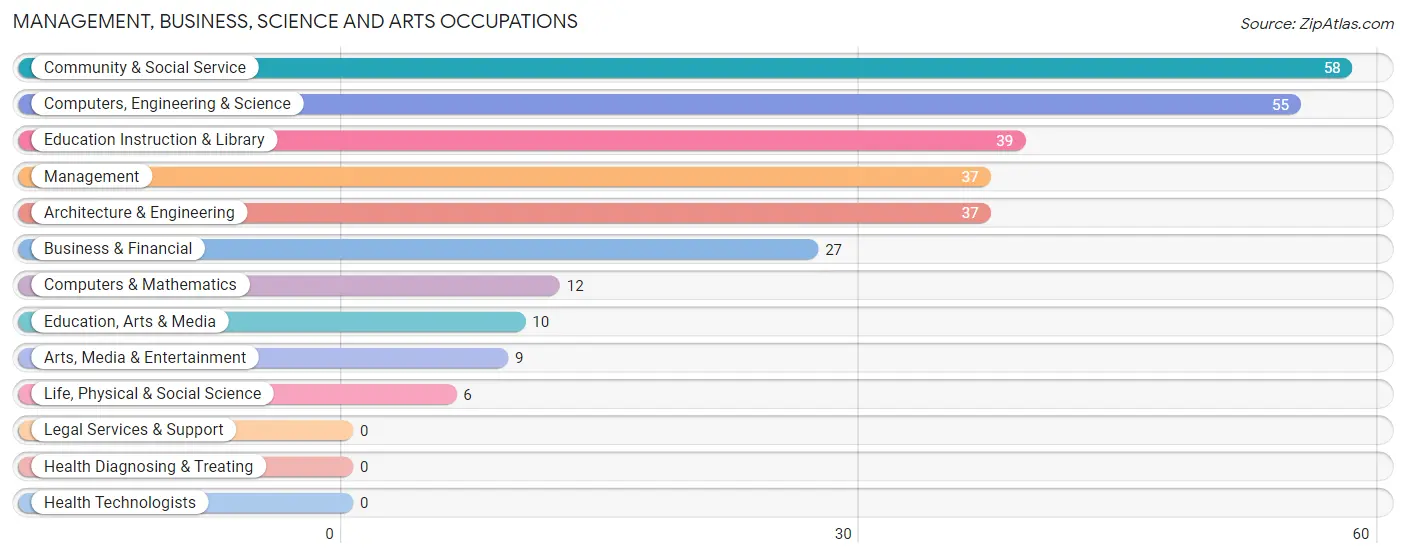
Management, Business, Science and Arts Occupations
The most common Management, Business, Science and Arts occupations in Hopewell Junction are Community & Social Service (58 | 17.2%), Computers, Engineering & Science (55 | 16.3%), Education Instruction & Library (39 | 11.5%), Management (37 | 11.0%), and Architecture & Engineering (37 | 11.0%).
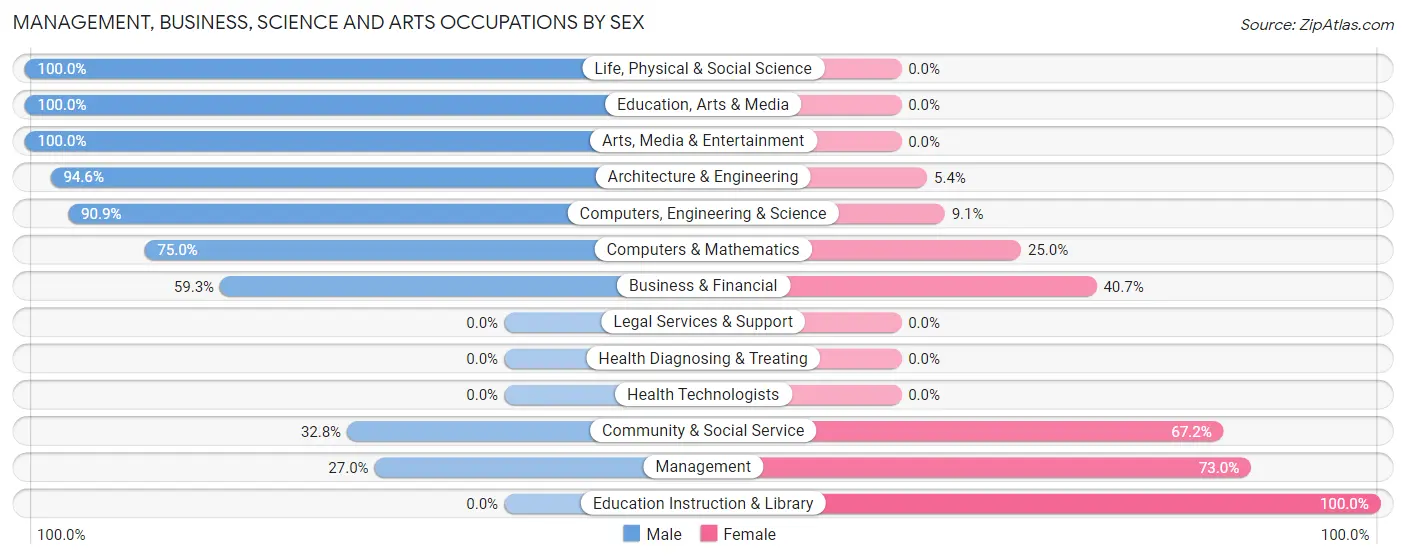
Management, Business, Science and Arts Occupations by Sex
Within the Management, Business, Science and Arts occupations in Hopewell Junction, the most male-oriented occupations are Life, Physical & Social Science (100.0%), Education, Arts & Media (100.0%), and Arts, Media & Entertainment (100.0%), while the most female-oriented occupations are Education Instruction & Library (100.0%), Management (73.0%), and Community & Social Service (67.2%).
| Occupation | Male | Female |
| Management | 10 (27.0%) | 27 (73.0%) |
| Business & Financial | 16 (59.3%) | 11 (40.7%) |
| Computers, Engineering & Science | 50 (90.9%) | 5 (9.1%) |
| Computers & Mathematics | 9 (75.0%) | 3 (25.0%) |
| Architecture & Engineering | 35 (94.6%) | 2 (5.4%) |
| Life, Physical & Social Science | 6 (100.0%) | 0 (0.0%) |
| Community & Social Service | 19 (32.8%) | 39 (67.2%) |
| Education, Arts & Media | 10 (100.0%) | 0 (0.0%) |
| Legal Services & Support | 0 (0.0%) | 0 (0.0%) |
| Education Instruction & Library | 0 (0.0%) | 39 (100.0%) |
| Arts, Media & Entertainment | 9 (100.0%) | 0 (0.0%) |
| Health Diagnosing & Treating | 0 (0.0%) | 0 (0.0%) |
| Health Technologists | 0 (0.0%) | 0 (0.0%) |
| Total (Category) | 95 (53.7%) | 82 (46.3%) |
| Total (Overall) | 183 (54.1%) | 155 (45.9%) |
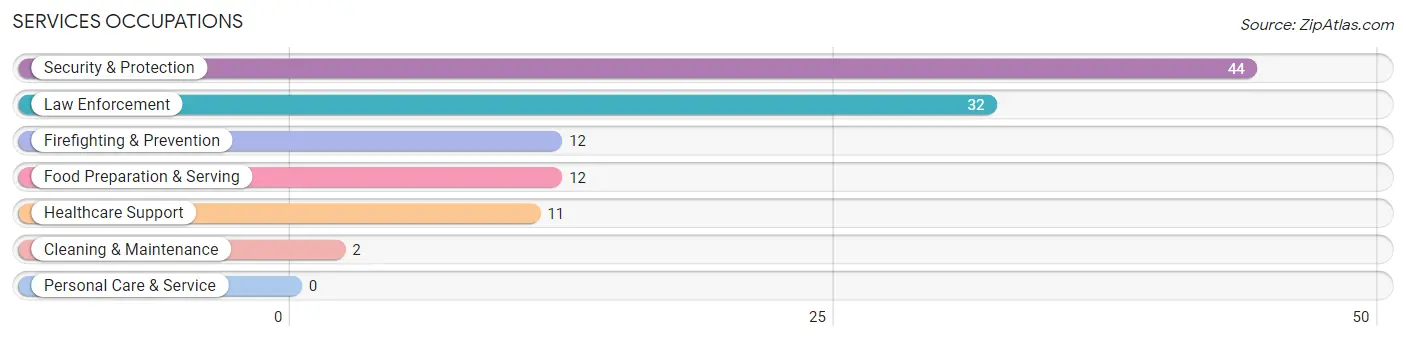
Services Occupations
The most common Services occupations in Hopewell Junction are Security & Protection (44 | 13.0%), Law Enforcement (32 | 9.5%), Firefighting & Prevention (12 | 3.5%), Food Preparation & Serving (12 | 3.5%), and Healthcare Support (11 | 3.3%).
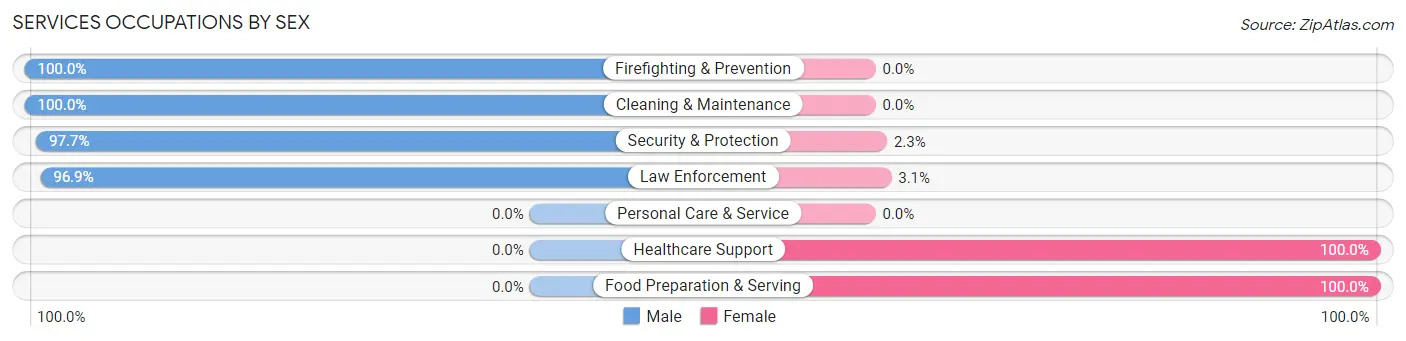
Services Occupations by Sex
Within the Services occupations in Hopewell Junction, the most male-oriented occupations are Firefighting & Prevention (100.0%), Cleaning & Maintenance (100.0%), and Security & Protection (97.7%), while the most female-oriented occupations are Healthcare Support (100.0%), Food Preparation & Serving (100.0%), and Law Enforcement (3.1%).
| Occupation | Male | Female |
| Healthcare Support | 0 (0.0%) | 11 (100.0%) |
| Security & Protection | 43 (97.7%) | 1 (2.3%) |
| Firefighting & Prevention | 12 (100.0%) | 0 (0.0%) |
| Law Enforcement | 31 (96.9%) | 1 (3.1%) |
| Food Preparation & Serving | 0 (0.0%) | 12 (100.0%) |
| Cleaning & Maintenance | 2 (100.0%) | 0 (0.0%) |
| Personal Care & Service | 0 (0.0%) | 0 (0.0%) |
| Total (Category) | 45 (65.2%) | 24 (34.8%) |
| Total (Overall) | 183 (54.1%) | 155 (45.9%) |
Sales and Office Occupations
The most common Sales and Office occupations in Hopewell Junction are Sales & Related (36 | 10.6%), and Office & Administration (31 | 9.2%).

Sales and Office Occupations by Sex
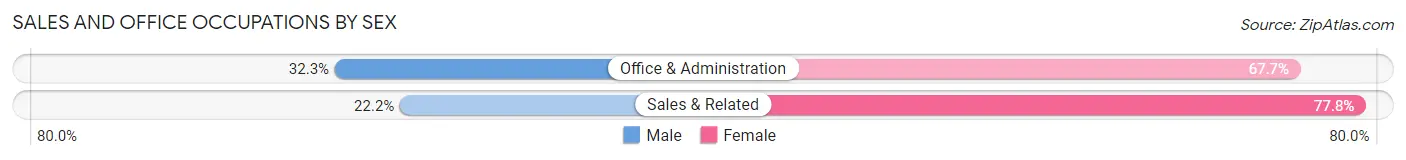
| Occupation | Male | Female |
| Sales & Related | 8 (22.2%) | 28 (77.8%) |
| Office & Administration | 10 (32.3%) | 21 (67.7%) |
| Total (Category) | 18 (26.9%) | 49 (73.1%) |
| Total (Overall) | 183 (54.1%) | 155 (45.9%) |
Natural Resources, Construction and Maintenance Occupations
The most common Natural Resources, Construction and Maintenance occupations in Hopewell Junction are Construction & Extraction (16 | 4.7%), and Farming, Fishing & Forestry (9 | 2.7%).

Natural Resources, Construction and Maintenance Occupations by Sex
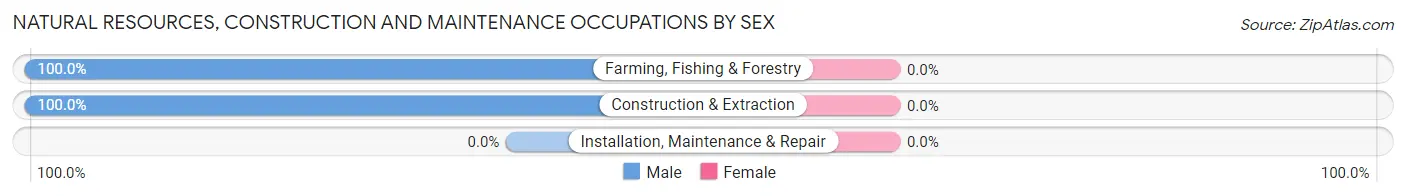
| Occupation | Male | Female |
| Farming, Fishing & Forestry | 9 (100.0%) | 0 (0.0%) |
| Construction & Extraction | 16 (100.0%) | 0 (0.0%) |
| Installation, Maintenance & Repair | 0 (0.0%) | 0 (0.0%) |
| Total (Category) | 25 (100.0%) | 0 (0.0%) |
| Total (Overall) | 183 (54.1%) | 155 (45.9%) |
Production, Transportation and Moving Occupations
Production, Transportation and Moving Occupations by Sex
| Occupation | Male | Female |
| Production | 0 (0.0%) | 0 (0.0%) |
| Transportation | 0 (0.0%) | 0 (0.0%) |
| Material Moving | 0 (0.0%) | 0 (0.0%) |
| Total (Category) | 0 (0.0%) | 0 (0.0%) |
| Total (Overall) | 183 (54.1%) | 155 (45.9%) |
Employment Industries by Sex in Hopewell Junction
Employment Industries in Hopewell Junction
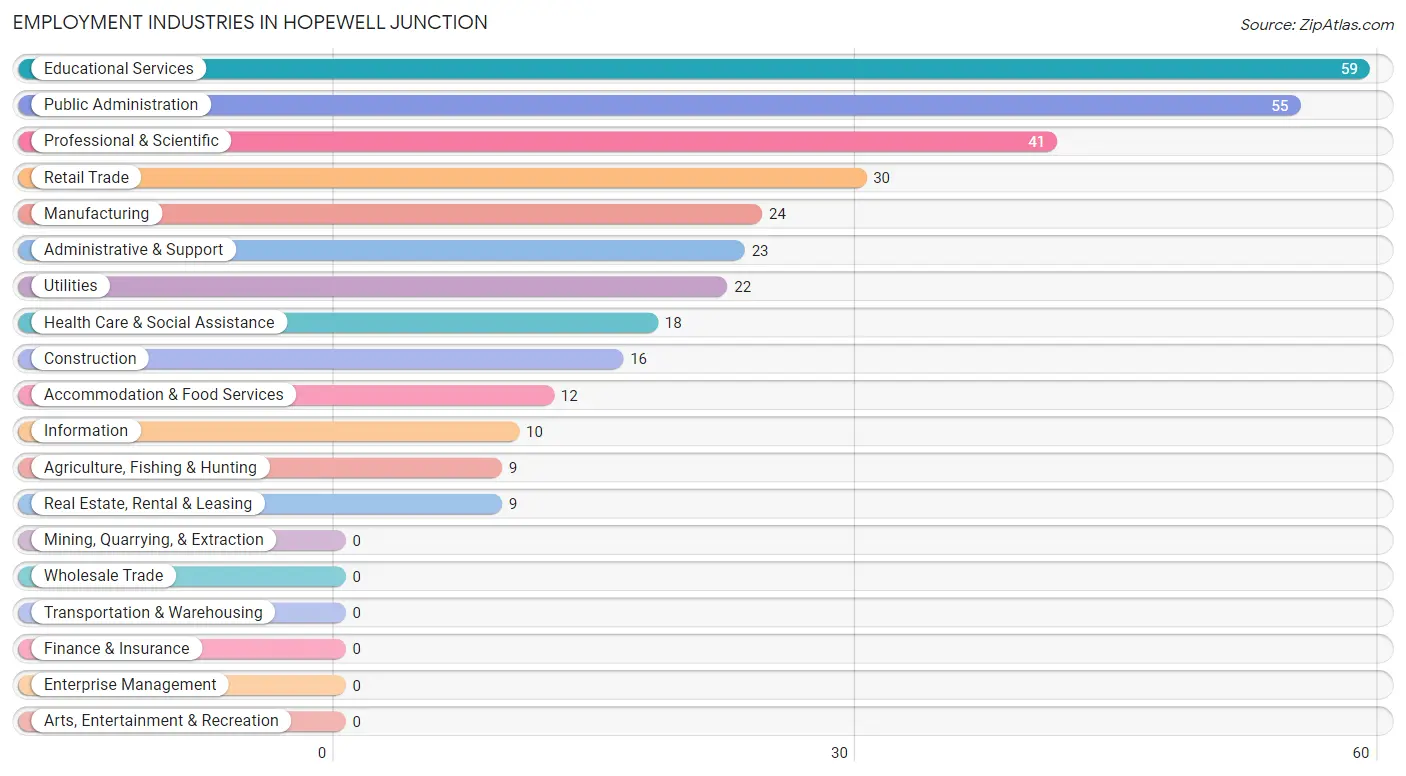
The major employment industries in Hopewell Junction include Educational Services (59 | 17.5%), Public Administration (55 | 16.3%), Professional & Scientific (41 | 12.1%), Retail Trade (30 | 8.9%), and Manufacturing (24 | 7.1%).
Employment Industries by Sex in Hopewell Junction
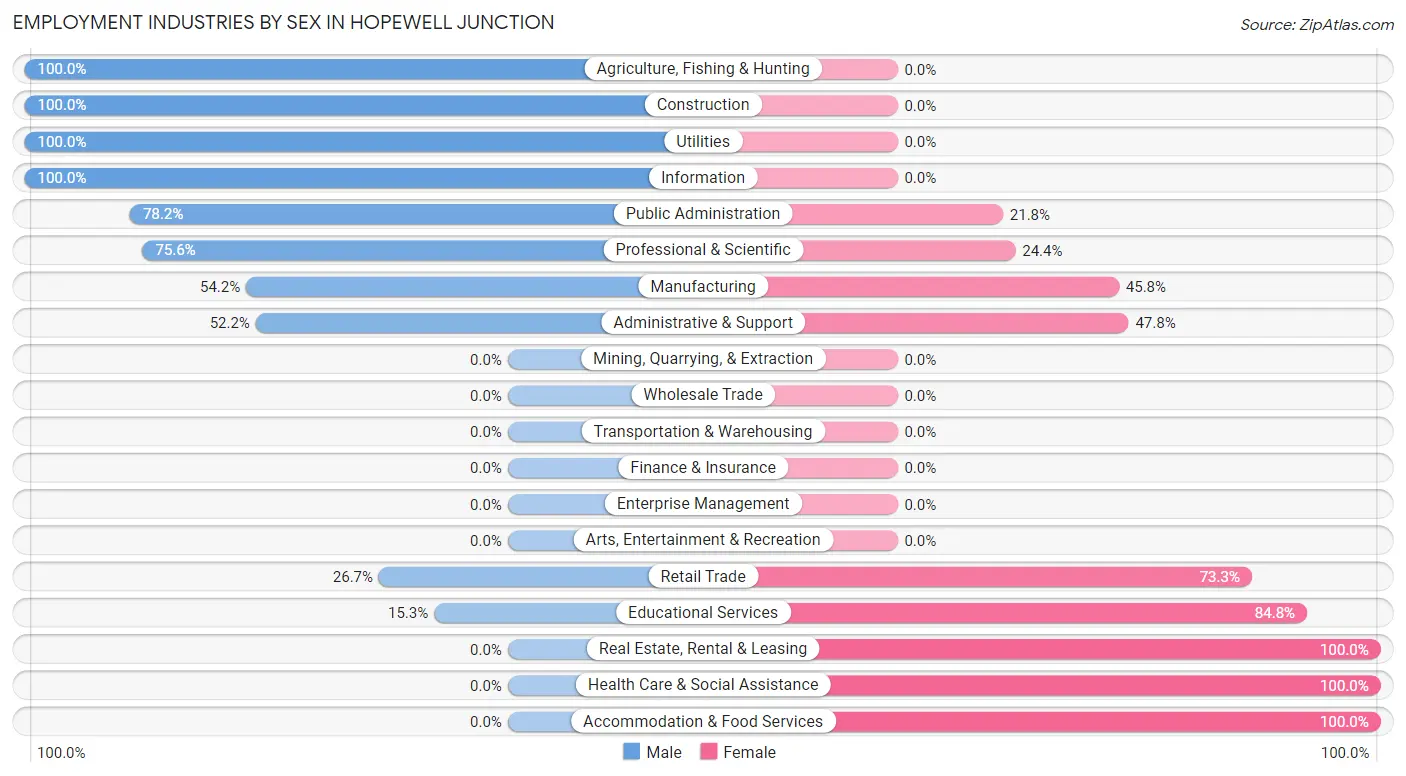
The Hopewell Junction industries that see more men than women are Agriculture, Fishing & Hunting (100.0%), Construction (100.0%), and Utilities (100.0%), whereas the industries that tend to have a higher number of women are Real Estate, Rental & Leasing (100.0%), Health Care & Social Assistance (100.0%), and Accommodation & Food Services (100.0%).
| Industry | Male | Female |
| Agriculture, Fishing & Hunting | 9 (100.0%) | 0 (0.0%) |
| Mining, Quarrying, & Extraction | 0 (0.0%) | 0 (0.0%) |
| Construction | 16 (100.0%) | 0 (0.0%) |
| Manufacturing | 13 (54.2%) | 11 (45.8%) |
| Wholesale Trade | 0 (0.0%) | 0 (0.0%) |
| Retail Trade | 8 (26.7%) | 22 (73.3%) |
| Transportation & Warehousing | 0 (0.0%) | 0 (0.0%) |
| Utilities | 22 (100.0%) | 0 (0.0%) |
| Information | 10 (100.0%) | 0 (0.0%) |
| Finance & Insurance | 0 (0.0%) | 0 (0.0%) |
| Real Estate, Rental & Leasing | 0 (0.0%) | 9 (100.0%) |
| Professional & Scientific | 31 (75.6%) | 10 (24.4%) |
| Enterprise Management | 0 (0.0%) | 0 (0.0%) |
| Administrative & Support | 12 (52.2%) | 11 (47.8%) |
| Educational Services | 9 (15.2%) | 50 (84.8%) |
| Health Care & Social Assistance | 0 (0.0%) | 18 (100.0%) |
| Arts, Entertainment & Recreation | 0 (0.0%) | 0 (0.0%) |
| Accommodation & Food Services | 0 (0.0%) | 12 (100.0%) |
| Public Administration | 43 (78.2%) | 12 (21.8%) |
| Total | 183 (54.1%) | 155 (45.9%) |
Education in Hopewell Junction
School Enrollment in Hopewell Junction
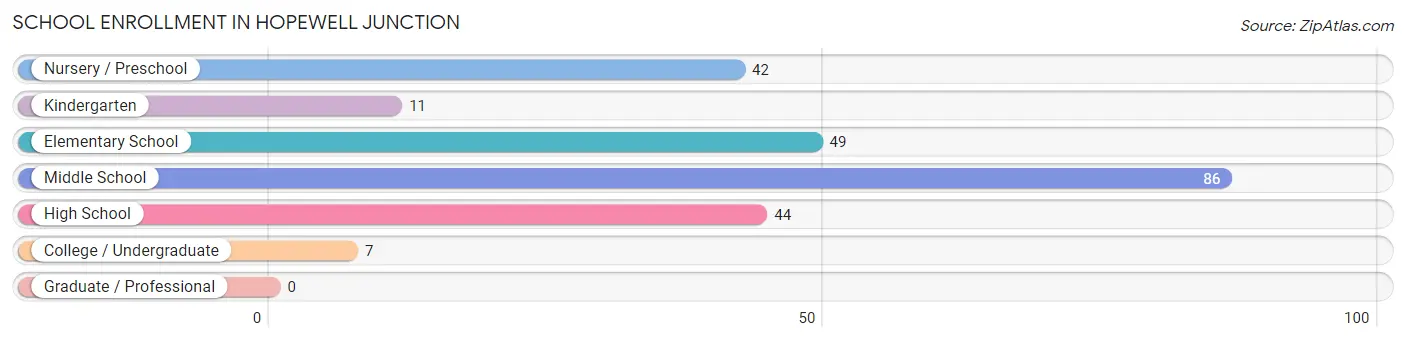
The most common levels of schooling among the 239 students in Hopewell Junction are middle school (86 | 36.0%), elementary school (49 | 20.5%), and high school (44 | 18.4%).
| School Level | # Students | % Students |
| Nursery / Preschool | 42 | 17.6% |
| Kindergarten | 11 | 4.6% |
| Elementary School | 49 | 20.5% |
| Middle School | 86 | 36.0% |
| High School | 44 | 18.4% |
| College / Undergraduate | 7 | 2.9% |
| Graduate / Professional | 0 | 0.0% |
| Total | 239 | 100.0% |
School Enrollment by Age by Funding Source in Hopewell Junction
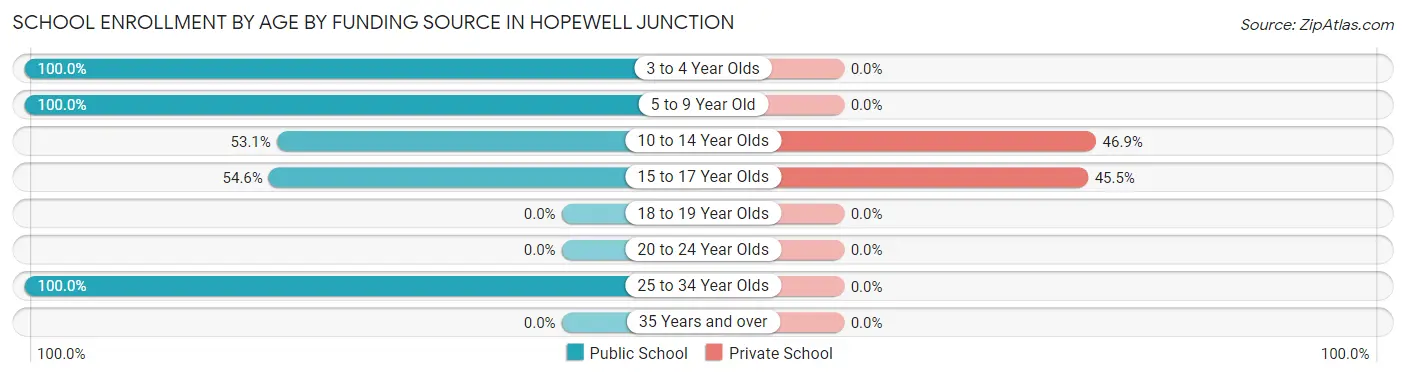
Out of a total of 239 students who are enrolled in schools in Hopewell Junction, 66 (27.6%) attend a private institution, while the remaining 173 (72.4%) are enrolled in public schools. The age group of 10 to 14 year olds has the highest likelihood of being enrolled in private schools, with 46 (46.9% in the age bracket) enrolled. Conversely, the age group of 3 to 4 year olds has the lowest likelihood of being enrolled in a private school, with 42 (100.0% in the age bracket) attending a public institution.
| Age Bracket | Public School | Private School |
| 3 to 4 Year Olds | 42 (100.0%) | 0 (0.0%) |
| 5 to 9 Year Old | 48 (100.0%) | 0 (0.0%) |
| 10 to 14 Year Olds | 52 (53.1%) | 46 (46.9%) |
| 15 to 17 Year Olds | 24 (54.5%) | 20 (45.5%) |
| 18 to 19 Year Olds | 0 (0.0%) | 0 (0.0%) |
| 20 to 24 Year Olds | 0 (0.0%) | 0 (0.0%) |
| 25 to 34 Year Olds | 7 (100.0%) | 0 (0.0%) |
| 35 Years and over | 0 (0.0%) | 0 (0.0%) |
| Total | 173 (72.4%) | 66 (27.6%) |
Educational Attainment by Field of Study in Hopewell Junction
Business (102 | 37.5%), visual & performing arts (46 | 16.9%), engineering (45 | 16.5%), liberal arts & history (25 | 9.2%), and science & technology (21 | 7.7%) are the most common fields of study among 272 individuals in Hopewell Junction who have obtained a bachelor's degree or higher.
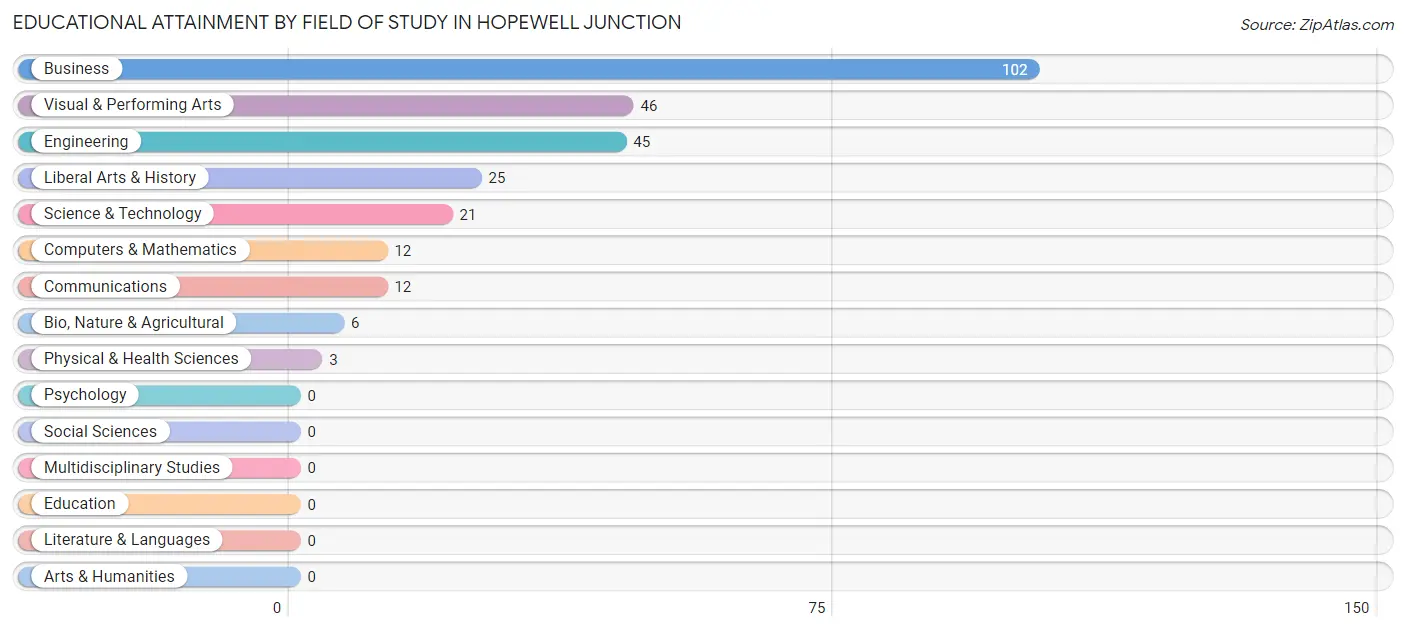
| Field of Study | # Graduates | % Graduates |
| Computers & Mathematics | 12 | 4.4% |
| Bio, Nature & Agricultural | 6 | 2.2% |
| Physical & Health Sciences | 3 | 1.1% |
| Psychology | 0 | 0.0% |
| Social Sciences | 0 | 0.0% |
| Engineering | 45 | 16.5% |
| Multidisciplinary Studies | 0 | 0.0% |
| Science & Technology | 21 | 7.7% |
| Business | 102 | 37.5% |
| Education | 0 | 0.0% |
| Literature & Languages | 0 | 0.0% |
| Liberal Arts & History | 25 | 9.2% |
| Visual & Performing Arts | 46 | 16.9% |
| Communications | 12 | 4.4% |
| Arts & Humanities | 0 | 0.0% |
| Total | 272 | 100.0% |
Transportation & Commute in Hopewell Junction
Vehicle Availability by Sex in Hopewell Junction
The most prevalent vehicle ownership categories in Hopewell Junction are males with 2 vehicles (67, accounting for 36.6%) and females with 2 vehicles (53, making up 48.9%).
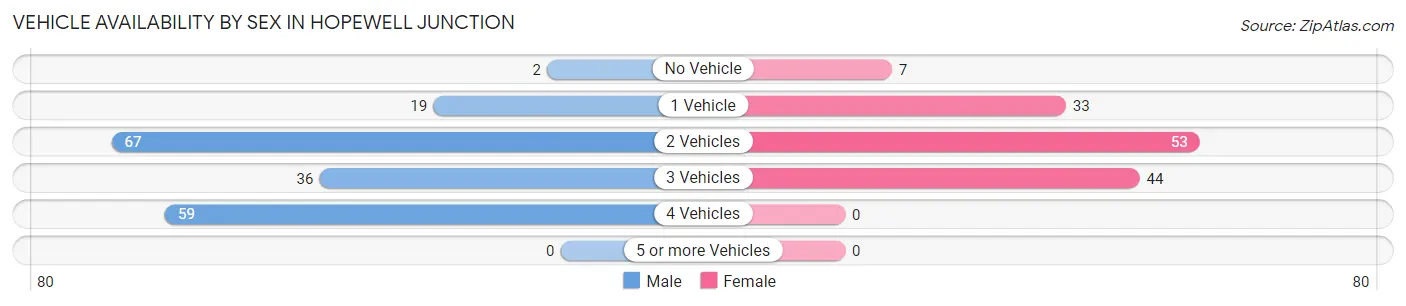
| Vehicles Available | Male | Female |
| No Vehicle | 2 (1.1%) | 7 (5.1%) |
| 1 Vehicle | 19 (10.4%) | 33 (24.1%) |
| 2 Vehicles | 67 (36.6%) | 53 (38.7%) |
| 3 Vehicles | 36 (19.7%) | 44 (32.1%) |
| 4 Vehicles | 59 (32.2%) | 0 (0.0%) |
| 5 or more Vehicles | 0 (0.0%) | 0 (0.0%) |
| Total | 183 (100.0%) | 137 (100.0%) |
Commute Time in Hopewell Junction
The most frequently occuring commute durations in Hopewell Junction are 25 to 29 minutes (51 commuters, 21.3%), 30 to 34 minutes (42 commuters, 17.6%), and 20 to 24 minutes (35 commuters, 14.6%).
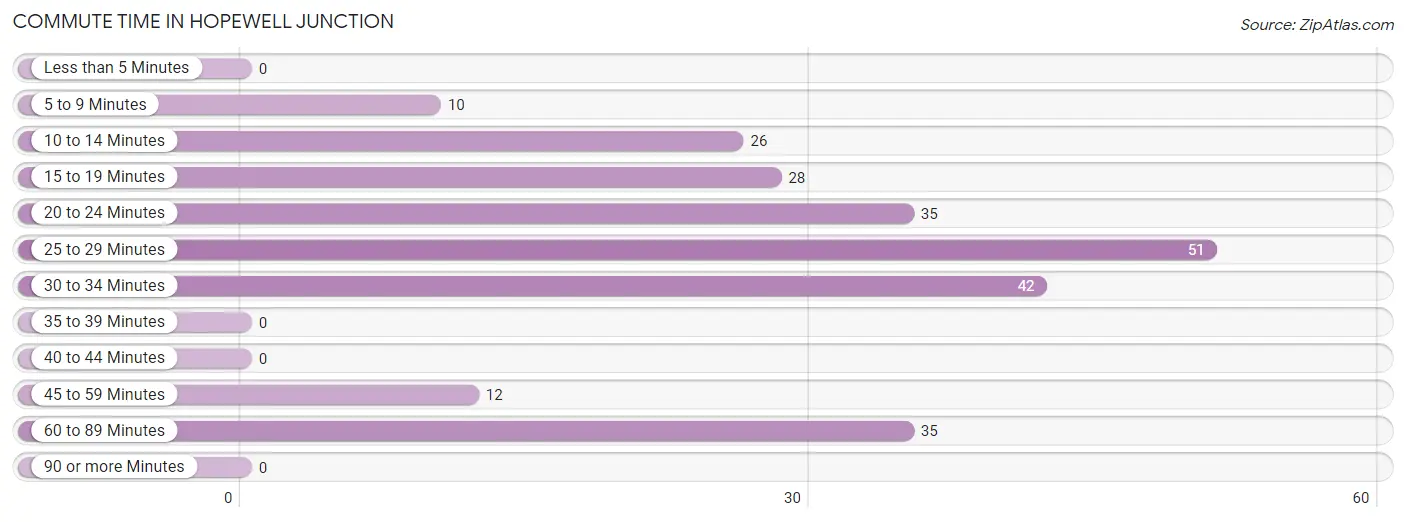
| Commute Time | # Commuters | % Commuters |
| Less than 5 Minutes | 0 | 0.0% |
| 5 to 9 Minutes | 10 | 4.2% |
| 10 to 14 Minutes | 26 | 10.9% |
| 15 to 19 Minutes | 28 | 11.7% |
| 20 to 24 Minutes | 35 | 14.6% |
| 25 to 29 Minutes | 51 | 21.3% |
| 30 to 34 Minutes | 42 | 17.6% |
| 35 to 39 Minutes | 0 | 0.0% |
| 40 to 44 Minutes | 0 | 0.0% |
| 45 to 59 Minutes | 12 | 5.0% |
| 60 to 89 Minutes | 35 | 14.6% |
| 90 or more Minutes | 0 | 0.0% |
Commute Time by Sex in Hopewell Junction
The most common commute times in Hopewell Junction are 30 to 34 minutes (34 commuters, 27.0%) for males and 25 to 29 minutes (34 commuters, 30.1%) for females.
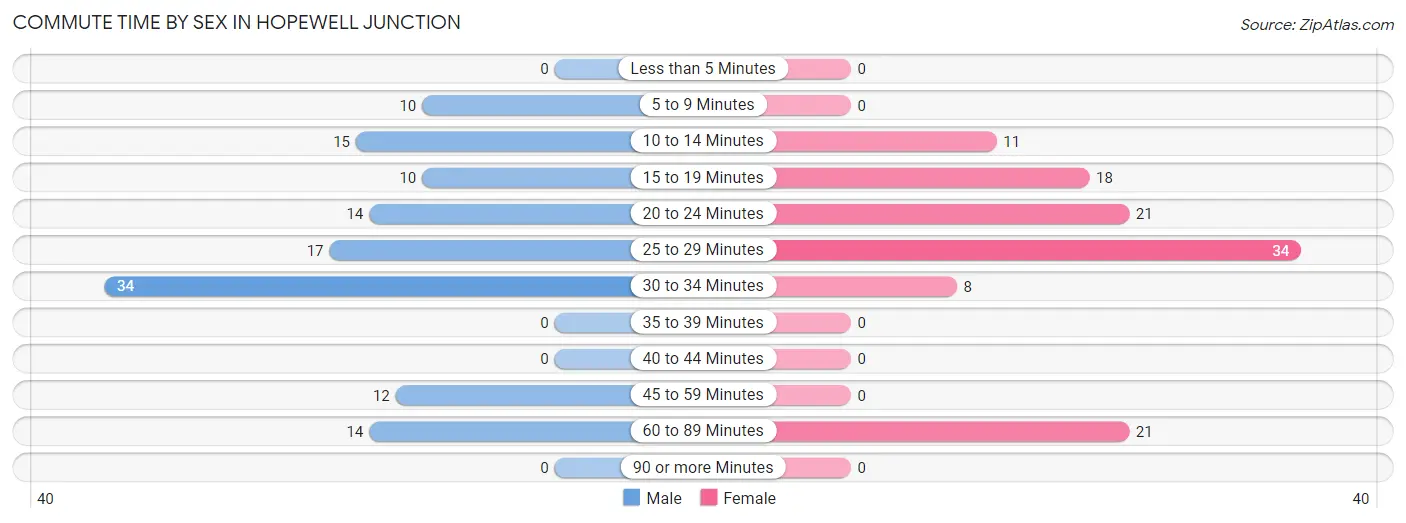
| Commute Time | Male | Female |
| Less than 5 Minutes | 0 (0.0%) | 0 (0.0%) |
| 5 to 9 Minutes | 10 (7.9%) | 0 (0.0%) |
| 10 to 14 Minutes | 15 (11.9%) | 11 (9.7%) |
| 15 to 19 Minutes | 10 (7.9%) | 18 (15.9%) |
| 20 to 24 Minutes | 14 (11.1%) | 21 (18.6%) |
| 25 to 29 Minutes | 17 (13.5%) | 34 (30.1%) |
| 30 to 34 Minutes | 34 (27.0%) | 8 (7.1%) |
| 35 to 39 Minutes | 0 (0.0%) | 0 (0.0%) |
| 40 to 44 Minutes | 0 (0.0%) | 0 (0.0%) |
| 45 to 59 Minutes | 12 (9.5%) | 0 (0.0%) |
| 60 to 89 Minutes | 14 (11.1%) | 21 (18.6%) |
| 90 or more Minutes | 0 (0.0%) | 0 (0.0%) |
Time of Departure to Work by Sex in Hopewell Junction
The most frequent times of departure to work in Hopewell Junction are 8:00 AM to 8:29 AM (43, 34.1%) for males and 10:00 AM to 10:59 AM (34, 30.1%) for females.
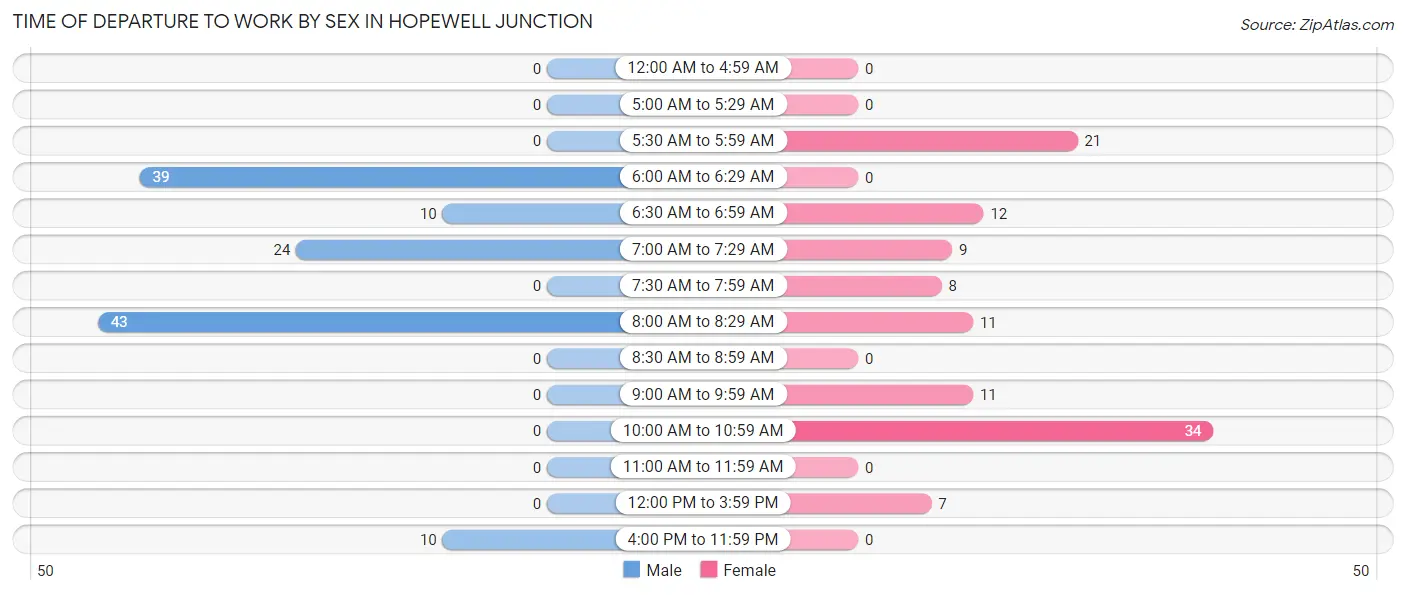
| Time of Departure | Male | Female |
| 12:00 AM to 4:59 AM | 0 (0.0%) | 0 (0.0%) |
| 5:00 AM to 5:29 AM | 0 (0.0%) | 0 (0.0%) |
| 5:30 AM to 5:59 AM | 0 (0.0%) | 21 (18.6%) |
| 6:00 AM to 6:29 AM | 39 (30.9%) | 0 (0.0%) |
| 6:30 AM to 6:59 AM | 10 (7.9%) | 12 (10.6%) |
| 7:00 AM to 7:29 AM | 24 (19.1%) | 9 (8.0%) |
| 7:30 AM to 7:59 AM | 0 (0.0%) | 8 (7.1%) |
| 8:00 AM to 8:29 AM | 43 (34.1%) | 11 (9.7%) |
| 8:30 AM to 8:59 AM | 0 (0.0%) | 0 (0.0%) |
| 9:00 AM to 9:59 AM | 0 (0.0%) | 11 (9.7%) |
| 10:00 AM to 10:59 AM | 0 (0.0%) | 34 (30.1%) |
| 11:00 AM to 11:59 AM | 0 (0.0%) | 0 (0.0%) |
| 12:00 PM to 3:59 PM | 0 (0.0%) | 7 (6.2%) |
| 4:00 PM to 11:59 PM | 10 (7.9%) | 0 (0.0%) |
| Total | 126 (100.0%) | 113 (100.0%) |
Housing Occupancy in Hopewell Junction
Occupancy by Ownership in Hopewell Junction
Of the total 333 dwellings in Hopewell Junction, owner-occupied units account for 248 (74.5%), while renter-occupied units make up 85 (25.5%).
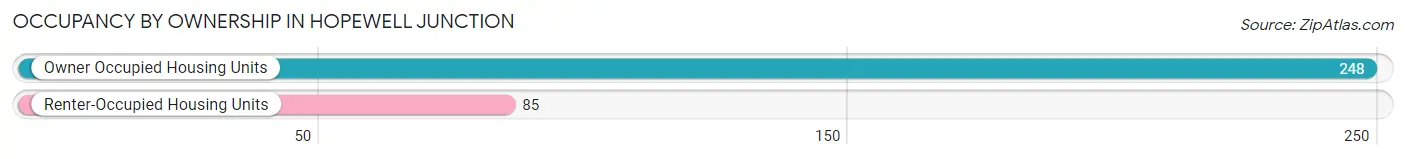
| Occupancy | # Housing Units | % Housing Units |
| Owner Occupied Housing Units | 248 | 74.5% |
| Renter-Occupied Housing Units | 85 | 25.5% |
| Total Occupied Housing Units | 333 | 100.0% |
Occupancy by Household Size in Hopewell Junction
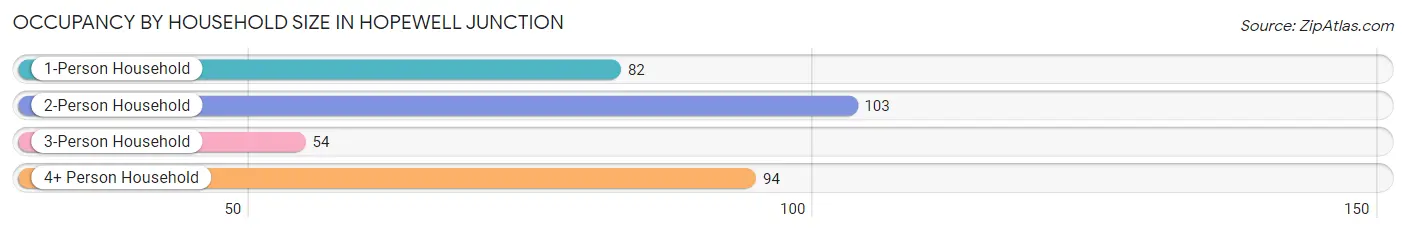
| Household Size | # Housing Units | % Housing Units |
| 1-Person Household | 82 | 24.6% |
| 2-Person Household | 103 | 30.9% |
| 3-Person Household | 54 | 16.2% |
| 4+ Person Household | 94 | 28.2% |
| Total Housing Units | 333 | 100.0% |
Occupancy by Ownership by Household Size in Hopewell Junction
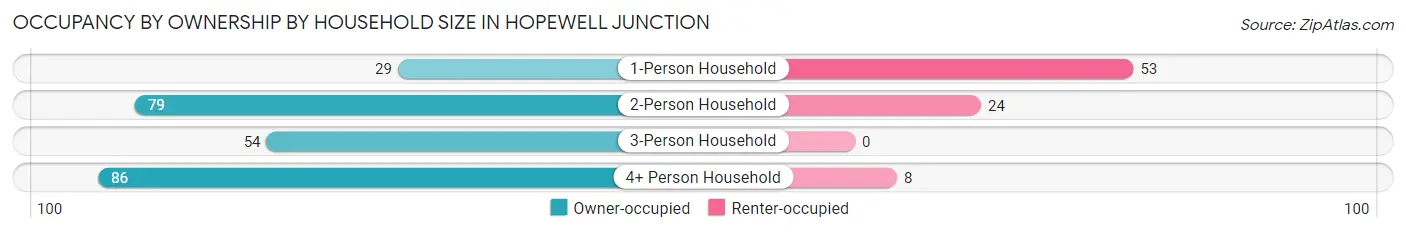
| Household Size | Owner-occupied | Renter-occupied |
| 1-Person Household | 29 (35.4%) | 53 (64.6%) |
| 2-Person Household | 79 (76.7%) | 24 (23.3%) |
| 3-Person Household | 54 (100.0%) | 0 (0.0%) |
| 4+ Person Household | 86 (91.5%) | 8 (8.5%) |
| Total Housing Units | 248 (74.5%) | 85 (25.5%) |
Occupancy by Educational Attainment in Hopewell Junction
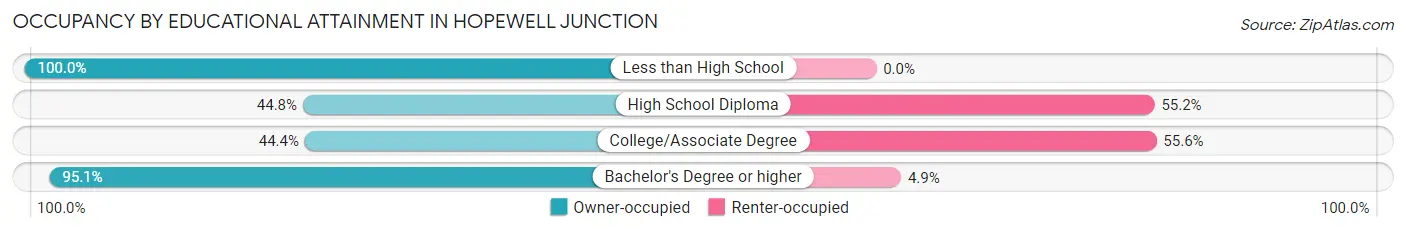
| Household Size | Owner-occupied | Renter-occupied |
| Less than High School | 13 (100.0%) | 0 (0.0%) |
| High School Diploma | 13 (44.8%) | 16 (55.2%) |
| College/Associate Degree | 48 (44.4%) | 60 (55.6%) |
| Bachelor's Degree or higher | 174 (95.1%) | 9 (4.9%) |
Occupancy by Age of Householder in Hopewell Junction
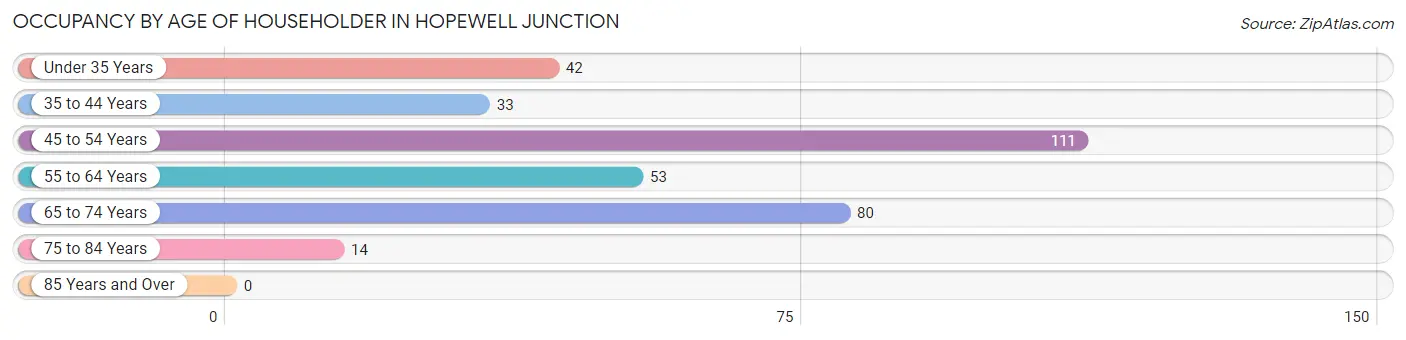
| Age Bracket | # Households | % Households |
| Under 35 Years | 42 | 12.6% |
| 35 to 44 Years | 33 | 9.9% |
| 45 to 54 Years | 111 | 33.3% |
| 55 to 64 Years | 53 | 15.9% |
| 65 to 74 Years | 80 | 24.0% |
| 75 to 84 Years | 14 | 4.2% |
| 85 Years and Over | 0 | 0.0% |
| Total | 333 | 100.0% |
Housing Finances in Hopewell Junction
Median Income by Occupancy in Hopewell Junction
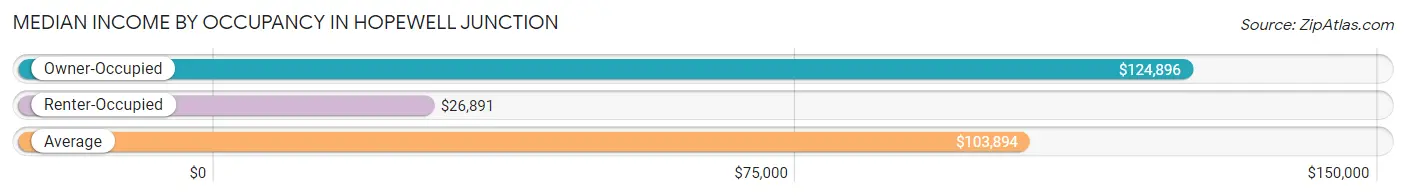
| Occupancy Type | # Households | Median Income |
| Owner-Occupied | 248 (74.5%) | $124,896 |
| Renter-Occupied | 85 (25.5%) | $26,891 |
| Average | 333 (100.0%) | $103,894 |
Occupancy by Householder Income Bracket in Hopewell Junction
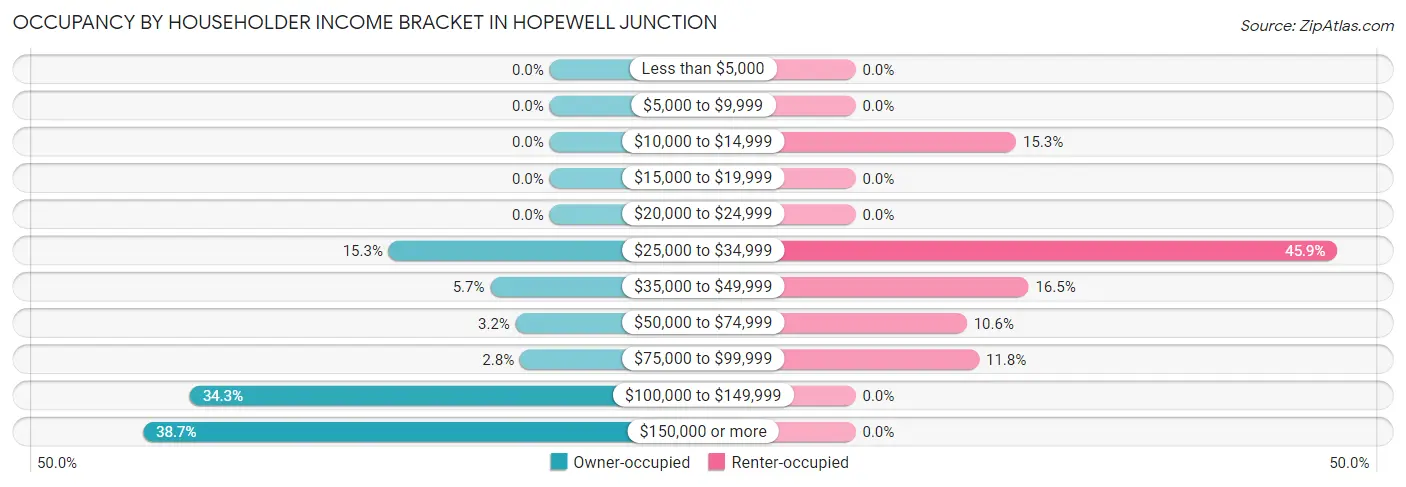
| Income Bracket | Owner-occupied | Renter-occupied |
| Less than $5,000 | 0 (0.0%) | 0 (0.0%) |
| $5,000 to $9,999 | 0 (0.0%) | 0 (0.0%) |
| $10,000 to $14,999 | 0 (0.0%) | 13 (15.3%) |
| $15,000 to $19,999 | 0 (0.0%) | 0 (0.0%) |
| $20,000 to $24,999 | 0 (0.0%) | 0 (0.0%) |
| $25,000 to $34,999 | 38 (15.3%) | 39 (45.9%) |
| $35,000 to $49,999 | 14 (5.7%) | 14 (16.5%) |
| $50,000 to $74,999 | 8 (3.2%) | 9 (10.6%) |
| $75,000 to $99,999 | 7 (2.8%) | 10 (11.8%) |
| $100,000 to $149,999 | 85 (34.3%) | 0 (0.0%) |
| $150,000 or more | 96 (38.7%) | 0 (0.0%) |
| Total | 248 (100.0%) | 85 (100.0%) |
Monthly Housing Cost Tiers in Hopewell Junction
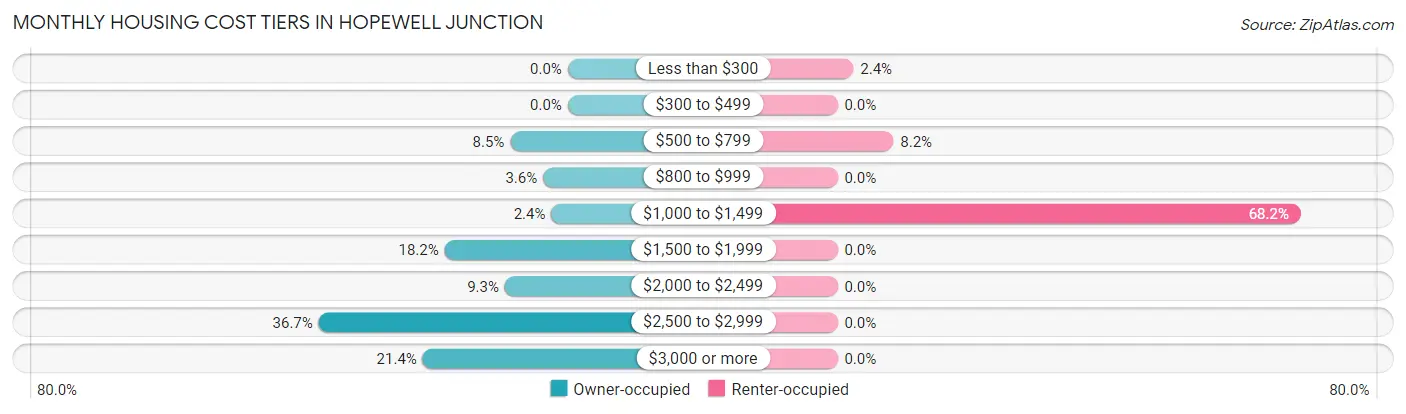
| Monthly Cost | Owner-occupied | Renter-occupied |
| Less than $300 | 0 (0.0%) | 2 (2.4%) |
| $300 to $499 | 0 (0.0%) | 0 (0.0%) |
| $500 to $799 | 21 (8.5%) | 7 (8.2%) |
| $800 to $999 | 9 (3.6%) | 0 (0.0%) |
| $1,000 to $1,499 | 6 (2.4%) | 58 (68.2%) |
| $1,500 to $1,999 | 45 (18.1%) | 0 (0.0%) |
| $2,000 to $2,499 | 23 (9.3%) | 0 (0.0%) |
| $2,500 to $2,999 | 91 (36.7%) | 0 (0.0%) |
| $3,000 or more | 53 (21.4%) | 0 (0.0%) |
| Total | 248 (100.0%) | 85 (100.0%) |
Physical Housing Characteristics in Hopewell Junction
Housing Structures in Hopewell Junction
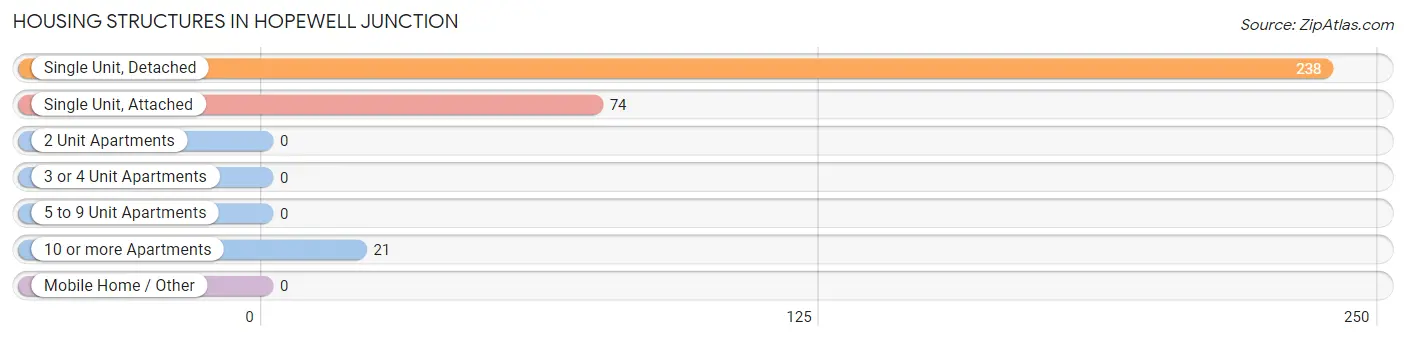
| Structure Type | # Housing Units | % Housing Units |
| Single Unit, Detached | 238 | 71.5% |
| Single Unit, Attached | 74 | 22.2% |
| 2 Unit Apartments | 0 | 0.0% |
| 3 or 4 Unit Apartments | 0 | 0.0% |
| 5 to 9 Unit Apartments | 0 | 0.0% |
| 10 or more Apartments | 21 | 6.3% |
| Mobile Home / Other | 0 | 0.0% |
| Total | 333 | 100.0% |
Housing Structures by Occupancy in Hopewell Junction
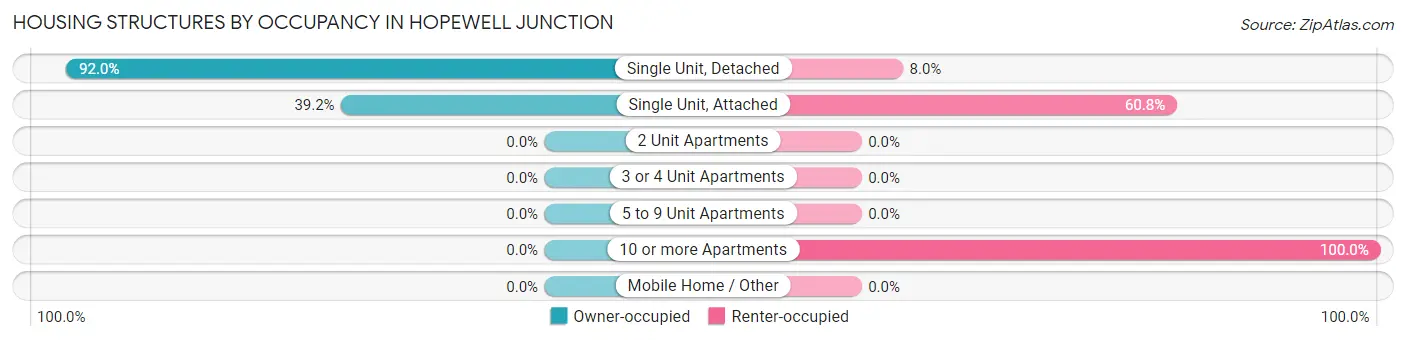
| Structure Type | Owner-occupied | Renter-occupied |
| Single Unit, Detached | 219 (92.0%) | 19 (8.0%) |
| Single Unit, Attached | 29 (39.2%) | 45 (60.8%) |
| 2 Unit Apartments | 0 (0.0%) | 0 (0.0%) |
| 3 or 4 Unit Apartments | 0 (0.0%) | 0 (0.0%) |
| 5 to 9 Unit Apartments | 0 (0.0%) | 0 (0.0%) |
| 10 or more Apartments | 0 (0.0%) | 21 (100.0%) |
| Mobile Home / Other | 0 (0.0%) | 0 (0.0%) |
| Total | 248 (74.5%) | 85 (25.5%) |
Housing Structures by Number of Rooms in Hopewell Junction
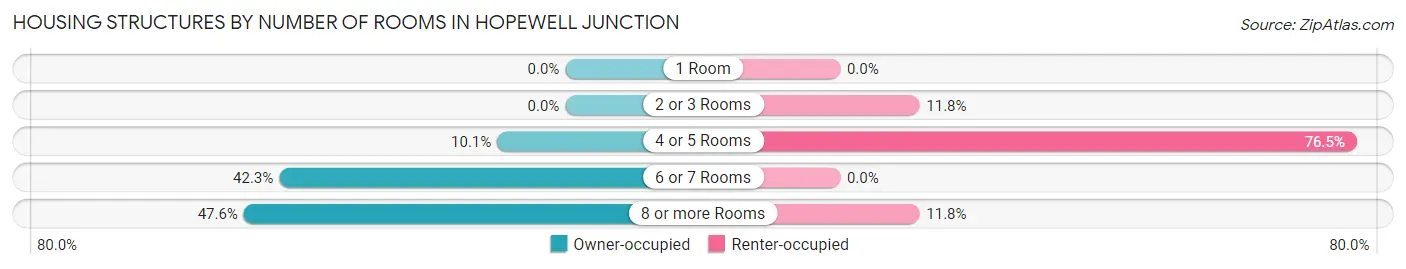
| Number of Rooms | Owner-occupied | Renter-occupied |
| 1 Room | 0 (0.0%) | 0 (0.0%) |
| 2 or 3 Rooms | 0 (0.0%) | 10 (11.8%) |
| 4 or 5 Rooms | 25 (10.1%) | 65 (76.5%) |
| 6 or 7 Rooms | 105 (42.3%) | 0 (0.0%) |
| 8 or more Rooms | 118 (47.6%) | 10 (11.8%) |
| Total | 248 (100.0%) | 85 (100.0%) |
Housing Structure by Heating Type in Hopewell Junction
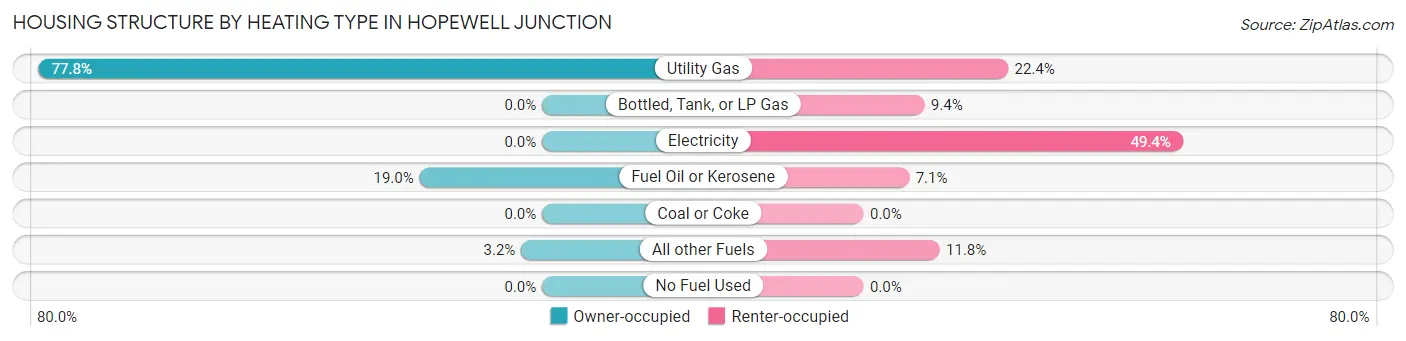
| Heating Type | Owner-occupied | Renter-occupied |
| Utility Gas | 193 (77.8%) | 19 (22.4%) |
| Bottled, Tank, or LP Gas | 0 (0.0%) | 8 (9.4%) |
| Electricity | 0 (0.0%) | 42 (49.4%) |
| Fuel Oil or Kerosene | 47 (19.0%) | 6 (7.1%) |
| Coal or Coke | 0 (0.0%) | 0 (0.0%) |
| All other Fuels | 8 (3.2%) | 10 (11.8%) |
| No Fuel Used | 0 (0.0%) | 0 (0.0%) |
| Total | 248 (100.0%) | 85 (100.0%) |
Household Vehicle Usage in Hopewell Junction
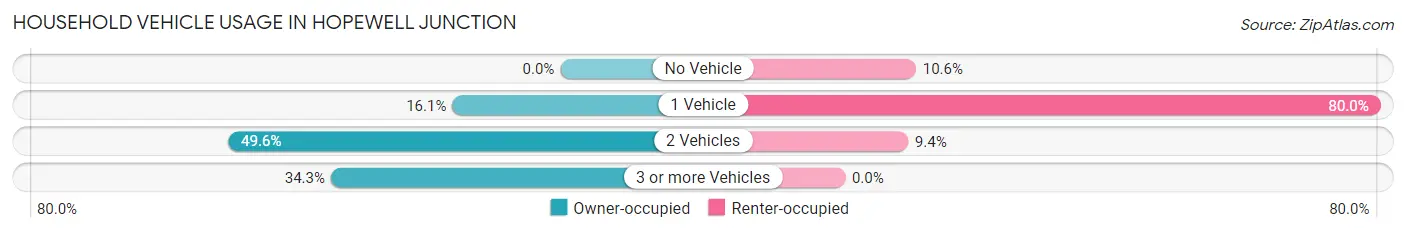
| Vehicles per Household | Owner-occupied | Renter-occupied |
| No Vehicle | 0 (0.0%) | 9 (10.6%) |
| 1 Vehicle | 40 (16.1%) | 68 (80.0%) |
| 2 Vehicles | 123 (49.6%) | 8 (9.4%) |
| 3 or more Vehicles | 85 (34.3%) | 0 (0.0%) |
| Total | 248 (100.0%) | 85 (100.0%) |
Real Estate & Mortgages in Hopewell Junction
Real Estate and Mortgage Overview in Hopewell Junction
| Characteristic | Without Mortgage | With Mortgage |
| Housing Units | 67 | 181 |
| Median Property Value | $367,600 | $626,700 |
| Median Household Income | $122,656 | $85 |
| Monthly Housing Costs | $1,501 | $53 |
| Real Estate Taxes | $10,001 | $0 |
Property Value by Mortgage Status in Hopewell Junction
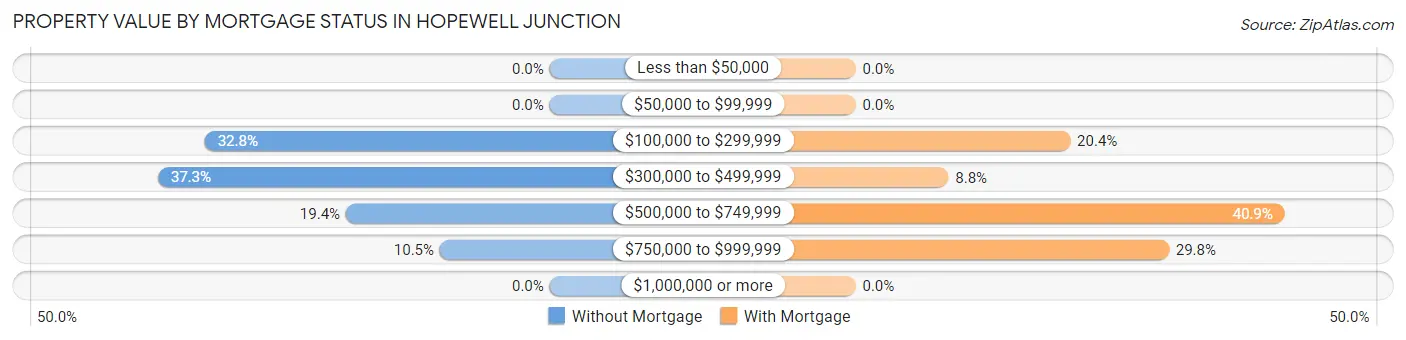
| Property Value | Without Mortgage | With Mortgage |
| Less than $50,000 | 0 (0.0%) | 0 (0.0%) |
| $50,000 to $99,999 | 0 (0.0%) | 0 (0.0%) |
| $100,000 to $299,999 | 22 (32.8%) | 37 (20.4%) |
| $300,000 to $499,999 | 25 (37.3%) | 16 (8.8%) |
| $500,000 to $749,999 | 13 (19.4%) | 74 (40.9%) |
| $750,000 to $999,999 | 7 (10.4%) | 54 (29.8%) |
| $1,000,000 or more | 0 (0.0%) | 0 (0.0%) |
| Total | 67 (100.0%) | 181 (100.0%) |
Household Income by Mortgage Status in Hopewell Junction
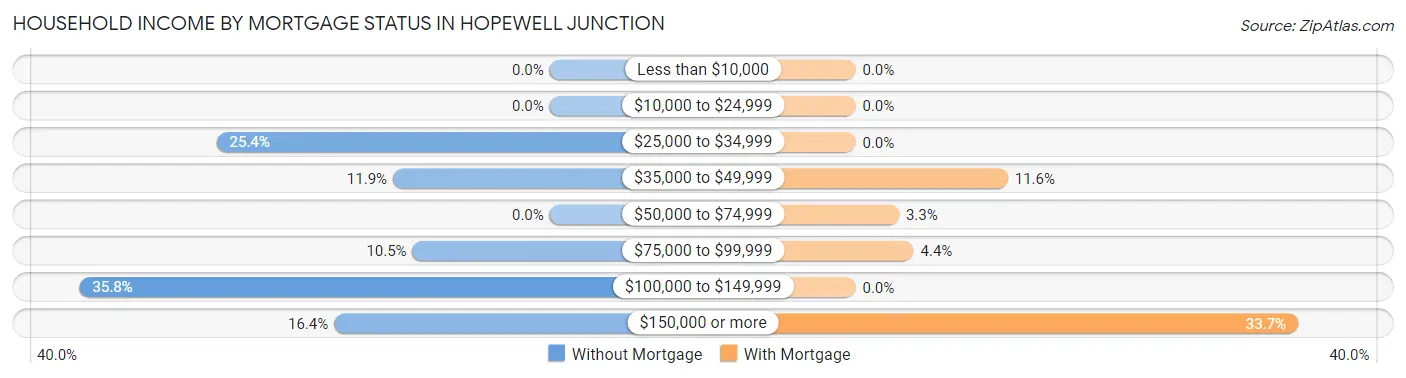
| Household Income | Without Mortgage | With Mortgage |
| Less than $10,000 | 0 (0.0%) | 0 (0.0%) |
| $10,000 to $24,999 | 0 (0.0%) | 0 (0.0%) |
| $25,000 to $34,999 | 17 (25.4%) | 0 (0.0%) |
| $35,000 to $49,999 | 8 (11.9%) | 21 (11.6%) |
| $50,000 to $74,999 | 0 (0.0%) | 6 (3.3%) |
| $75,000 to $99,999 | 7 (10.4%) | 8 (4.4%) |
| $100,000 to $149,999 | 24 (35.8%) | 0 (0.0%) |
| $150,000 or more | 11 (16.4%) | 61 (33.7%) |
| Total | 67 (100.0%) | 181 (100.0%) |
Property Value to Household Income Ratio in Hopewell Junction
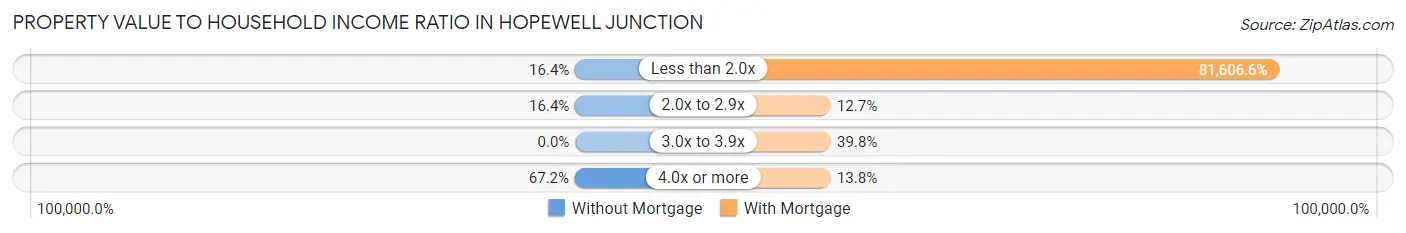
| Value-to-Income Ratio | Without Mortgage | With Mortgage |
| Less than 2.0x | 11 (16.4%) | 147,708 (81,606.6%) |
| 2.0x to 2.9x | 11 (16.4%) | 23 (12.7%) |
| 3.0x to 3.9x | 0 (0.0%) | 72 (39.8%) |
| 4.0x or more | 45 (67.2%) | 25 (13.8%) |
| Total | 67 (100.0%) | 181 (100.0%) |
Real Estate Taxes by Mortgage Status in Hopewell Junction
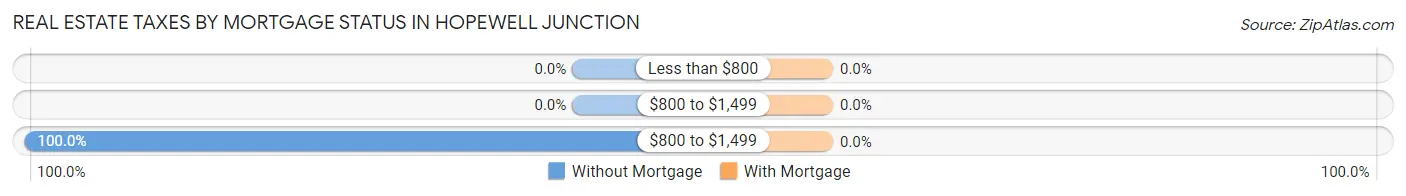
| Property Taxes | Without Mortgage | With Mortgage |
| Less than $800 | 0 (0.0%) | 0 (0.0%) |
| $800 to $1,499 | 0 (0.0%) | 0 (0.0%) |
| $800 to $1,499 | 67 (100.0%) | 0 (0.0%) |
| Total | 67 (100.0%) | 181 (100.0%) |
Health & Disability in Hopewell Junction
Health Insurance Coverage by Age in Hopewell Junction
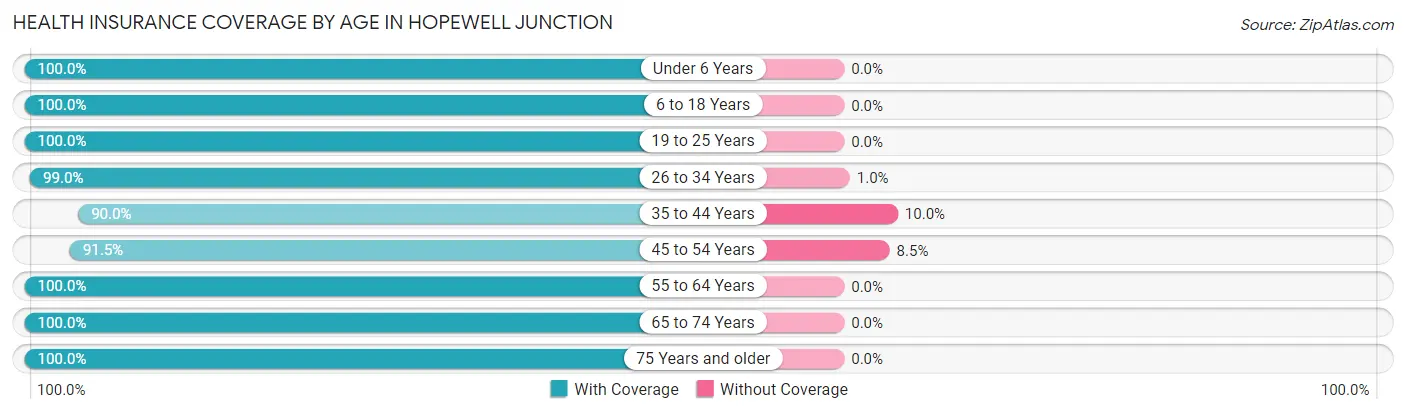
| Age Bracket | With Coverage | Without Coverage |
| Under 6 Years | 89 (100.0%) | 0 (0.0%) |
| 6 to 18 Years | 179 (100.0%) | 0 (0.0%) |
| 19 to 25 Years | 43 (100.0%) | 0 (0.0%) |
| 26 to 34 Years | 95 (99.0%) | 1 (1.0%) |
| 35 to 44 Years | 81 (90.0%) | 9 (10.0%) |
| 45 to 54 Years | 119 (91.5%) | 11 (8.5%) |
| 55 to 64 Years | 72 (100.0%) | 0 (0.0%) |
| 65 to 74 Years | 90 (100.0%) | 0 (0.0%) |
| 75 Years and older | 35 (100.0%) | 0 (0.0%) |
| Total | 803 (97.5%) | 21 (2.5%) |
Health Insurance Coverage by Citizenship Status in Hopewell Junction
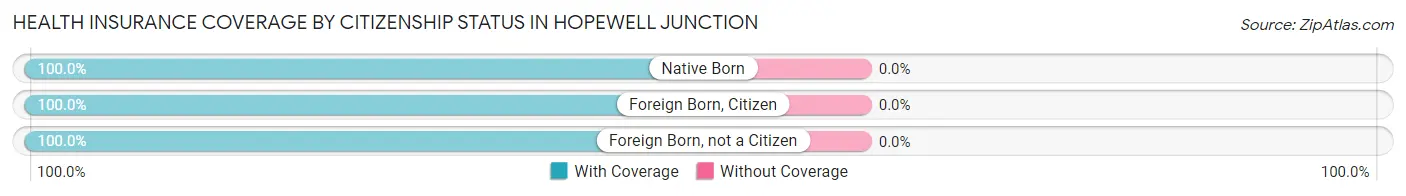
| Citizenship Status | With Coverage | Without Coverage |
| Native Born | 89 (100.0%) | 0 (0.0%) |
| Foreign Born, Citizen | 179 (100.0%) | 0 (0.0%) |
| Foreign Born, not a Citizen | 43 (100.0%) | 0 (0.0%) |
Health Insurance Coverage by Household Income in Hopewell Junction
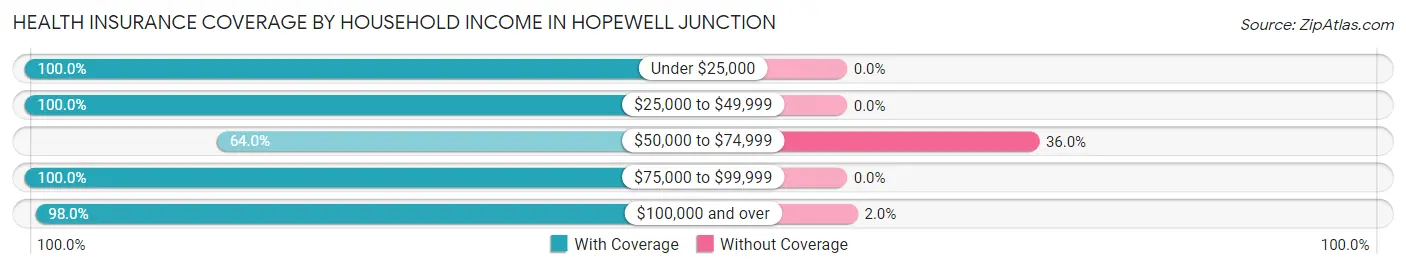
| Household Income | With Coverage | Without Coverage |
| Under $25,000 | 13 (100.0%) | 0 (0.0%) |
| $25,000 to $49,999 | 211 (100.0%) | 0 (0.0%) |
| $50,000 to $74,999 | 16 (64.0%) | 9 (36.0%) |
| $75,000 to $99,999 | 27 (100.0%) | 0 (0.0%) |
| $100,000 and over | 536 (98.0%) | 11 (2.0%) |
Public vs Private Health Insurance Coverage by Age in Hopewell Junction
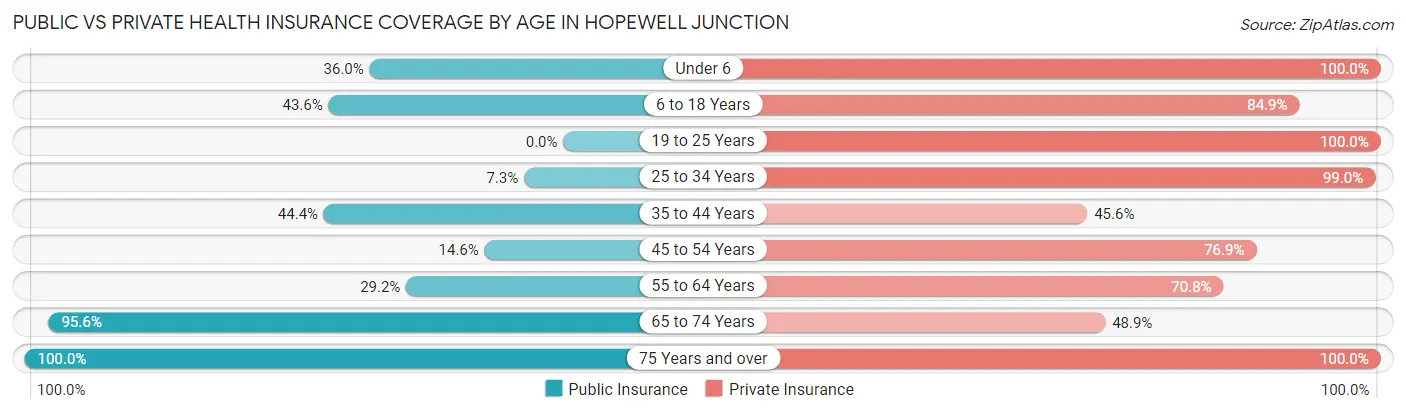
| Age Bracket | Public Insurance | Private Insurance |
| Under 6 | 32 (36.0%) | 89 (100.0%) |
| 6 to 18 Years | 78 (43.6%) | 152 (84.9%) |
| 19 to 25 Years | 0 (0.0%) | 43 (100.0%) |
| 25 to 34 Years | 7 (7.3%) | 95 (99.0%) |
| 35 to 44 Years | 40 (44.4%) | 41 (45.6%) |
| 45 to 54 Years | 19 (14.6%) | 100 (76.9%) |
| 55 to 64 Years | 21 (29.2%) | 51 (70.8%) |
| 65 to 74 Years | 86 (95.6%) | 44 (48.9%) |
| 75 Years and over | 35 (100.0%) | 35 (100.0%) |
| Total | 318 (38.6%) | 650 (78.9%) |
Disability Status by Sex by Age in Hopewell Junction
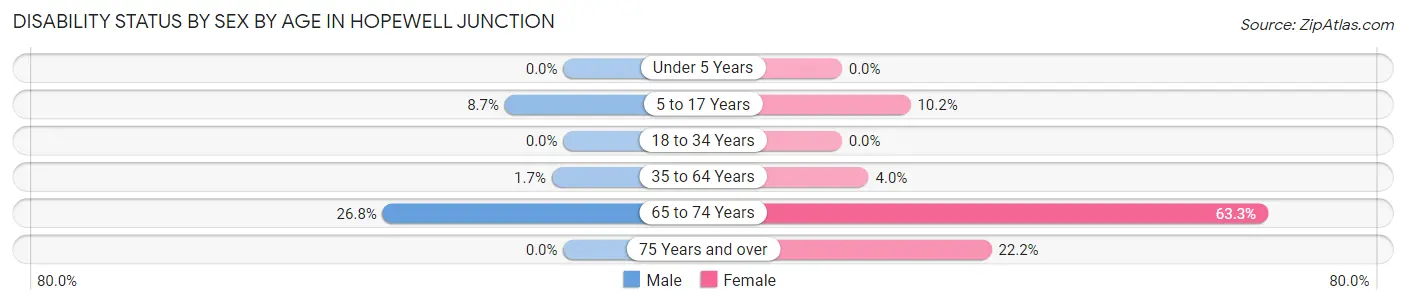
| Age Bracket | Male | Female |
| Under 5 Years | 0 (0.0%) | 0 (0.0%) |
| 5 to 17 Years | 8 (8.7%) | 10 (10.2%) |
| 18 to 34 Years | 0 (0.0%) | 0 (0.0%) |
| 35 to 64 Years | 2 (1.7%) | 7 (4.0%) |
| 65 to 74 Years | 11 (26.8%) | 31 (63.3%) |
| 75 Years and over | 0 (0.0%) | 6 (22.2%) |
Disability Class by Sex by Age in Hopewell Junction
Disability Class: Hearing Difficulty
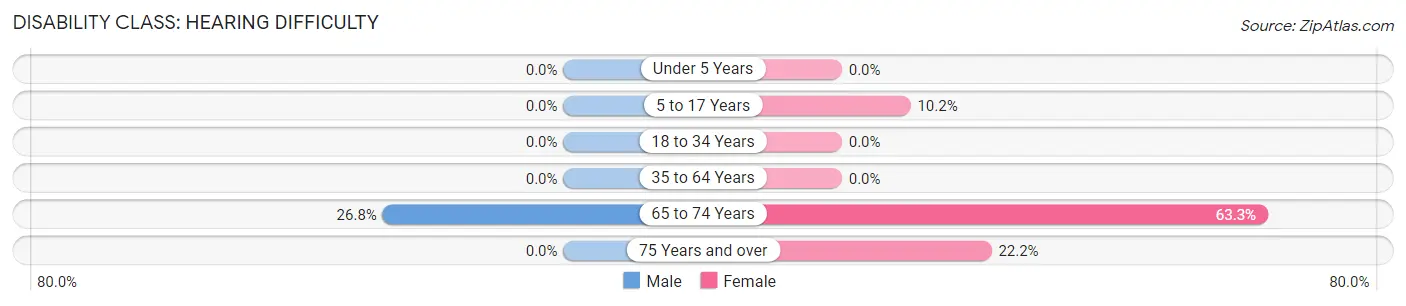
| Age Bracket | Male | Female |
| Under 5 Years | 0 (0.0%) | 0 (0.0%) |
| 5 to 17 Years | 0 (0.0%) | 10 (10.2%) |
| 18 to 34 Years | 0 (0.0%) | 0 (0.0%) |
| 35 to 64 Years | 0 (0.0%) | 0 (0.0%) |
| 65 to 74 Years | 11 (26.8%) | 31 (63.3%) |
| 75 Years and over | 0 (0.0%) | 6 (22.2%) |
Disability Class: Vision Difficulty
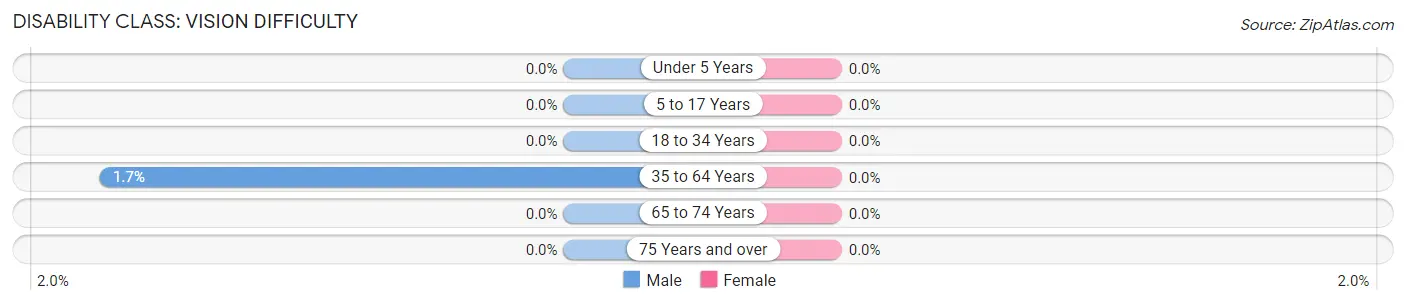
| Age Bracket | Male | Female |
| Under 5 Years | 0 (0.0%) | 0 (0.0%) |
| 5 to 17 Years | 0 (0.0%) | 0 (0.0%) |
| 18 to 34 Years | 0 (0.0%) | 0 (0.0%) |
| 35 to 64 Years | 2 (1.7%) | 0 (0.0%) |
| 65 to 74 Years | 0 (0.0%) | 0 (0.0%) |
| 75 Years and over | 0 (0.0%) | 0 (0.0%) |
Disability Class: Cognitive Difficulty
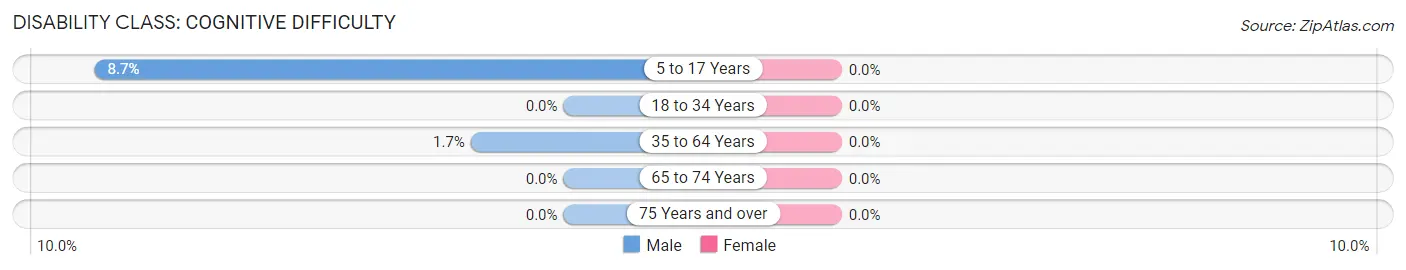
| Age Bracket | Male | Female |
| 5 to 17 Years | 8 (8.7%) | 0 (0.0%) |
| 18 to 34 Years | 0 (0.0%) | 0 (0.0%) |
| 35 to 64 Years | 2 (1.7%) | 0 (0.0%) |
| 65 to 74 Years | 0 (0.0%) | 0 (0.0%) |
| 75 Years and over | 0 (0.0%) | 0 (0.0%) |
Disability Class: Ambulatory Difficulty
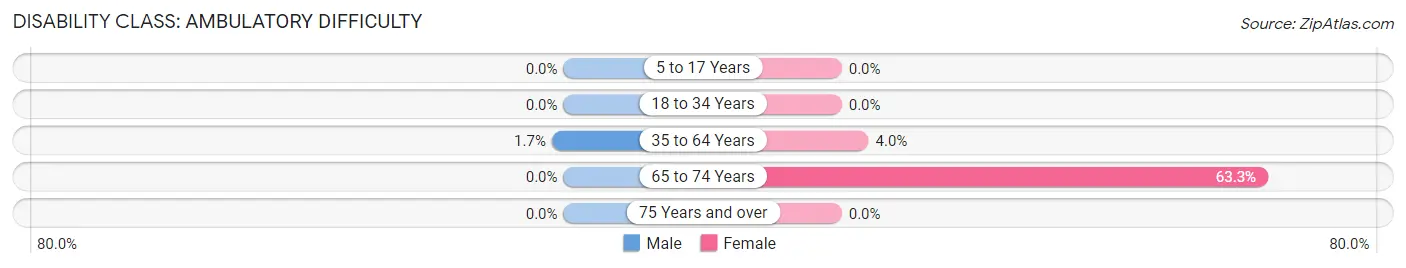
| Age Bracket | Male | Female |
| 5 to 17 Years | 0 (0.0%) | 0 (0.0%) |
| 18 to 34 Years | 0 (0.0%) | 0 (0.0%) |
| 35 to 64 Years | 2 (1.7%) | 7 (4.0%) |
| 65 to 74 Years | 0 (0.0%) | 31 (63.3%) |
| 75 Years and over | 0 (0.0%) | 0 (0.0%) |
Disability Class: Self-Care Difficulty
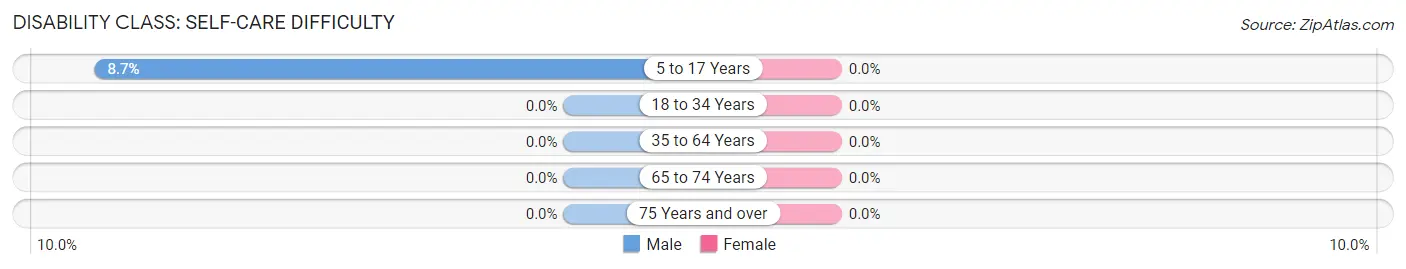
| Age Bracket | Male | Female |
| 5 to 17 Years | 8 (8.7%) | 0 (0.0%) |
| 18 to 34 Years | 0 (0.0%) | 0 (0.0%) |
| 35 to 64 Years | 0 (0.0%) | 0 (0.0%) |
| 65 to 74 Years | 0 (0.0%) | 0 (0.0%) |
| 75 Years and over | 0 (0.0%) | 0 (0.0%) |
Technology Access in Hopewell Junction
Computing Device Access in Hopewell Junction
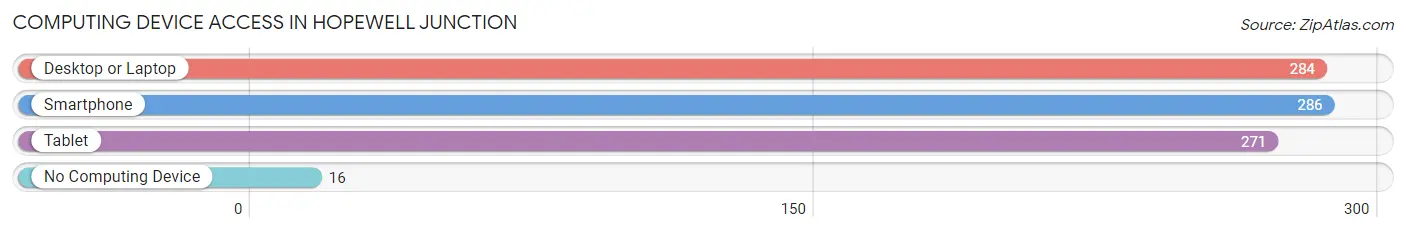
| Device Type | # Households | % Households |
| Desktop or Laptop | 284 | 85.3% |
| Smartphone | 286 | 85.9% |
| Tablet | 271 | 81.4% |
| No Computing Device | 16 | 4.8% |
| Total | 333 | 100.0% |
Internet Access in Hopewell Junction
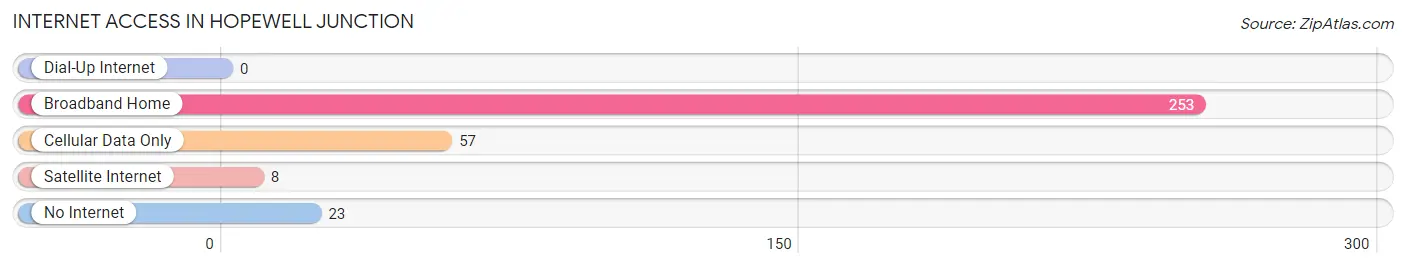
| Internet Type | # Households | % Households |
| Dial-Up Internet | 0 | 0.0% |
| Broadband Home | 253 | 76.0% |
| Cellular Data Only | 57 | 17.1% |
| Satellite Internet | 8 | 2.4% |
| No Internet | 23 | 6.9% |
| Total | 333 | 100.0% |
Hopewell Junction Summary
HopeWell Junction is a hamlet located in the town of East Fishkill, Dutchess County, New York. It is located in the Hudson Valley region of New York, approximately 70 miles north of New York City. The hamlet is situated on the banks of the Fishkill Creek, which flows into the Hudson River. The hamlet is home to a population of approximately 5,000 people.
History
The area that is now HopeWell Junction was originally inhabited by the Wappinger Indians. The first European settlers arrived in the area in the late 17th century. The hamlet was originally known as “Fishkill Landing” and was a major port for the Hudson River. In the early 19th century, the hamlet was renamed “HopeWell Junction” after the HopeWell Iron Works, which was located in the area. The iron works was a major employer in the area and was responsible for the construction of many of the buildings in the hamlet.
In the late 19th century, the hamlet began to grow as a residential community. The hamlet was home to a number of small businesses, including a general store, a blacksmith, a post office, and a hotel. The hamlet was also home to a number of churches, including the HopeWell Methodist Church, which was founded in 1845.
Geography
HopeWell Junction is located in the Hudson Valley region of New York. The hamlet is situated on the banks of the Fishkill Creek, which flows into the Hudson River. The hamlet is located approximately 70 miles north of New York City. The hamlet is bordered by the towns of East Fishkill, LaGrange, and Wappinger.
The hamlet is located in a rural area and is surrounded by rolling hills and forests. The hamlet is home to a number of parks, including the HopeWell Junction Park, which is located on the banks of the Fishkill Creek. The park features a playground, picnic areas, and a walking trail.
Economy
The economy of HopeWell Junction is largely based on agriculture and tourism. The hamlet is home to a number of small businesses, including restaurants, shops, and a post office. The hamlet is also home to a number of farms, which produce a variety of fruits and vegetables.
The hamlet is also home to a number of manufacturing companies, including the HopeWell Iron Works, which produces a variety of metal products. The hamlet is also home to a number of technology companies, including IBM, which has a research facility in the hamlet.
Demographics
As of the 2010 census, the population of HopeWell Junction was 5,000. The population is largely white (90.2%) and the median household income is $68,750. The hamlet is home to a number of religious denominations, including Catholic (25.2%), Protestant (20.2%), and Jewish (2.2%).
Conclusion
HopeWell Junction is a hamlet located in the town of East Fishkill, Dutchess County, New York. The hamlet is situated on the banks of the Fishkill Creek and is home to a population of approximately 5,000 people. The hamlet has a long history, dating back to the late 17th century, and is home to a number of small businesses and farms. The economy of the hamlet is largely based on agriculture and tourism, and the population is largely white.
Common Questions
What is Per Capita Income in Hopewell Junction?
Per Capita income in Hopewell Junction is $49,726.
What is the Median Family Income in Hopewell Junction?
Median Family Income in Hopewell Junction is $124,808.
What is the Median Household income in Hopewell Junction?
Median Household Income in Hopewell Junction is $103,894.
What is Inequality or Gini Index in Hopewell Junction?
Inequality or Gini Index in Hopewell Junction is 0.44.
What is the Total Population of Hopewell Junction?
Total Population of Hopewell Junction is 824.
What is the Total Male Population of Hopewell Junction?
Total Male Population of Hopewell Junction is 355.
What is the Total Female Population of Hopewell Junction?
Total Female Population of Hopewell Junction is 469.
What is the Ratio of Males per 100 Females in Hopewell Junction?
There are 75.69 Males per 100 Females in Hopewell Junction.
What is the Ratio of Females per 100 Males in Hopewell Junction?
There are 132.11 Females per 100 Males in Hopewell Junction.
What is the Median Population Age in Hopewell Junction?
Median Population Age in Hopewell Junction is 36.8 Years.
What is the Average Family Size in Hopewell Junction
Average Family Size in Hopewell Junction is 3.1 People.
What is the Average Household Size in Hopewell Junction
Average Household Size in Hopewell Junction is 2.5 People.
How Large is the Labor Force in Hopewell Junction?
There are 340 People in the Labor Forcein in Hopewell Junction.
What is the Percentage of People in the Labor Force in Hopewell Junction?
59.0% of People are in the Labor Force in Hopewell Junction.
What is the Unemployment Rate in Hopewell Junction?
Unemployment Rate in Hopewell Junction is 0.6%.