Cattaraugus, NY Map & Demographics
Cattaraugus Map
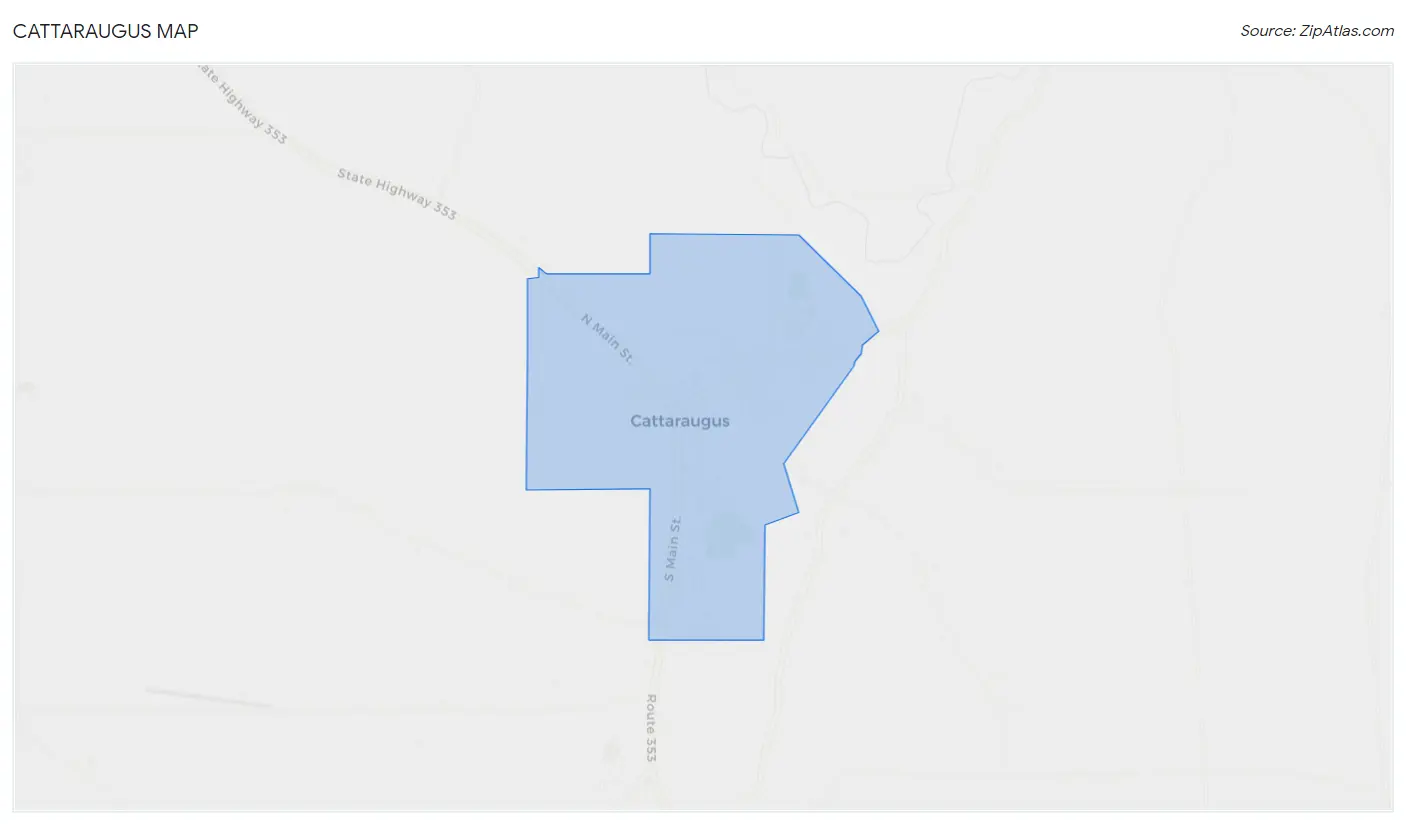
Cattaraugus Overview
$24,779
PER CAPITA INCOME
$58,661
AVG FAMILY INCOME
$57,574
AVG HOUSEHOLD INCOME
2.7%
WAGE / INCOME GAP [ % ]
97.3¢/ $1
WAGE / INCOME GAP [ $ ]
0.38
INEQUALITY / GINI INDEX
1,111
TOTAL POPULATION
583
MALE POPULATION
528
FEMALE POPULATION
110.42
MALES / 100 FEMALES
90.57
FEMALES / 100 MALES
36.4
MEDIAN AGE
3.1
AVG FAMILY SIZE
2.6
AVG HOUSEHOLD SIZE
483
LABOR FORCE [ PEOPLE ]
57.0%
PERCENT IN LABOR FORCE
8.1%
UNEMPLOYMENT RATE
Cattaraugus Zip Codes
Cattaraugus Area Codes
Income in Cattaraugus
Income Overview in Cattaraugus
Per Capita Income in Cattaraugus is $24,779, while median incomes of families and households are $58,661 and $57,574 respectively.
| Characteristic | Number | Measure |
| Per Capita Income | 1,111 | $24,779 |
| Median Family Income | 275 | $58,661 |
| Mean Family Income | 275 | $71,206 |
| Median Household Income | 419 | $57,574 |
| Mean Household Income | 419 | $63,954 |
| Income Deficit | 275 | $0 |
| Wage / Income Gap (%) | 1,111 | 2.68% |
| Wage / Income Gap ($) | 1,111 | 97.32¢ per $1 |
| Gini / Inequality Index | 1,111 | 0.38 |
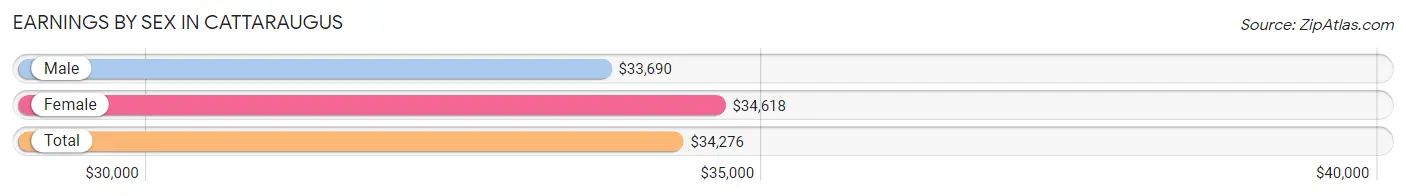
Earnings by Sex in Cattaraugus
Average Earnings in Cattaraugus are $34,276, $33,690 for men and $34,618 for women, a difference of 2.7%.
| Sex | Number | Average Earnings |
| Male | 246 (48.5%) | $33,690 |
| Female | 261 (51.5%) | $34,618 |
| Total | 507 (100.0%) | $34,276 |
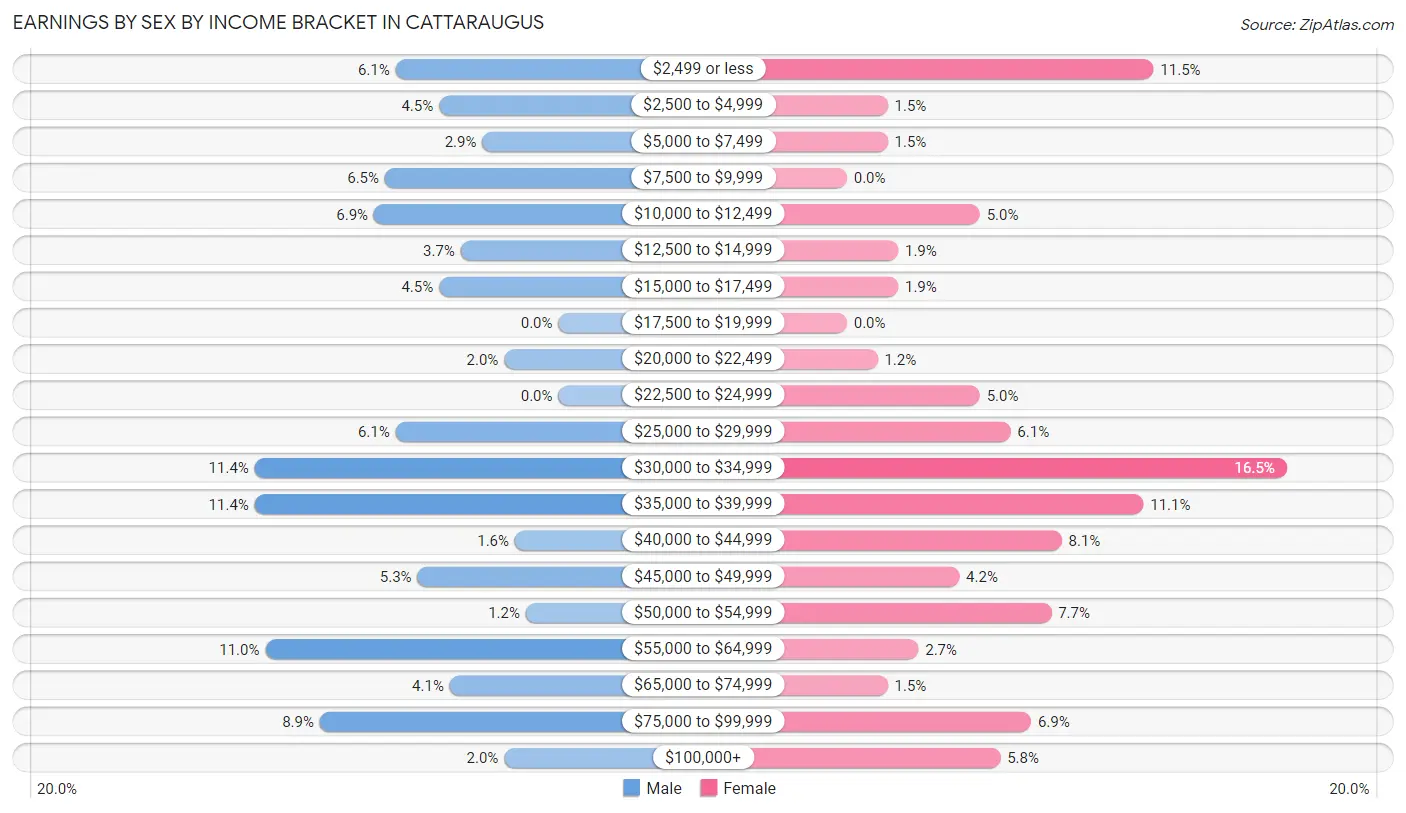
Earnings by Sex by Income Bracket in Cattaraugus
The most common earnings brackets in Cattaraugus are $30,000 to $34,999 for men (28 | 11.4%) and $30,000 to $34,999 for women (43 | 16.5%).
| Income | Male | Female |
| $2,499 or less | 15 (6.1%) | 30 (11.5%) |
| $2,500 to $4,999 | 11 (4.5%) | 4 (1.5%) |
| $5,000 to $7,499 | 7 (2.9%) | 4 (1.5%) |
| $7,500 to $9,999 | 16 (6.5%) | 0 (0.0%) |
| $10,000 to $12,499 | 17 (6.9%) | 13 (5.0%) |
| $12,500 to $14,999 | 9 (3.7%) | 5 (1.9%) |
| $15,000 to $17,499 | 11 (4.5%) | 5 (1.9%) |
| $17,500 to $19,999 | 0 (0.0%) | 0 (0.0%) |
| $20,000 to $22,499 | 5 (2.0%) | 3 (1.1%) |
| $22,500 to $24,999 | 0 (0.0%) | 13 (5.0%) |
| $25,000 to $29,999 | 15 (6.1%) | 16 (6.1%) |
| $30,000 to $34,999 | 28 (11.4%) | 43 (16.5%) |
| $35,000 to $39,999 | 28 (11.4%) | 29 (11.1%) |
| $40,000 to $44,999 | 4 (1.6%) | 21 (8.1%) |
| $45,000 to $49,999 | 13 (5.3%) | 11 (4.2%) |
| $50,000 to $54,999 | 3 (1.2%) | 20 (7.7%) |
| $55,000 to $64,999 | 27 (11.0%) | 7 (2.7%) |
| $65,000 to $74,999 | 10 (4.1%) | 4 (1.5%) |
| $75,000 to $99,999 | 22 (8.9%) | 18 (6.9%) |
| $100,000+ | 5 (2.0%) | 15 (5.8%) |
| Total | 246 (100.0%) | 261 (100.0%) |
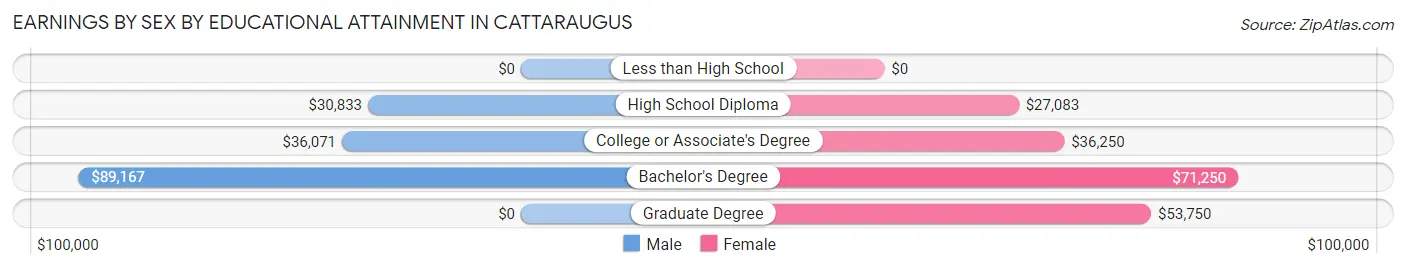
Earnings by Sex by Educational Attainment in Cattaraugus
Average earnings in Cattaraugus are $35,800 for men and $39,231 for women, a difference of 8.7%. Men with an educational attainment of bachelor's degree enjoy the highest average annual earnings of $89,167, while those with high school diploma education earn the least with $30,833. Women with an educational attainment of bachelor's degree earn the most with the average annual earnings of $71,250, while those with high school diploma education have the smallest earnings of $27,083.
| Educational Attainment | Male Income | Female Income |
| Less than High School | - | - |
| High School Diploma | $30,833 | $27,083 |
| College or Associate's Degree | $36,071 | $36,250 |
| Bachelor's Degree | $89,167 | $71,250 |
| Graduate Degree | - | - |
| Total | $35,800 | $39,231 |
Family Income in Cattaraugus
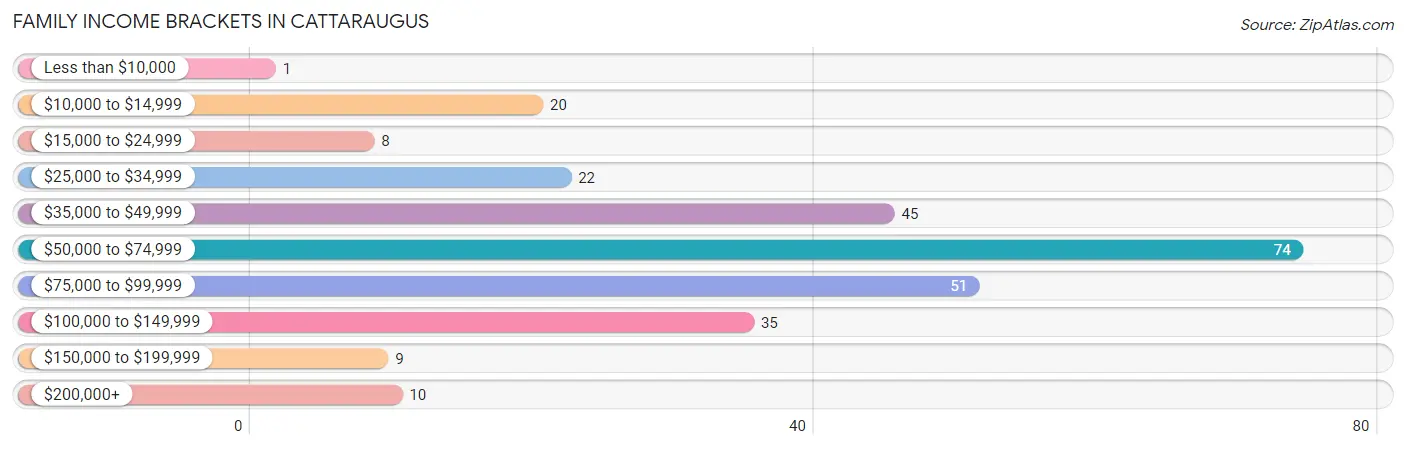
Family Income Brackets in Cattaraugus
According to the Cattaraugus family income data, there are 74 families falling into the $50,000 to $74,999 income range, which is the most common income bracket and makes up 26.9% of all families. Conversely, the less than $10,000 income bracket is the least frequent group with only 1 families (0.4%) belonging to this category.
| Income Bracket | # Families | % Families |
| Less than $10,000 | 1 | 0.4% |
| $10,000 to $14,999 | 20 | 7.3% |
| $15,000 to $24,999 | 8 | 2.9% |
| $25,000 to $34,999 | 22 | 8.0% |
| $35,000 to $49,999 | 45 | 16.4% |
| $50,000 to $74,999 | 74 | 26.9% |
| $75,000 to $99,999 | 51 | 18.5% |
| $100,000 to $149,999 | 35 | 12.7% |
| $150,000 to $199,999 | 9 | 3.3% |
| $200,000+ | 10 | 3.6% |
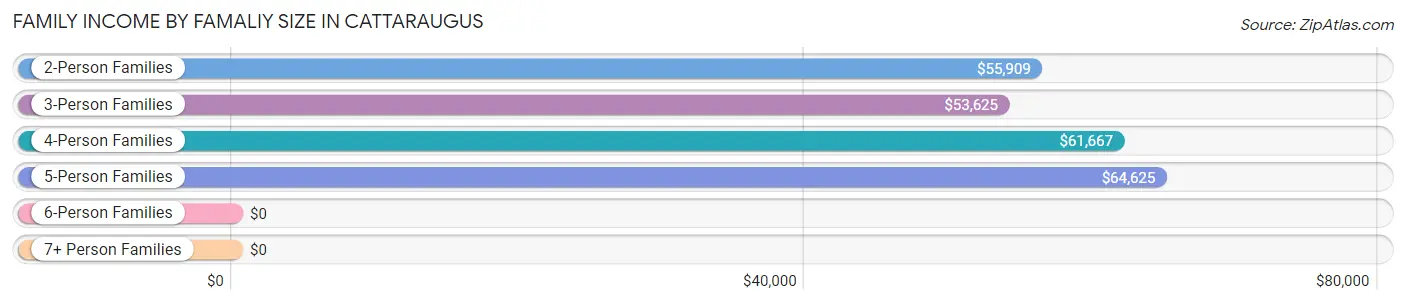
Family Income by Famaliy Size in Cattaraugus
5-person families (33 | 12.0%) account for the highest median family income in Cattaraugus with $64,625 per family, while 2-person families (138 | 50.2%) have the highest median income of $27,954 per family member.
| Income Bracket | # Families | Median Income |
| 2-Person Families | 138 (50.2%) | $55,909 |
| 3-Person Families | 59 (21.4%) | $53,625 |
| 4-Person Families | 26 (9.5%) | $61,667 |
| 5-Person Families | 33 (12.0%) | $64,625 |
| 6-Person Families | 13 (4.7%) | $0 |
| 7+ Person Families | 6 (2.2%) | $0 |
| Total | 275 (100.0%) | $58,661 |
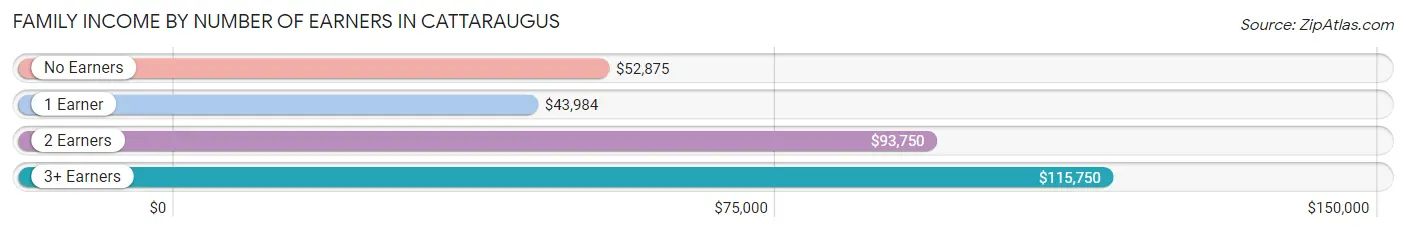
Family Income by Number of Earners in Cattaraugus
The median family income in Cattaraugus is $58,661, with families comprising 3+ earners (51) having the highest median family income of $115,750, while families with 1 earner (123) have the lowest median family income of $43,984, accounting for 18.5% and 44.7% of families, respectively.
| Number of Earners | # Families | Median Income |
| No Earners | 51 (18.5%) | $52,875 |
| 1 Earner | 123 (44.7%) | $43,984 |
| 2 Earners | 50 (18.2%) | $93,750 |
| 3+ Earners | 51 (18.5%) | $115,750 |
| Total | 275 (100.0%) | $58,661 |
Household Income in Cattaraugus
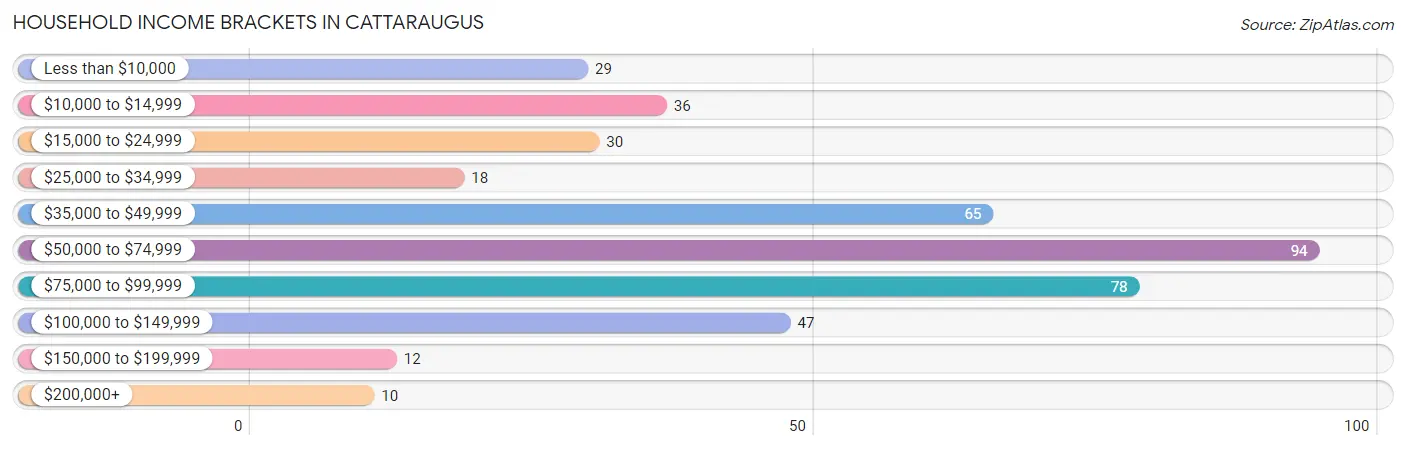
Household Income Brackets in Cattaraugus
With 94 households falling in the category, the $50,000 to $74,999 income range is the most frequent in Cattaraugus, accounting for 22.4% of all households. In contrast, only 10 households (2.4%) fall into the $200,000+ income bracket, making it the least populous group.
| Income Bracket | # Households | % Households |
| Less than $10,000 | 29 | 6.9% |
| $10,000 to $14,999 | 36 | 8.6% |
| $15,000 to $24,999 | 30 | 7.2% |
| $25,000 to $34,999 | 18 | 4.3% |
| $35,000 to $49,999 | 65 | 15.5% |
| $50,000 to $74,999 | 94 | 22.4% |
| $75,000 to $99,999 | 78 | 18.6% |
| $100,000 to $149,999 | 47 | 11.2% |
| $150,000 to $199,999 | 12 | 2.9% |
| $200,000+ | 10 | 2.4% |
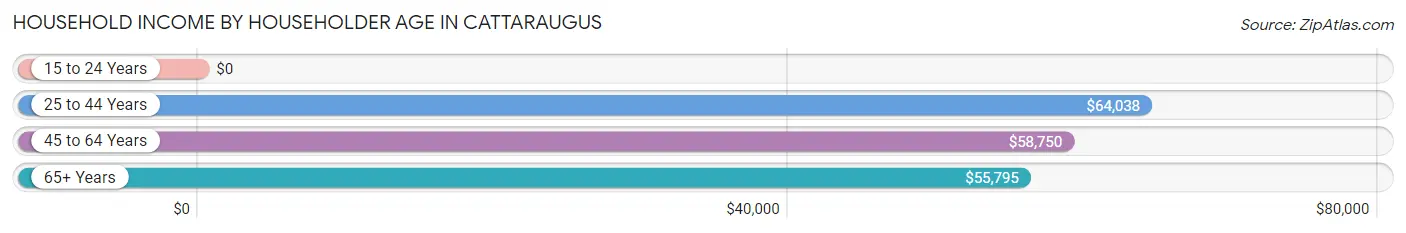
Household Income by Householder Age in Cattaraugus
The median household income in Cattaraugus is $57,574, with the highest median household income of $64,038 found in the 25 to 44 years age bracket for the primary householder. A total of 154 households (36.7%) fall into this category. Meanwhile, the 15 to 24 years age bracket for the primary householder has the lowest median household income of $0, with 9 households (2.1%) in this group.
| Income Bracket | # Households | Median Income |
| 15 to 24 Years | 9 (2.1%) | $0 |
| 25 to 44 Years | 154 (36.7%) | $64,038 |
| 45 to 64 Years | 149 (35.6%) | $58,750 |
| 65+ Years | 107 (25.5%) | $55,795 |
| Total | 419 (100.0%) | $57,574 |
Poverty in Cattaraugus
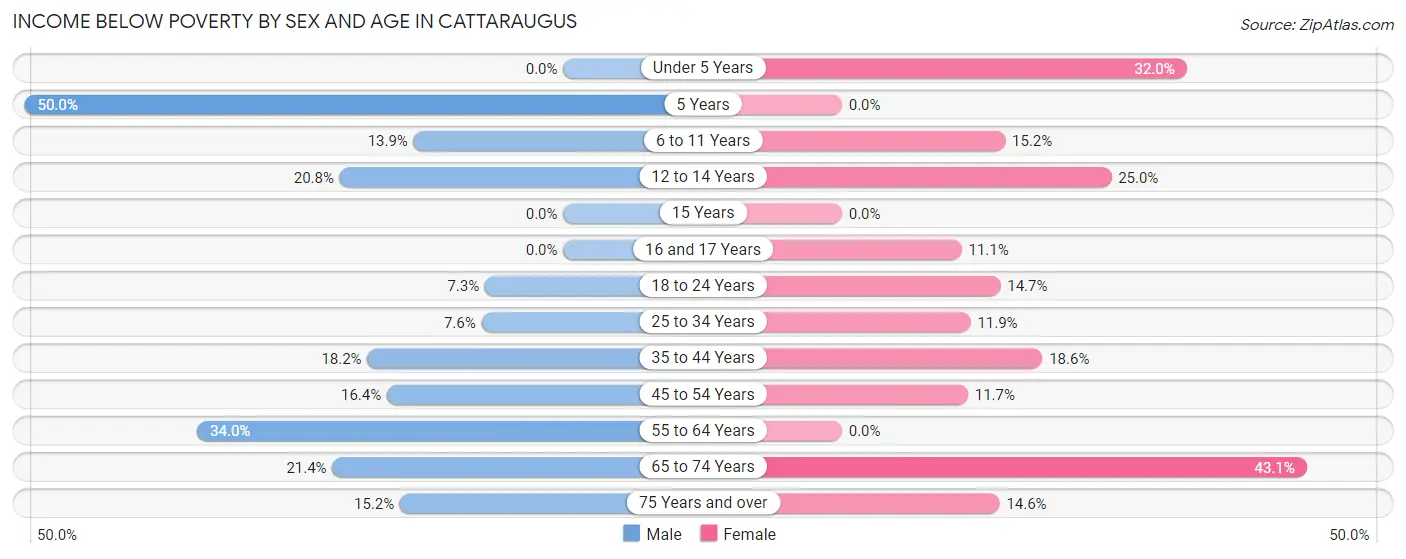
Income Below Poverty by Sex and Age in Cattaraugus
With 16.8% poverty level for males and 16.5% for females among the residents of Cattaraugus, 5 year old males and 65 to 74 year old females are the most vulnerable to poverty, with 1 males (50.0%) and 22 females (43.1%) in their respective age groups living below the poverty level.
| Age Bracket | Male | Female |
| Under 5 Years | 0 (0.0%) | 8 (32.0%) |
| 5 Years | 1 (50.0%) | 0 (0.0%) |
| 6 to 11 Years | 10 (13.9%) | 5 (15.1%) |
| 12 to 14 Years | 11 (20.7%) | 3 (25.0%) |
| 15 Years | 0 (0.0%) | 0 (0.0%) |
| 16 and 17 Years | 0 (0.0%) | 3 (11.1%) |
| 18 to 24 Years | 4 (7.3%) | 5 (14.7%) |
| 25 to 34 Years | 6 (7.6%) | 8 (11.9%) |
| 35 to 44 Years | 6 (18.2%) | 16 (18.6%) |
| 45 to 54 Years | 9 (16.4%) | 9 (11.7%) |
| 55 to 64 Years | 35 (34.0%) | 0 (0.0%) |
| 65 to 74 Years | 9 (21.4%) | 22 (43.1%) |
| 75 Years and over | 5 (15.1%) | 6 (14.6%) |
| Total | 96 (16.8%) | 85 (16.5%) |
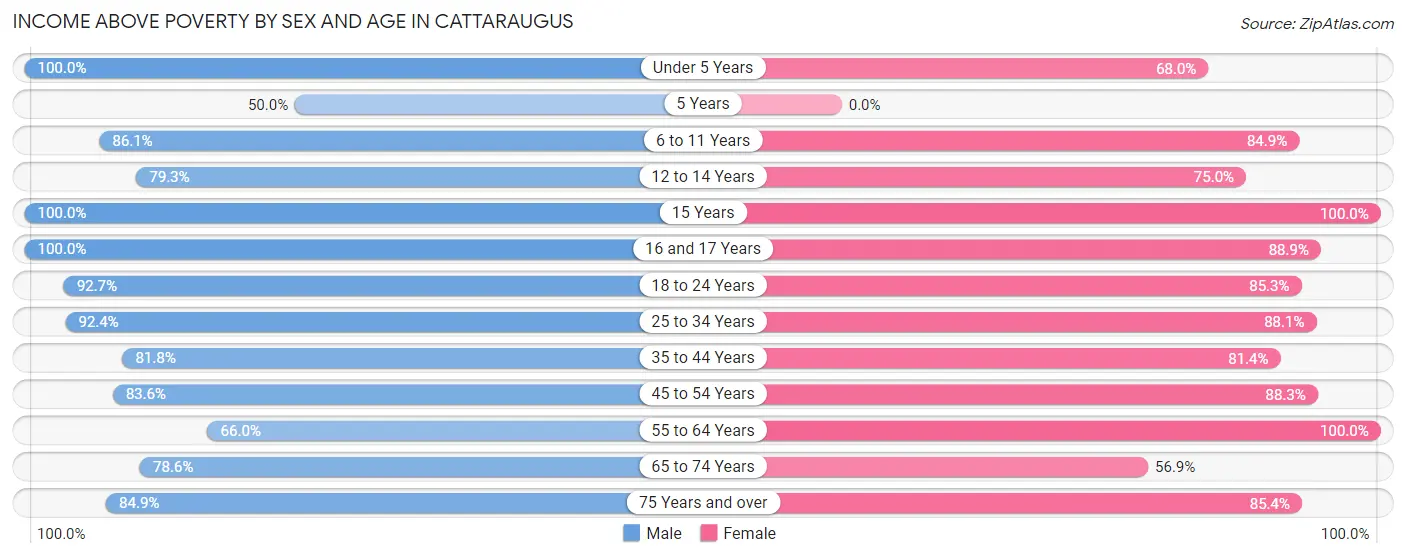
Income Above Poverty by Sex and Age in Cattaraugus
According to the poverty statistics in Cattaraugus, males aged under 5 years and females aged 15 years are the age groups that are most secure financially, with 100.0% of males and 100.0% of females in these age groups living above the poverty line.
| Age Bracket | Male | Female |
| Under 5 Years | 24 (100.0%) | 17 (68.0%) |
| 5 Years | 1 (50.0%) | 0 (0.0%) |
| 6 to 11 Years | 62 (86.1%) | 28 (84.9%) |
| 12 to 14 Years | 42 (79.2%) | 9 (75.0%) |
| 15 Years | 4 (100.0%) | 12 (100.0%) |
| 16 and 17 Years | 15 (100.0%) | 24 (88.9%) |
| 18 to 24 Years | 51 (92.7%) | 29 (85.3%) |
| 25 to 34 Years | 73 (92.4%) | 59 (88.1%) |
| 35 to 44 Years | 27 (81.8%) | 70 (81.4%) |
| 45 to 54 Years | 46 (83.6%) | 68 (88.3%) |
| 55 to 64 Years | 68 (66.0%) | 49 (100.0%) |
| 65 to 74 Years | 33 (78.6%) | 29 (56.9%) |
| 75 Years and over | 28 (84.9%) | 35 (85.4%) |
| Total | 474 (83.2%) | 429 (83.5%) |
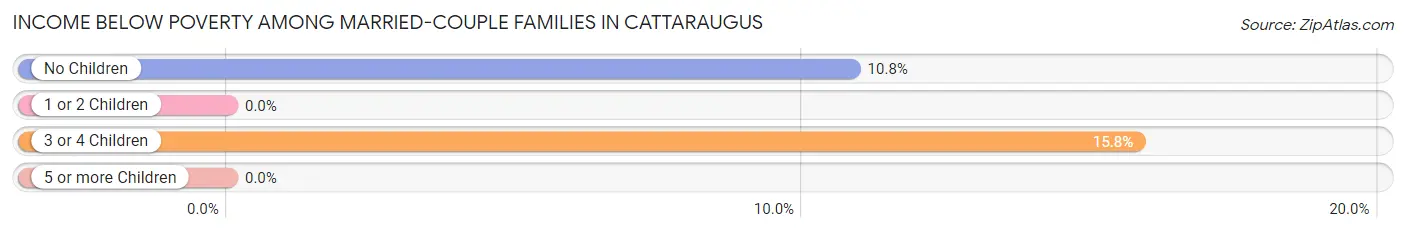
Income Below Poverty Among Married-Couple Families in Cattaraugus
The poverty statistics for married-couple families in Cattaraugus show that 7.7% or 12 of the total 156 families live below the poverty line. Families with 3 or 4 children have the highest poverty rate of 15.8%, comprising of 3 families. On the other hand, families with 1 or 2 children have the lowest poverty rate of 0.0%, which includes 0 families.
| Children | Above Poverty | Below Poverty |
| No Children | 74 (89.2%) | 9 (10.8%) |
| 1 or 2 Children | 54 (100.0%) | 0 (0.0%) |
| 3 or 4 Children | 16 (84.2%) | 3 (15.8%) |
| 5 or more Children | 0 (0.0%) | 0 (0.0%) |
| Total | 144 (92.3%) | 12 (7.7%) |
Income Below Poverty Among Single-Parent Households in Cattaraugus
According to the poverty data in Cattaraugus, 24.2% or 8 single-father households and 10.5% or 9 single-mother households are living below the poverty line. Among single-father households, those with 3 or 4 children have the highest poverty rate, with 2 households (100.0%) experiencing poverty. Likewise, among single-mother households, those with 3 or 4 children have the highest poverty rate, with 3 households (100.0%) falling below the poverty line.
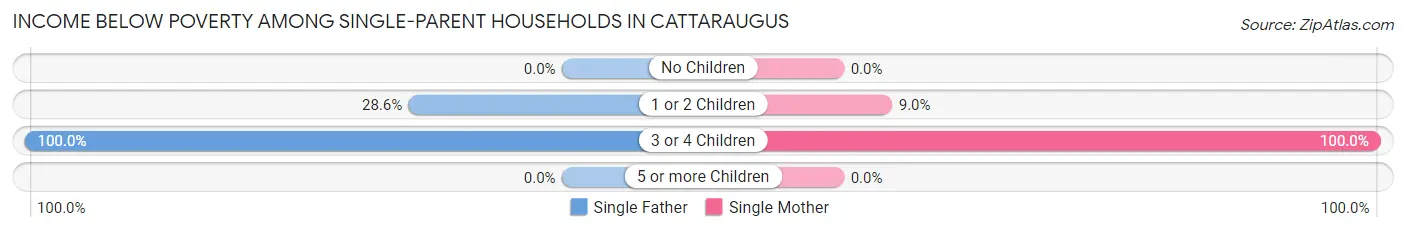
| Children | Single Father | Single Mother |
| No Children | 0 (0.0%) | 0 (0.0%) |
| 1 or 2 Children | 6 (28.6%) | 6 (9.0%) |
| 3 or 4 Children | 2 (100.0%) | 3 (100.0%) |
| 5 or more Children | 0 (0.0%) | 0 (0.0%) |
| Total | 8 (24.2%) | 9 (10.5%) |
Income Below Poverty Among Married-Couple vs Single-Parent Households in Cattaraugus
The poverty data for Cattaraugus shows that 12 of the married-couple family households (7.7%) and 17 of the single-parent households (14.3%) are living below the poverty level. Within the married-couple family households, those with 3 or 4 children have the highest poverty rate, with 3 households (15.8%) falling below the poverty line. Among the single-parent households, those with 3 or 4 children have the highest poverty rate, with 5 household (100.0%) living below poverty.
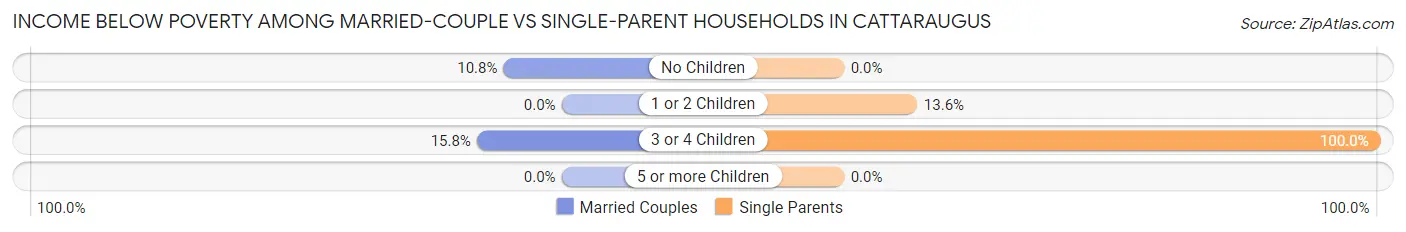
| Children | Married-Couple Families | Single-Parent Households |
| No Children | 9 (10.8%) | 0 (0.0%) |
| 1 or 2 Children | 0 (0.0%) | 12 (13.6%) |
| 3 or 4 Children | 3 (15.8%) | 5 (100.0%) |
| 5 or more Children | 0 (0.0%) | 0 (0.0%) |
| Total | 12 (7.7%) | 17 (14.3%) |
Race in Cattaraugus
The most populous races in Cattaraugus are White / Caucasian (1,047 | 94.2%), Hispanic or Latino (89 | 8.0%), and Some other Race (41 | 3.7%).
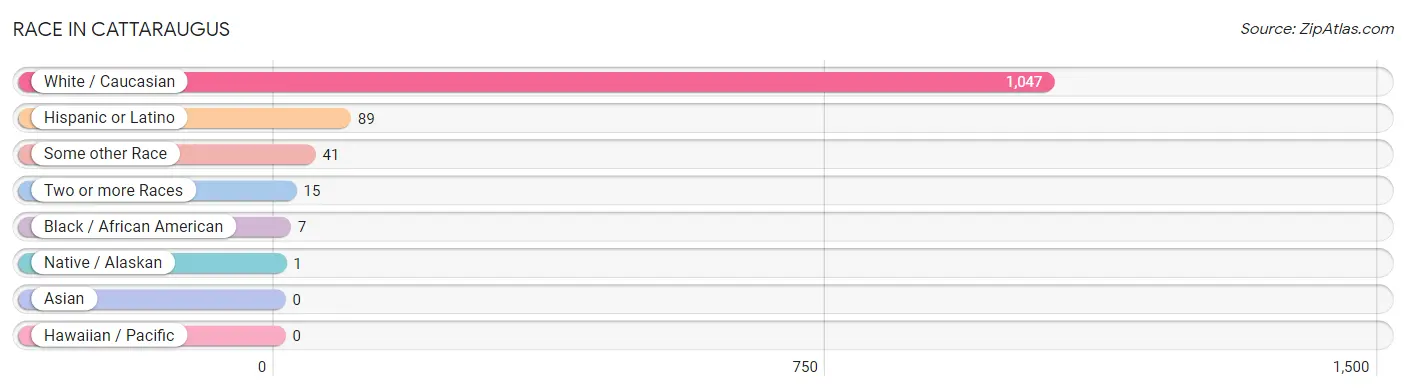
| Race | # Population | % Population |
| Asian | 0 | 0.0% |
| Black / African American | 7 | 0.6% |
| Hawaiian / Pacific | 0 | 0.0% |
| Hispanic or Latino | 89 | 8.0% |
| Native / Alaskan | 1 | 0.1% |
| White / Caucasian | 1,047 | 94.2% |
| Two or more Races | 15 | 1.3% |
| Some other Race | 41 | 3.7% |
| Total | 1,111 | 100.0% |
Ancestry in Cattaraugus
The most populous ancestries reported in Cattaraugus are German (239 | 21.5%), Irish (132 | 11.9%), Puerto Rican (89 | 8.0%), English (75 | 6.8%), and Italian (73 | 6.6%), together accounting for 54.7% of all Cattaraugus residents.
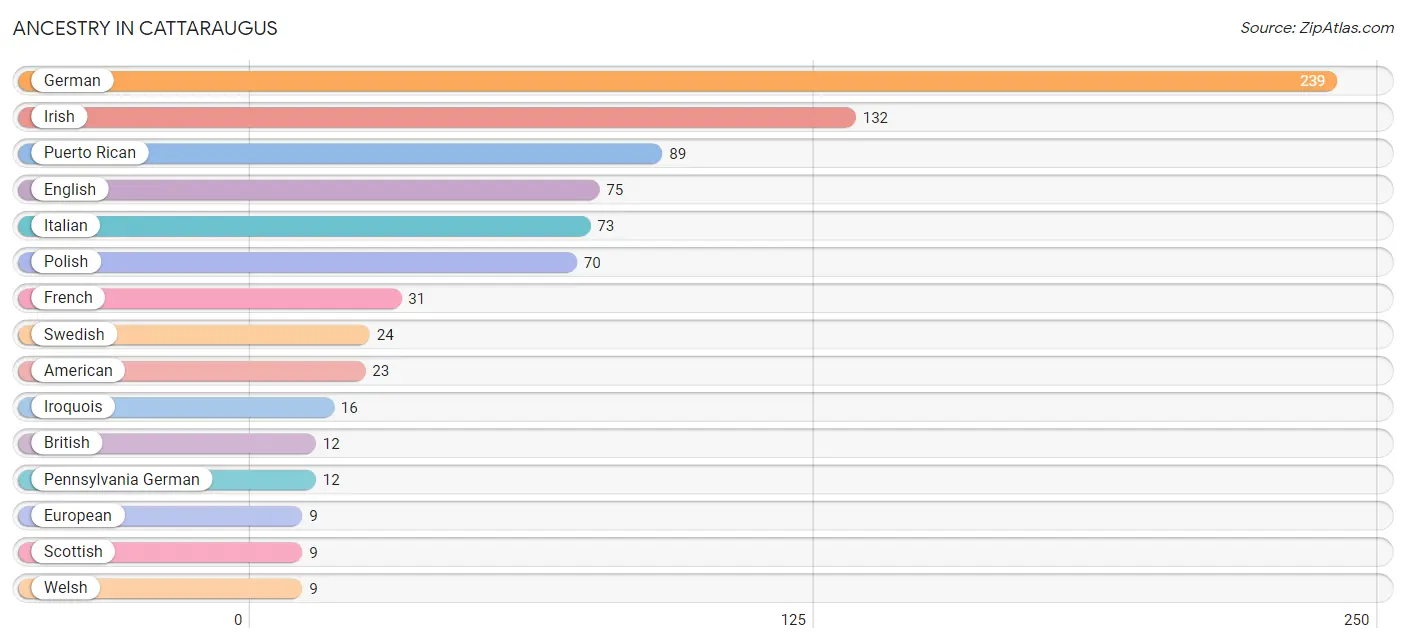
| Ancestry | # Population | % Population |
| American | 23 | 2.1% |
| British | 12 | 1.1% |
| Dutch | 3 | 0.3% |
| English | 75 | 6.8% |
| European | 9 | 0.8% |
| French | 31 | 2.8% |
| German | 239 | 21.5% |
| Irish | 132 | 11.9% |
| Iroquois | 16 | 1.4% |
| Italian | 73 | 6.6% |
| Lithuanian | 3 | 0.3% |
| Norwegian | 3 | 0.3% |
| Pennsylvania German | 12 | 1.1% |
| Polish | 70 | 6.3% |
| Puerto Rican | 89 | 8.0% |
| Scotch-Irish | 3 | 0.3% |
| Scottish | 9 | 0.8% |
| Swedish | 24 | 2.2% |
| Ukrainian | 3 | 0.3% |
| Welsh | 9 | 0.8% | View All 20 Rows |
Immigrants in Cattaraugus
The most numerous immigrant groups reported in Cattaraugus came from , and Canada (1 | 0.1%), together accounting for 0.1% of all Cattaraugus residents.

| Immigration Origin | # Population | % Population |
| Canada | 1 | 0.1% | View All 1 Rows |
Sex and Age in Cattaraugus
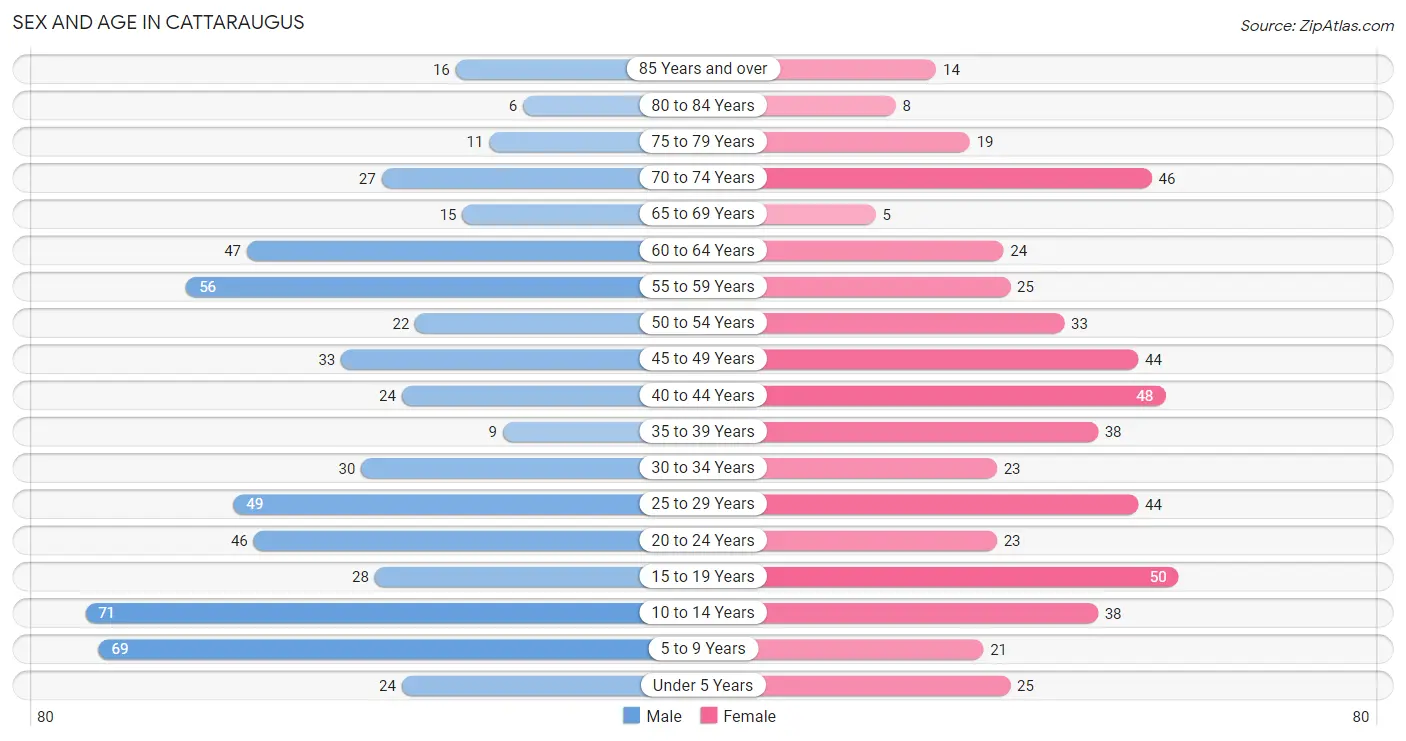
Sex and Age in Cattaraugus
The most populous age groups in Cattaraugus are 10 to 14 Years (71 | 12.2%) for men and 15 to 19 Years (50 | 9.5%) for women.
| Age Bracket | Male | Female |
| Under 5 Years | 24 (4.1%) | 25 (4.7%) |
| 5 to 9 Years | 69 (11.8%) | 21 (4.0%) |
| 10 to 14 Years | 71 (12.2%) | 38 (7.2%) |
| 15 to 19 Years | 28 (4.8%) | 50 (9.5%) |
| 20 to 24 Years | 46 (7.9%) | 23 (4.4%) |
| 25 to 29 Years | 49 (8.4%) | 44 (8.3%) |
| 30 to 34 Years | 30 (5.1%) | 23 (4.4%) |
| 35 to 39 Years | 9 (1.5%) | 38 (7.2%) |
| 40 to 44 Years | 24 (4.1%) | 48 (9.1%) |
| 45 to 49 Years | 33 (5.7%) | 44 (8.3%) |
| 50 to 54 Years | 22 (3.8%) | 33 (6.2%) |
| 55 to 59 Years | 56 (9.6%) | 25 (4.7%) |
| 60 to 64 Years | 47 (8.1%) | 24 (4.5%) |
| 65 to 69 Years | 15 (2.6%) | 5 (0.9%) |
| 70 to 74 Years | 27 (4.6%) | 46 (8.7%) |
| 75 to 79 Years | 11 (1.9%) | 19 (3.6%) |
| 80 to 84 Years | 6 (1.0%) | 8 (1.5%) |
| 85 Years and over | 16 (2.7%) | 14 (2.6%) |
| Total | 583 (100.0%) | 528 (100.0%) |
Families and Households in Cattaraugus
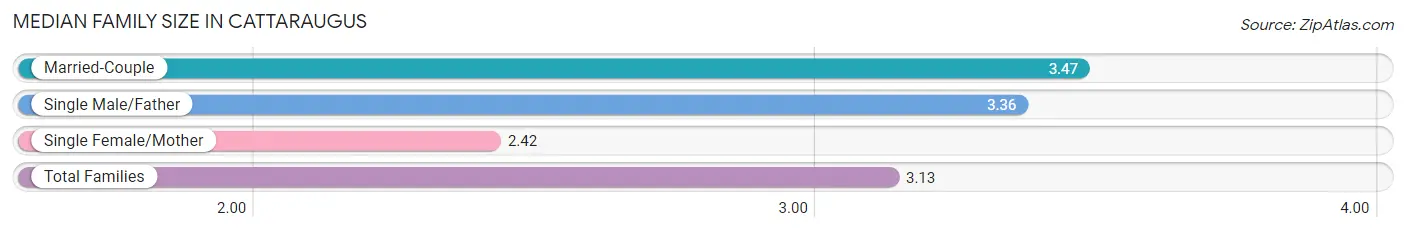
Median Family Size in Cattaraugus
The median family size in Cattaraugus is 3.13 persons per family, with married-couple families (156 | 56.7%) accounting for the largest median family size of 3.47 persons per family. On the other hand, single female/mother families (86 | 31.3%) represent the smallest median family size with 2.42 persons per family.
| Family Type | # Families | Family Size |
| Married-Couple | 156 (56.7%) | 3.47 |
| Single Male/Father | 33 (12.0%) | 3.36 |
| Single Female/Mother | 86 (31.3%) | 2.42 |
| Total Families | 275 (100.0%) | 3.13 |
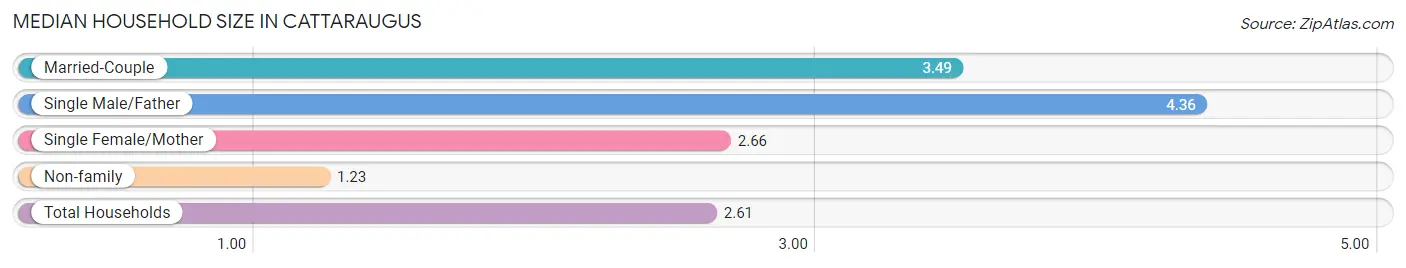
Median Household Size in Cattaraugus
The median household size in Cattaraugus is 2.61 persons per household, with single male/father households (33 | 7.9%) accounting for the largest median household size of 4.36 persons per household. non-family households (144 | 34.4%) represent the smallest median household size with 1.23 persons per household.
| Household Type | # Households | Household Size |
| Married-Couple | 156 (37.2%) | 3.49 |
| Single Male/Father | 33 (7.9%) | 4.36 |
| Single Female/Mother | 86 (20.5%) | 2.66 |
| Non-family | 144 (34.4%) | 1.23 |
| Total Households | 419 (100.0%) | 2.61 |
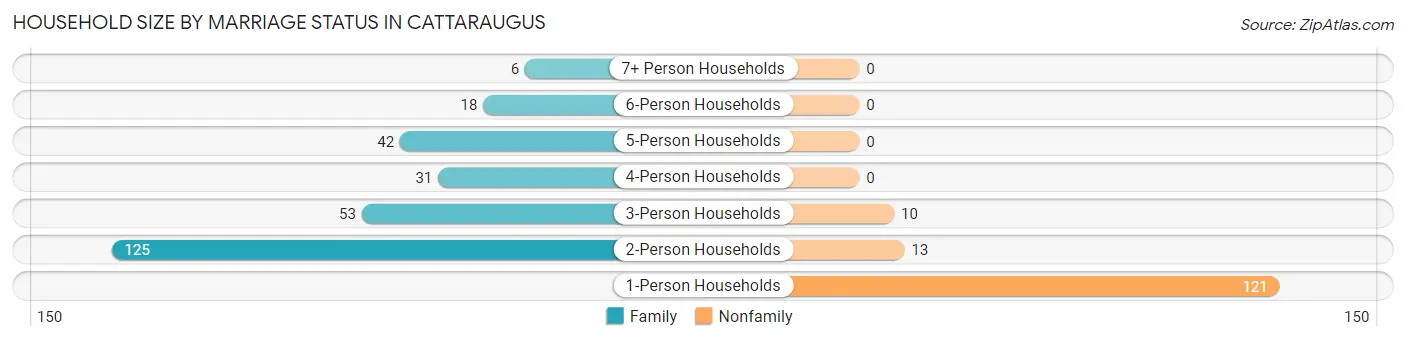
Household Size by Marriage Status in Cattaraugus
Out of a total of 419 households in Cattaraugus, 275 (65.6%) are family households, while 144 (34.4%) are nonfamily households. The most numerous type of family households are 2-person households, comprising 125, and the most common type of nonfamily households are 1-person households, comprising 121.
| Household Size | Family Households | Nonfamily Households |
| 1-Person Households | - | 121 (28.9%) |
| 2-Person Households | 125 (29.8%) | 13 (3.1%) |
| 3-Person Households | 53 (12.7%) | 10 (2.4%) |
| 4-Person Households | 31 (7.4%) | 0 (0.0%) |
| 5-Person Households | 42 (10.0%) | 0 (0.0%) |
| 6-Person Households | 18 (4.3%) | 0 (0.0%) |
| 7+ Person Households | 6 (1.4%) | 0 (0.0%) |
| Total | 275 (65.6%) | 144 (34.4%) |
Female Fertility in Cattaraugus
Fertility by Age in Cattaraugus
Average fertility rate in Cattaraugus is 69.0 births per 1,000 women. Women in the age bracket of 15 to 19 years have the highest fertility rate with 120.0 births per 1,000 women. Women in the age bracket of 35 to 50 years acount for 47.4% of all women with births.
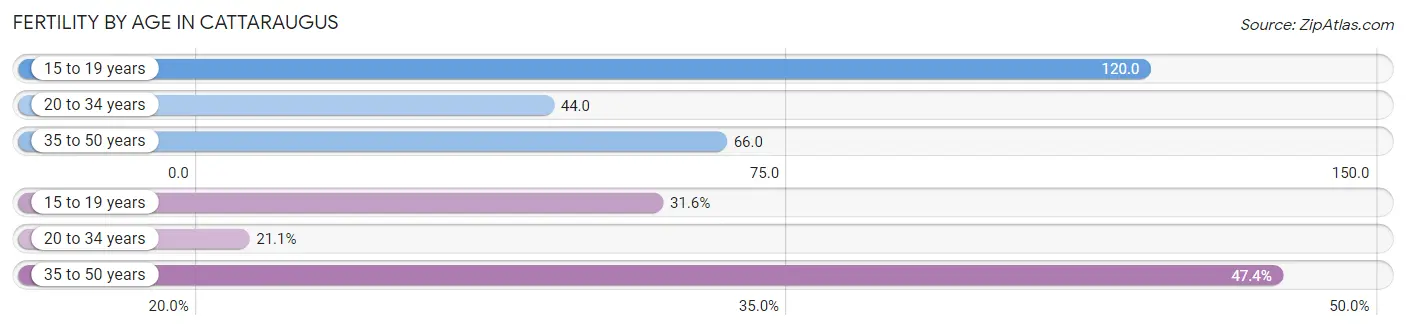
| Age Bracket | Women with Births | Births / 1,000 Women |
| 15 to 19 years | 6 (31.6%) | 120.0 |
| 20 to 34 years | 4 (21.0%) | 44.0 |
| 35 to 50 years | 9 (47.4%) | 66.0 |
| Total | 19 (100.0%) | 69.0 |
Fertility by Age by Marriage Status in Cattaraugus
21.1% of women with births (19) in Cattaraugus are married. The highest percentage of unmarried women with births falls into 15 to 19 years age bracket with 100.0% of them unmarried at the time of birth, while the lowest percentage of unmarried women with births belong to 20 to 34 years age bracket with 0.0% of them unmarried.
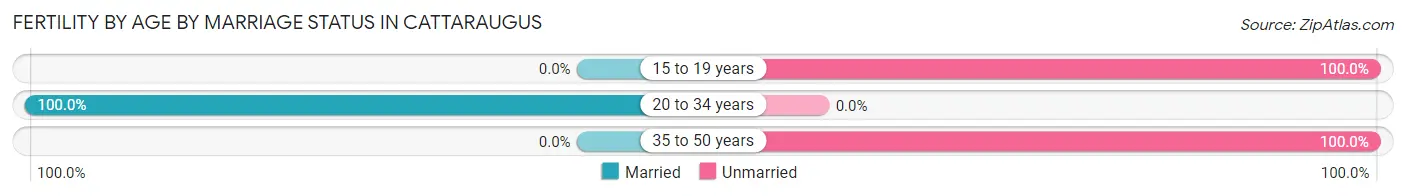
| Age Bracket | Married | Unmarried |
| 15 to 19 years | 0 (0.0%) | 6 (100.0%) |
| 20 to 34 years | 4 (100.0%) | 0 (0.0%) |
| 35 to 50 years | 0 (0.0%) | 9 (100.0%) |
| Total | 4 (21.0%) | 15 (78.9%) |
Fertility by Education in Cattaraugus
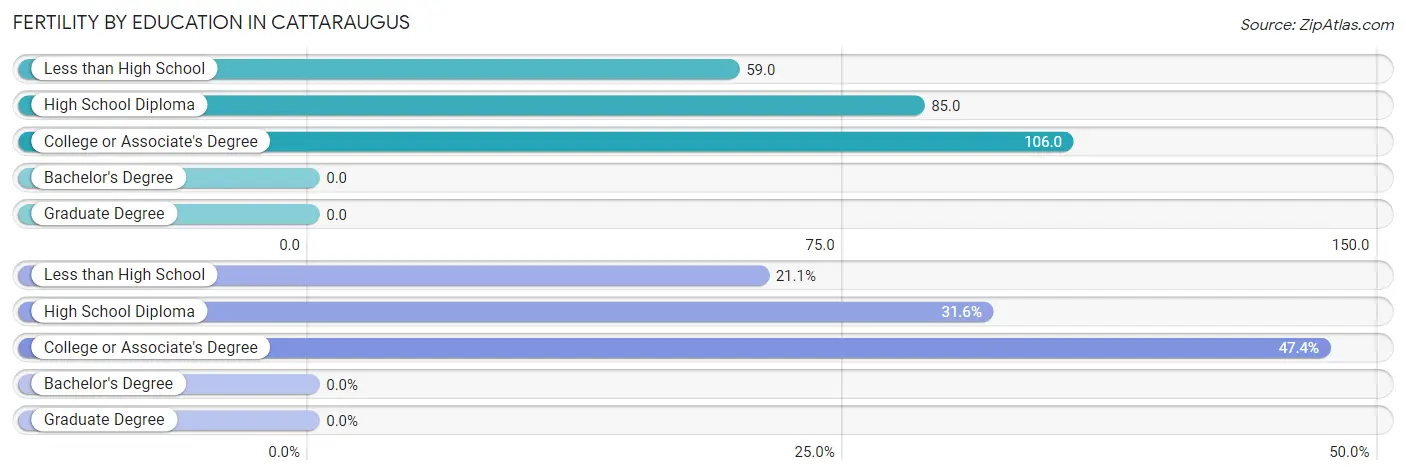
| Educational Attainment | Women with Births | Births / 1,000 Women |
| Less than High School | 4 (21.0%) | 59.0 |
| High School Diploma | 6 (31.6%) | 85.0 |
| College or Associate's Degree | 9 (47.4%) | 106.0 |
| Bachelor's Degree | 0 (0.0%) | 0.0 |
| Graduate Degree | 0 (0.0%) | 0.0 |
| Total | 19 (100.0%) | 69.0 |
Fertility by Education by Marriage Status in Cattaraugus
78.9% of women with births in Cattaraugus are unmarried. Women with the educational attainment of less than high school are most likely to be married with 100.0% of them married at childbirth, while women with the educational attainment of high school diploma are least likely to be married with 100.0% of them unmarried at childbirth.
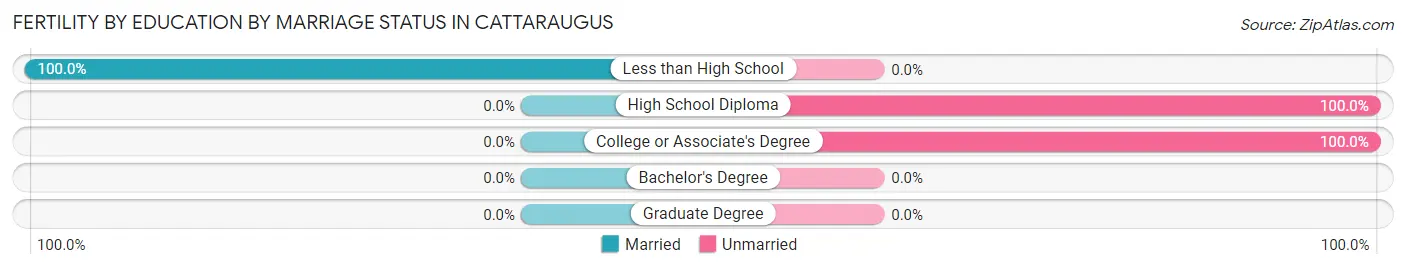
| Educational Attainment | Married | Unmarried |
| Less than High School | 4 (100.0%) | 0 (0.0%) |
| High School Diploma | 0 (0.0%) | 6 (100.0%) |
| College or Associate's Degree | 0 (0.0%) | 9 (100.0%) |
| Bachelor's Degree | 0 (0.0%) | 0 (0.0%) |
| Graduate Degree | 0 (0.0%) | 0 (0.0%) |
| Total | 4 (21.0%) | 15 (78.9%) |
Employment Characteristics in Cattaraugus
Employment by Class of Employer in Cattaraugus
Among the 431 employed individuals in Cattaraugus, private company employees (285 | 66.1%), state government employees (33 | 7.7%), and not-for-profit organizations (32 | 7.4%) make up the most common classes of employment.
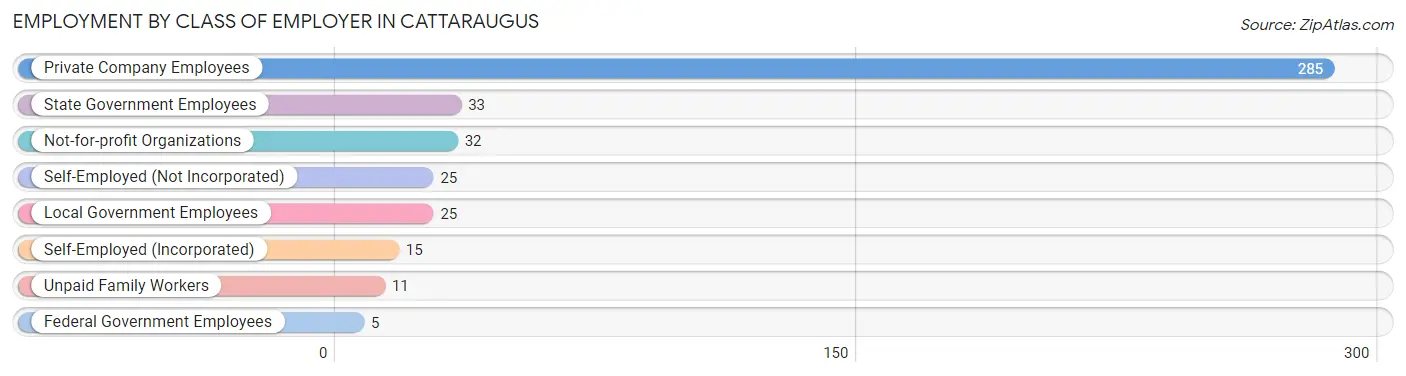
| Employer Class | # Employees | % Employees |
| Private Company Employees | 285 | 66.1% |
| Self-Employed (Incorporated) | 15 | 3.5% |
| Self-Employed (Not Incorporated) | 25 | 5.8% |
| Not-for-profit Organizations | 32 | 7.4% |
| Local Government Employees | 25 | 5.8% |
| State Government Employees | 33 | 7.7% |
| Federal Government Employees | 5 | 1.2% |
| Unpaid Family Workers | 11 | 2.5% |
| Total | 431 | 100.0% |
Employment Status by Age in Cattaraugus
According to the labor force statistics for Cattaraugus, out of the total population over 16 years of age (847), 57.0% or 483 individuals are in the labor force, with 8.1% or 39 of them unemployed. The age group with the highest labor force participation rate is 35 to 44 years, with 87.4% or 104 individuals in the labor force. Within the labor force, the 16 to 19 years age range has the highest percentage of unemployed individuals, with 51.6% or 16 of them being unemployed.
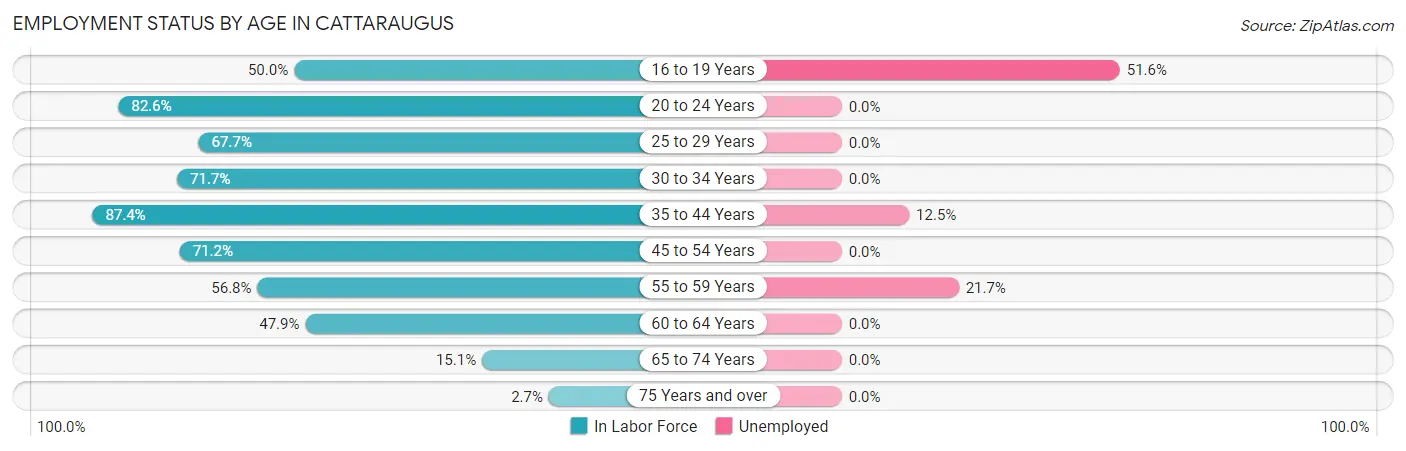
| Age Bracket | In Labor Force | Unemployed |
| 16 to 19 Years | 31 (50.0%) | 16 (51.6%) |
| 20 to 24 Years | 57 (82.6%) | 0 (0.0%) |
| 25 to 29 Years | 63 (67.7%) | 0 (0.0%) |
| 30 to 34 Years | 38 (71.7%) | 0 (0.0%) |
| 35 to 44 Years | 104 (87.4%) | 13 (12.5%) |
| 45 to 54 Years | 94 (71.2%) | 0 (0.0%) |
| 55 to 59 Years | 46 (56.8%) | 10 (21.7%) |
| 60 to 64 Years | 34 (47.9%) | 0 (0.0%) |
| 65 to 74 Years | 14 (15.1%) | 0 (0.0%) |
| 75 Years and over | 2 (2.7%) | 0 (0.0%) |
| Total | 483 (57.0%) | 39 (8.1%) |
Employment Status by Educational Attainment in Cattaraugus
According to labor force statistics for Cattaraugus, 69.0% of individuals (379) out of the total population between 25 and 64 years of age (549) are in the labor force, with 6.1% or 23 of them being unemployed. The group with the highest labor force participation rate are those with the educational attainment of college / associate degree, with 81.4% or 118 individuals in the labor force. Within the labor force, individuals with high school diploma education have the highest percentage of unemployment, with 13.3% or 20 of them being unemployed.
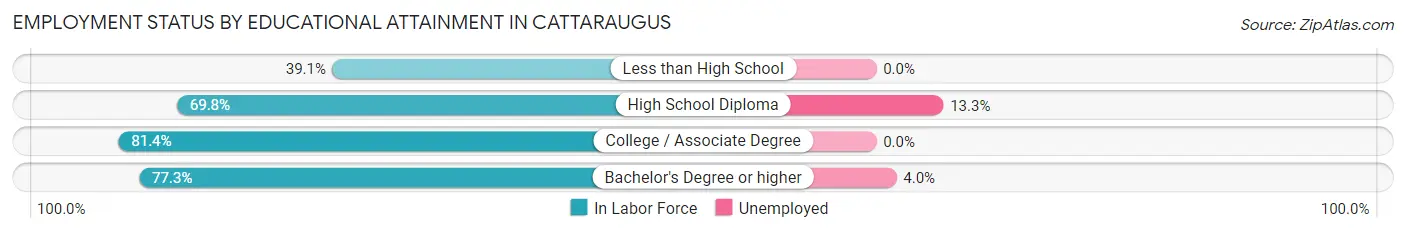
| Educational Attainment | In Labor Force | Unemployed |
| Less than High School | 36 (39.1%) | 0 (0.0%) |
| High School Diploma | 150 (69.8%) | 29 (13.3%) |
| College / Associate Degree | 118 (81.4%) | 0 (0.0%) |
| Bachelor's Degree or higher | 75 (77.3%) | 4 (4.0%) |
| Total | 379 (69.0%) | 33 (6.1%) |
Employment Occupations by Sex in Cattaraugus
Management, Business, Science and Arts Occupations
The most common Management, Business, Science and Arts occupations in Cattaraugus are Community & Social Service (40 | 9.0%), Business & Financial (22 | 5.0%), Management (21 | 4.7%), Education Instruction & Library (19 | 4.3%), and Education, Arts & Media (16 | 3.6%).
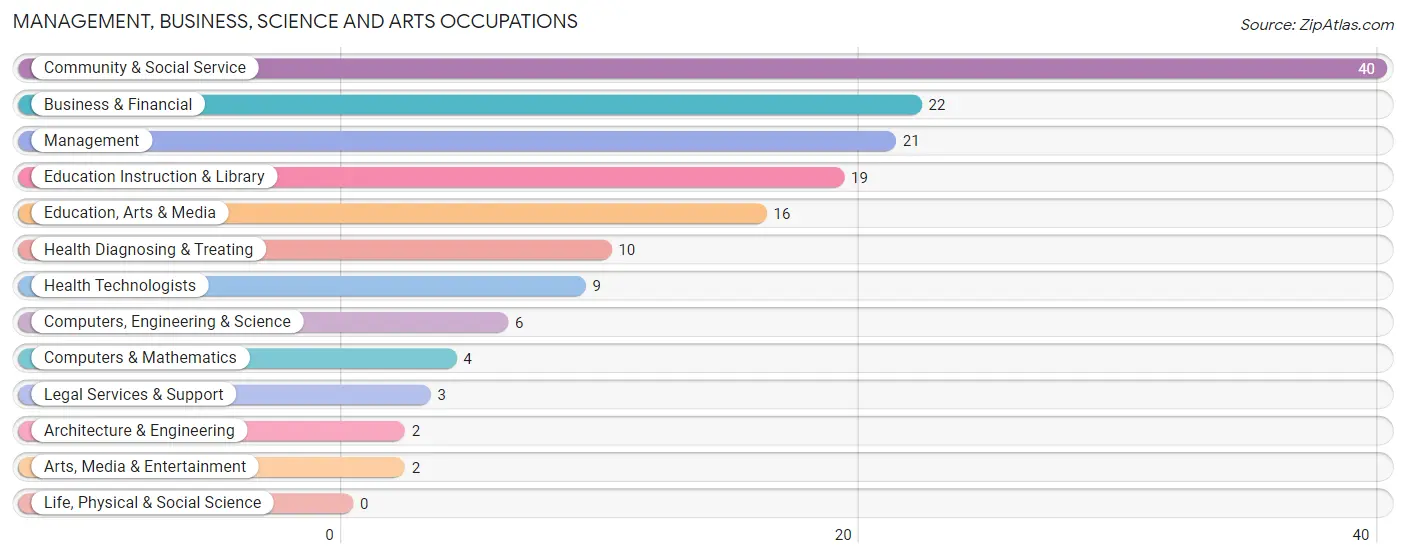
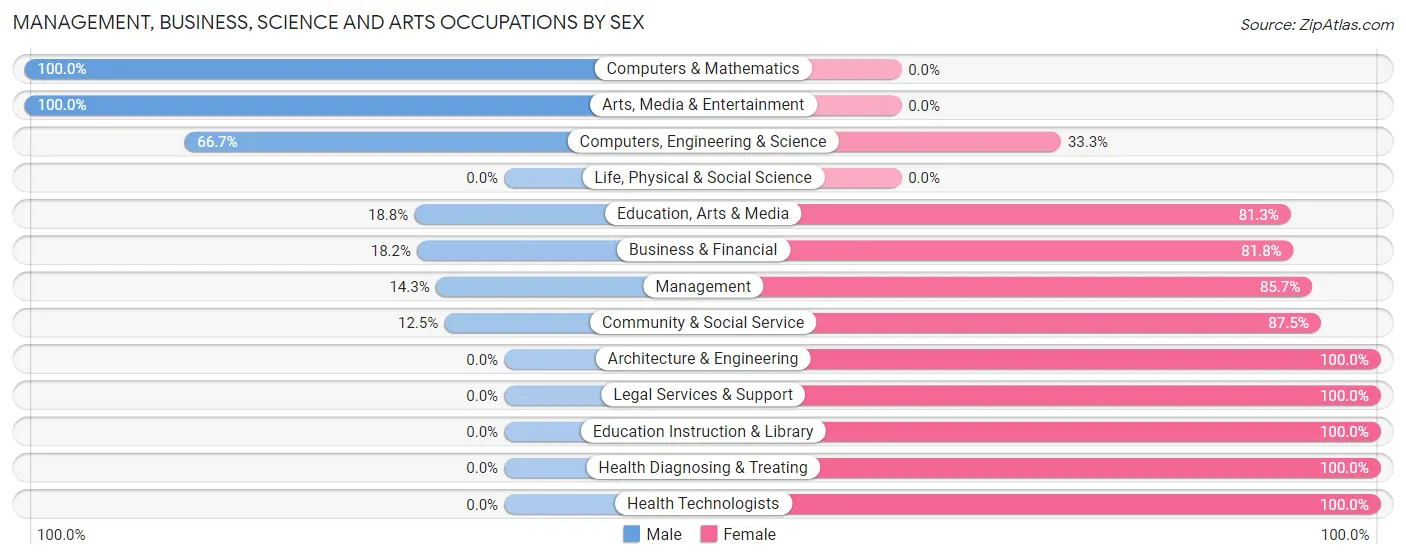
Management, Business, Science and Arts Occupations by Sex
Within the Management, Business, Science and Arts occupations in Cattaraugus, the most male-oriented occupations are Computers & Mathematics (100.0%), Arts, Media & Entertainment (100.0%), and Computers, Engineering & Science (66.7%), while the most female-oriented occupations are Architecture & Engineering (100.0%), Legal Services & Support (100.0%), and Education Instruction & Library (100.0%).
| Occupation | Male | Female |
| Management | 3 (14.3%) | 18 (85.7%) |
| Business & Financial | 4 (18.2%) | 18 (81.8%) |
| Computers, Engineering & Science | 4 (66.7%) | 2 (33.3%) |
| Computers & Mathematics | 4 (100.0%) | 0 (0.0%) |
| Architecture & Engineering | 0 (0.0%) | 2 (100.0%) |
| Life, Physical & Social Science | 0 (0.0%) | 0 (0.0%) |
| Community & Social Service | 5 (12.5%) | 35 (87.5%) |
| Education, Arts & Media | 3 (18.8%) | 13 (81.2%) |
| Legal Services & Support | 0 (0.0%) | 3 (100.0%) |
| Education Instruction & Library | 0 (0.0%) | 19 (100.0%) |
| Arts, Media & Entertainment | 2 (100.0%) | 0 (0.0%) |
| Health Diagnosing & Treating | 0 (0.0%) | 10 (100.0%) |
| Health Technologists | 0 (0.0%) | 9 (100.0%) |
| Total (Category) | 16 (16.2%) | 83 (83.8%) |
| Total (Overall) | 211 (47.5%) | 233 (52.5%) |
Services Occupations
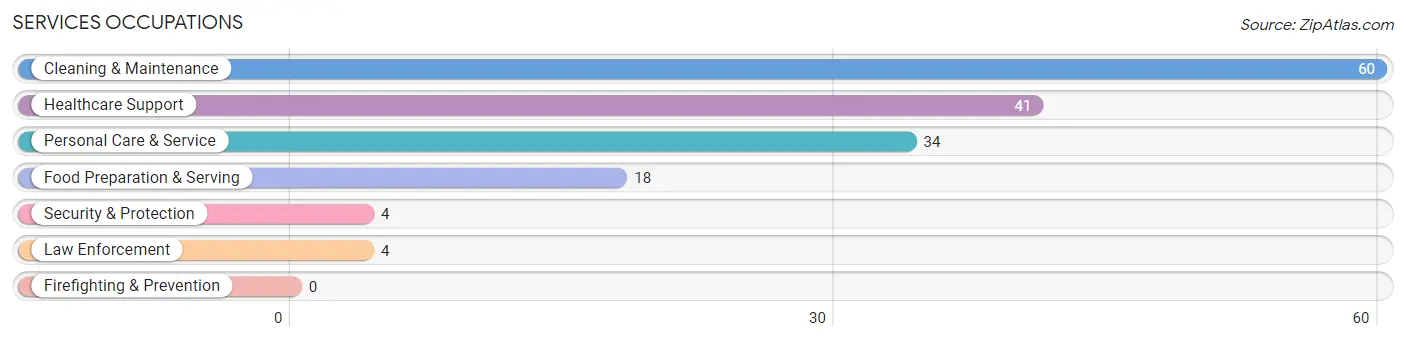
The most common Services occupations in Cattaraugus are Cleaning & Maintenance (60 | 13.5%), Healthcare Support (41 | 9.2%), Personal Care & Service (34 | 7.7%), Food Preparation & Serving (18 | 4.1%), and Security & Protection (4 | 0.9%).
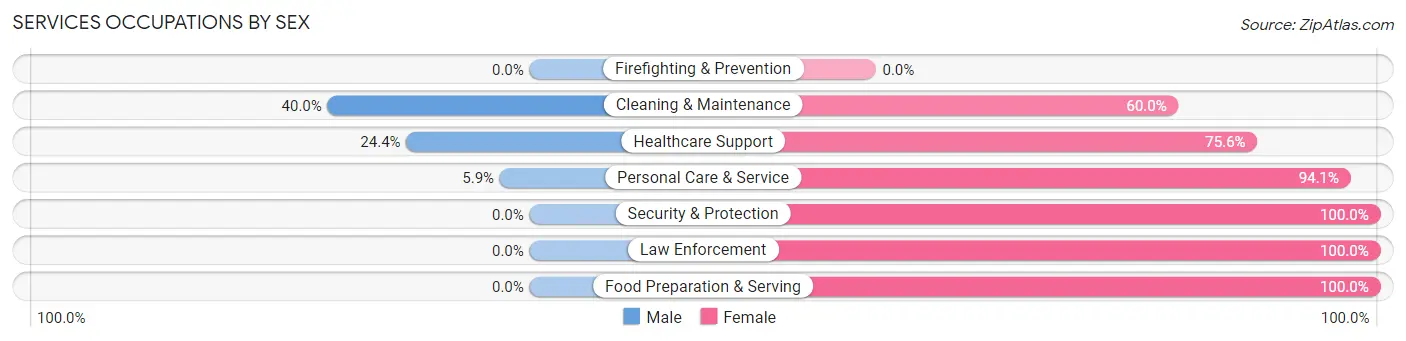
Services Occupations by Sex
Within the Services occupations in Cattaraugus, the most male-oriented occupations are Cleaning & Maintenance (40.0%), Healthcare Support (24.4%), and Personal Care & Service (5.9%), while the most female-oriented occupations are Security & Protection (100.0%), Law Enforcement (100.0%), and Food Preparation & Serving (100.0%).
| Occupation | Male | Female |
| Healthcare Support | 10 (24.4%) | 31 (75.6%) |
| Security & Protection | 0 (0.0%) | 4 (100.0%) |
| Firefighting & Prevention | 0 (0.0%) | 0 (0.0%) |
| Law Enforcement | 0 (0.0%) | 4 (100.0%) |
| Food Preparation & Serving | 0 (0.0%) | 18 (100.0%) |
| Cleaning & Maintenance | 24 (40.0%) | 36 (60.0%) |
| Personal Care & Service | 2 (5.9%) | 32 (94.1%) |
| Total (Category) | 36 (22.9%) | 121 (77.1%) |
| Total (Overall) | 211 (47.5%) | 233 (52.5%) |
Sales and Office Occupations
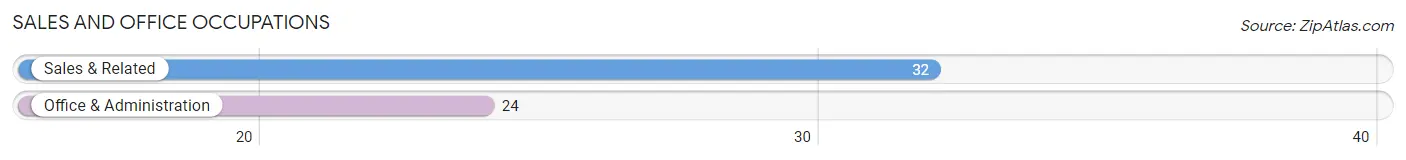
The most common Sales and Office occupations in Cattaraugus are Sales & Related (32 | 7.2%), and Office & Administration (24 | 5.4%).
Sales and Office Occupations by Sex
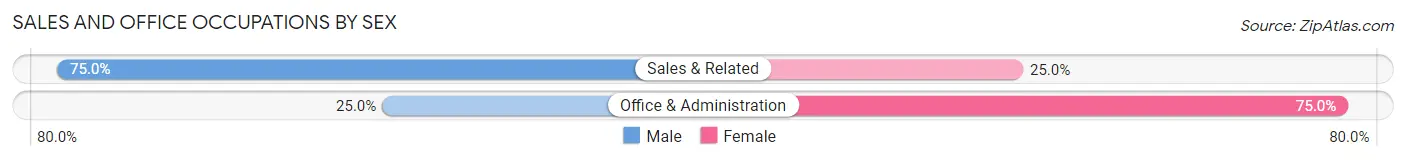
| Occupation | Male | Female |
| Sales & Related | 24 (75.0%) | 8 (25.0%) |
| Office & Administration | 6 (25.0%) | 18 (75.0%) |
| Total (Category) | 30 (53.6%) | 26 (46.4%) |
| Total (Overall) | 211 (47.5%) | 233 (52.5%) |
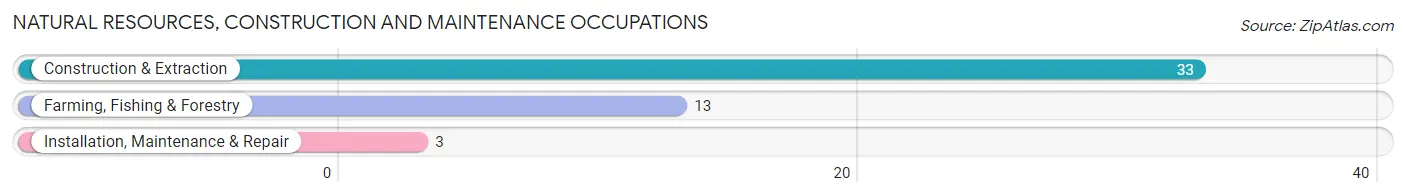
Natural Resources, Construction and Maintenance Occupations
The most common Natural Resources, Construction and Maintenance occupations in Cattaraugus are Construction & Extraction (33 | 7.4%), Farming, Fishing & Forestry (13 | 2.9%), and Installation, Maintenance & Repair (3 | 0.7%).
Natural Resources, Construction and Maintenance Occupations by Sex
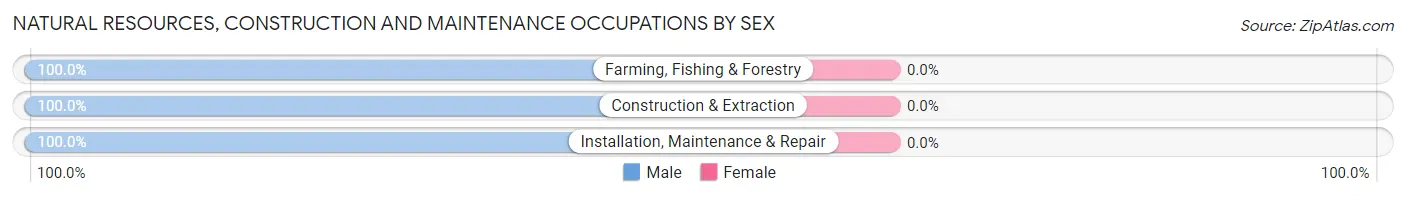
| Occupation | Male | Female |
| Farming, Fishing & Forestry | 13 (100.0%) | 0 (0.0%) |
| Construction & Extraction | 33 (100.0%) | 0 (0.0%) |
| Installation, Maintenance & Repair | 3 (100.0%) | 0 (0.0%) |
| Total (Category) | 49 (100.0%) | 0 (0.0%) |
| Total (Overall) | 211 (47.5%) | 233 (52.5%) |
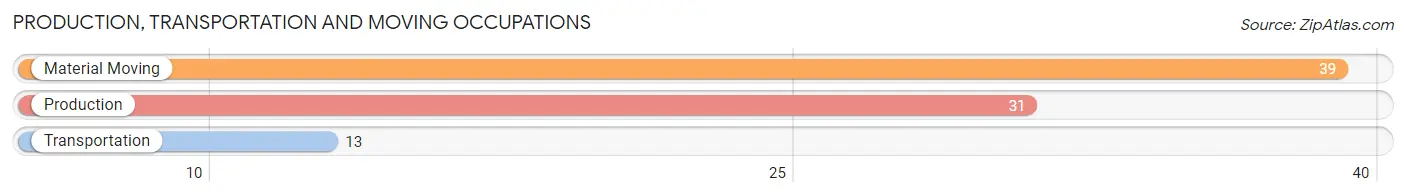
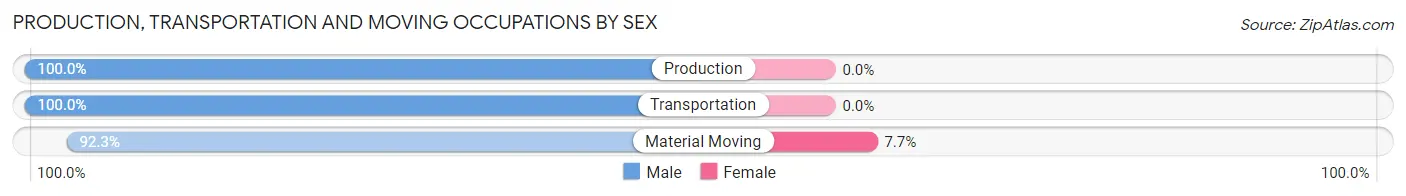
Production, Transportation and Moving Occupations
The most common Production, Transportation and Moving occupations in Cattaraugus are Material Moving (39 | 8.8%), Production (31 | 7.0%), and Transportation (13 | 2.9%).
Production, Transportation and Moving Occupations by Sex
| Occupation | Male | Female |
| Production | 31 (100.0%) | 0 (0.0%) |
| Transportation | 13 (100.0%) | 0 (0.0%) |
| Material Moving | 36 (92.3%) | 3 (7.7%) |
| Total (Category) | 80 (96.4%) | 3 (3.6%) |
| Total (Overall) | 211 (47.5%) | 233 (52.5%) |
Employment Industries by Sex in Cattaraugus
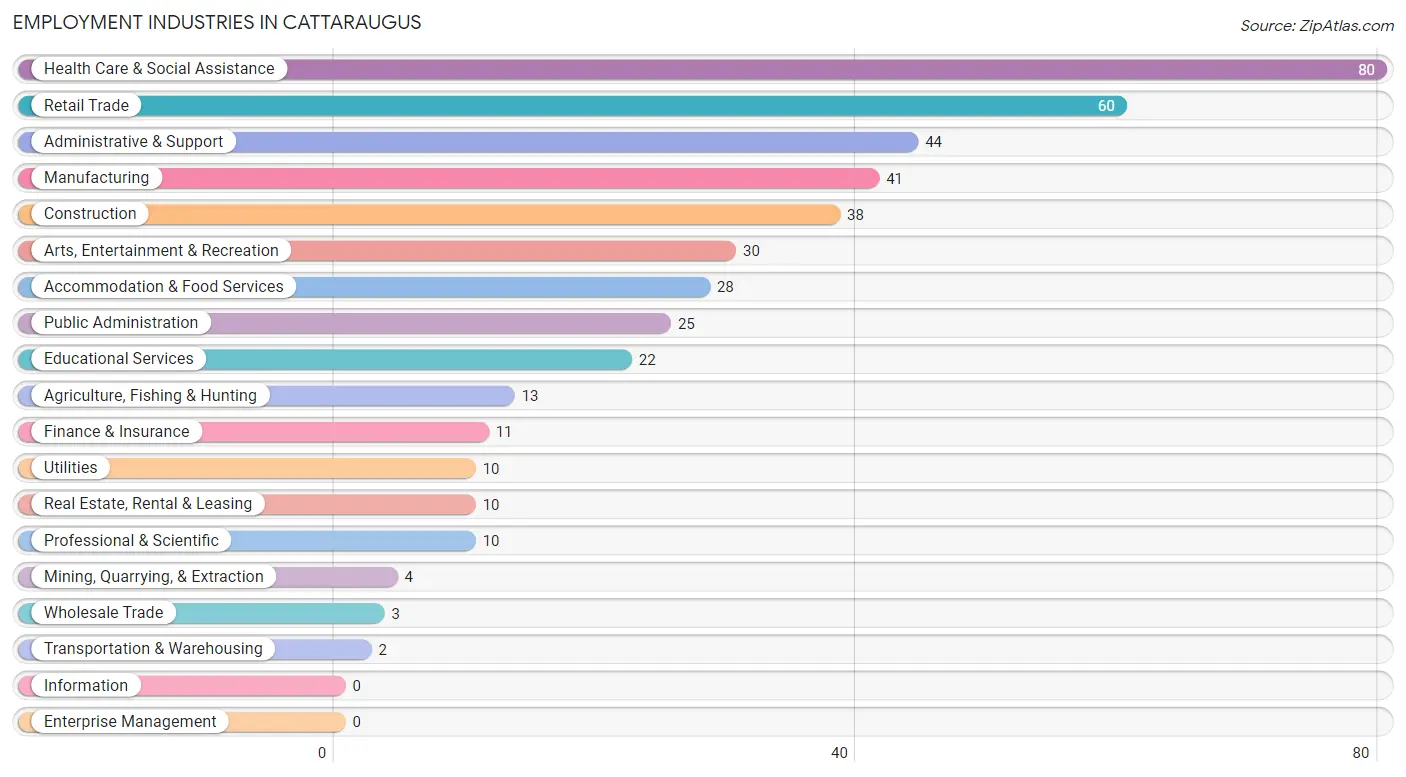
Employment Industries in Cattaraugus
The major employment industries in Cattaraugus include Health Care & Social Assistance (80 | 18.0%), Retail Trade (60 | 13.5%), Administrative & Support (44 | 9.9%), Manufacturing (41 | 9.2%), and Construction (38 | 8.6%).
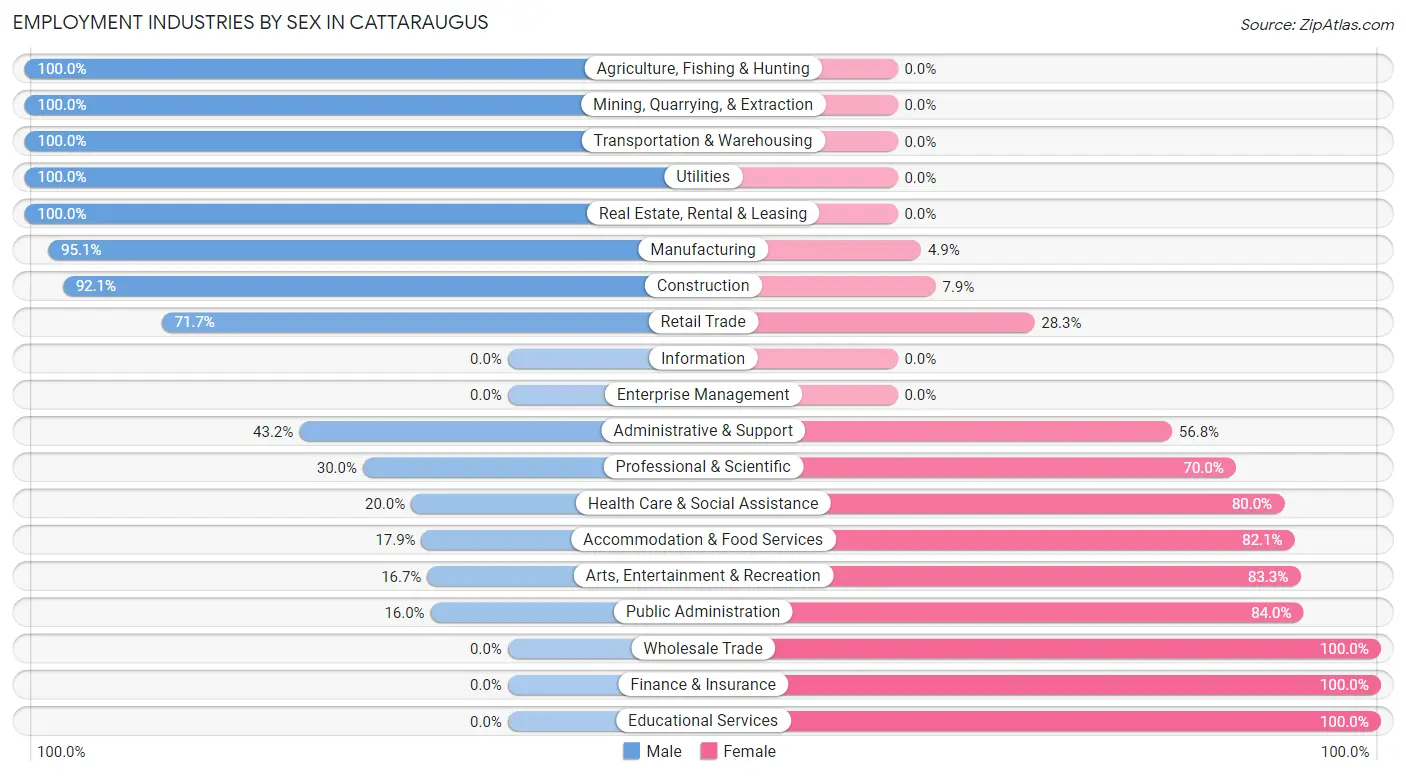
Employment Industries by Sex in Cattaraugus
The Cattaraugus industries that see more men than women are Agriculture, Fishing & Hunting (100.0%), Mining, Quarrying, & Extraction (100.0%), and Transportation & Warehousing (100.0%), whereas the industries that tend to have a higher number of women are Wholesale Trade (100.0%), Finance & Insurance (100.0%), and Educational Services (100.0%).
| Industry | Male | Female |
| Agriculture, Fishing & Hunting | 13 (100.0%) | 0 (0.0%) |
| Mining, Quarrying, & Extraction | 4 (100.0%) | 0 (0.0%) |
| Construction | 35 (92.1%) | 3 (7.9%) |
| Manufacturing | 39 (95.1%) | 2 (4.9%) |
| Wholesale Trade | 0 (0.0%) | 3 (100.0%) |
| Retail Trade | 43 (71.7%) | 17 (28.3%) |
| Transportation & Warehousing | 2 (100.0%) | 0 (0.0%) |
| Utilities | 10 (100.0%) | 0 (0.0%) |
| Information | 0 (0.0%) | 0 (0.0%) |
| Finance & Insurance | 0 (0.0%) | 11 (100.0%) |
| Real Estate, Rental & Leasing | 10 (100.0%) | 0 (0.0%) |
| Professional & Scientific | 3 (30.0%) | 7 (70.0%) |
| Enterprise Management | 0 (0.0%) | 0 (0.0%) |
| Administrative & Support | 19 (43.2%) | 25 (56.8%) |
| Educational Services | 0 (0.0%) | 22 (100.0%) |
| Health Care & Social Assistance | 16 (20.0%) | 64 (80.0%) |
| Arts, Entertainment & Recreation | 5 (16.7%) | 25 (83.3%) |
| Accommodation & Food Services | 5 (17.9%) | 23 (82.1%) |
| Public Administration | 4 (16.0%) | 21 (84.0%) |
| Total | 211 (47.5%) | 233 (52.5%) |
Education in Cattaraugus
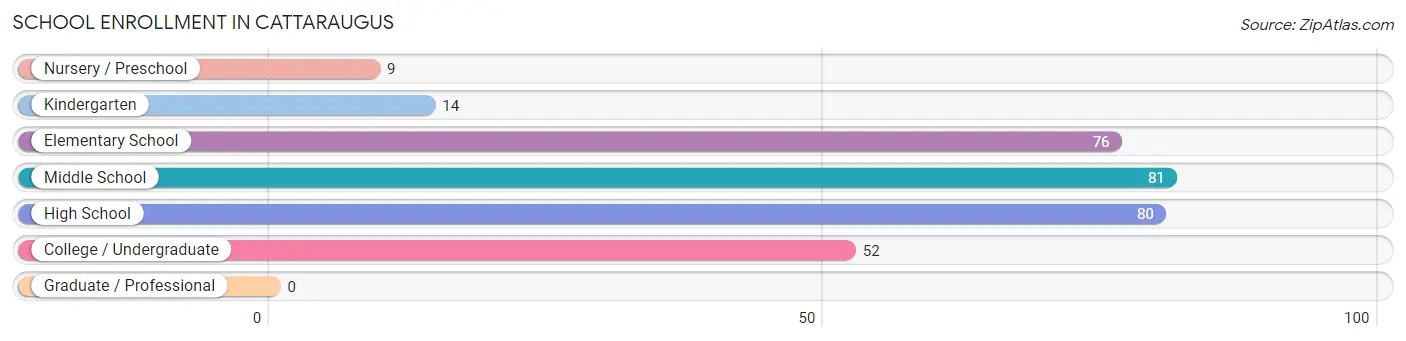
School Enrollment in Cattaraugus
The most common levels of schooling among the 312 students in Cattaraugus are middle school (81 | 26.0%), high school (80 | 25.6%), and elementary school (76 | 24.4%).
| School Level | # Students | % Students |
| Nursery / Preschool | 9 | 2.9% |
| Kindergarten | 14 | 4.5% |
| Elementary School | 76 | 24.4% |
| Middle School | 81 | 26.0% |
| High School | 80 | 25.6% |
| College / Undergraduate | 52 | 16.7% |
| Graduate / Professional | 0 | 0.0% |
| Total | 312 | 100.0% |
School Enrollment by Age by Funding Source in Cattaraugus
Out of a total of 312 students who are enrolled in schools in Cattaraugus, 14 (4.5%) attend a private institution, while the remaining 298 (95.5%) are enrolled in public schools. The age group of 35 years and over has the highest likelihood of being enrolled in private schools, with 3 (17.6% in the age bracket) enrolled. Conversely, the age group of 3 to 4 year olds has the lowest likelihood of being enrolled in a private school, with 9 (100.0% in the age bracket) attending a public institution.
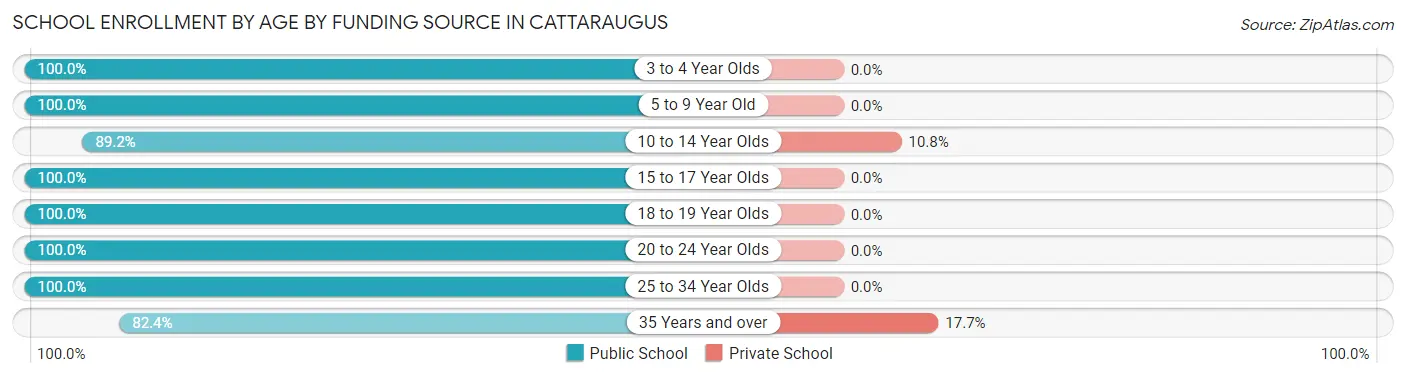
| Age Bracket | Public School | Private School |
| 3 to 4 Year Olds | 9 (100.0%) | 0 (0.0%) |
| 5 to 9 Year Old | 90 (100.0%) | 0 (0.0%) |
| 10 to 14 Year Olds | 91 (89.2%) | 11 (10.8%) |
| 15 to 17 Year Olds | 56 (100.0%) | 0 (0.0%) |
| 18 to 19 Year Olds | 10 (100.0%) | 0 (0.0%) |
| 20 to 24 Year Olds | 21 (100.0%) | 0 (0.0%) |
| 25 to 34 Year Olds | 7 (100.0%) | 0 (0.0%) |
| 35 Years and over | 14 (82.4%) | 3 (17.6%) |
| Total | 298 (95.5%) | 14 (4.5%) |
Educational Attainment by Field of Study in Cattaraugus
Arts & humanities (33 | 27.7%), education (26 | 21.8%), business (18 | 15.1%), science & technology (9 | 7.6%), and literature & languages (7 | 5.9%) are the most common fields of study among 119 individuals in Cattaraugus who have obtained a bachelor's degree or higher.
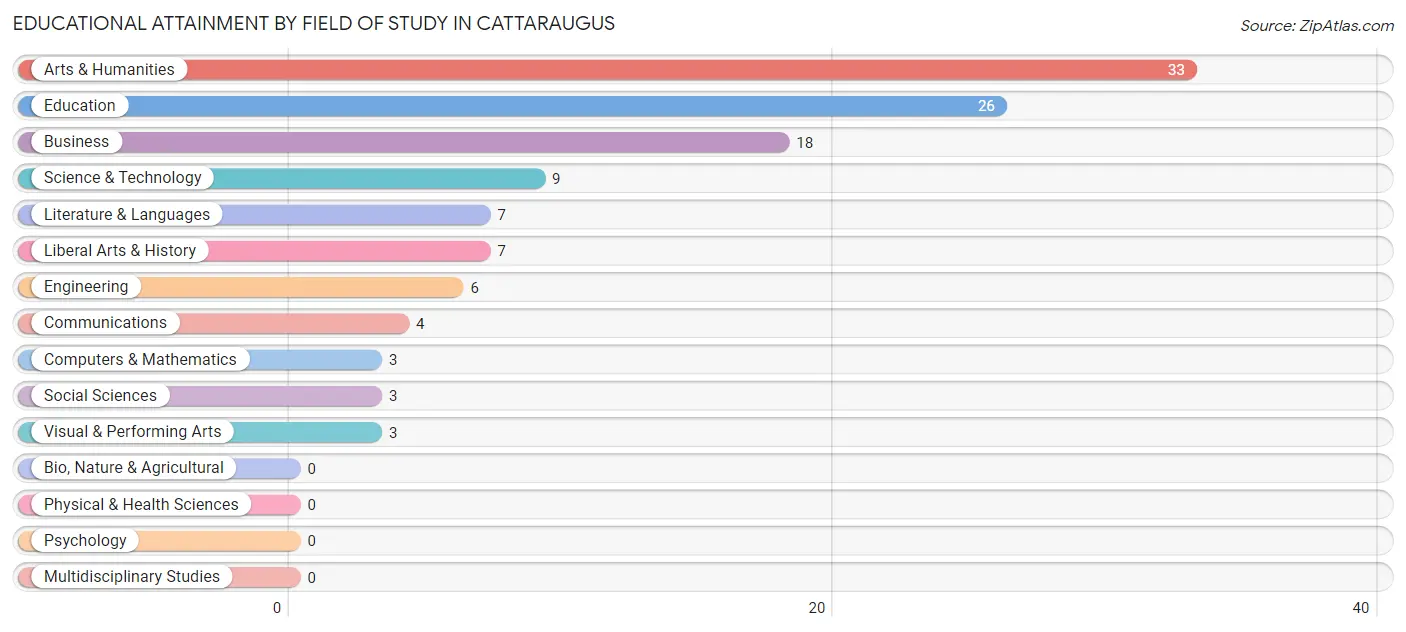
| Field of Study | # Graduates | % Graduates |
| Computers & Mathematics | 3 | 2.5% |
| Bio, Nature & Agricultural | 0 | 0.0% |
| Physical & Health Sciences | 0 | 0.0% |
| Psychology | 0 | 0.0% |
| Social Sciences | 3 | 2.5% |
| Engineering | 6 | 5.0% |
| Multidisciplinary Studies | 0 | 0.0% |
| Science & Technology | 9 | 7.6% |
| Business | 18 | 15.1% |
| Education | 26 | 21.8% |
| Literature & Languages | 7 | 5.9% |
| Liberal Arts & History | 7 | 5.9% |
| Visual & Performing Arts | 3 | 2.5% |
| Communications | 4 | 3.4% |
| Arts & Humanities | 33 | 27.7% |
| Total | 119 | 100.0% |
Transportation & Commute in Cattaraugus
Vehicle Availability by Sex in Cattaraugus
The most prevalent vehicle ownership categories in Cattaraugus are males with 2 vehicles (97, accounting for 48.0%) and females with 2 vehicles (81, making up 42.4%).
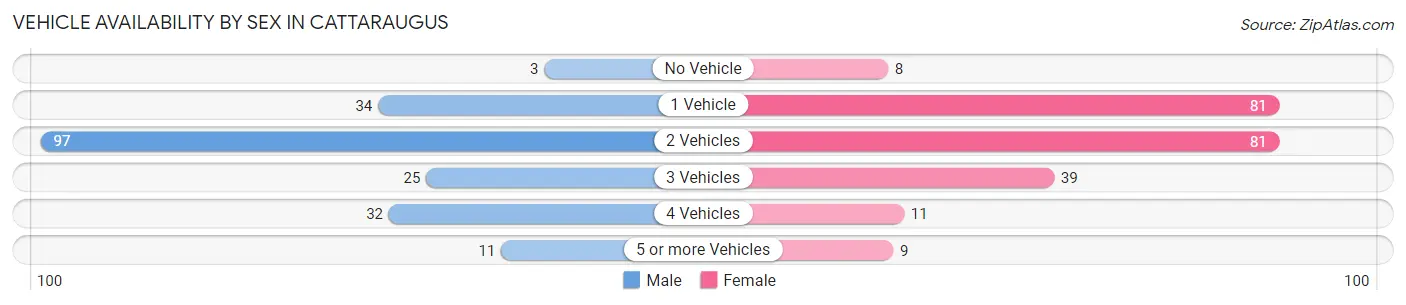
| Vehicles Available | Male | Female |
| No Vehicle | 3 (1.5%) | 8 (3.5%) |
| 1 Vehicle | 34 (16.8%) | 81 (35.4%) |
| 2 Vehicles | 97 (48.0%) | 81 (35.4%) |
| 3 Vehicles | 25 (12.4%) | 39 (17.0%) |
| 4 Vehicles | 32 (15.8%) | 11 (4.8%) |
| 5 or more Vehicles | 11 (5.4%) | 9 (3.9%) |
| Total | 202 (100.0%) | 229 (100.0%) |
Commute Time in Cattaraugus
The most frequently occuring commute durations in Cattaraugus are 45 to 59 minutes (92 commuters, 23.4%), 60 to 89 minutes (55 commuters, 14.0%), and 5 to 9 minutes (54 commuters, 13.7%).
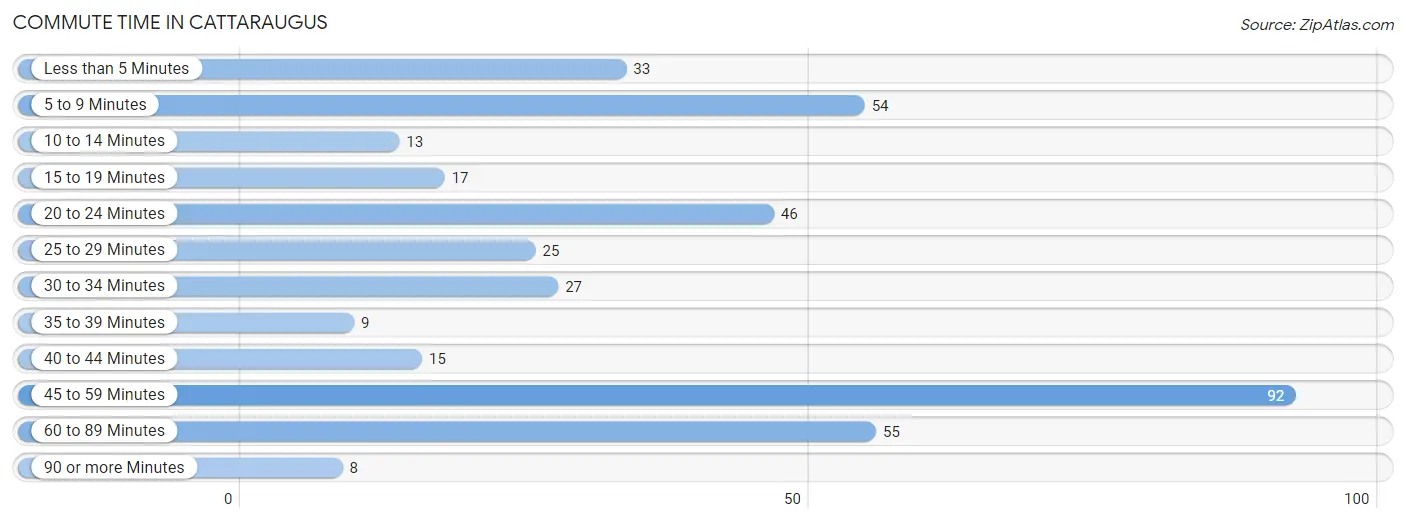
| Commute Time | # Commuters | % Commuters |
| Less than 5 Minutes | 33 | 8.4% |
| 5 to 9 Minutes | 54 | 13.7% |
| 10 to 14 Minutes | 13 | 3.3% |
| 15 to 19 Minutes | 17 | 4.3% |
| 20 to 24 Minutes | 46 | 11.7% |
| 25 to 29 Minutes | 25 | 6.4% |
| 30 to 34 Minutes | 27 | 6.9% |
| 35 to 39 Minutes | 9 | 2.3% |
| 40 to 44 Minutes | 15 | 3.8% |
| 45 to 59 Minutes | 92 | 23.4% |
| 60 to 89 Minutes | 55 | 14.0% |
| 90 or more Minutes | 8 | 2.0% |
Commute Time by Sex in Cattaraugus
The most common commute times in Cattaraugus are 60 to 89 minutes (43 commuters, 24.3%) for males and 45 to 59 minutes (75 commuters, 34.6%) for females.
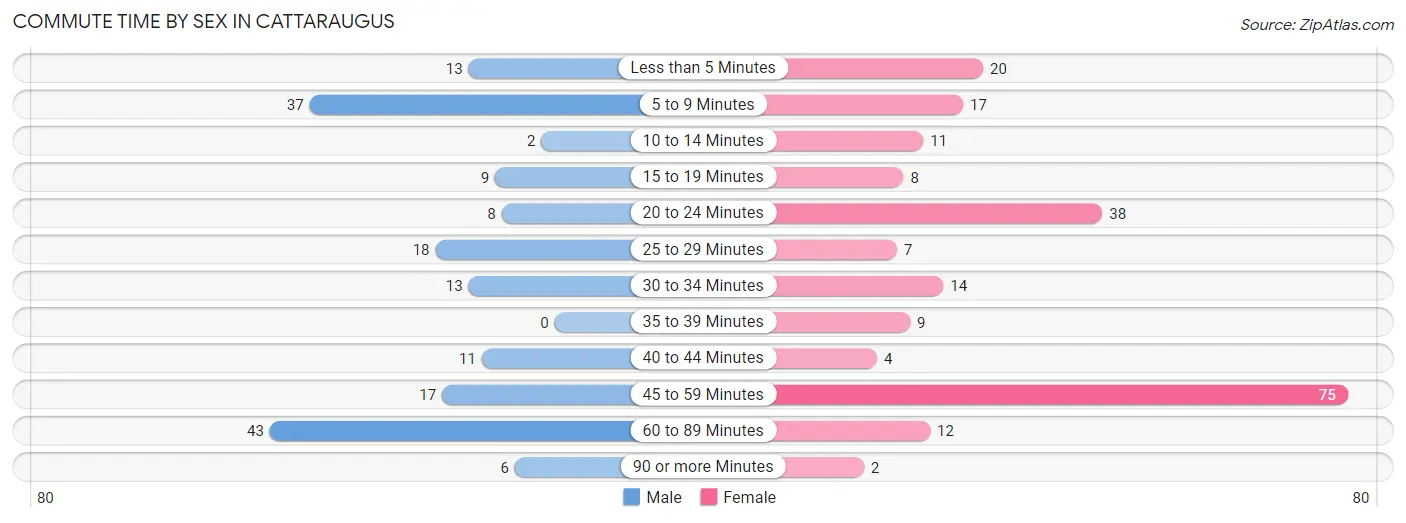
| Commute Time | Male | Female |
| Less than 5 Minutes | 13 (7.3%) | 20 (9.2%) |
| 5 to 9 Minutes | 37 (20.9%) | 17 (7.8%) |
| 10 to 14 Minutes | 2 (1.1%) | 11 (5.1%) |
| 15 to 19 Minutes | 9 (5.1%) | 8 (3.7%) |
| 20 to 24 Minutes | 8 (4.5%) | 38 (17.5%) |
| 25 to 29 Minutes | 18 (10.2%) | 7 (3.2%) |
| 30 to 34 Minutes | 13 (7.3%) | 14 (6.5%) |
| 35 to 39 Minutes | 0 (0.0%) | 9 (4.2%) |
| 40 to 44 Minutes | 11 (6.2%) | 4 (1.8%) |
| 45 to 59 Minutes | 17 (9.6%) | 75 (34.6%) |
| 60 to 89 Minutes | 43 (24.3%) | 12 (5.5%) |
| 90 or more Minutes | 6 (3.4%) | 2 (0.9%) |
Time of Departure to Work by Sex in Cattaraugus
The most frequent times of departure to work in Cattaraugus are 6:00 AM to 6:29 AM (31, 17.5%) for males and 6:30 AM to 6:59 AM (54, 24.9%) for females.
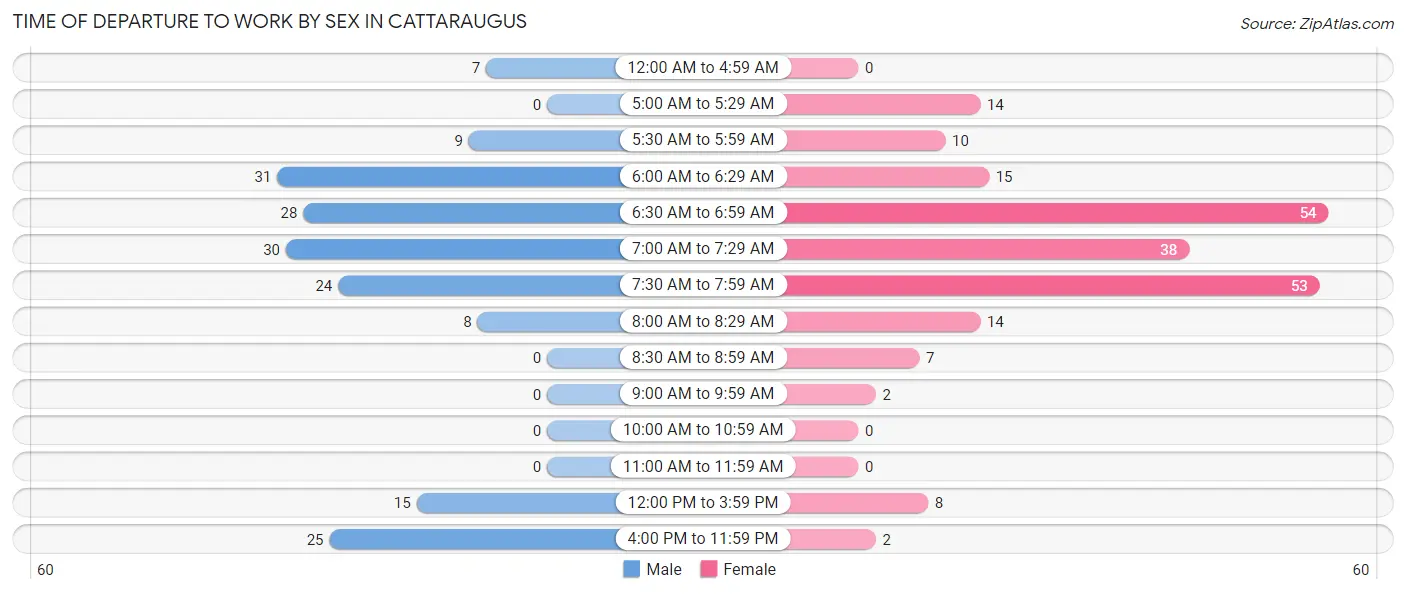
| Time of Departure | Male | Female |
| 12:00 AM to 4:59 AM | 7 (4.0%) | 0 (0.0%) |
| 5:00 AM to 5:29 AM | 0 (0.0%) | 14 (6.5%) |
| 5:30 AM to 5:59 AM | 9 (5.1%) | 10 (4.6%) |
| 6:00 AM to 6:29 AM | 31 (17.5%) | 15 (6.9%) |
| 6:30 AM to 6:59 AM | 28 (15.8%) | 54 (24.9%) |
| 7:00 AM to 7:29 AM | 30 (17.0%) | 38 (17.5%) |
| 7:30 AM to 7:59 AM | 24 (13.6%) | 53 (24.4%) |
| 8:00 AM to 8:29 AM | 8 (4.5%) | 14 (6.5%) |
| 8:30 AM to 8:59 AM | 0 (0.0%) | 7 (3.2%) |
| 9:00 AM to 9:59 AM | 0 (0.0%) | 2 (0.9%) |
| 10:00 AM to 10:59 AM | 0 (0.0%) | 0 (0.0%) |
| 11:00 AM to 11:59 AM | 0 (0.0%) | 0 (0.0%) |
| 12:00 PM to 3:59 PM | 15 (8.5%) | 8 (3.7%) |
| 4:00 PM to 11:59 PM | 25 (14.1%) | 2 (0.9%) |
| Total | 177 (100.0%) | 217 (100.0%) |
Housing Occupancy in Cattaraugus
Occupancy by Ownership in Cattaraugus
Of the total 419 dwellings in Cattaraugus, owner-occupied units account for 281 (67.1%), while renter-occupied units make up 138 (32.9%).
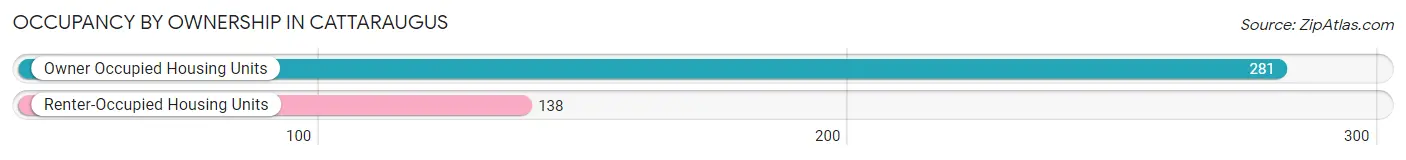
| Occupancy | # Housing Units | % Housing Units |
| Owner Occupied Housing Units | 281 | 67.1% |
| Renter-Occupied Housing Units | 138 | 32.9% |
| Total Occupied Housing Units | 419 | 100.0% |
Occupancy by Household Size in Cattaraugus
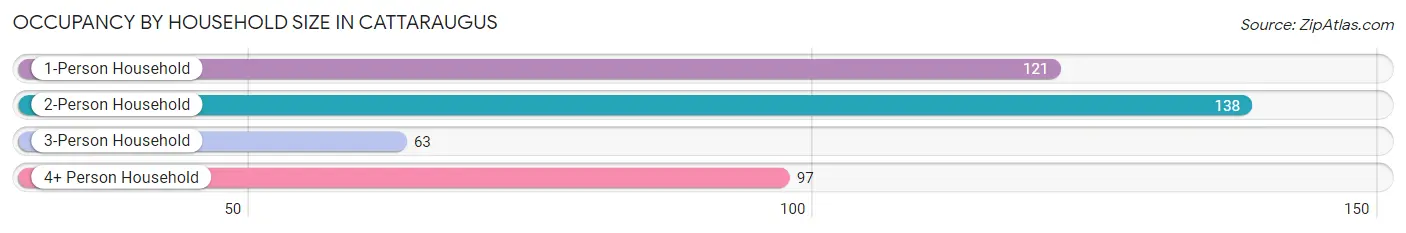
| Household Size | # Housing Units | % Housing Units |
| 1-Person Household | 121 | 28.9% |
| 2-Person Household | 138 | 32.9% |
| 3-Person Household | 63 | 15.0% |
| 4+ Person Household | 97 | 23.2% |
| Total Housing Units | 419 | 100.0% |
Occupancy by Ownership by Household Size in Cattaraugus
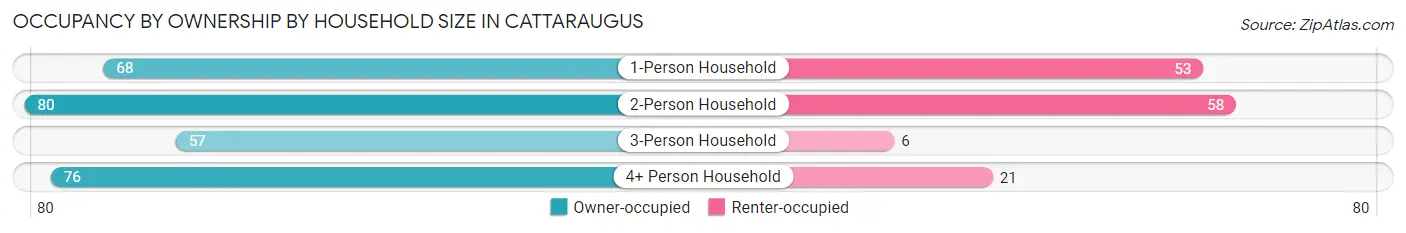
| Household Size | Owner-occupied | Renter-occupied |
| 1-Person Household | 68 (56.2%) | 53 (43.8%) |
| 2-Person Household | 80 (58.0%) | 58 (42.0%) |
| 3-Person Household | 57 (90.5%) | 6 (9.5%) |
| 4+ Person Household | 76 (78.3%) | 21 (21.6%) |
| Total Housing Units | 281 (67.1%) | 138 (32.9%) |
Occupancy by Educational Attainment in Cattaraugus
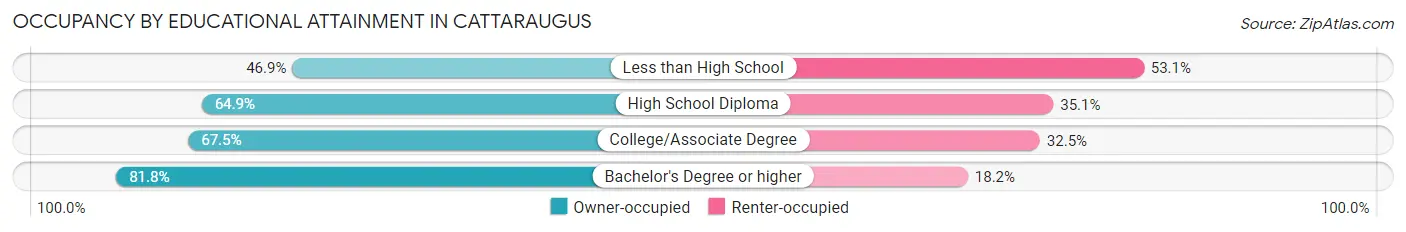
| Household Size | Owner-occupied | Renter-occupied |
| Less than High School | 23 (46.9%) | 26 (53.1%) |
| High School Diploma | 109 (64.9%) | 59 (35.1%) |
| College/Associate Degree | 77 (67.5%) | 37 (32.5%) |
| Bachelor's Degree or higher | 72 (81.8%) | 16 (18.2%) |
Occupancy by Age of Householder in Cattaraugus
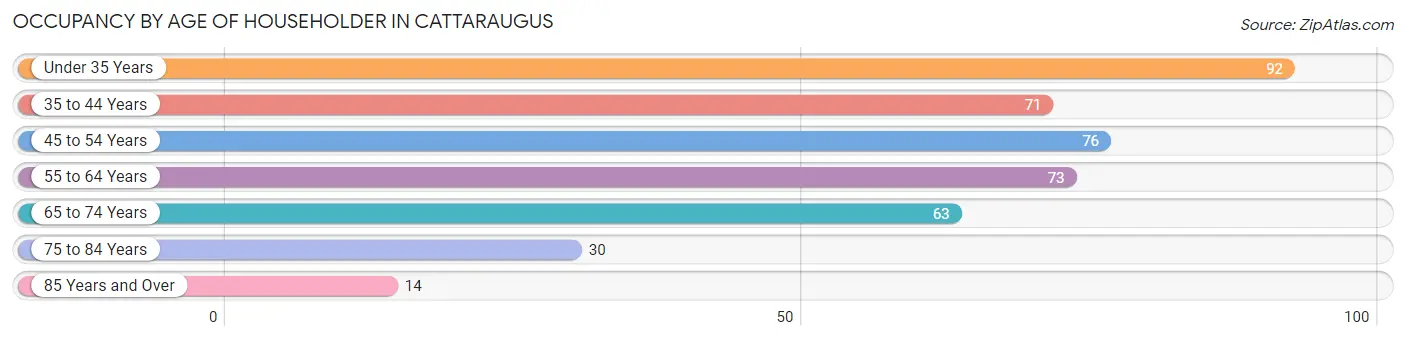
| Age Bracket | # Households | % Households |
| Under 35 Years | 92 | 22.0% |
| 35 to 44 Years | 71 | 17.0% |
| 45 to 54 Years | 76 | 18.1% |
| 55 to 64 Years | 73 | 17.4% |
| 65 to 74 Years | 63 | 15.0% |
| 75 to 84 Years | 30 | 7.2% |
| 85 Years and Over | 14 | 3.3% |
| Total | 419 | 100.0% |
Housing Finances in Cattaraugus
Median Income by Occupancy in Cattaraugus
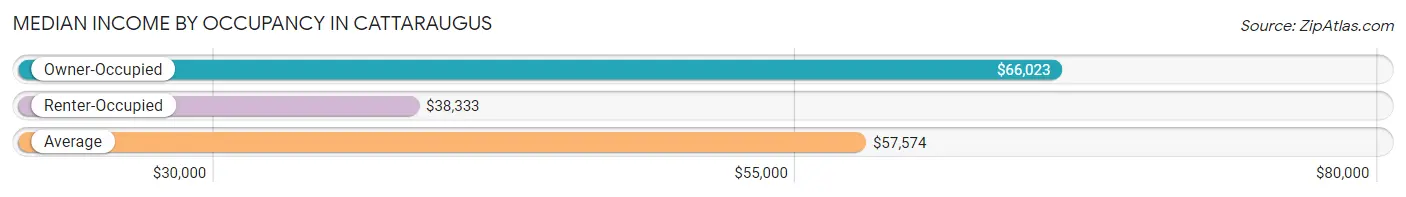
| Occupancy Type | # Households | Median Income |
| Owner-Occupied | 281 (67.1%) | $66,023 |
| Renter-Occupied | 138 (32.9%) | $38,333 |
| Average | 419 (100.0%) | $57,574 |
Occupancy by Householder Income Bracket in Cattaraugus
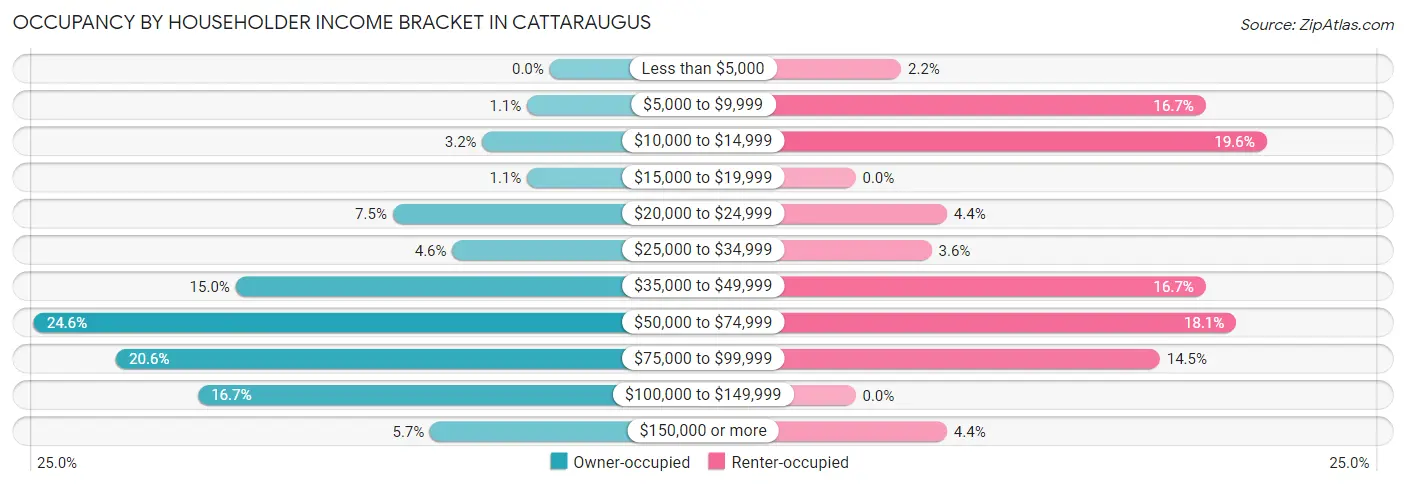
| Income Bracket | Owner-occupied | Renter-occupied |
| Less than $5,000 | 0 (0.0%) | 3 (2.2%) |
| $5,000 to $9,999 | 3 (1.1%) | 23 (16.7%) |
| $10,000 to $14,999 | 9 (3.2%) | 27 (19.6%) |
| $15,000 to $19,999 | 3 (1.1%) | 0 (0.0%) |
| $20,000 to $24,999 | 21 (7.5%) | 6 (4.3%) |
| $25,000 to $34,999 | 13 (4.6%) | 5 (3.6%) |
| $35,000 to $49,999 | 42 (14.9%) | 23 (16.7%) |
| $50,000 to $74,999 | 69 (24.6%) | 25 (18.1%) |
| $75,000 to $99,999 | 58 (20.6%) | 20 (14.5%) |
| $100,000 to $149,999 | 47 (16.7%) | 0 (0.0%) |
| $150,000 or more | 16 (5.7%) | 6 (4.3%) |
| Total | 281 (100.0%) | 138 (100.0%) |
Monthly Housing Cost Tiers in Cattaraugus
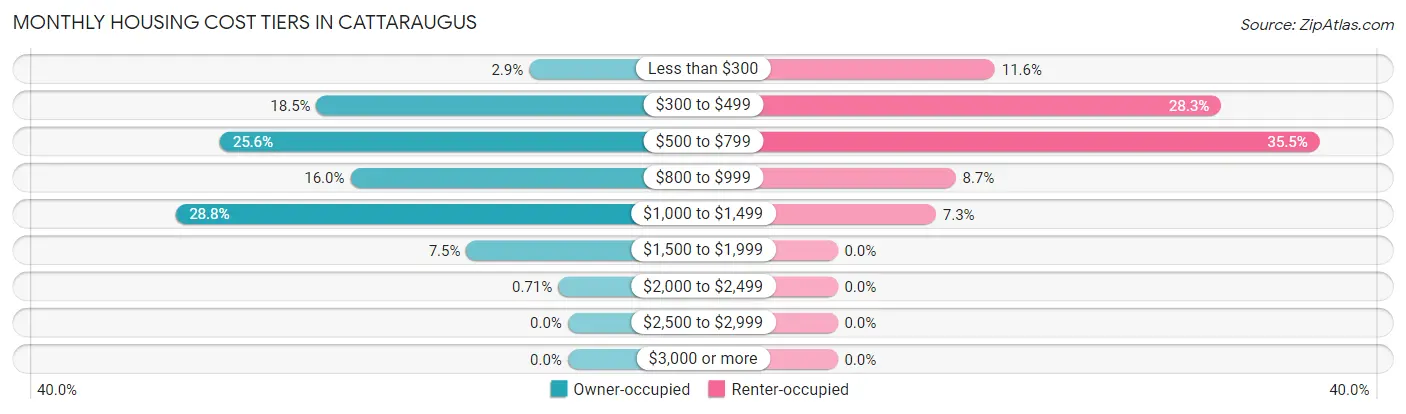
| Monthly Cost | Owner-occupied | Renter-occupied |
| Less than $300 | 8 (2.9%) | 16 (11.6%) |
| $300 to $499 | 52 (18.5%) | 39 (28.3%) |
| $500 to $799 | 72 (25.6%) | 49 (35.5%) |
| $800 to $999 | 45 (16.0%) | 12 (8.7%) |
| $1,000 to $1,499 | 81 (28.8%) | 10 (7.2%) |
| $1,500 to $1,999 | 21 (7.5%) | 0 (0.0%) |
| $2,000 to $2,499 | 2 (0.7%) | 0 (0.0%) |
| $2,500 to $2,999 | 0 (0.0%) | 0 (0.0%) |
| $3,000 or more | 0 (0.0%) | 0 (0.0%) |
| Total | 281 (100.0%) | 138 (100.0%) |
Physical Housing Characteristics in Cattaraugus
Housing Structures in Cattaraugus
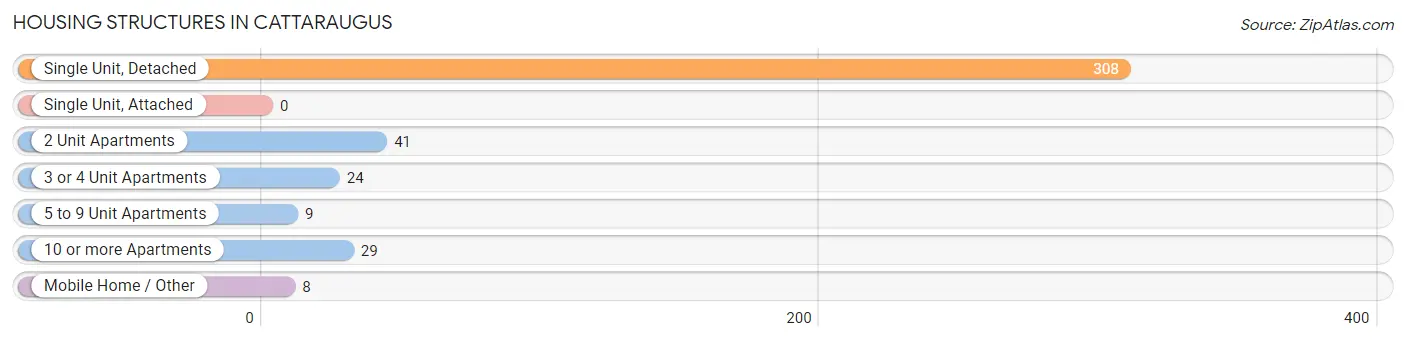
| Structure Type | # Housing Units | % Housing Units |
| Single Unit, Detached | 308 | 73.5% |
| Single Unit, Attached | 0 | 0.0% |
| 2 Unit Apartments | 41 | 9.8% |
| 3 or 4 Unit Apartments | 24 | 5.7% |
| 5 to 9 Unit Apartments | 9 | 2.1% |
| 10 or more Apartments | 29 | 6.9% |
| Mobile Home / Other | 8 | 1.9% |
| Total | 419 | 100.0% |
Housing Structures by Occupancy in Cattaraugus
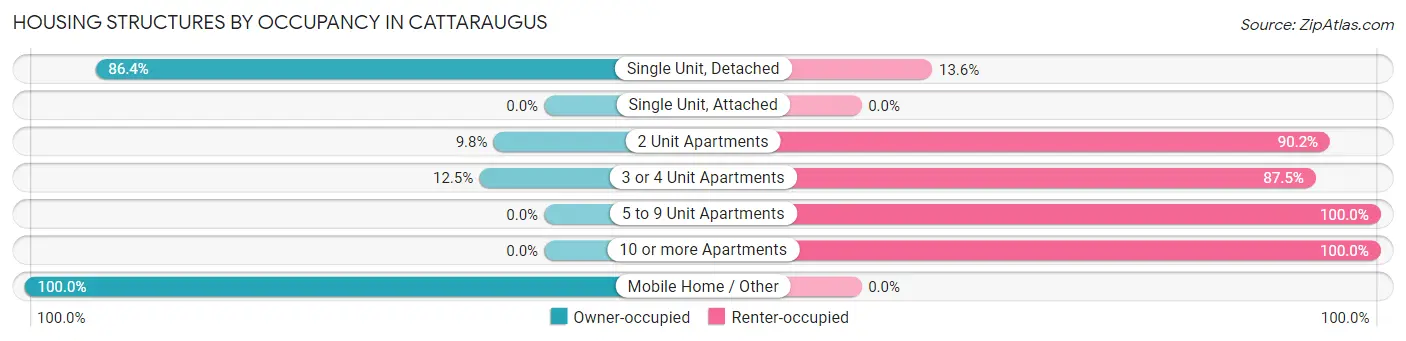
| Structure Type | Owner-occupied | Renter-occupied |
| Single Unit, Detached | 266 (86.4%) | 42 (13.6%) |
| Single Unit, Attached | 0 (0.0%) | 0 (0.0%) |
| 2 Unit Apartments | 4 (9.8%) | 37 (90.2%) |
| 3 or 4 Unit Apartments | 3 (12.5%) | 21 (87.5%) |
| 5 to 9 Unit Apartments | 0 (0.0%) | 9 (100.0%) |
| 10 or more Apartments | 0 (0.0%) | 29 (100.0%) |
| Mobile Home / Other | 8 (100.0%) | 0 (0.0%) |
| Total | 281 (67.1%) | 138 (32.9%) |
Housing Structures by Number of Rooms in Cattaraugus
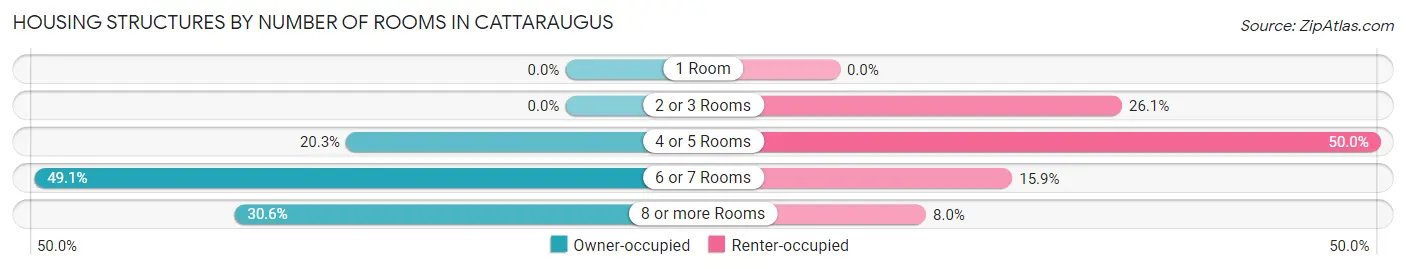
| Number of Rooms | Owner-occupied | Renter-occupied |
| 1 Room | 0 (0.0%) | 0 (0.0%) |
| 2 or 3 Rooms | 0 (0.0%) | 36 (26.1%) |
| 4 or 5 Rooms | 57 (20.3%) | 69 (50.0%) |
| 6 or 7 Rooms | 138 (49.1%) | 22 (15.9%) |
| 8 or more Rooms | 86 (30.6%) | 11 (8.0%) |
| Total | 281 (100.0%) | 138 (100.0%) |
Housing Structure by Heating Type in Cattaraugus
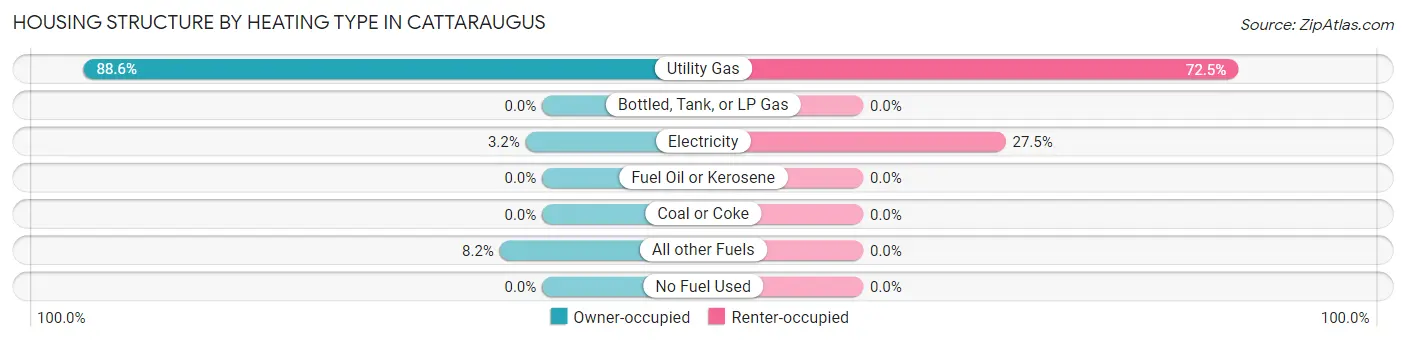
| Heating Type | Owner-occupied | Renter-occupied |
| Utility Gas | 249 (88.6%) | 100 (72.5%) |
| Bottled, Tank, or LP Gas | 0 (0.0%) | 0 (0.0%) |
| Electricity | 9 (3.2%) | 38 (27.5%) |
| Fuel Oil or Kerosene | 0 (0.0%) | 0 (0.0%) |
| Coal or Coke | 0 (0.0%) | 0 (0.0%) |
| All other Fuels | 23 (8.2%) | 0 (0.0%) |
| No Fuel Used | 0 (0.0%) | 0 (0.0%) |
| Total | 281 (100.0%) | 138 (100.0%) |
Household Vehicle Usage in Cattaraugus
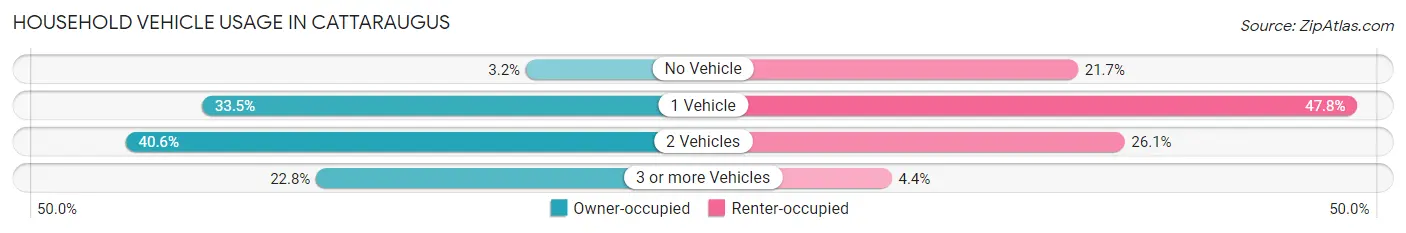
| Vehicles per Household | Owner-occupied | Renter-occupied |
| No Vehicle | 9 (3.2%) | 30 (21.7%) |
| 1 Vehicle | 94 (33.5%) | 66 (47.8%) |
| 2 Vehicles | 114 (40.6%) | 36 (26.1%) |
| 3 or more Vehicles | 64 (22.8%) | 6 (4.3%) |
| Total | 281 (100.0%) | 138 (100.0%) |
Real Estate & Mortgages in Cattaraugus
Real Estate and Mortgage Overview in Cattaraugus
| Characteristic | Without Mortgage | With Mortgage |
| Housing Units | 106 | 175 |
| Median Property Value | $70,000 | $90,600 |
| Median Household Income | $56,458 | $10 |
| Monthly Housing Costs | $508 | $0 |
| Real Estate Taxes | $2,162 | $6 |
Property Value by Mortgage Status in Cattaraugus
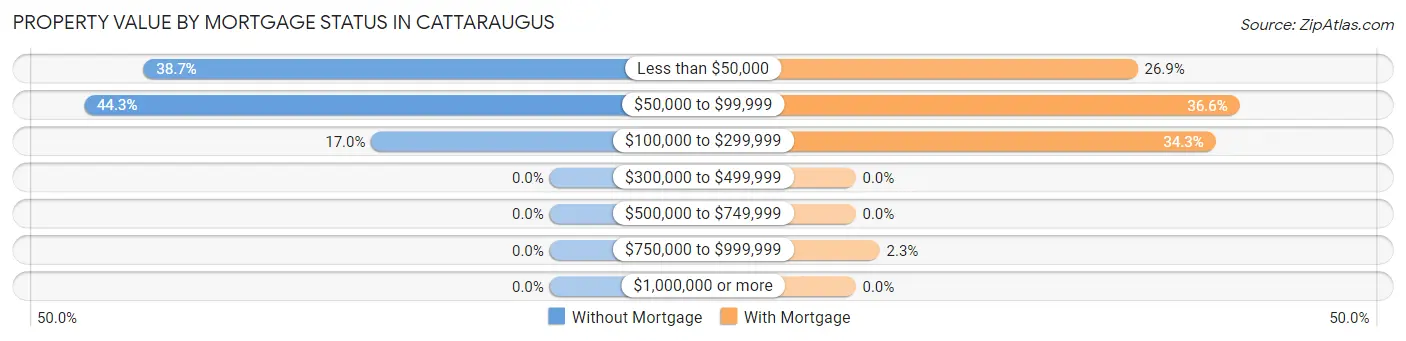
| Property Value | Without Mortgage | With Mortgage |
| Less than $50,000 | 41 (38.7%) | 47 (26.9%) |
| $50,000 to $99,999 | 47 (44.3%) | 64 (36.6%) |
| $100,000 to $299,999 | 18 (17.0%) | 60 (34.3%) |
| $300,000 to $499,999 | 0 (0.0%) | 0 (0.0%) |
| $500,000 to $749,999 | 0 (0.0%) | 0 (0.0%) |
| $750,000 to $999,999 | 0 (0.0%) | 4 (2.3%) |
| $1,000,000 or more | 0 (0.0%) | 0 (0.0%) |
| Total | 106 (100.0%) | 175 (100.0%) |
Household Income by Mortgage Status in Cattaraugus
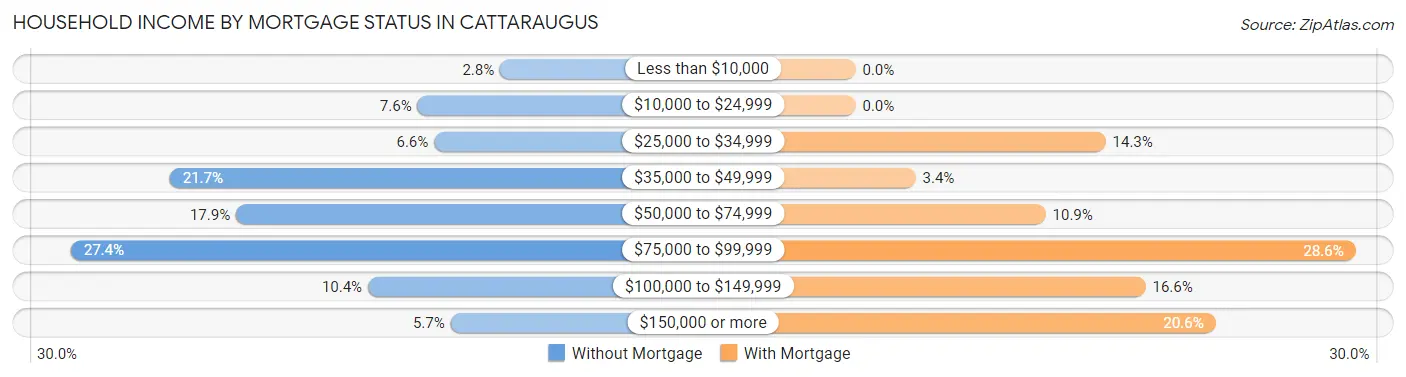
| Household Income | Without Mortgage | With Mortgage |
| Less than $10,000 | 3 (2.8%) | 0 (0.0%) |
| $10,000 to $24,999 | 8 (7.5%) | 0 (0.0%) |
| $25,000 to $34,999 | 7 (6.6%) | 25 (14.3%) |
| $35,000 to $49,999 | 23 (21.7%) | 6 (3.4%) |
| $50,000 to $74,999 | 19 (17.9%) | 19 (10.9%) |
| $75,000 to $99,999 | 29 (27.4%) | 50 (28.6%) |
| $100,000 to $149,999 | 11 (10.4%) | 29 (16.6%) |
| $150,000 or more | 6 (5.7%) | 36 (20.6%) |
| Total | 106 (100.0%) | 175 (100.0%) |
Property Value to Household Income Ratio in Cattaraugus
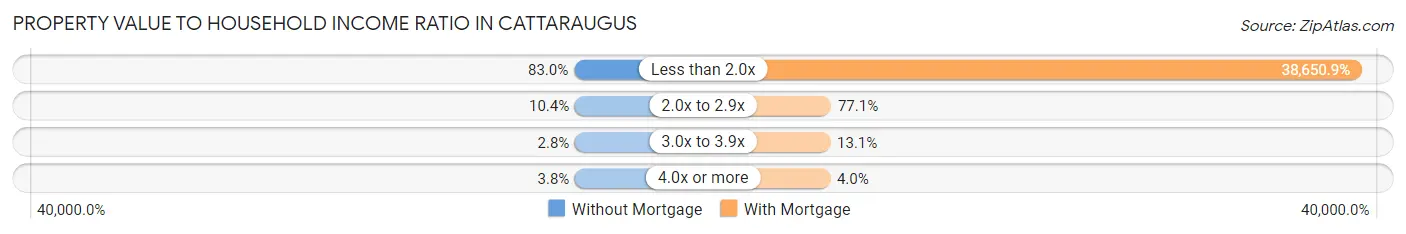
| Value-to-Income Ratio | Without Mortgage | With Mortgage |
| Less than 2.0x | 88 (83.0%) | 67,639 (38,650.9%) |
| 2.0x to 2.9x | 11 (10.4%) | 135 (77.1%) |
| 3.0x to 3.9x | 3 (2.8%) | 23 (13.1%) |
| 4.0x or more | 4 (3.8%) | 7 (4.0%) |
| Total | 106 (100.0%) | 175 (100.0%) |
Real Estate Taxes by Mortgage Status in Cattaraugus
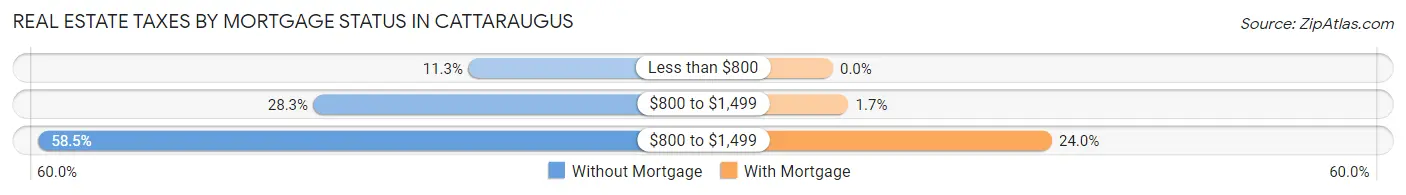
| Property Taxes | Without Mortgage | With Mortgage |
| Less than $800 | 12 (11.3%) | 0 (0.0%) |
| $800 to $1,499 | 30 (28.3%) | 3 (1.7%) |
| $800 to $1,499 | 62 (58.5%) | 42 (24.0%) |
| Total | 106 (100.0%) | 175 (100.0%) |
Health & Disability in Cattaraugus
Health Insurance Coverage by Age in Cattaraugus
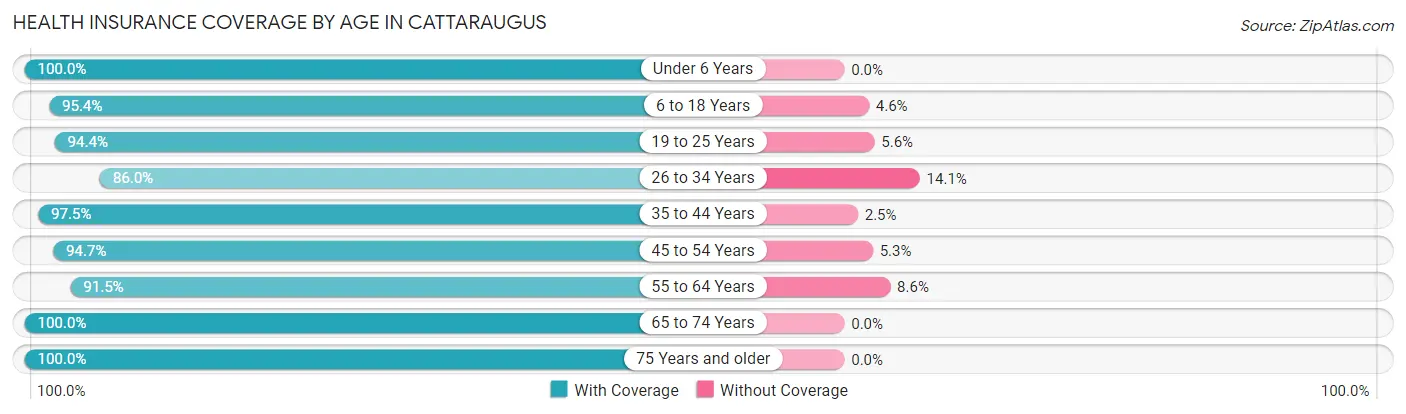
| Age Bracket | With Coverage | Without Coverage |
| Under 6 Years | 51 (100.0%) | 0 (0.0%) |
| 6 to 18 Years | 250 (95.4%) | 12 (4.6%) |
| 19 to 25 Years | 101 (94.4%) | 6 (5.6%) |
| 26 to 34 Years | 104 (86.0%) | 17 (14.1%) |
| 35 to 44 Years | 116 (97.5%) | 3 (2.5%) |
| 45 to 54 Years | 125 (94.7%) | 7 (5.3%) |
| 55 to 64 Years | 139 (91.4%) | 13 (8.6%) |
| 65 to 74 Years | 93 (100.0%) | 0 (0.0%) |
| 75 Years and older | 74 (100.0%) | 0 (0.0%) |
| Total | 1,053 (94.8%) | 58 (5.2%) |
Health Insurance Coverage by Citizenship Status in Cattaraugus
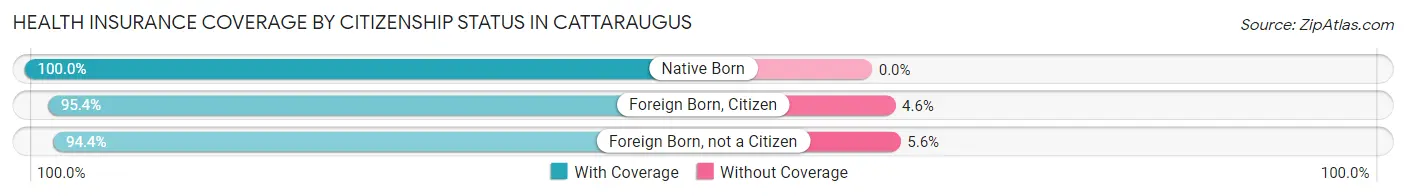
| Citizenship Status | With Coverage | Without Coverage |
| Native Born | 51 (100.0%) | 0 (0.0%) |
| Foreign Born, Citizen | 250 (95.4%) | 12 (4.6%) |
| Foreign Born, not a Citizen | 101 (94.4%) | 6 (5.6%) |
Health Insurance Coverage by Household Income in Cattaraugus
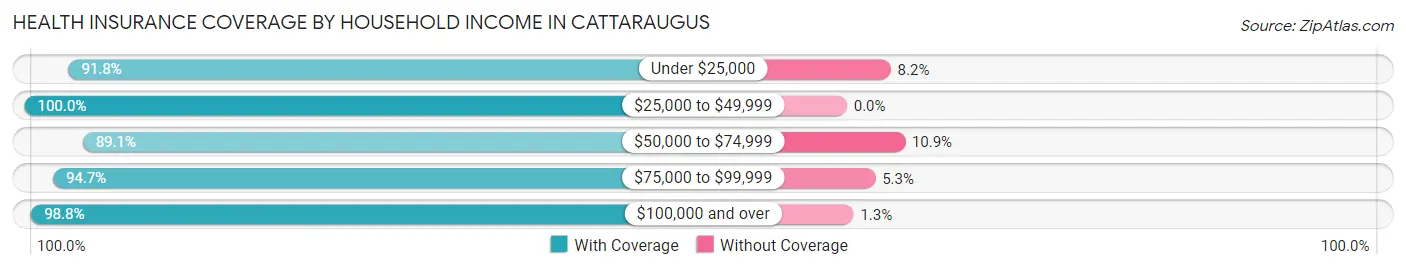
| Household Income | With Coverage | Without Coverage |
| Under $25,000 | 134 (91.8%) | 12 (8.2%) |
| $25,000 to $49,999 | 170 (100.0%) | 0 (0.0%) |
| $50,000 to $74,999 | 229 (89.1%) | 28 (10.9%) |
| $75,000 to $99,999 | 267 (94.7%) | 15 (5.3%) |
| $100,000 and over | 237 (98.8%) | 3 (1.3%) |
Public vs Private Health Insurance Coverage by Age in Cattaraugus
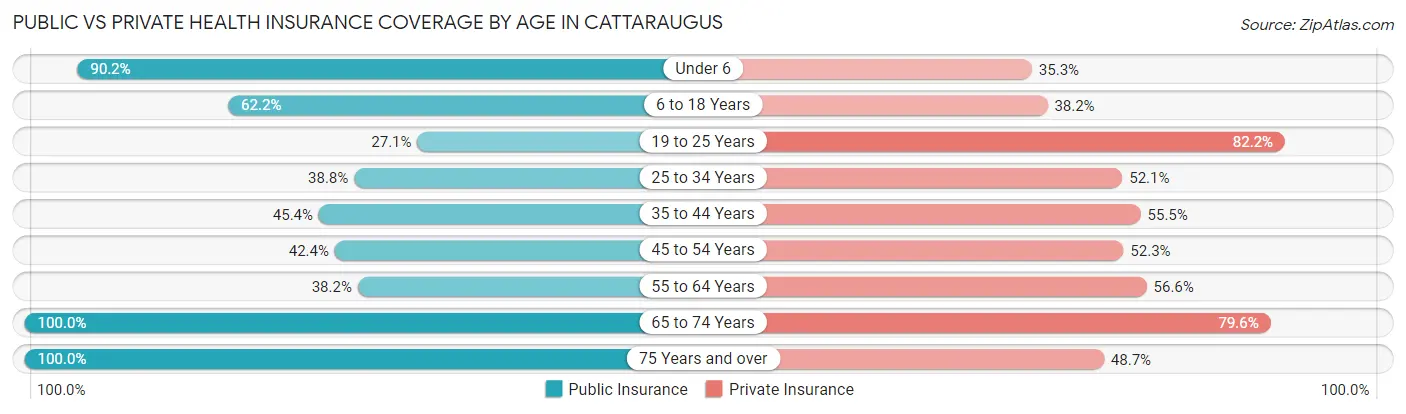
| Age Bracket | Public Insurance | Private Insurance |
| Under 6 | 46 (90.2%) | 18 (35.3%) |
| 6 to 18 Years | 163 (62.2%) | 100 (38.2%) |
| 19 to 25 Years | 29 (27.1%) | 88 (82.2%) |
| 25 to 34 Years | 47 (38.8%) | 63 (52.1%) |
| 35 to 44 Years | 54 (45.4%) | 66 (55.5%) |
| 45 to 54 Years | 56 (42.4%) | 69 (52.3%) |
| 55 to 64 Years | 58 (38.2%) | 86 (56.6%) |
| 65 to 74 Years | 93 (100.0%) | 74 (79.6%) |
| 75 Years and over | 74 (100.0%) | 36 (48.6%) |
| Total | 620 (55.8%) | 600 (54.0%) |
Disability Status by Sex by Age in Cattaraugus
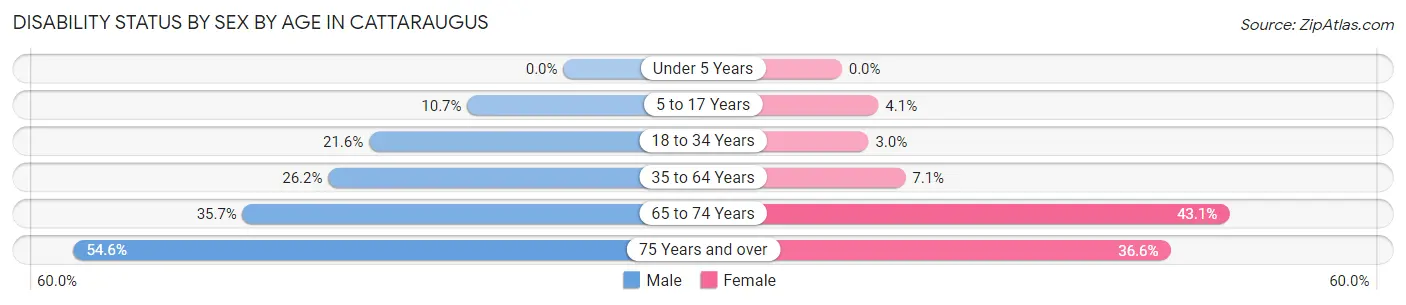
| Age Bracket | Male | Female |
| Under 5 Years | 0 (0.0%) | 0 (0.0%) |
| 5 to 17 Years | 17 (10.7%) | 4 (4.1%) |
| 18 to 34 Years | 29 (21.6%) | 3 (3.0%) |
| 35 to 64 Years | 50 (26.2%) | 15 (7.1%) |
| 65 to 74 Years | 15 (35.7%) | 22 (43.1%) |
| 75 Years and over | 18 (54.5%) | 15 (36.6%) |
Disability Class by Sex by Age in Cattaraugus
Disability Class: Hearing Difficulty
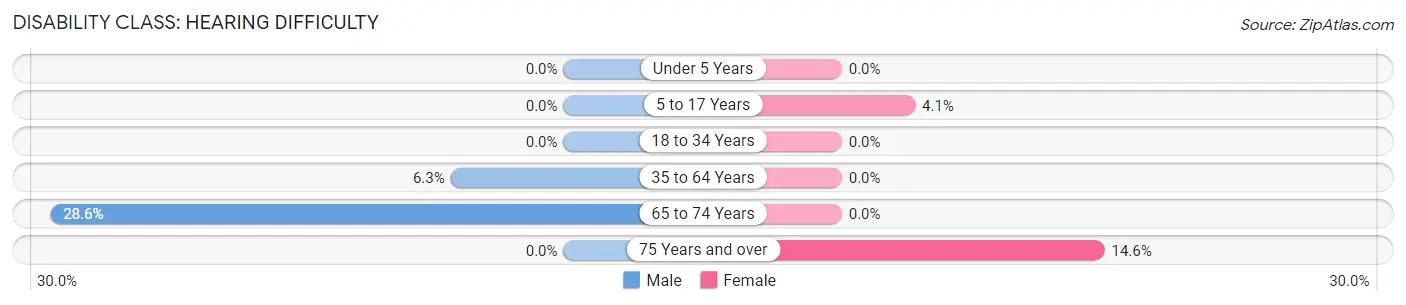
| Age Bracket | Male | Female |
| Under 5 Years | 0 (0.0%) | 0 (0.0%) |
| 5 to 17 Years | 0 (0.0%) | 4 (4.1%) |
| 18 to 34 Years | 0 (0.0%) | 0 (0.0%) |
| 35 to 64 Years | 12 (6.3%) | 0 (0.0%) |
| 65 to 74 Years | 12 (28.6%) | 0 (0.0%) |
| 75 Years and over | 0 (0.0%) | 6 (14.6%) |
Disability Class: Vision Difficulty
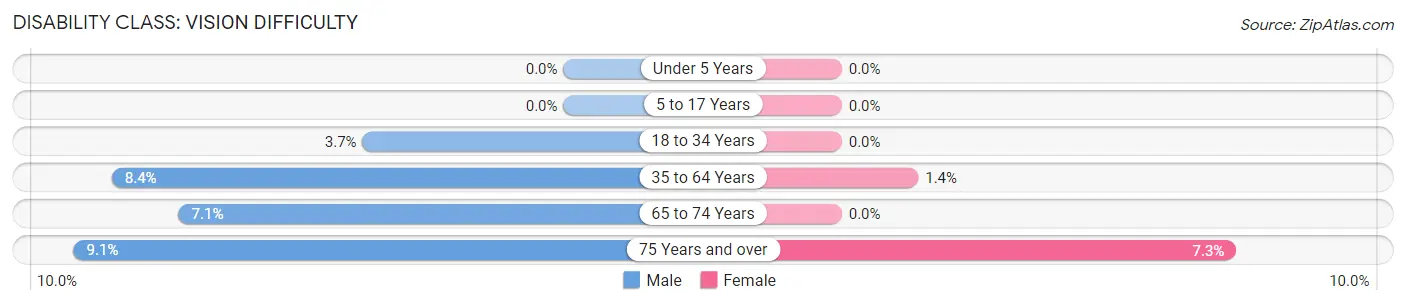
| Age Bracket | Male | Female |
| Under 5 Years | 0 (0.0%) | 0 (0.0%) |
| 5 to 17 Years | 0 (0.0%) | 0 (0.0%) |
| 18 to 34 Years | 5 (3.7%) | 0 (0.0%) |
| 35 to 64 Years | 16 (8.4%) | 3 (1.4%) |
| 65 to 74 Years | 3 (7.1%) | 0 (0.0%) |
| 75 Years and over | 3 (9.1%) | 3 (7.3%) |
Disability Class: Cognitive Difficulty
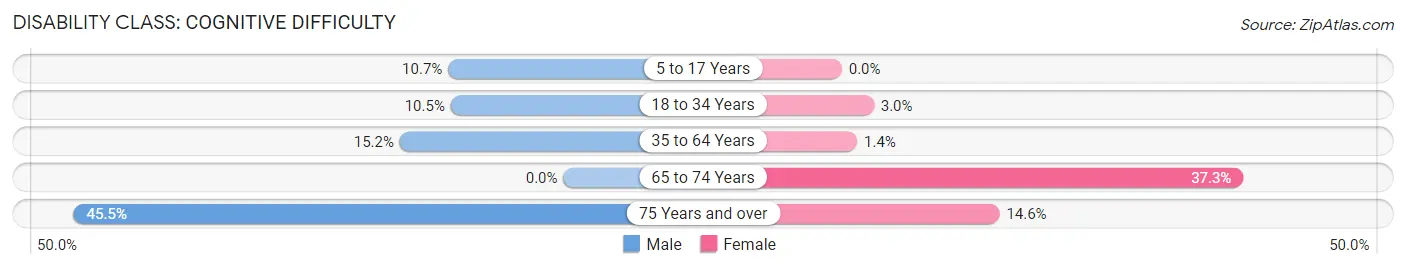
| Age Bracket | Male | Female |
| 5 to 17 Years | 17 (10.7%) | 0 (0.0%) |
| 18 to 34 Years | 14 (10.4%) | 3 (3.0%) |
| 35 to 64 Years | 29 (15.2%) | 3 (1.4%) |
| 65 to 74 Years | 0 (0.0%) | 19 (37.2%) |
| 75 Years and over | 15 (45.5%) | 6 (14.6%) |
Disability Class: Ambulatory Difficulty
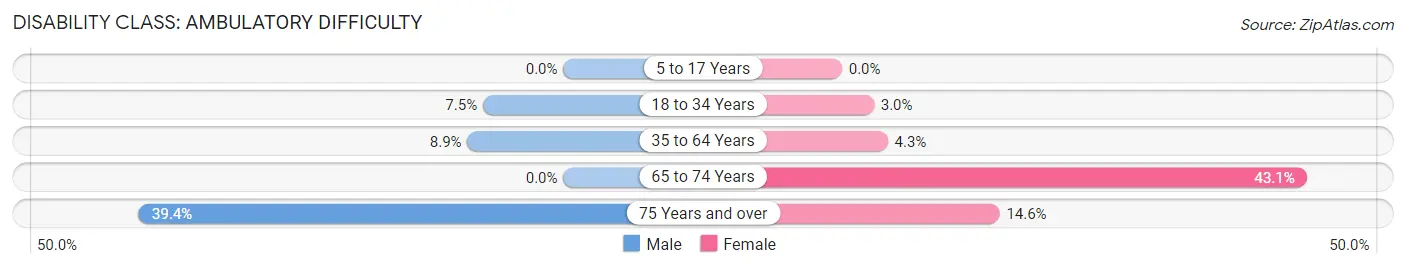
| Age Bracket | Male | Female |
| 5 to 17 Years | 0 (0.0%) | 0 (0.0%) |
| 18 to 34 Years | 10 (7.5%) | 3 (3.0%) |
| 35 to 64 Years | 17 (8.9%) | 9 (4.3%) |
| 65 to 74 Years | 0 (0.0%) | 22 (43.1%) |
| 75 Years and over | 13 (39.4%) | 6 (14.6%) |
Disability Class: Self-Care Difficulty
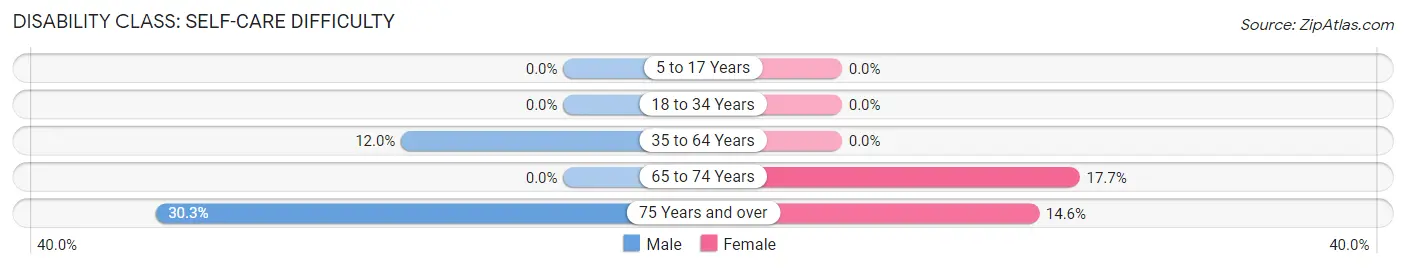
| Age Bracket | Male | Female |
| 5 to 17 Years | 0 (0.0%) | 0 (0.0%) |
| 18 to 34 Years | 0 (0.0%) | 0 (0.0%) |
| 35 to 64 Years | 23 (12.0%) | 0 (0.0%) |
| 65 to 74 Years | 0 (0.0%) | 9 (17.6%) |
| 75 Years and over | 10 (30.3%) | 6 (14.6%) |
Technology Access in Cattaraugus
Computing Device Access in Cattaraugus
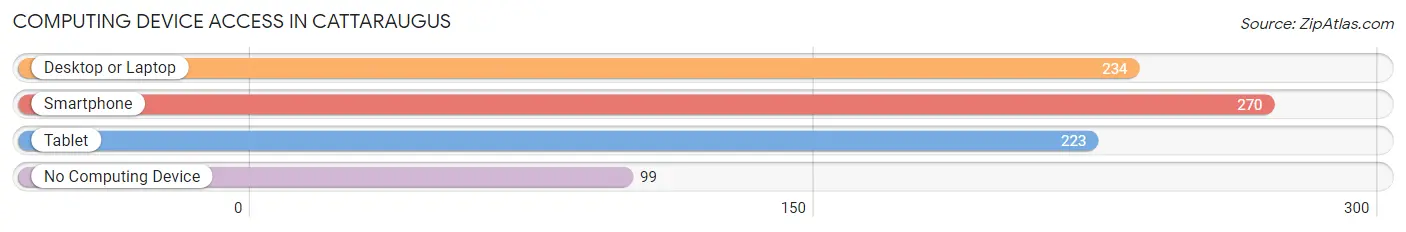
| Device Type | # Households | % Households |
| Desktop or Laptop | 234 | 55.8% |
| Smartphone | 270 | 64.4% |
| Tablet | 223 | 53.2% |
| No Computing Device | 99 | 23.6% |
| Total | 419 | 100.0% |
Internet Access in Cattaraugus
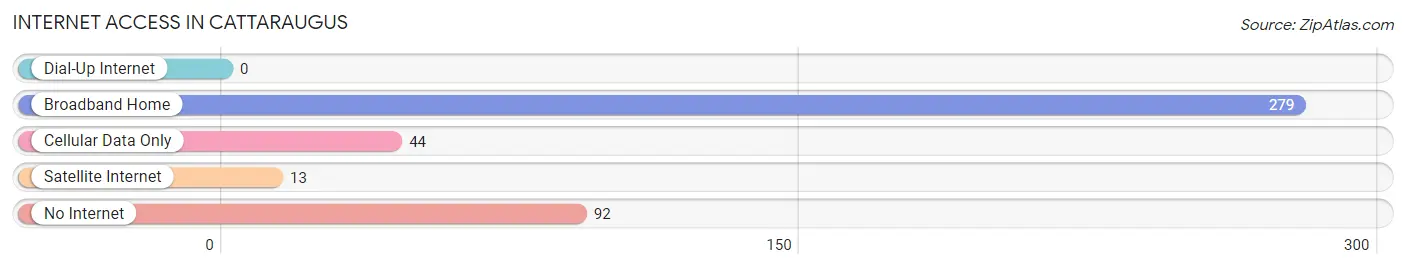
| Internet Type | # Households | % Households |
| Dial-Up Internet | 0 | 0.0% |
| Broadband Home | 279 | 66.6% |
| Cellular Data Only | 44 | 10.5% |
| Satellite Internet | 13 | 3.1% |
| No Internet | 92 | 22.0% |
| Total | 419 | 100.0% |
Cattaraugus Summary
Cattaraugus is a town located in the southwestern corner of New York State, in Cattaraugus County. It is bordered by the towns of Ellicottville, Great Valley, and Salamanca. The town is home to a population of approximately 4,000 people, and is known for its rural beauty and outdoor recreation opportunities.
History
The area that is now Cattaraugus was originally inhabited by the Seneca Nation of the Iroquois Confederacy. The Seneca were forced to cede their land to the United States in the Treaty of Big Tree in 1797. The town of Cattaraugus was established in 1808, and was named after the Cattaraugus Creek, which runs through the town.
In the early 19th century, the town was a popular destination for settlers from New England, who were attracted by the area’s abundant natural resources. The town was also home to a number of mills, which provided employment for many of the town’s residents.
In the late 19th century, the town began to experience a decline in population as many of its residents moved away in search of better economic opportunities. This trend continued into the 20th century, and by the 1950s, the town’s population had dropped to just over 2,000.
Geography
Cattaraugus is located in the southwestern corner of New York State, in Cattaraugus County. It is bordered by the towns of Ellicottville, Great Valley, and Salamanca. The town is situated in the foothills of the Allegheny Mountains, and is home to a number of small lakes and streams. The highest point in the town is the summit of Cattaraugus Hill, which rises to an elevation of 1,845 feet.
The town is located within the Allegany Indian Reservation, which is home to the Seneca Nation of the Iroquois Confederacy. The reservation is located in the northern part of the town, and covers an area of approximately 1,500 acres.
Economy
The economy of Cattaraugus is largely based on tourism and outdoor recreation. The town is home to a number of ski resorts, including Holiday Valley and Holimont, which attract visitors from all over the region. The town is also home to a number of state parks, including Allegany State Park and Zoar Valley, which offer a variety of outdoor activities.
In addition to tourism, the town is also home to a number of small businesses, including restaurants, retail stores, and service providers. The town is also home to a number of manufacturing companies, which produce a variety of products, including furniture, clothing, and electronics.
Demographics
As of the 2010 census, the population of Cattaraugus was 4,039. The racial makeup of the town was 95.3% White, 0.9% African American, 0.7% Native American, 0.3% Asian, 0.1% Pacific Islander, and 2.7% from other races. Hispanic or Latino of any race were 4.2% of the population.
The median household income in Cattaraugus was $41,944, and the median family income was $50,938. The per capita income for the town was $20,945. About 11.2% of families and 14.3% of the population were below the poverty line, including 19.2% of those under age 18 and 8.2% of those age 65 or over.
Common Questions
What is Per Capita Income in Cattaraugus?
Per Capita income in Cattaraugus is $24,779.
What is the Median Family Income in Cattaraugus?
Median Family Income in Cattaraugus is $58,661.
What is the Median Household income in Cattaraugus?
Median Household Income in Cattaraugus is $57,574.
What is Income or Wage Gap in Cattaraugus?
Income or Wage Gap in Cattaraugus is 2.7%.
Women in Cattaraugus earn 97.3 cents for every dollar earned by a man.
What is Inequality or Gini Index in Cattaraugus?
Inequality or Gini Index in Cattaraugus is 0.38.
What is the Total Population of Cattaraugus?
Total Population of Cattaraugus is 1,111.
What is the Total Male Population of Cattaraugus?
Total Male Population of Cattaraugus is 583.
What is the Total Female Population of Cattaraugus?
Total Female Population of Cattaraugus is 528.
What is the Ratio of Males per 100 Females in Cattaraugus?
There are 110.42 Males per 100 Females in Cattaraugus.
What is the Ratio of Females per 100 Males in Cattaraugus?
There are 90.57 Females per 100 Males in Cattaraugus.
What is the Median Population Age in Cattaraugus?
Median Population Age in Cattaraugus is 36.4 Years.
What is the Average Family Size in Cattaraugus
Average Family Size in Cattaraugus is 3.1 People.
What is the Average Household Size in Cattaraugus
Average Household Size in Cattaraugus is 2.6 People.
How Large is the Labor Force in Cattaraugus?
There are 483 People in the Labor Forcein in Cattaraugus.
What is the Percentage of People in the Labor Force in Cattaraugus?
57.0% of People are in the Labor Force in Cattaraugus.
What is the Unemployment Rate in Cattaraugus?
Unemployment Rate in Cattaraugus is 8.1%.