Chatham, NY Map & Demographics
Chatham Map
Chatham Overview
$44,850
PER CAPITA INCOME
$100,053
AVG FAMILY INCOME
$92,208
AVG HOUSEHOLD INCOME
30.0%
WAGE / INCOME GAP [ % ]
70.0¢/ $1
WAGE / INCOME GAP [ $ ]
0.38
INEQUALITY / GINI INDEX
1,763
TOTAL POPULATION
837
MALE POPULATION
926
FEMALE POPULATION
90.39
MALES / 100 FEMALES
110.63
FEMALES / 100 MALES
48.1
MEDIAN AGE
2.7
AVG FAMILY SIZE
2.2
AVG HOUSEHOLD SIZE
1,098
LABOR FORCE [ PEOPLE ]
70.9%
PERCENT IN LABOR FORCE
2.8%
UNEMPLOYMENT RATE
Chatham Zip Codes
Chatham Area Codes
Income in Chatham
Income Overview in Chatham
Per Capita Income in Chatham is $44,850, while median incomes of families and households are $100,053 and $92,208 respectively.
| Characteristic | Number | Measure |
| Per Capita Income | 1,763 | $44,850 |
| Median Family Income | 480 | $100,053 |
| Mean Family Income | 480 | $106,075 |
| Median Household Income | 807 | $92,208 |
| Mean Household Income | 807 | $93,029 |
| Income Deficit | 480 | $0 |
| Wage / Income Gap (%) | 1,763 | 30.04% |
| Wage / Income Gap ($) | 1,763 | 69.96¢ per $1 |
| Gini / Inequality Index | 1,763 | 0.38 |
Earnings by Sex in Chatham
Average Earnings in Chatham are $43,857, $49,154 for men and $34,390 for women, a difference of 30.0%.
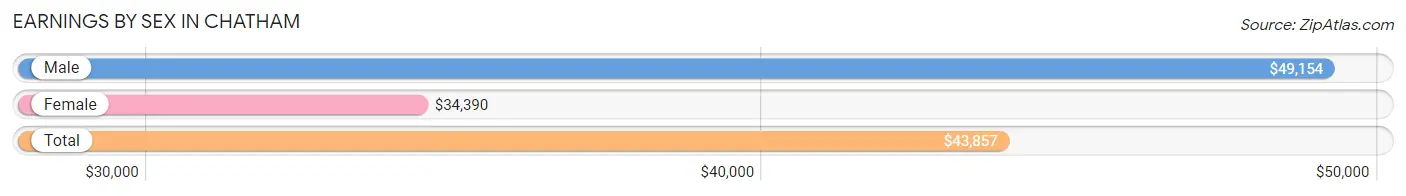
| Sex | Number | Average Earnings |
| Male | 593 (50.0%) | $49,154 |
| Female | 593 (50.0%) | $34,390 |
| Total | 1,186 (100.0%) | $43,857 |
Earnings by Sex by Income Bracket in Chatham
The most common earnings brackets in Chatham are $100,000+ for men (93 | 15.7%) and $100,000+ for women (83 | 14.0%).
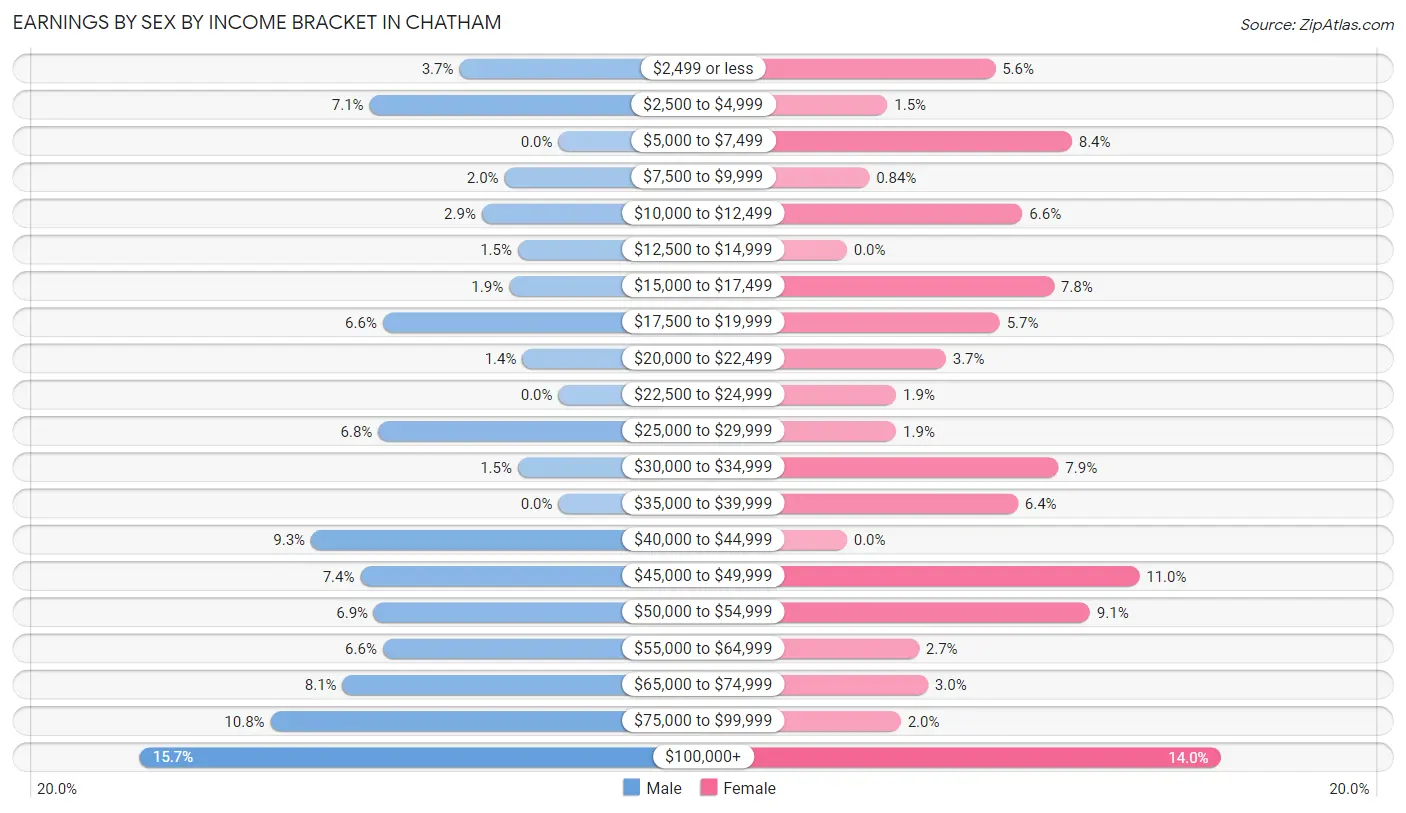
| Income | Male | Female |
| $2,499 or less | 22 (3.7%) | 33 (5.6%) |
| $2,500 to $4,999 | 42 (7.1%) | 9 (1.5%) |
| $5,000 to $7,499 | 0 (0.0%) | 50 (8.4%) |
| $7,500 to $9,999 | 12 (2.0%) | 5 (0.8%) |
| $10,000 to $12,499 | 17 (2.9%) | 39 (6.6%) |
| $12,500 to $14,999 | 9 (1.5%) | 0 (0.0%) |
| $15,000 to $17,499 | 11 (1.8%) | 46 (7.8%) |
| $17,500 to $19,999 | 39 (6.6%) | 34 (5.7%) |
| $20,000 to $22,499 | 8 (1.3%) | 22 (3.7%) |
| $22,500 to $24,999 | 0 (0.0%) | 11 (1.8%) |
| $25,000 to $29,999 | 40 (6.8%) | 11 (1.8%) |
| $30,000 to $34,999 | 9 (1.5%) | 47 (7.9%) |
| $35,000 to $39,999 | 0 (0.0%) | 38 (6.4%) |
| $40,000 to $44,999 | 55 (9.3%) | 0 (0.0%) |
| $45,000 to $49,999 | 44 (7.4%) | 65 (11.0%) |
| $50,000 to $54,999 | 41 (6.9%) | 54 (9.1%) |
| $55,000 to $64,999 | 39 (6.6%) | 16 (2.7%) |
| $65,000 to $74,999 | 48 (8.1%) | 18 (3.0%) |
| $75,000 to $99,999 | 64 (10.8%) | 12 (2.0%) |
| $100,000+ | 93 (15.7%) | 83 (14.0%) |
| Total | 593 (100.0%) | 593 (100.0%) |
Earnings by Sex by Educational Attainment in Chatham
Average earnings in Chatham are $51,389 for men and $36,809 for women, a difference of 28.4%. Men with an educational attainment of graduate degree enjoy the highest average annual earnings of $85,750, while those with college or associate's degree education earn the least with $42,039. Women with an educational attainment of graduate degree earn the most with the average annual earnings of $116,375, while those with college or associate's degree education have the smallest earnings of $28,750.
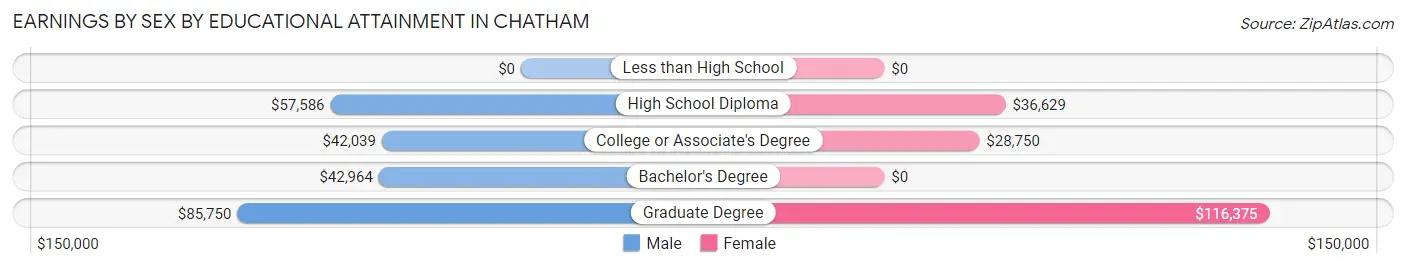
| Educational Attainment | Male Income | Female Income |
| Less than High School | - | - |
| High School Diploma | $57,586 | $36,629 |
| College or Associate's Degree | $42,039 | $28,750 |
| Bachelor's Degree | $42,964 | $0 |
| Graduate Degree | $85,750 | $116,375 |
| Total | $51,389 | $36,809 |
Family Income in Chatham
Family Income Brackets in Chatham
According to the Chatham family income data, there are 169 families falling into the $100,000 to $149,999 income range, which is the most common income bracket and makes up 35.2% of all families.
| Income Bracket | # Families | % Families |
| Less than $10,000 | 19 | 4.0% |
| $10,000 to $14,999 | 0 | 0.0% |
| $15,000 to $24,999 | 11 | 2.3% |
| $25,000 to $34,999 | 30 | 6.3% |
| $35,000 to $49,999 | 19 | 4.0% |
| $50,000 to $74,999 | 75 | 15.6% |
| $75,000 to $99,999 | 85 | 17.7% |
| $100,000 to $149,999 | 169 | 35.2% |
| $150,000 to $199,999 | 47 | 9.8% |
| $200,000+ | 25 | 5.2% |
Family Income by Famaliy Size in Chatham
3-person families (101 | 21.0%) account for the highest median family income in Chatham with $114,375 per family, while 2-person families (309 | 64.4%) have the highest median income of $46,175 per family member.
| Income Bracket | # Families | Median Income |
| 2-Person Families | 309 (64.4%) | $92,350 |
| 3-Person Families | 101 (21.0%) | $114,375 |
| 4-Person Families | 37 (7.7%) | $0 |
| 5-Person Families | 24 (5.0%) | $0 |
| 6-Person Families | 9 (1.9%) | $0 |
| 7+ Person Families | 0 (0.0%) | $0 |
| Total | 480 (100.0%) | $100,053 |
Family Income by Number of Earners in Chatham
The median family income in Chatham is $100,053, with families comprising 2 earners (208) having the highest median family income of $105,750, while families with no earners (41) have the lowest median family income of $55,313, accounting for 43.3% and 8.5% of families, respectively.
| Number of Earners | # Families | Median Income |
| No Earners | 41 (8.5%) | $55,313 |
| 1 Earner | 166 (34.6%) | $74,091 |
| 2 Earners | 208 (43.3%) | $105,750 |
| 3+ Earners | 65 (13.5%) | $103,036 |
| Total | 480 (100.0%) | $100,053 |
Household Income in Chatham
Household Income Brackets in Chatham
With 303 households falling in the category, the $100,000 to $149,999 income range is the most frequent in Chatham, accounting for 37.6% of all households. In contrast, only 25 households (3.1%) fall into the $200,000+ income bracket, making it the least populous group.
| Income Bracket | # Households | % Households |
| Less than $10,000 | 35 | 4.3% |
| $10,000 to $14,999 | 44 | 5.5% |
| $15,000 to $24,999 | 52 | 6.4% |
| $25,000 to $34,999 | 79 | 9.8% |
| $35,000 to $49,999 | 45 | 5.6% |
| $50,000 to $74,999 | 80 | 9.9% |
| $75,000 to $99,999 | 97 | 12.0% |
| $100,000 to $149,999 | 303 | 37.5% |
| $150,000 to $199,999 | 47 | 5.8% |
| $200,000+ | 25 | 3.1% |
Household Income by Householder Age in Chatham
The median household income in Chatham is $92,208, with the highest median household income of $118,077 found in the 25 to 44 years age bracket for the primary householder. A total of 192 households (23.8%) fall into this category. Meanwhile, the 15 to 24 years age bracket for the primary householder has the lowest median household income of $0, with 9 households (1.1%) in this group.
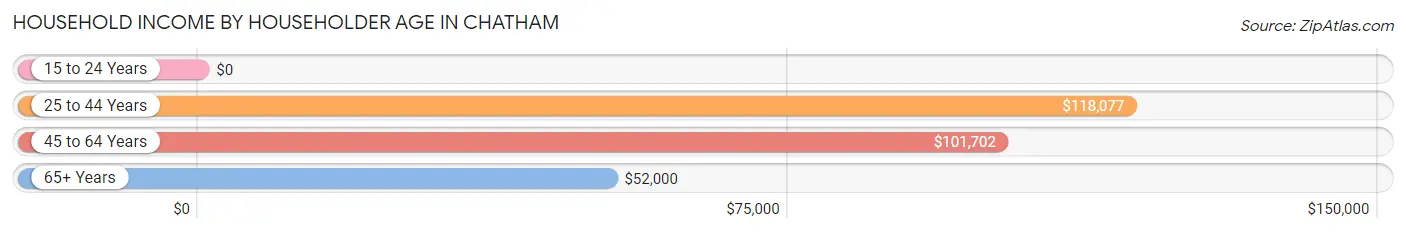
| Income Bracket | # Households | Median Income |
| 15 to 24 Years | 9 (1.1%) | $0 |
| 25 to 44 Years | 192 (23.8%) | $118,077 |
| 45 to 64 Years | 392 (48.6%) | $101,702 |
| 65+ Years | 214 (26.5%) | $52,000 |
| Total | 807 (100.0%) | $92,208 |
Poverty in Chatham
Income Below Poverty by Sex and Age in Chatham
With 9.8% poverty level for males and 5.8% for females among the residents of Chatham, 12 to 14 year old males and 12 to 14 year old females are the most vulnerable to poverty, with 7 males (53.8%) and 8 females (33.3%) in their respective age groups living below the poverty level.
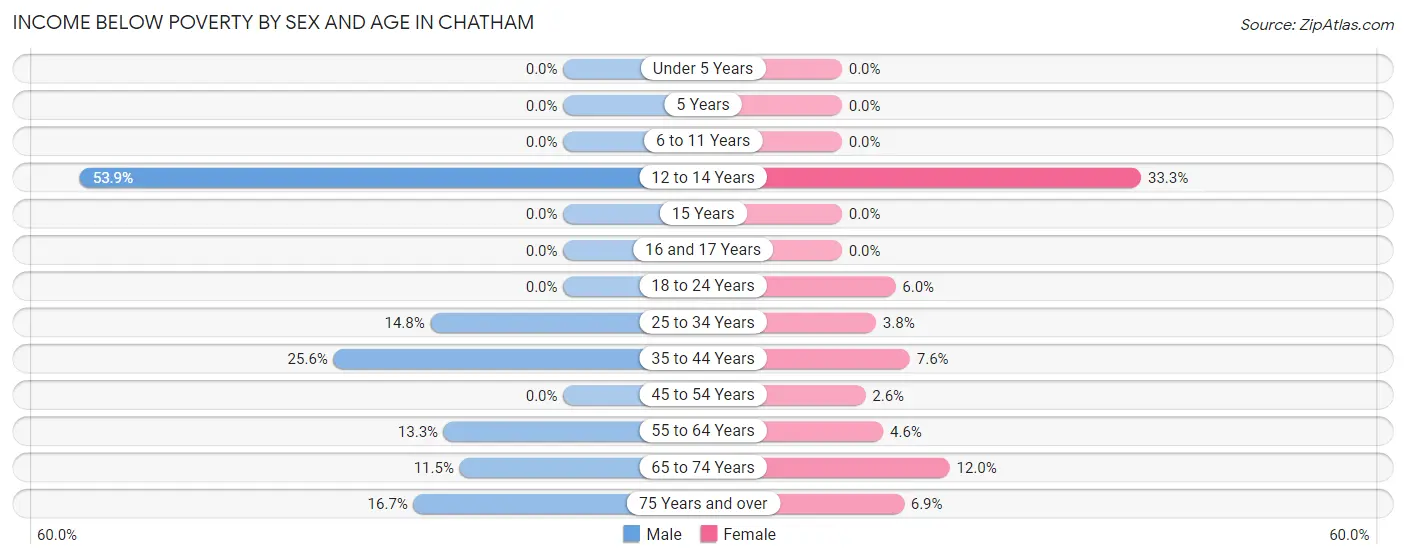
| Age Bracket | Male | Female |
| Under 5 Years | 0 (0.0%) | 0 (0.0%) |
| 5 Years | 0 (0.0%) | 0 (0.0%) |
| 6 to 11 Years | 0 (0.0%) | 0 (0.0%) |
| 12 to 14 Years | 7 (53.8%) | 8 (33.3%) |
| 15 Years | 0 (0.0%) | 0 (0.0%) |
| 16 and 17 Years | 0 (0.0%) | 0 (0.0%) |
| 18 to 24 Years | 0 (0.0%) | 9 (6.0%) |
| 25 to 34 Years | 21 (14.8%) | 3 (3.8%) |
| 35 to 44 Years | 11 (25.6%) | 5 (7.6%) |
| 45 to 54 Years | 0 (0.0%) | 6 (2.6%) |
| 55 to 64 Years | 25 (13.3%) | 4 (4.6%) |
| 65 to 74 Years | 12 (11.5%) | 15 (12.0%) |
| 75 Years and over | 6 (16.7%) | 4 (6.9%) |
| Total | 82 (9.8%) | 54 (5.8%) |
Income Above Poverty by Sex and Age in Chatham
According to the poverty statistics in Chatham, males aged under 5 years and females aged under 5 years are the age groups that are most secure financially, with 100.0% of males and 100.0% of females in these age groups living above the poverty line.
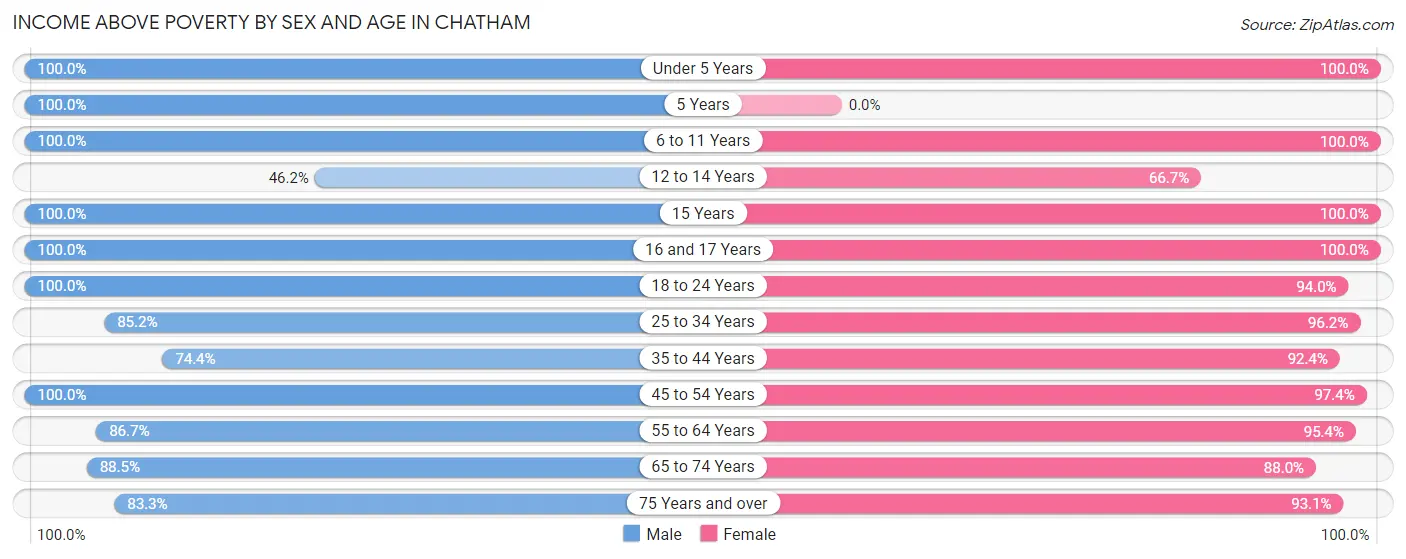
| Age Bracket | Male | Female |
| Under 5 Years | 8 (100.0%) | 31 (100.0%) |
| 5 Years | 7 (100.0%) | 0 (0.0%) |
| 6 to 11 Years | 58 (100.0%) | 39 (100.0%) |
| 12 to 14 Years | 6 (46.2%) | 16 (66.7%) |
| 15 Years | 16 (100.0%) | 18 (100.0%) |
| 16 and 17 Years | 10 (100.0%) | 19 (100.0%) |
| 18 to 24 Years | 53 (100.0%) | 142 (94.0%) |
| 25 to 34 Years | 121 (85.2%) | 76 (96.2%) |
| 35 to 44 Years | 32 (74.4%) | 61 (92.4%) |
| 45 to 54 Years | 159 (100.0%) | 223 (97.4%) |
| 55 to 64 Years | 163 (86.7%) | 83 (95.4%) |
| 65 to 74 Years | 92 (88.5%) | 110 (88.0%) |
| 75 Years and over | 30 (83.3%) | 54 (93.1%) |
| Total | 755 (90.2%) | 872 (94.2%) |
Income Below Poverty Among Married-Couple Families in Chatham
The poverty statistics for married-couple families in Chatham show that 3.1% or 11 of the total 355 families live below the poverty line. Families with no children have the highest poverty rate of 4.1%, comprising of 11 families. On the other hand, families with 1 or 2 children have the lowest poverty rate of 0.0%, which includes 0 families.
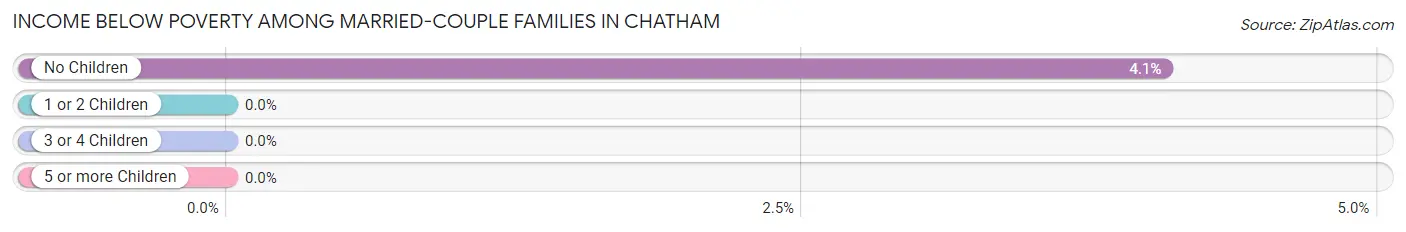
| Children | Above Poverty | Below Poverty |
| No Children | 259 (95.9%) | 11 (4.1%) |
| 1 or 2 Children | 71 (100.0%) | 0 (0.0%) |
| 3 or 4 Children | 14 (100.0%) | 0 (0.0%) |
| 5 or more Children | 0 (0.0%) | 0 (0.0%) |
| Total | 344 (96.9%) | 11 (3.1%) |
Income Below Poverty Among Single-Parent Households in Chatham
According to the poverty data in Chatham, 20.5% or 8 single-father households and 12.8% or 11 single-mother households are living below the poverty line. Among single-father households, those with 1 or 2 children have the highest poverty rate, with 8 households (20.5%) experiencing poverty. Likewise, among single-mother households, those with 1 or 2 children have the highest poverty rate, with 11 households (20.7%) falling below the poverty line.
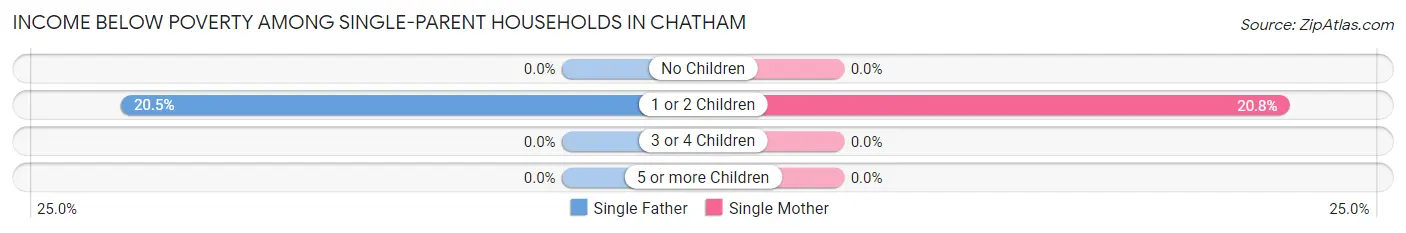
| Children | Single Father | Single Mother |
| No Children | 0 (0.0%) | 0 (0.0%) |
| 1 or 2 Children | 8 (20.5%) | 11 (20.7%) |
| 3 or 4 Children | 0 (0.0%) | 0 (0.0%) |
| 5 or more Children | 0 (0.0%) | 0 (0.0%) |
| Total | 8 (20.5%) | 11 (12.8%) |
Income Below Poverty Among Married-Couple vs Single-Parent Households in Chatham
The poverty data for Chatham shows that 11 of the married-couple family households (3.1%) and 19 of the single-parent households (15.2%) are living below the poverty level. Within the married-couple family households, those with no children have the highest poverty rate, with 11 households (4.1%) falling below the poverty line. Among the single-parent households, those with 1 or 2 children have the highest poverty rate, with 19 household (20.6%) living below poverty.
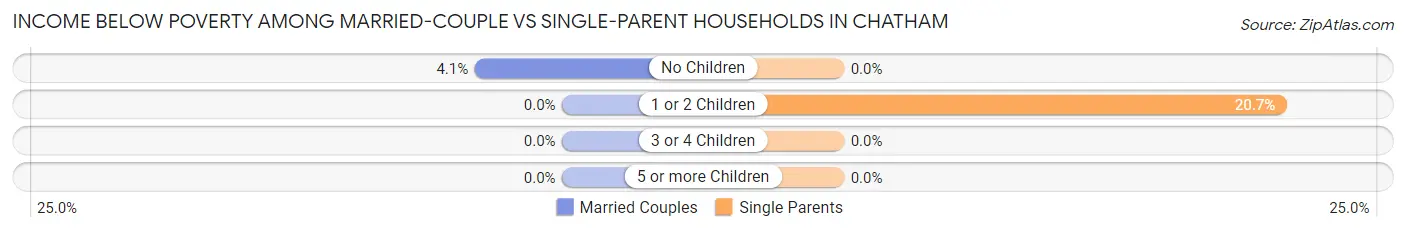
| Children | Married-Couple Families | Single-Parent Households |
| No Children | 11 (4.1%) | 0 (0.0%) |
| 1 or 2 Children | 0 (0.0%) | 19 (20.6%) |
| 3 or 4 Children | 0 (0.0%) | 0 (0.0%) |
| 5 or more Children | 0 (0.0%) | 0 (0.0%) |
| Total | 11 (3.1%) | 19 (15.2%) |
Race in Chatham
The most populous races in Chatham are White / Caucasian (1,590 | 90.2%), Two or more Races (143 | 8.1%), and Hispanic or Latino (37 | 2.1%).
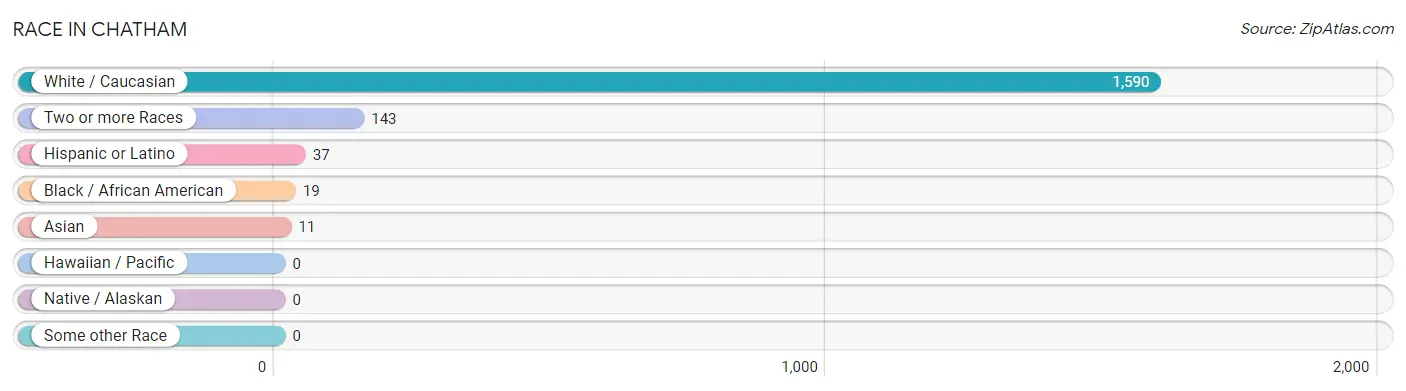
| Race | # Population | % Population |
| Asian | 11 | 0.6% |
| Black / African American | 19 | 1.1% |
| Hawaiian / Pacific | 0 | 0.0% |
| Hispanic or Latino | 37 | 2.1% |
| Native / Alaskan | 0 | 0.0% |
| White / Caucasian | 1,590 | 90.2% |
| Two or more Races | 143 | 8.1% |
| Some other Race | 0 | 0.0% |
| Total | 1,763 | 100.0% |
Ancestry in Chatham
The most populous ancestries reported in Chatham are Irish (545 | 30.9%), Italian (389 | 22.1%), German (357 | 20.3%), English (221 | 12.5%), and Scottish (126 | 7.1%), together accounting for 92.9% of all Chatham residents.
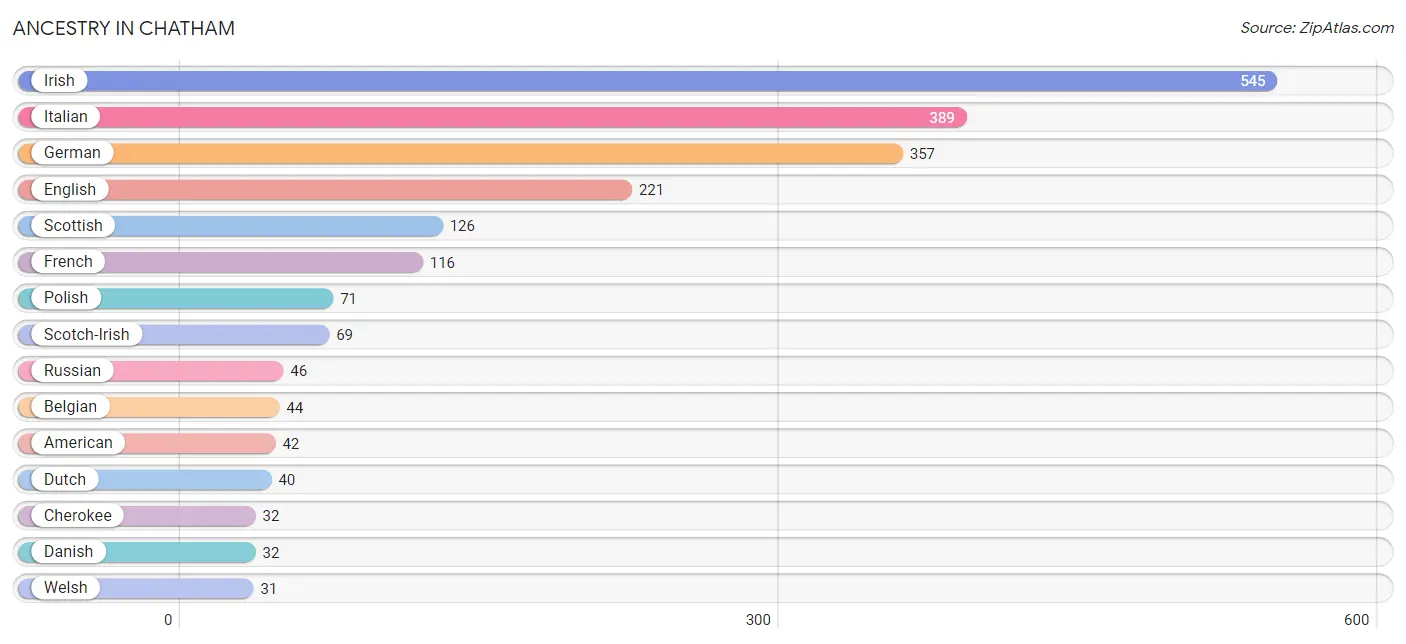
| Ancestry | # Population | % Population |
| American | 42 | 2.4% |
| Arab | 8 | 0.4% |
| Belgian | 44 | 2.5% |
| Bhutanese | 7 | 0.4% |
| British | 8 | 0.4% |
| Cherokee | 32 | 1.8% |
| Cuban | 29 | 1.6% |
| Czech | 4 | 0.2% |
| Danish | 32 | 1.8% |
| Dutch | 40 | 2.3% |
| Eastern European | 5 | 0.3% |
| English | 221 | 12.5% |
| European | 29 | 1.6% |
| French | 116 | 6.6% |
| French Canadian | 13 | 0.7% |
| German | 357 | 20.3% |
| Greek | 11 | 0.6% |
| Haitian | 21 | 1.2% |
| Indian (Asian) | 6 | 0.3% |
| Irish | 545 | 30.9% |
| Italian | 389 | 22.1% |
| Jamaican | 19 | 1.1% |
| Jordanian | 8 | 0.4% |
| Korean | 12 | 0.7% |
| Lithuanian | 9 | 0.5% |
| Norwegian | 23 | 1.3% |
| Polish | 71 | 4.0% |
| Puerto Rican | 8 | 0.4% |
| Romanian | 19 | 1.1% |
| Russian | 46 | 2.6% |
| Scotch-Irish | 69 | 3.9% |
| Scottish | 126 | 7.1% |
| Swedish | 15 | 0.9% |
| Swiss | 8 | 0.4% |
| Thai | 3 | 0.2% |
| Ukrainian | 6 | 0.3% |
| Welsh | 31 | 1.8% | View All 37 Rows |
Immigrants in Chatham
The most numerous immigrant groups reported in Chatham came from Europe (35 | 2.0%), Eastern Europe (20 | 1.1%), Russia (20 | 1.1%), Caribbean (19 | 1.1%), and Jamaica (19 | 1.1%), together accounting for 6.4% of all Chatham residents.
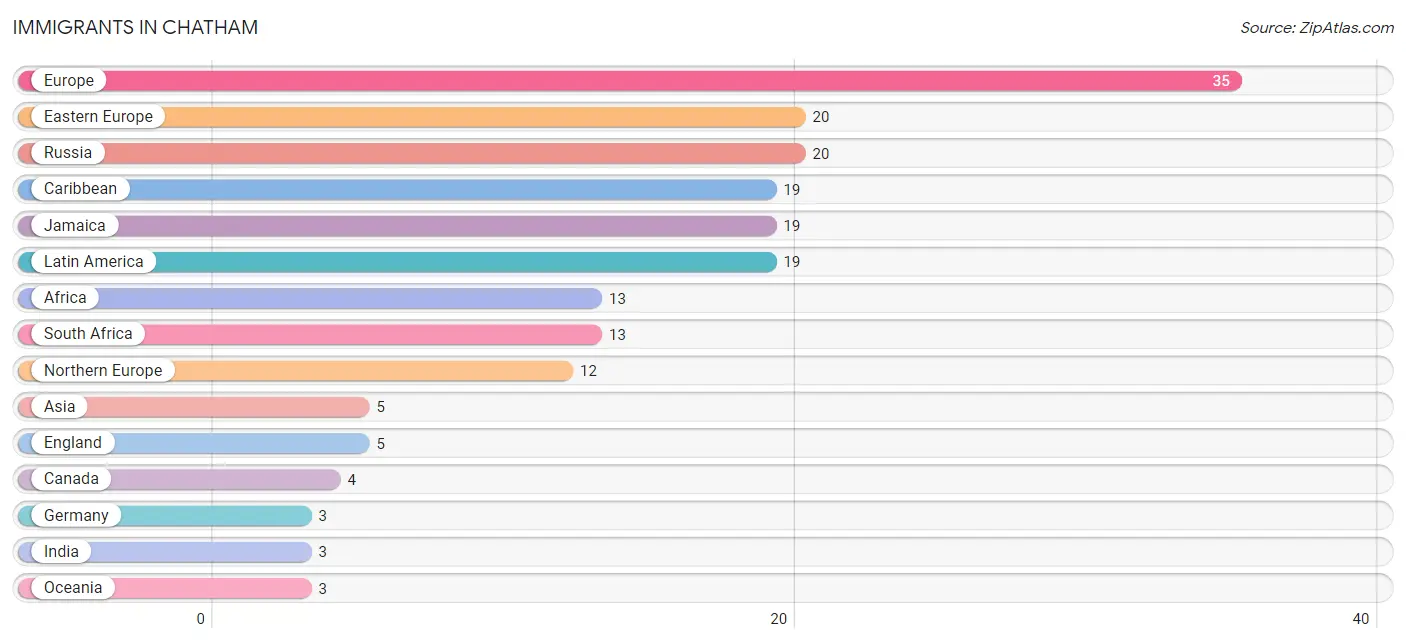
| Immigration Origin | # Population | % Population |
| Africa | 13 | 0.7% |
| Asia | 5 | 0.3% |
| Canada | 4 | 0.2% |
| Caribbean | 19 | 1.1% |
| Eastern Asia | 2 | 0.1% |
| Eastern Europe | 20 | 1.1% |
| England | 5 | 0.3% |
| Europe | 35 | 2.0% |
| Germany | 3 | 0.2% |
| India | 3 | 0.2% |
| Jamaica | 19 | 1.1% |
| Japan | 2 | 0.1% |
| Latin America | 19 | 1.1% |
| Northern Europe | 12 | 0.7% |
| Oceania | 3 | 0.2% |
| Russia | 20 | 1.1% |
| South Africa | 13 | 0.7% |
| South Central Asia | 3 | 0.2% |
| Western Europe | 3 | 0.2% | View All 19 Rows |
Sex and Age in Chatham
Sex and Age in Chatham
The most populous age groups in Chatham are 55 to 59 Years (108 | 12.9%) for men and 20 to 24 Years (129 | 13.9%) for women.
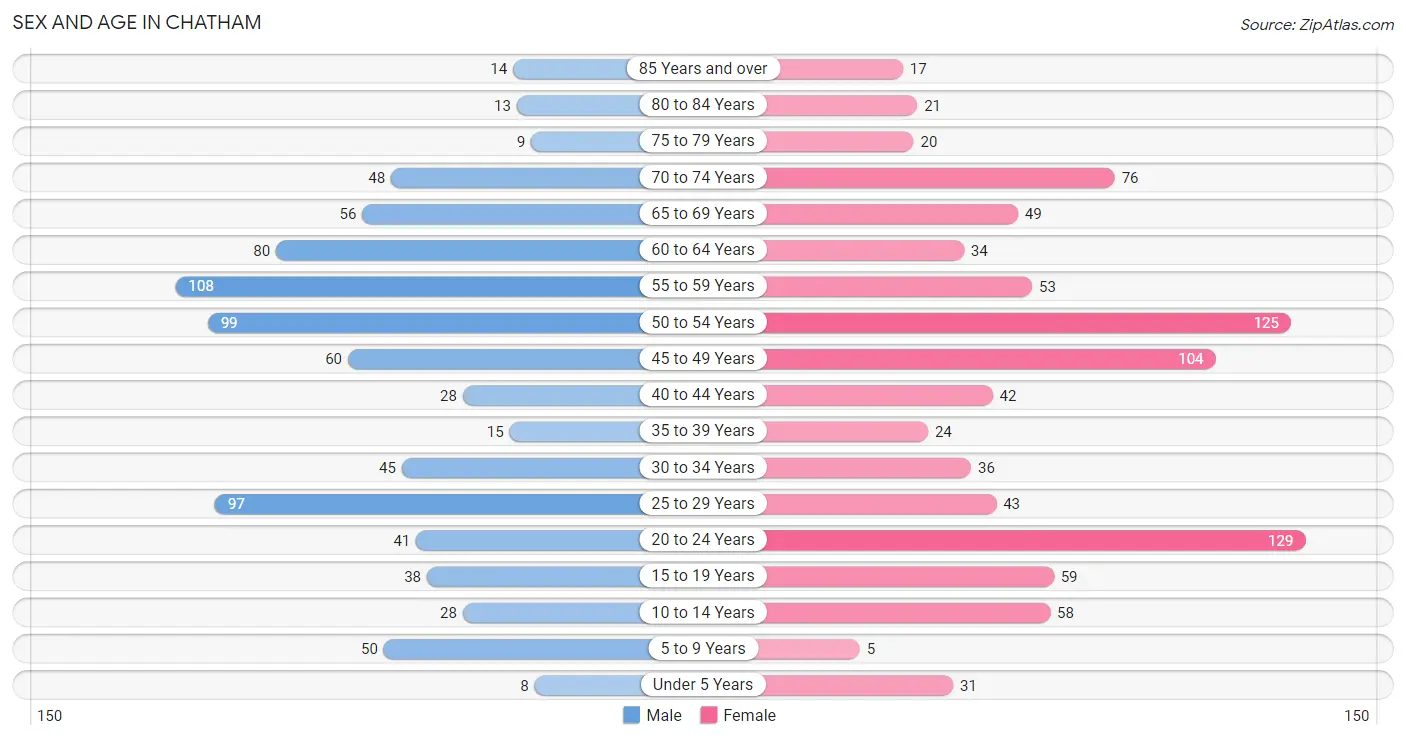
| Age Bracket | Male | Female |
| Under 5 Years | 8 (1.0%) | 31 (3.4%) |
| 5 to 9 Years | 50 (6.0%) | 5 (0.5%) |
| 10 to 14 Years | 28 (3.4%) | 58 (6.3%) |
| 15 to 19 Years | 38 (4.5%) | 59 (6.4%) |
| 20 to 24 Years | 41 (4.9%) | 129 (13.9%) |
| 25 to 29 Years | 97 (11.6%) | 43 (4.6%) |
| 30 to 34 Years | 45 (5.4%) | 36 (3.9%) |
| 35 to 39 Years | 15 (1.8%) | 24 (2.6%) |
| 40 to 44 Years | 28 (3.4%) | 42 (4.5%) |
| 45 to 49 Years | 60 (7.2%) | 104 (11.2%) |
| 50 to 54 Years | 99 (11.8%) | 125 (13.5%) |
| 55 to 59 Years | 108 (12.9%) | 53 (5.7%) |
| 60 to 64 Years | 80 (9.6%) | 34 (3.7%) |
| 65 to 69 Years | 56 (6.7%) | 49 (5.3%) |
| 70 to 74 Years | 48 (5.7%) | 76 (8.2%) |
| 75 to 79 Years | 9 (1.1%) | 20 (2.2%) |
| 80 to 84 Years | 13 (1.5%) | 21 (2.3%) |
| 85 Years and over | 14 (1.7%) | 17 (1.8%) |
| Total | 837 (100.0%) | 926 (100.0%) |
Families and Households in Chatham
Median Family Size in Chatham
The median family size in Chatham is 2.73 persons per family, with single male/father families (39 | 8.1%) accounting for the largest median family size of 3.62 persons per family. On the other hand, single female/mother families (86 | 17.9%) represent the smallest median family size with 2.64 persons per family.
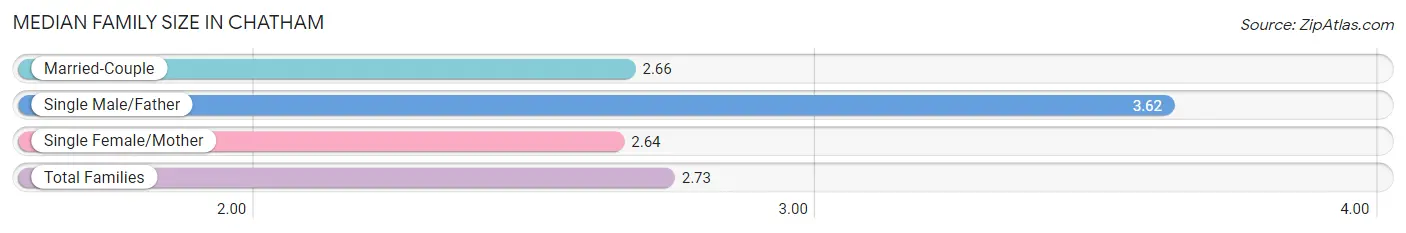
| Family Type | # Families | Family Size |
| Married-Couple | 355 (74.0%) | 2.66 |
| Single Male/Father | 39 (8.1%) | 3.62 |
| Single Female/Mother | 86 (17.9%) | 2.64 |
| Total Families | 480 (100.0%) | 2.73 |
Median Household Size in Chatham
The median household size in Chatham is 2.18 persons per household, with single male/father households (39 | 4.8%) accounting for the largest median household size of 3.82 persons per household. non-family households (327 | 40.5%) represent the smallest median household size with 1.33 persons per household.
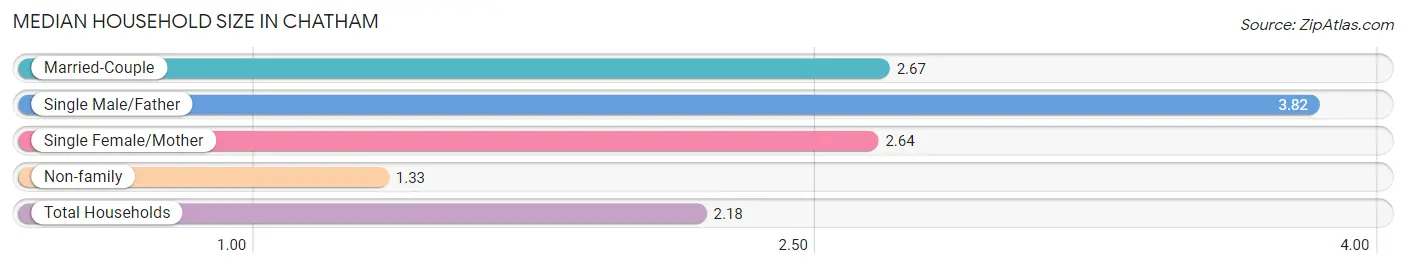
| Household Type | # Households | Household Size |
| Married-Couple | 355 (44.0%) | 2.67 |
| Single Male/Father | 39 (4.8%) | 3.82 |
| Single Female/Mother | 86 (10.7%) | 2.64 |
| Non-family | 327 (40.5%) | 1.33 |
| Total Households | 807 (100.0%) | 2.18 |
Household Size by Marriage Status in Chatham
Out of a total of 807 households in Chatham, 480 (59.5%) are family households, while 327 (40.5%) are nonfamily households. The most numerous type of family households are 2-person households, comprising 301, and the most common type of nonfamily households are 1-person households, comprising 226.
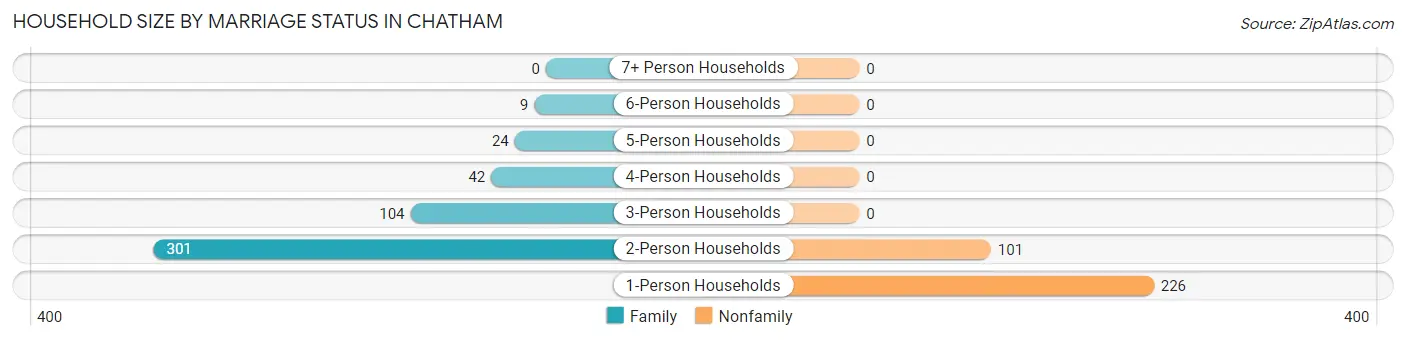
| Household Size | Family Households | Nonfamily Households |
| 1-Person Households | - | 226 (28.0%) |
| 2-Person Households | 301 (37.3%) | 101 (12.5%) |
| 3-Person Households | 104 (12.9%) | 0 (0.0%) |
| 4-Person Households | 42 (5.2%) | 0 (0.0%) |
| 5-Person Households | 24 (3.0%) | 0 (0.0%) |
| 6-Person Households | 9 (1.1%) | 0 (0.0%) |
| 7+ Person Households | 0 (0.0%) | 0 (0.0%) |
| Total | 480 (59.5%) | 327 (40.5%) |
Female Fertility in Chatham
Fertility by Age in Chatham
Average fertility rate in Chatham is 34.0 births per 1,000 women. Women in the age bracket of 20 to 34 years have the highest fertility rate with 48.0 births per 1,000 women. Women in the age bracket of 20 to 34 years acount for 58.8% of all women with births.
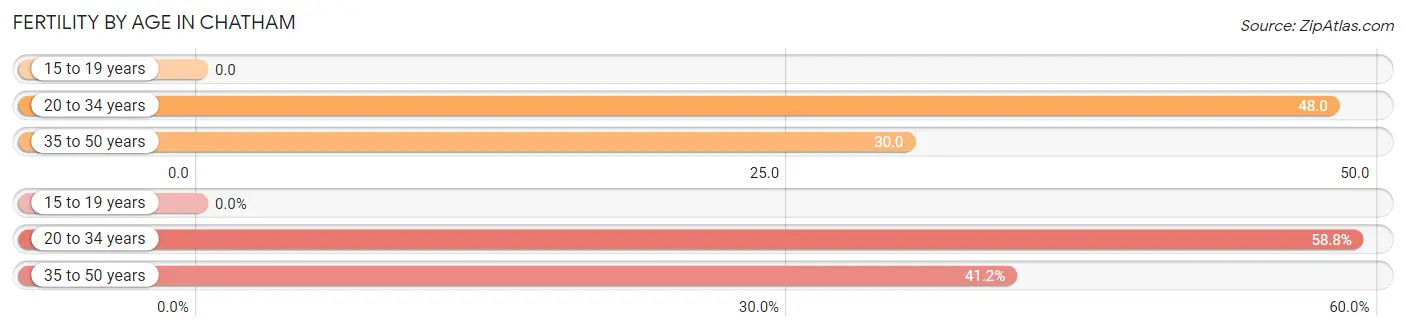
| Age Bracket | Women with Births | Births / 1,000 Women |
| 15 to 19 years | 0 (0.0%) | 0.0 |
| 20 to 34 years | 10 (58.8%) | 48.0 |
| 35 to 50 years | 7 (41.2%) | 30.0 |
| Total | 17 (100.0%) | 34.0 |
Fertility by Age by Marriage Status in Chatham
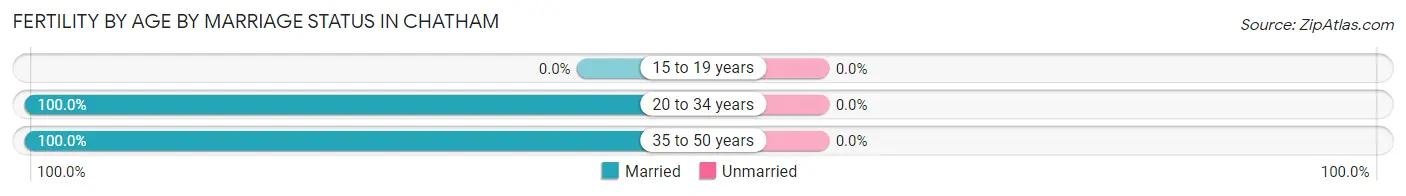
| Age Bracket | Married | Unmarried |
| 15 to 19 years | 0 (0.0%) | 0 (0.0%) |
| 20 to 34 years | 10 (100.0%) | 0 (0.0%) |
| 35 to 50 years | 7 (100.0%) | 0 (0.0%) |
| Total | 17 (100.0%) | 0 (0.0%) |
Fertility by Education in Chatham
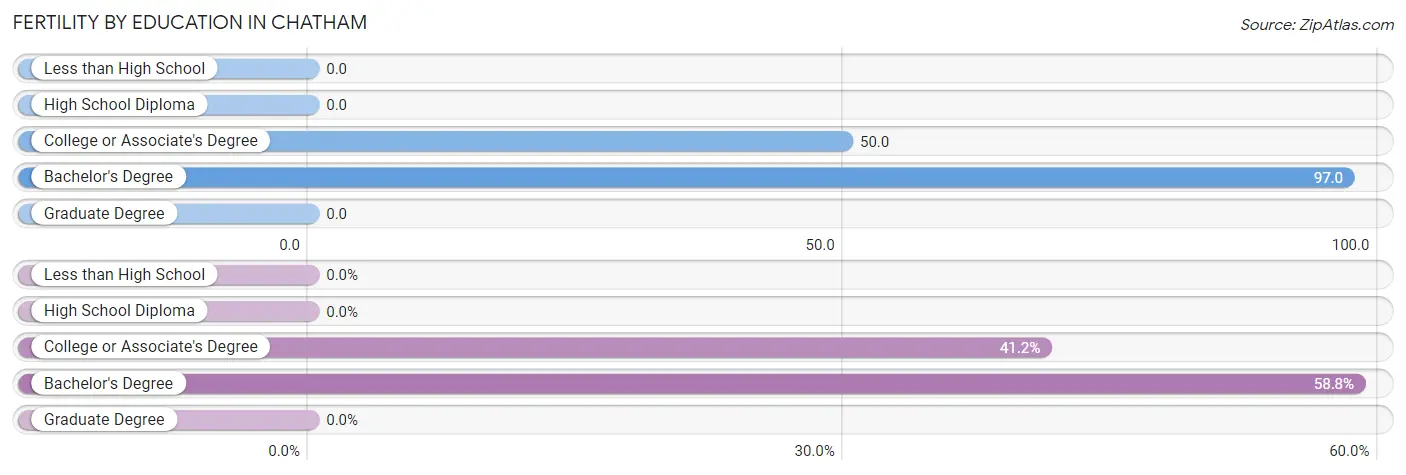
| Educational Attainment | Women with Births | Births / 1,000 Women |
| Less than High School | 0 (0.0%) | 0.0 |
| High School Diploma | 0 (0.0%) | 0.0 |
| College or Associate's Degree | 7 (41.2%) | 50.0 |
| Bachelor's Degree | 10 (58.8%) | 97.0 |
| Graduate Degree | 0 (0.0%) | 0.0 |
| Total | 17 (100.0%) | 34.0 |
Fertility by Education by Marriage Status in Chatham
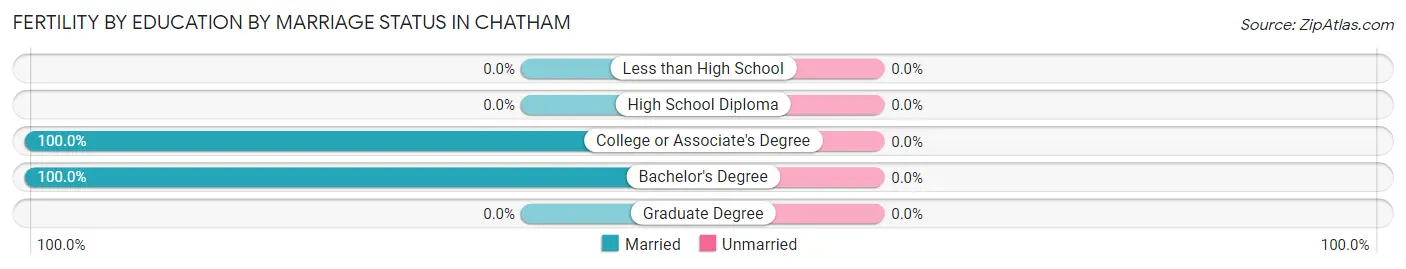
| Educational Attainment | Married | Unmarried |
| Less than High School | 0 (0.0%) | 0 (0.0%) |
| High School Diploma | 0 (0.0%) | 0 (0.0%) |
| College or Associate's Degree | 7 (100.0%) | 0 (0.0%) |
| Bachelor's Degree | 10 (100.0%) | 0 (0.0%) |
| Graduate Degree | 0 (0.0%) | 0 (0.0%) |
| Total | 17 (100.0%) | 0 (0.0%) |
Employment Characteristics in Chatham
Employment by Class of Employer in Chatham
Among the 1,067 employed individuals in Chatham, private company employees (578 | 54.2%), self-employed (not incorporated) (227 | 21.3%), and local government employees (135 | 12.7%) make up the most common classes of employment.
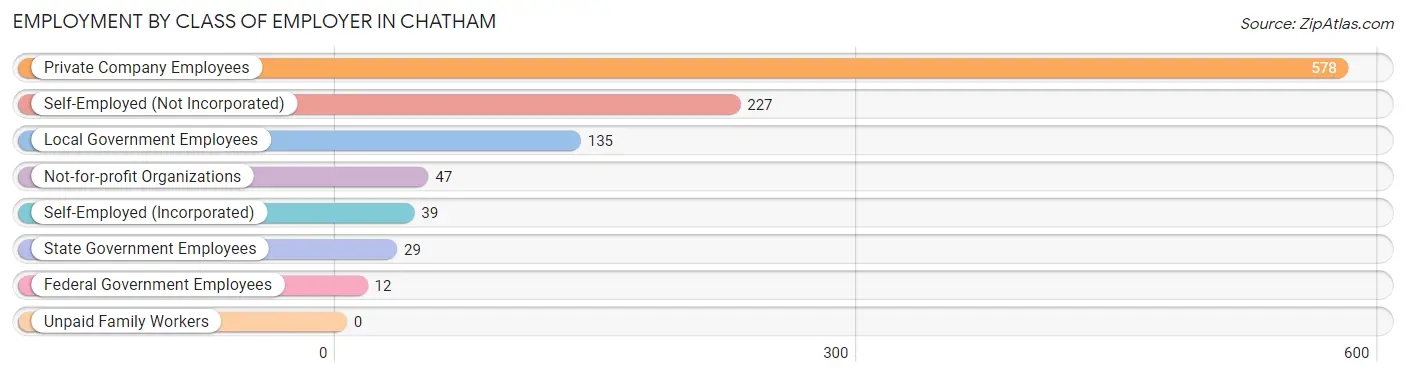
| Employer Class | # Employees | % Employees |
| Private Company Employees | 578 | 54.2% |
| Self-Employed (Incorporated) | 39 | 3.7% |
| Self-Employed (Not Incorporated) | 227 | 21.3% |
| Not-for-profit Organizations | 47 | 4.4% |
| Local Government Employees | 135 | 12.7% |
| State Government Employees | 29 | 2.7% |
| Federal Government Employees | 12 | 1.1% |
| Unpaid Family Workers | 0 | 0.0% |
| Total | 1,067 | 100.0% |
Employment Status by Age in Chatham
According to the labor force statistics for Chatham, out of the total population over 16 years of age (1,549), 70.9% or 1,098 individuals are in the labor force, with 2.8% or 31 of them unemployed. The age group with the highest labor force participation rate is 25 to 29 years, with 100.0% or 140 individuals in the labor force. Within the labor force, the 16 to 19 years age range has the highest percentage of unemployed individuals, with 16.9% or 10 of them being unemployed.
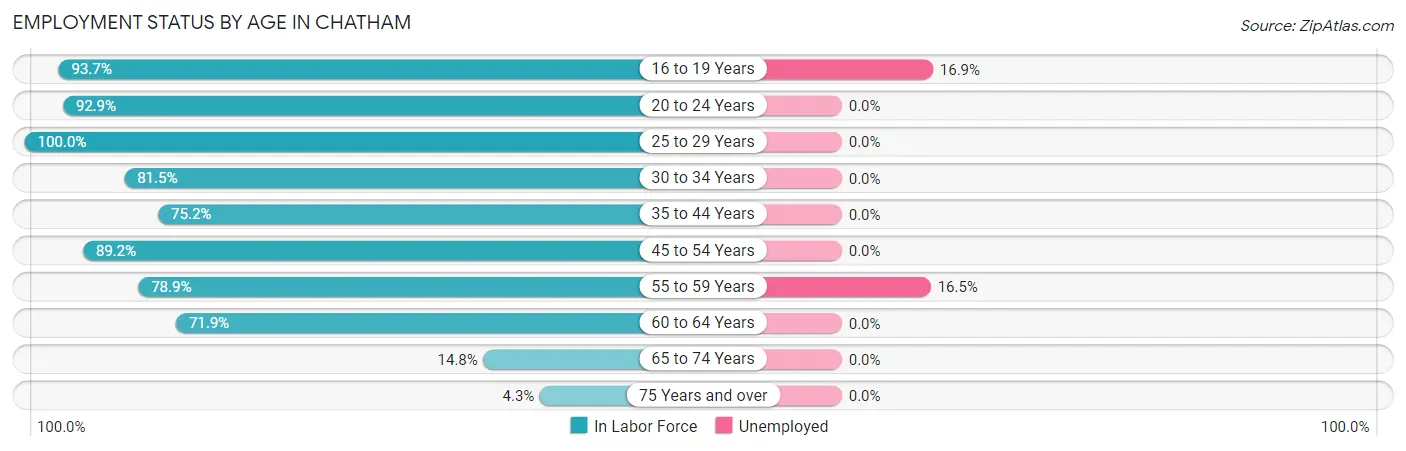
| Age Bracket | In Labor Force | Unemployed |
| 16 to 19 Years | 59 (93.7%) | 10 (16.9%) |
| 20 to 24 Years | 158 (92.9%) | 0 (0.0%) |
| 25 to 29 Years | 140 (100.0%) | 0 (0.0%) |
| 30 to 34 Years | 66 (81.5%) | 0 (0.0%) |
| 35 to 44 Years | 82 (75.2%) | 0 (0.0%) |
| 45 to 54 Years | 346 (89.2%) | 0 (0.0%) |
| 55 to 59 Years | 127 (78.9%) | 21 (16.5%) |
| 60 to 64 Years | 82 (71.9%) | 0 (0.0%) |
| 65 to 74 Years | 34 (14.8%) | 0 (0.0%) |
| 75 Years and over | 4 (4.3%) | 0 (0.0%) |
| Total | 1,098 (70.9%) | 31 (2.8%) |
Employment Status by Educational Attainment in Chatham
According to labor force statistics for Chatham, 84.9% of individuals (843) out of the total population between 25 and 64 years of age (993) are in the labor force, with 2.5% or 21 of them being unemployed. The group with the highest labor force participation rate are those with the educational attainment of less than high school, with 100.0% or 5 individuals in the labor force. Within the labor force, individuals with high school diploma education have the highest percentage of unemployment, with 10.4% or 21 of them being unemployed.
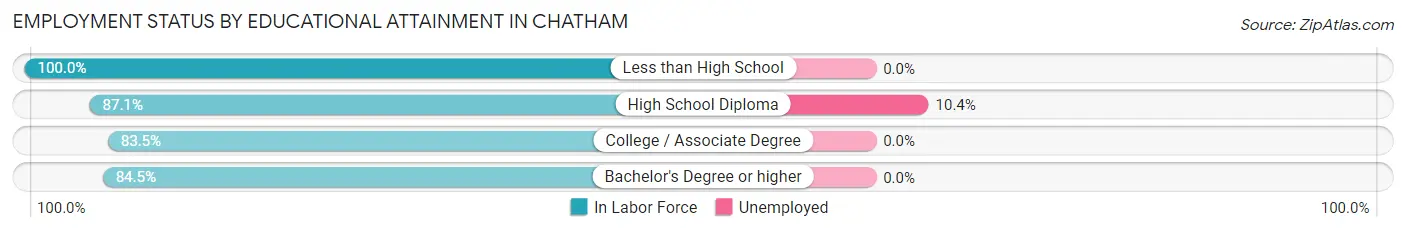
| Educational Attainment | In Labor Force | Unemployed |
| Less than High School | 5 (100.0%) | 0 (0.0%) |
| High School Diploma | 202 (87.1%) | 24 (10.4%) |
| College / Associate Degree | 232 (83.5%) | 0 (0.0%) |
| Bachelor's Degree or higher | 404 (84.5%) | 0 (0.0%) |
| Total | 843 (84.9%) | 25 (2.5%) |
Employment Occupations by Sex in Chatham
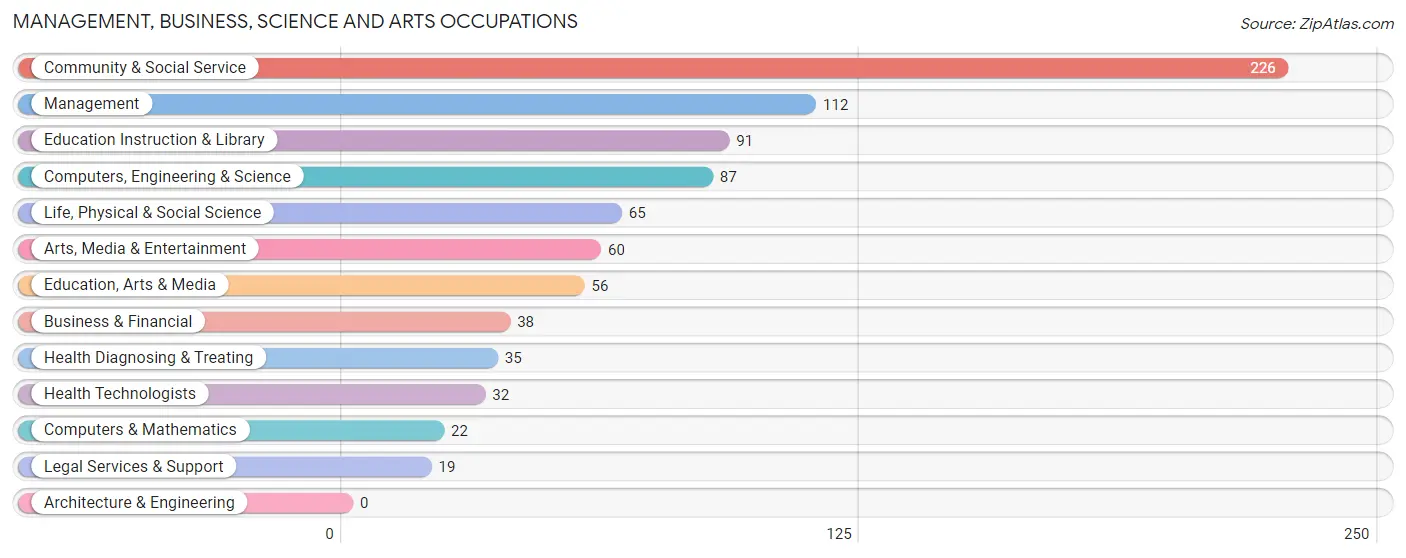
Management, Business, Science and Arts Occupations
The most common Management, Business, Science and Arts occupations in Chatham are Community & Social Service (226 | 21.2%), Management (112 | 10.5%), Education Instruction & Library (91 | 8.5%), Computers, Engineering & Science (87 | 8.2%), and Life, Physical & Social Science (65 | 6.1%).
Management, Business, Science and Arts Occupations by Sex
Within the Management, Business, Science and Arts occupations in Chatham, the most male-oriented occupations are Computers & Mathematics (81.8%), Arts, Media & Entertainment (71.7%), and Health Technologists (68.8%), while the most female-oriented occupations are Life, Physical & Social Science (100.0%), Education, Arts & Media (100.0%), and Legal Services & Support (100.0%).
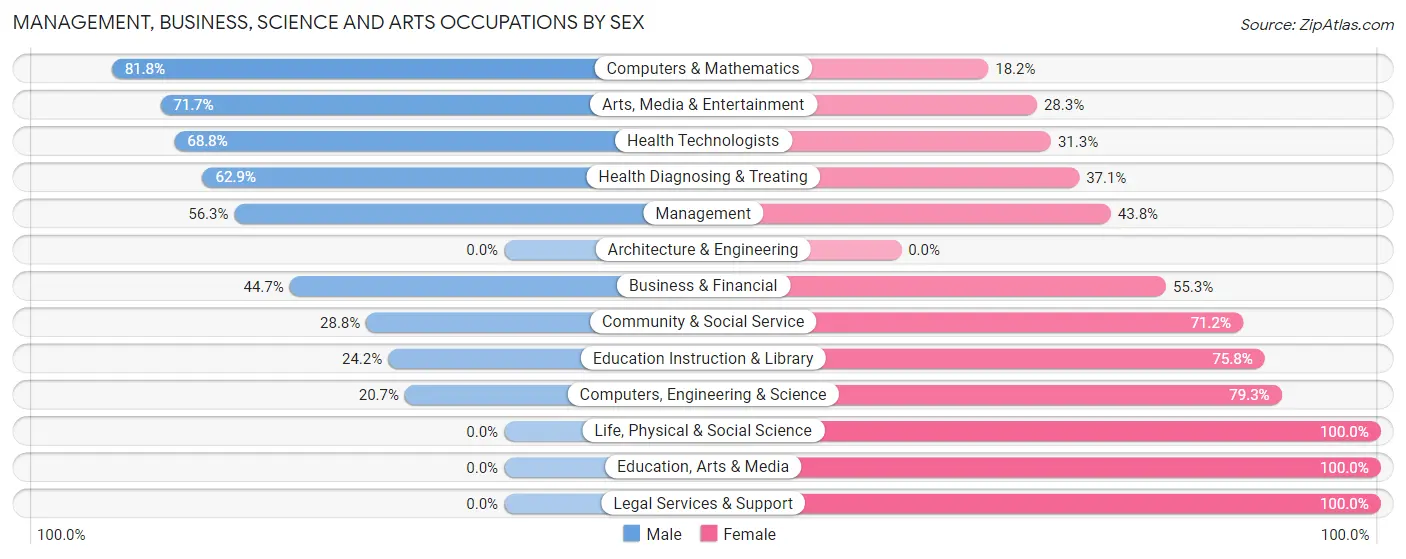
| Occupation | Male | Female |
| Management | 63 (56.2%) | 49 (43.8%) |
| Business & Financial | 17 (44.7%) | 21 (55.3%) |
| Computers, Engineering & Science | 18 (20.7%) | 69 (79.3%) |
| Computers & Mathematics | 18 (81.8%) | 4 (18.2%) |
| Architecture & Engineering | 0 (0.0%) | 0 (0.0%) |
| Life, Physical & Social Science | 0 (0.0%) | 65 (100.0%) |
| Community & Social Service | 65 (28.8%) | 161 (71.2%) |
| Education, Arts & Media | 0 (0.0%) | 56 (100.0%) |
| Legal Services & Support | 0 (0.0%) | 19 (100.0%) |
| Education Instruction & Library | 22 (24.2%) | 69 (75.8%) |
| Arts, Media & Entertainment | 43 (71.7%) | 17 (28.3%) |
| Health Diagnosing & Treating | 22 (62.9%) | 13 (37.1%) |
| Health Technologists | 22 (68.8%) | 10 (31.2%) |
| Total (Category) | 185 (37.1%) | 313 (62.8%) |
| Total (Overall) | 508 (47.6%) | 559 (52.4%) |
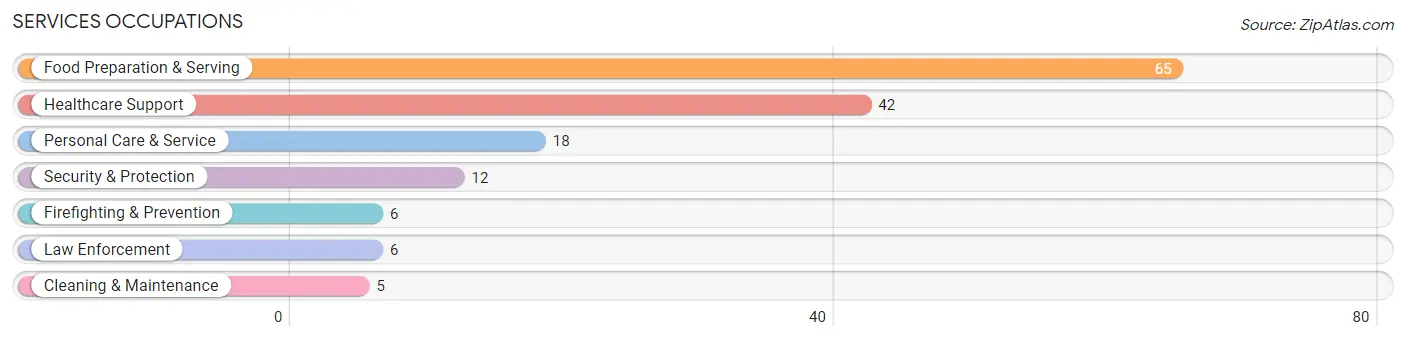
Services Occupations
The most common Services occupations in Chatham are Food Preparation & Serving (65 | 6.1%), Healthcare Support (42 | 3.9%), Personal Care & Service (18 | 1.7%), Security & Protection (12 | 1.1%), and Firefighting & Prevention (6 | 0.6%).
Services Occupations by Sex
Within the Services occupations in Chatham, the most male-oriented occupations are Security & Protection (100.0%), Firefighting & Prevention (100.0%), and Law Enforcement (100.0%), while the most female-oriented occupations are Healthcare Support (100.0%), Food Preparation & Serving (84.6%), and Personal Care & Service (27.8%).
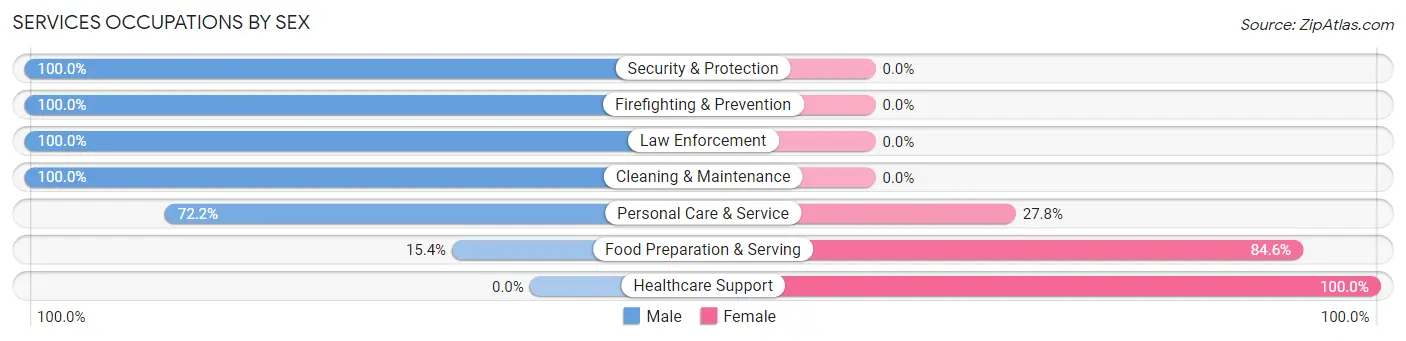
| Occupation | Male | Female |
| Healthcare Support | 0 (0.0%) | 42 (100.0%) |
| Security & Protection | 12 (100.0%) | 0 (0.0%) |
| Firefighting & Prevention | 6 (100.0%) | 0 (0.0%) |
| Law Enforcement | 6 (100.0%) | 0 (0.0%) |
| Food Preparation & Serving | 10 (15.4%) | 55 (84.6%) |
| Cleaning & Maintenance | 5 (100.0%) | 0 (0.0%) |
| Personal Care & Service | 13 (72.2%) | 5 (27.8%) |
| Total (Category) | 40 (28.2%) | 102 (71.8%) |
| Total (Overall) | 508 (47.6%) | 559 (52.4%) |
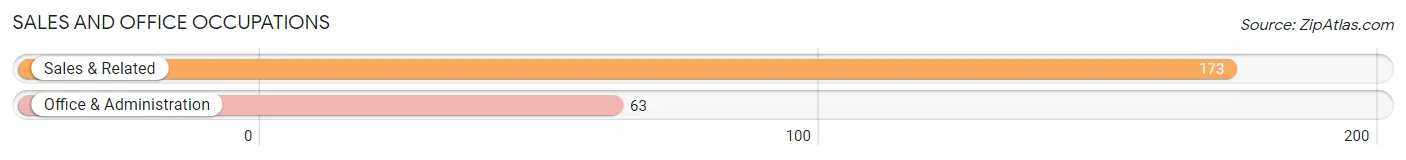
Sales and Office Occupations
The most common Sales and Office occupations in Chatham are Sales & Related (173 | 16.2%), and Office & Administration (63 | 5.9%).
Sales and Office Occupations by Sex
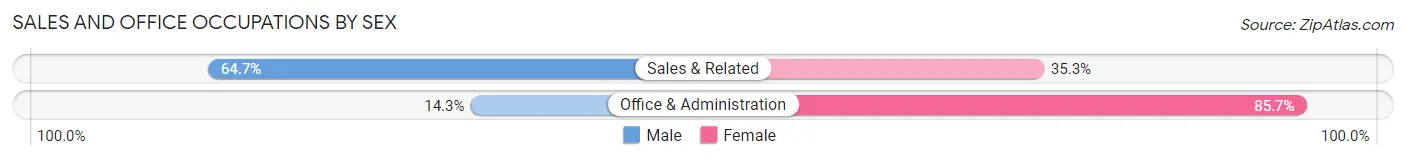
| Occupation | Male | Female |
| Sales & Related | 112 (64.7%) | 61 (35.3%) |
| Office & Administration | 9 (14.3%) | 54 (85.7%) |
| Total (Category) | 121 (51.3%) | 115 (48.7%) |
| Total (Overall) | 508 (47.6%) | 559 (52.4%) |
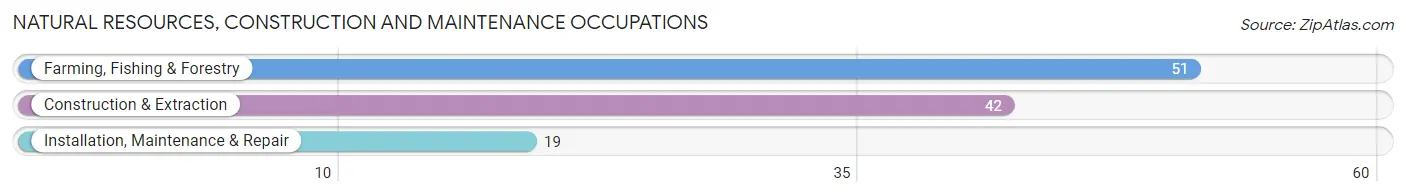
Natural Resources, Construction and Maintenance Occupations
The most common Natural Resources, Construction and Maintenance occupations in Chatham are Farming, Fishing & Forestry (51 | 4.8%), Construction & Extraction (42 | 3.9%), and Installation, Maintenance & Repair (19 | 1.8%).
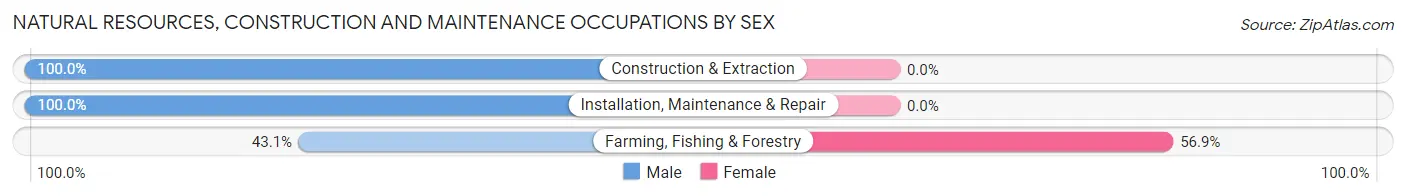
Natural Resources, Construction and Maintenance Occupations by Sex
| Occupation | Male | Female |
| Farming, Fishing & Forestry | 22 (43.1%) | 29 (56.9%) |
| Construction & Extraction | 42 (100.0%) | 0 (0.0%) |
| Installation, Maintenance & Repair | 19 (100.0%) | 0 (0.0%) |
| Total (Category) | 83 (74.1%) | 29 (25.9%) |
| Total (Overall) | 508 (47.6%) | 559 (52.4%) |
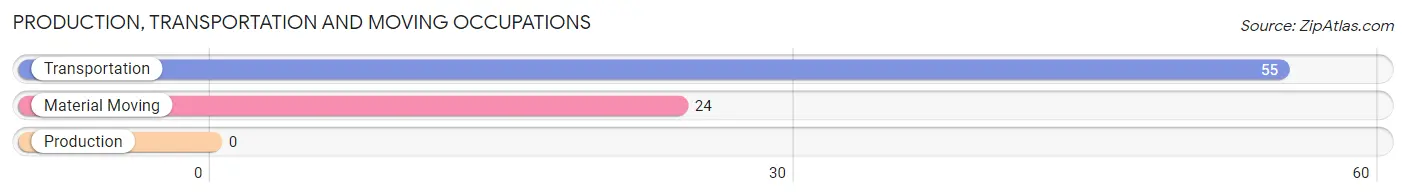
Production, Transportation and Moving Occupations
The most common Production, Transportation and Moving occupations in Chatham are Transportation (55 | 5.1%), and Material Moving (24 | 2.2%).
Production, Transportation and Moving Occupations by Sex
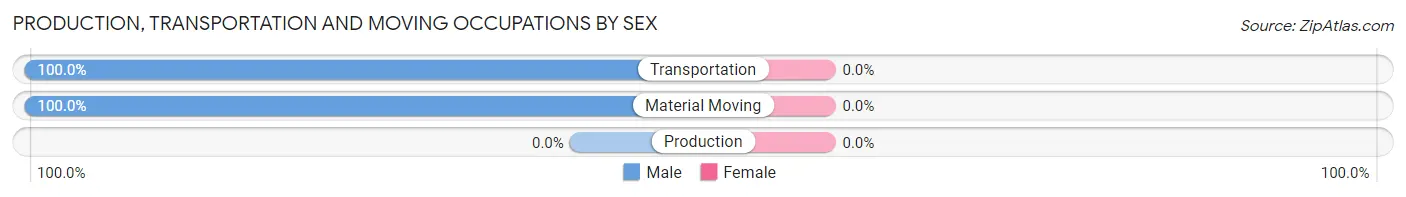
| Occupation | Male | Female |
| Production | 0 (0.0%) | 0 (0.0%) |
| Transportation | 55 (100.0%) | 0 (0.0%) |
| Material Moving | 24 (100.0%) | 0 (0.0%) |
| Total (Category) | 79 (100.0%) | 0 (0.0%) |
| Total (Overall) | 508 (47.6%) | 559 (52.4%) |
Employment Industries by Sex in Chatham
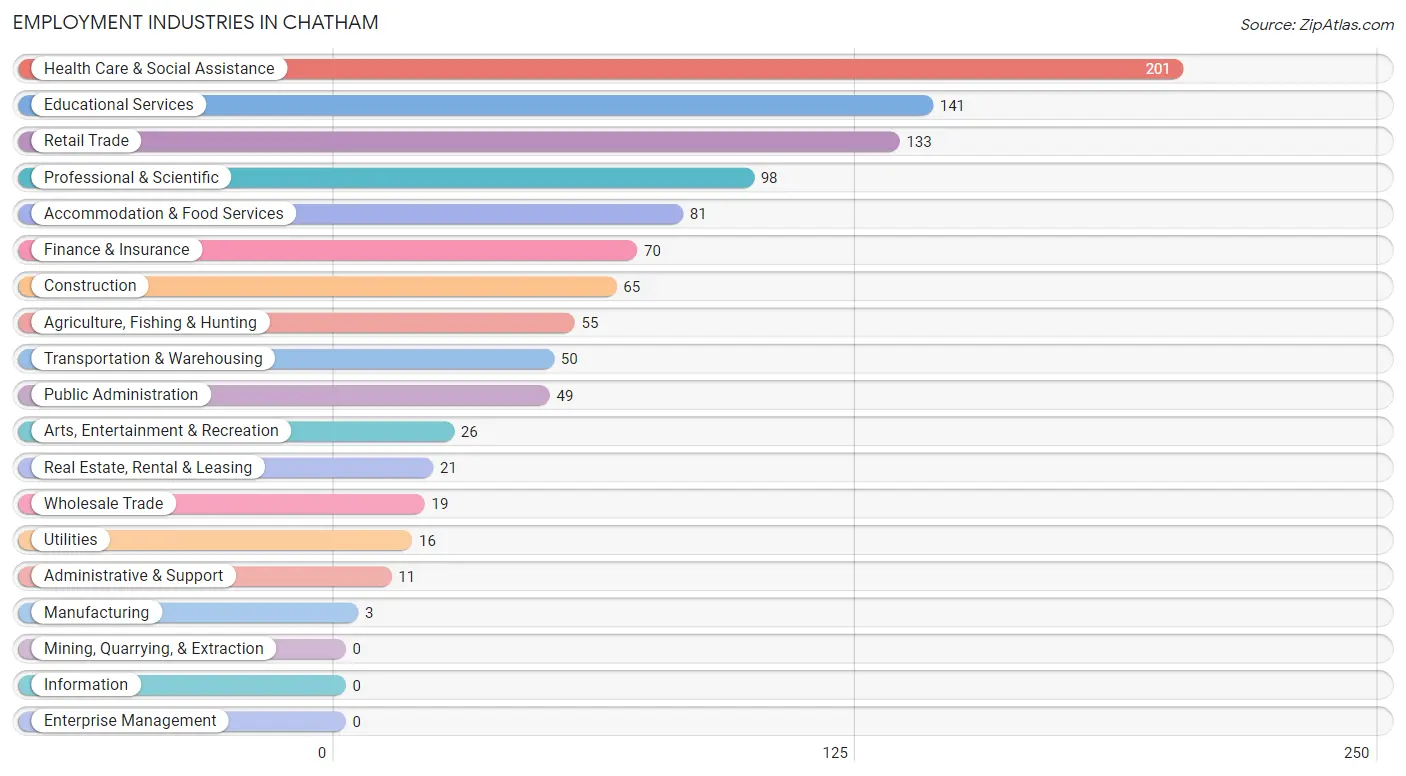
Employment Industries in Chatham
The major employment industries in Chatham include Health Care & Social Assistance (201 | 18.8%), Educational Services (141 | 13.2%), Retail Trade (133 | 12.5%), Professional & Scientific (98 | 9.2%), and Accommodation & Food Services (81 | 7.6%).
Employment Industries by Sex in Chatham
The Chatham industries that see more men than women are Construction (100.0%), Wholesale Trade (100.0%), and Transportation & Warehousing (100.0%), whereas the industries that tend to have a higher number of women are Manufacturing (100.0%), Health Care & Social Assistance (89.5%), and Accommodation & Food Services (76.5%).
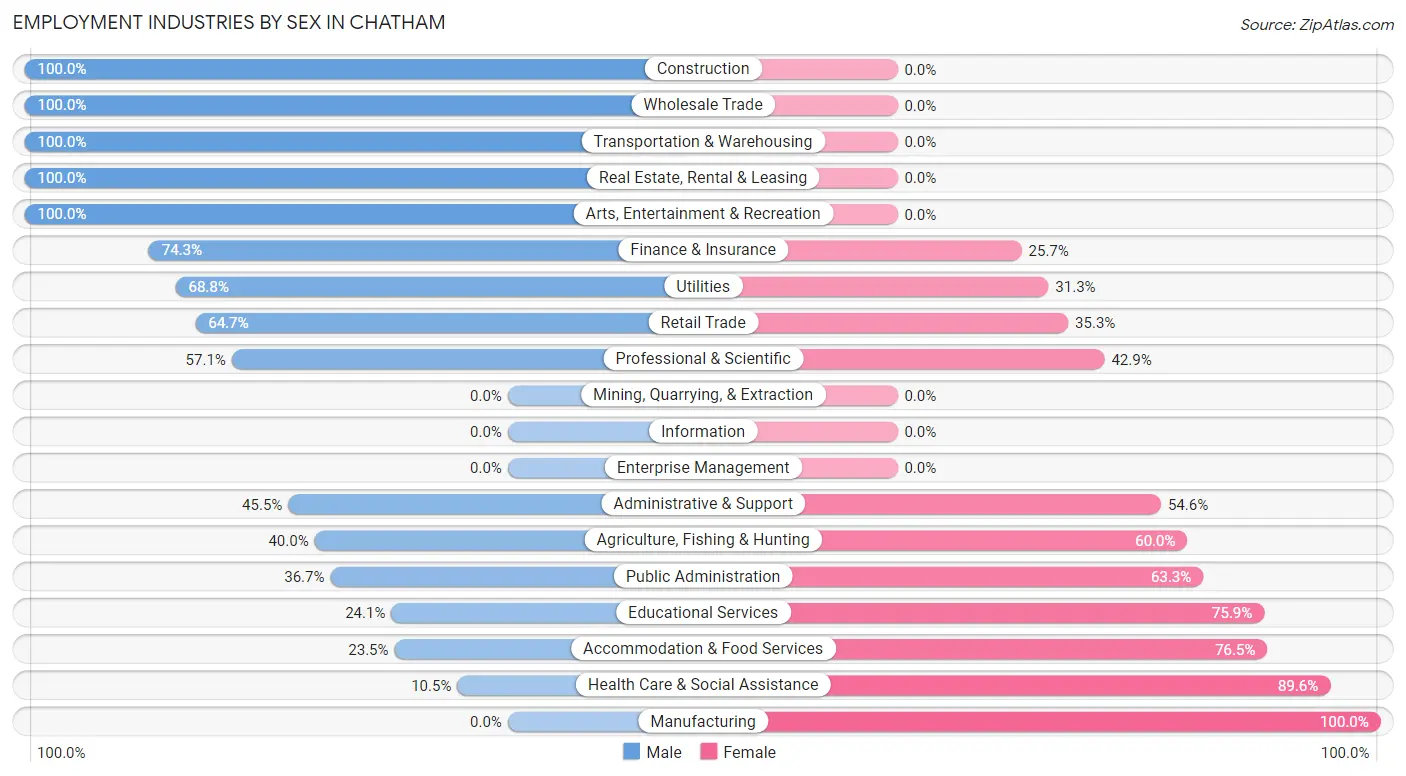
| Industry | Male | Female |
| Agriculture, Fishing & Hunting | 22 (40.0%) | 33 (60.0%) |
| Mining, Quarrying, & Extraction | 0 (0.0%) | 0 (0.0%) |
| Construction | 65 (100.0%) | 0 (0.0%) |
| Manufacturing | 0 (0.0%) | 3 (100.0%) |
| Wholesale Trade | 19 (100.0%) | 0 (0.0%) |
| Retail Trade | 86 (64.7%) | 47 (35.3%) |
| Transportation & Warehousing | 50 (100.0%) | 0 (0.0%) |
| Utilities | 11 (68.8%) | 5 (31.2%) |
| Information | 0 (0.0%) | 0 (0.0%) |
| Finance & Insurance | 52 (74.3%) | 18 (25.7%) |
| Real Estate, Rental & Leasing | 21 (100.0%) | 0 (0.0%) |
| Professional & Scientific | 56 (57.1%) | 42 (42.9%) |
| Enterprise Management | 0 (0.0%) | 0 (0.0%) |
| Administrative & Support | 5 (45.5%) | 6 (54.5%) |
| Educational Services | 34 (24.1%) | 107 (75.9%) |
| Health Care & Social Assistance | 21 (10.4%) | 180 (89.5%) |
| Arts, Entertainment & Recreation | 26 (100.0%) | 0 (0.0%) |
| Accommodation & Food Services | 19 (23.5%) | 62 (76.5%) |
| Public Administration | 18 (36.7%) | 31 (63.3%) |
| Total | 508 (47.6%) | 559 (52.4%) |
Education in Chatham
School Enrollment in Chatham
The most common levels of schooling among the 287 students in Chatham are middle school (86 | 30.0%), college / undergraduate (68 | 23.7%), and high school (63 | 22.0%).
| School Level | # Students | % Students |
| Nursery / Preschool | 5 | 1.7% |
| Kindergarten | 7 | 2.4% |
| Elementary School | 48 | 16.7% |
| Middle School | 86 | 30.0% |
| High School | 63 | 22.0% |
| College / Undergraduate | 68 | 23.7% |
| Graduate / Professional | 10 | 3.5% |
| Total | 287 | 100.0% |
School Enrollment by Age by Funding Source in Chatham
Out of a total of 287 students who are enrolled in schools in Chatham, 49 (17.1%) attend a private institution, while the remaining 238 (82.9%) are enrolled in public schools. The age group of 3 to 4 year olds has the highest likelihood of being enrolled in private schools, with 5 (100.0% in the age bracket) enrolled. Conversely, the age group of 5 to 9 year old has the lowest likelihood of being enrolled in a private school, with 55 (100.0% in the age bracket) attending a public institution.
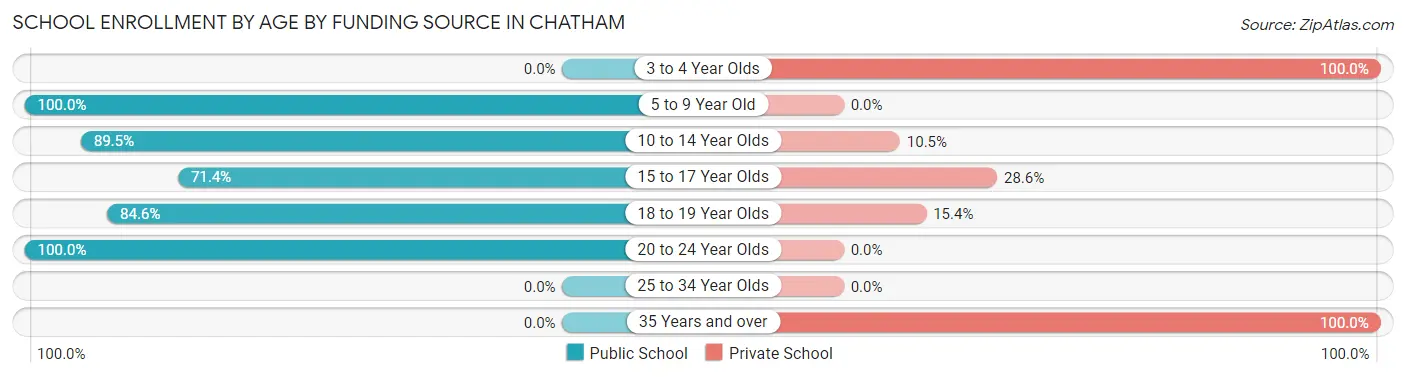
| Age Bracket | Public School | Private School |
| 3 to 4 Year Olds | 0 (0.0%) | 5 (100.0%) |
| 5 to 9 Year Old | 55 (100.0%) | 0 (0.0%) |
| 10 to 14 Year Olds | 77 (89.5%) | 9 (10.5%) |
| 15 to 17 Year Olds | 45 (71.4%) | 18 (28.6%) |
| 18 to 19 Year Olds | 22 (84.6%) | 4 (15.4%) |
| 20 to 24 Year Olds | 39 (100.0%) | 0 (0.0%) |
| 25 to 34 Year Olds | 0 (0.0%) | 0 (0.0%) |
| 35 Years and over | 0 (0.0%) | 13 (100.0%) |
| Total | 238 (82.9%) | 49 (17.1%) |
Educational Attainment by Field of Study in Chatham
Liberal arts & history (141 | 21.7%), visual & performing arts (96 | 14.8%), education (85 | 13.1%), business (59 | 9.1%), and bio, nature & agricultural (58 | 8.9%) are the most common fields of study among 649 individuals in Chatham who have obtained a bachelor's degree or higher.
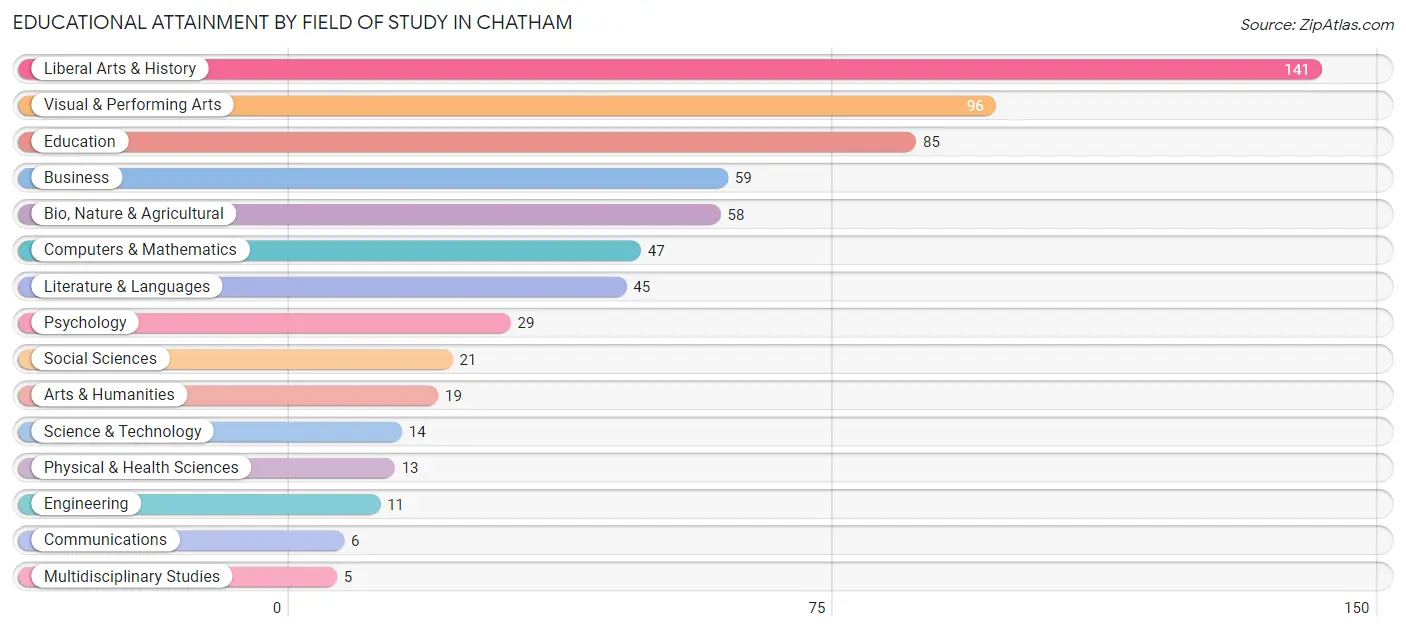
| Field of Study | # Graduates | % Graduates |
| Computers & Mathematics | 47 | 7.2% |
| Bio, Nature & Agricultural | 58 | 8.9% |
| Physical & Health Sciences | 13 | 2.0% |
| Psychology | 29 | 4.5% |
| Social Sciences | 21 | 3.2% |
| Engineering | 11 | 1.7% |
| Multidisciplinary Studies | 5 | 0.8% |
| Science & Technology | 14 | 2.2% |
| Business | 59 | 9.1% |
| Education | 85 | 13.1% |
| Literature & Languages | 45 | 6.9% |
| Liberal Arts & History | 141 | 21.7% |
| Visual & Performing Arts | 96 | 14.8% |
| Communications | 6 | 0.9% |
| Arts & Humanities | 19 | 2.9% |
| Total | 649 | 100.0% |
Transportation & Commute in Chatham
Vehicle Availability by Sex in Chatham
The most prevalent vehicle ownership categories in Chatham are males with 2 vehicles (325, accounting for 64.0%) and females with 2 vehicles (261, making up 58.1%).
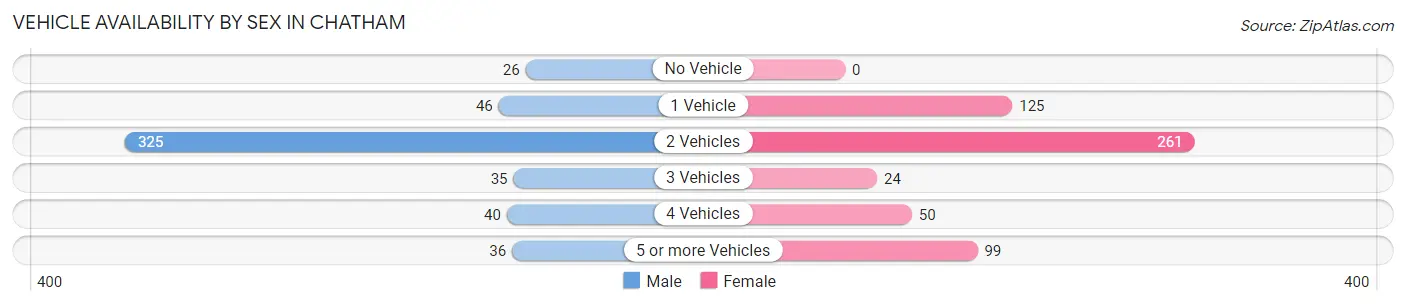
| Vehicles Available | Male | Female |
| No Vehicle | 26 (5.1%) | 0 (0.0%) |
| 1 Vehicle | 46 (9.1%) | 125 (22.4%) |
| 2 Vehicles | 325 (64.0%) | 261 (46.7%) |
| 3 Vehicles | 35 (6.9%) | 24 (4.3%) |
| 4 Vehicles | 40 (7.9%) | 50 (8.9%) |
| 5 or more Vehicles | 36 (7.1%) | 99 (17.7%) |
| Total | 508 (100.0%) | 559 (100.0%) |
Commute Time in Chatham
The most frequently occuring commute durations in Chatham are less than 5 minutes (170 commuters, 17.6%), 20 to 24 minutes (158 commuters, 16.4%), and 15 to 19 minutes (150 commuters, 15.5%).
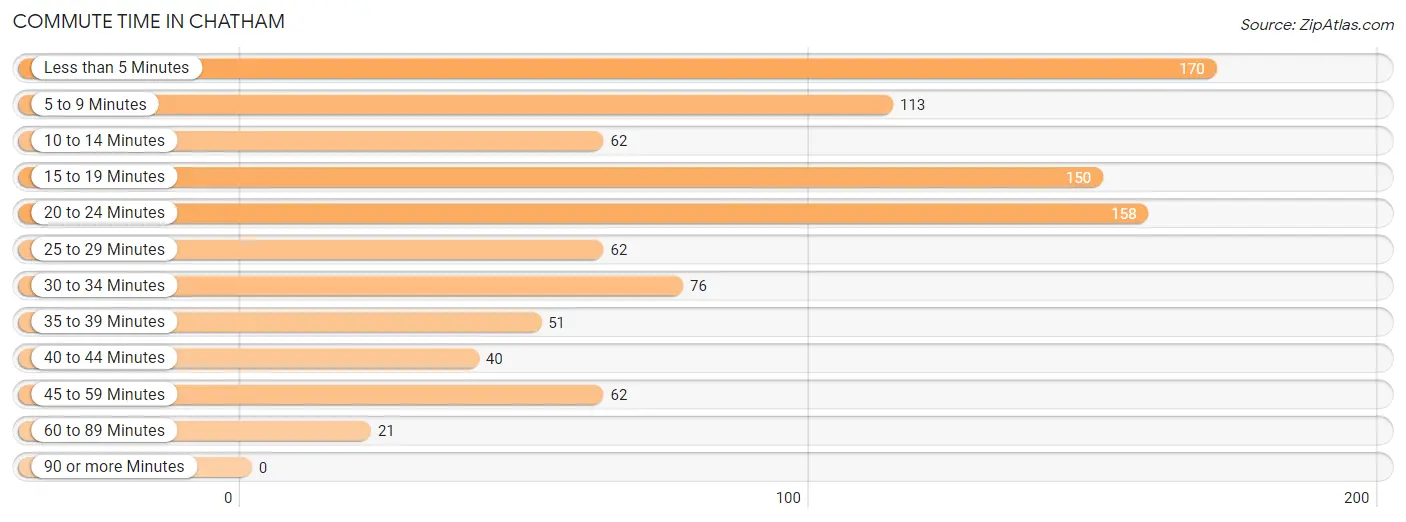
| Commute Time | # Commuters | % Commuters |
| Less than 5 Minutes | 170 | 17.6% |
| 5 to 9 Minutes | 113 | 11.7% |
| 10 to 14 Minutes | 62 | 6.4% |
| 15 to 19 Minutes | 150 | 15.5% |
| 20 to 24 Minutes | 158 | 16.4% |
| 25 to 29 Minutes | 62 | 6.4% |
| 30 to 34 Minutes | 76 | 7.9% |
| 35 to 39 Minutes | 51 | 5.3% |
| 40 to 44 Minutes | 40 | 4.2% |
| 45 to 59 Minutes | 62 | 6.4% |
| 60 to 89 Minutes | 21 | 2.2% |
| 90 or more Minutes | 0 | 0.0% |
Commute Time by Sex in Chatham
The most common commute times in Chatham are 5 to 9 minutes (69 commuters, 14.6%) for males and 20 to 24 minutes (121 commuters, 24.6%) for females.
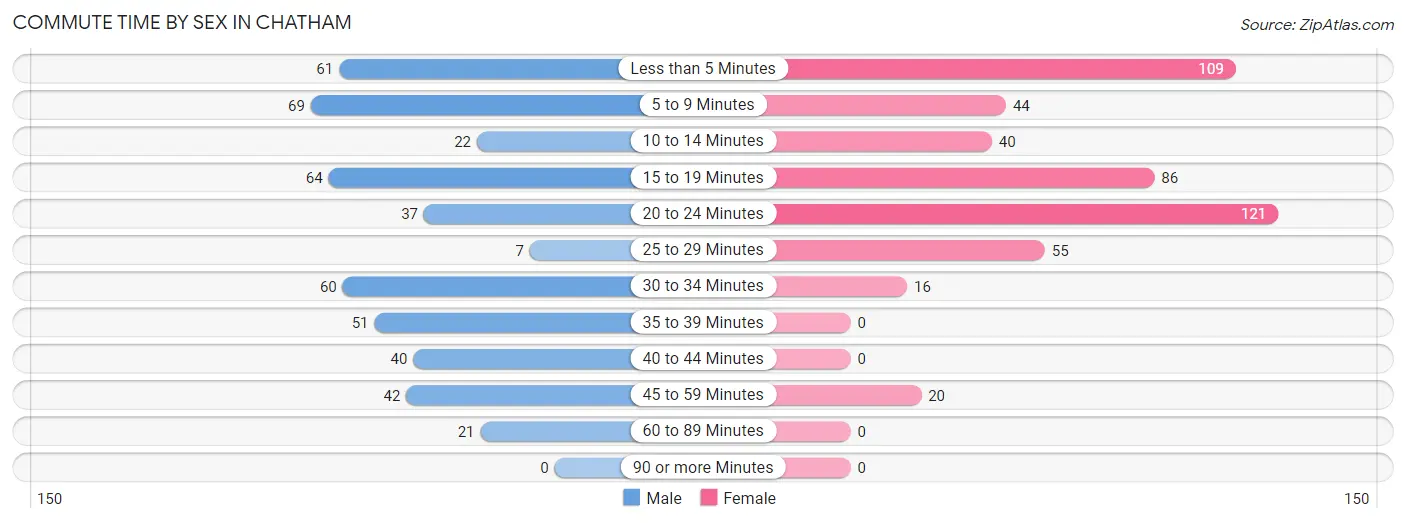
| Commute Time | Male | Female |
| Less than 5 Minutes | 61 (12.9%) | 109 (22.2%) |
| 5 to 9 Minutes | 69 (14.6%) | 44 (9.0%) |
| 10 to 14 Minutes | 22 (4.6%) | 40 (8.2%) |
| 15 to 19 Minutes | 64 (13.5%) | 86 (17.5%) |
| 20 to 24 Minutes | 37 (7.8%) | 121 (24.6%) |
| 25 to 29 Minutes | 7 (1.5%) | 55 (11.2%) |
| 30 to 34 Minutes | 60 (12.7%) | 16 (3.3%) |
| 35 to 39 Minutes | 51 (10.8%) | 0 (0.0%) |
| 40 to 44 Minutes | 40 (8.4%) | 0 (0.0%) |
| 45 to 59 Minutes | 42 (8.9%) | 20 (4.1%) |
| 60 to 89 Minutes | 21 (4.4%) | 0 (0.0%) |
| 90 or more Minutes | 0 (0.0%) | 0 (0.0%) |
Time of Departure to Work by Sex in Chatham
The most frequent times of departure to work in Chatham are 7:00 AM to 7:29 AM (105, 22.2%) for males and 7:30 AM to 7:59 AM (93, 18.9%) for females.
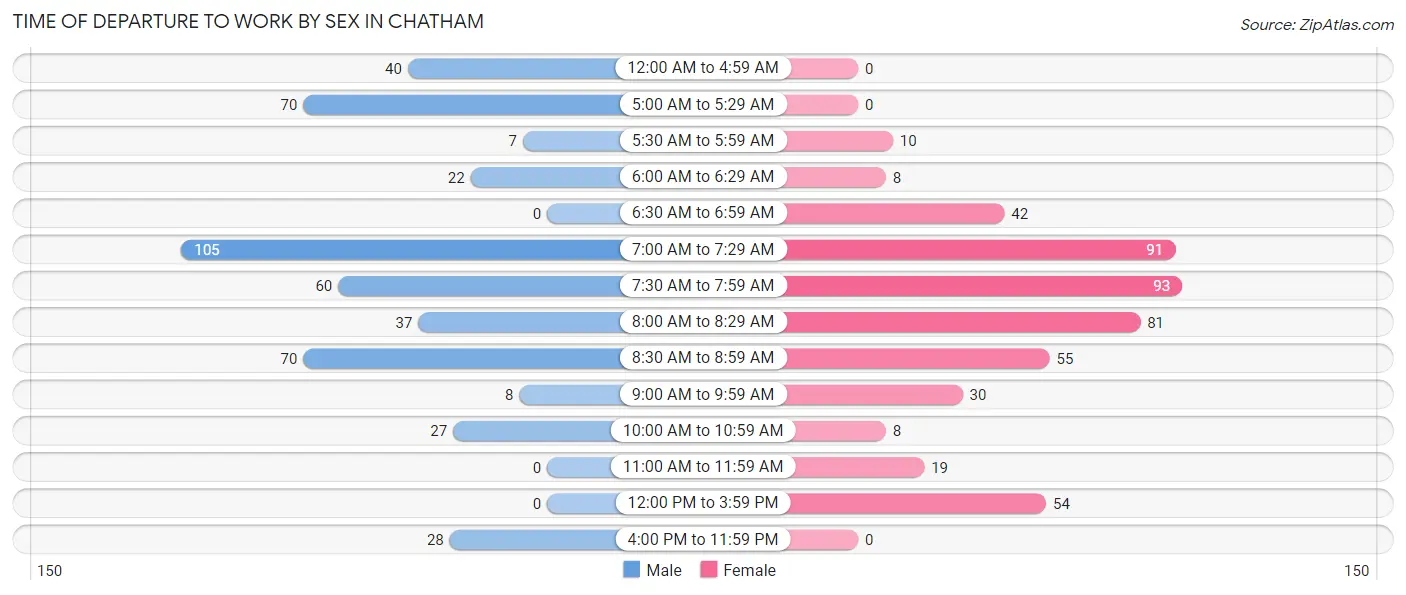
| Time of Departure | Male | Female |
| 12:00 AM to 4:59 AM | 40 (8.4%) | 0 (0.0%) |
| 5:00 AM to 5:29 AM | 70 (14.8%) | 0 (0.0%) |
| 5:30 AM to 5:59 AM | 7 (1.5%) | 10 (2.0%) |
| 6:00 AM to 6:29 AM | 22 (4.6%) | 8 (1.6%) |
| 6:30 AM to 6:59 AM | 0 (0.0%) | 42 (8.6%) |
| 7:00 AM to 7:29 AM | 105 (22.2%) | 91 (18.5%) |
| 7:30 AM to 7:59 AM | 60 (12.7%) | 93 (18.9%) |
| 8:00 AM to 8:29 AM | 37 (7.8%) | 81 (16.5%) |
| 8:30 AM to 8:59 AM | 70 (14.8%) | 55 (11.2%) |
| 9:00 AM to 9:59 AM | 8 (1.7%) | 30 (6.1%) |
| 10:00 AM to 10:59 AM | 27 (5.7%) | 8 (1.6%) |
| 11:00 AM to 11:59 AM | 0 (0.0%) | 19 (3.9%) |
| 12:00 PM to 3:59 PM | 0 (0.0%) | 54 (11.0%) |
| 4:00 PM to 11:59 PM | 28 (5.9%) | 0 (0.0%) |
| Total | 474 (100.0%) | 491 (100.0%) |
Housing Occupancy in Chatham
Occupancy by Ownership in Chatham
Of the total 807 dwellings in Chatham, owner-occupied units account for 446 (55.3%), while renter-occupied units make up 361 (44.7%).
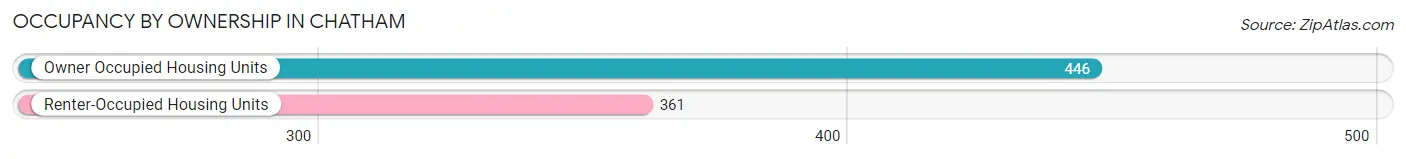
| Occupancy | # Housing Units | % Housing Units |
| Owner Occupied Housing Units | 446 | 55.3% |
| Renter-Occupied Housing Units | 361 | 44.7% |
| Total Occupied Housing Units | 807 | 100.0% |
Occupancy by Household Size in Chatham
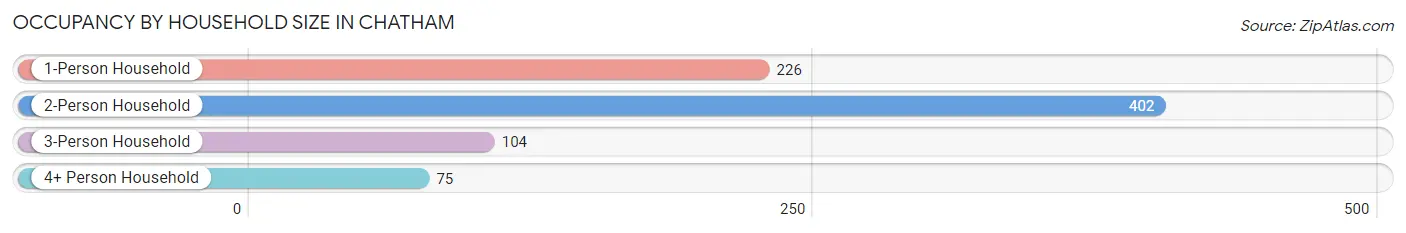
| Household Size | # Housing Units | % Housing Units |
| 1-Person Household | 226 | 28.0% |
| 2-Person Household | 402 | 49.8% |
| 3-Person Household | 104 | 12.9% |
| 4+ Person Household | 75 | 9.3% |
| Total Housing Units | 807 | 100.0% |
Occupancy by Ownership by Household Size in Chatham
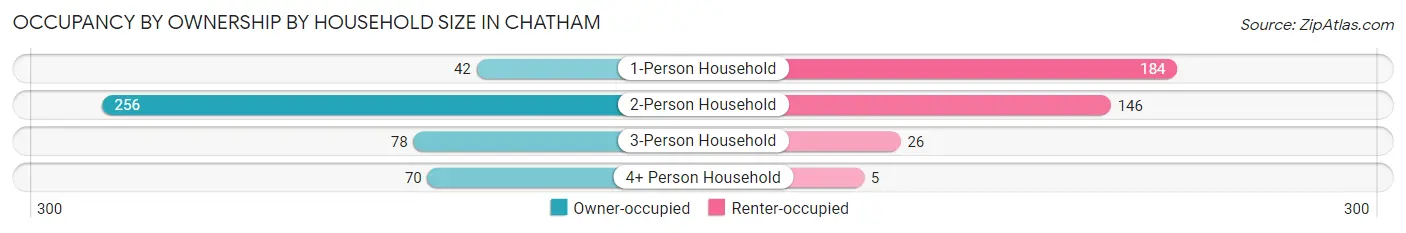
| Household Size | Owner-occupied | Renter-occupied |
| 1-Person Household | 42 (18.6%) | 184 (81.4%) |
| 2-Person Household | 256 (63.7%) | 146 (36.3%) |
| 3-Person Household | 78 (75.0%) | 26 (25.0%) |
| 4+ Person Household | 70 (93.3%) | 5 (6.7%) |
| Total Housing Units | 446 (55.3%) | 361 (44.7%) |
Occupancy by Educational Attainment in Chatham
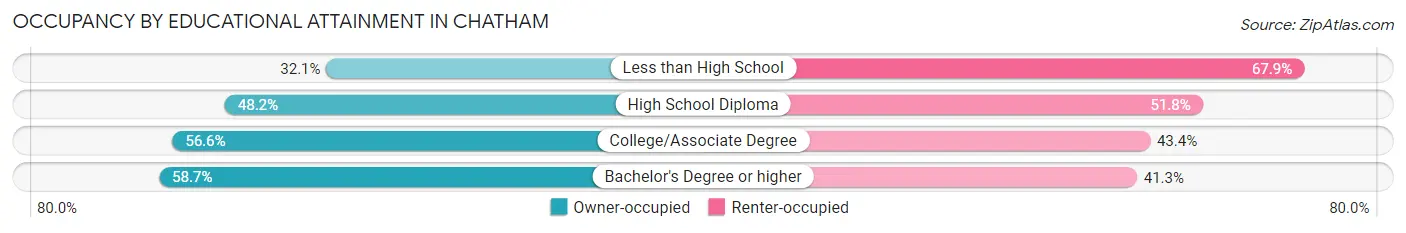
| Household Size | Owner-occupied | Renter-occupied |
| Less than High School | 9 (32.1%) | 19 (67.9%) |
| High School Diploma | 68 (48.2%) | 73 (51.8%) |
| College/Associate Degree | 142 (56.6%) | 109 (43.4%) |
| Bachelor's Degree or higher | 227 (58.7%) | 160 (41.3%) |
Occupancy by Age of Householder in Chatham
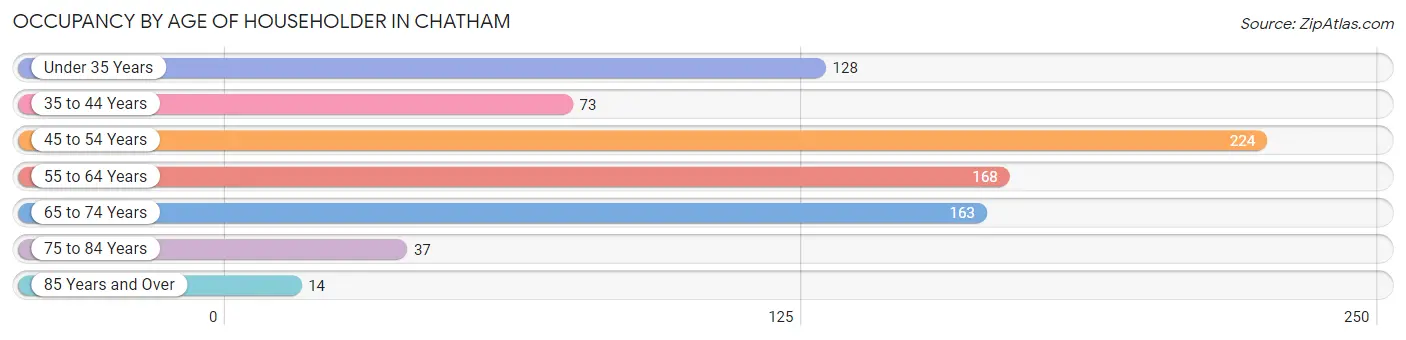
| Age Bracket | # Households | % Households |
| Under 35 Years | 128 | 15.9% |
| 35 to 44 Years | 73 | 9.0% |
| 45 to 54 Years | 224 | 27.8% |
| 55 to 64 Years | 168 | 20.8% |
| 65 to 74 Years | 163 | 20.2% |
| 75 to 84 Years | 37 | 4.6% |
| 85 Years and Over | 14 | 1.7% |
| Total | 807 | 100.0% |
Housing Finances in Chatham
Median Income by Occupancy in Chatham
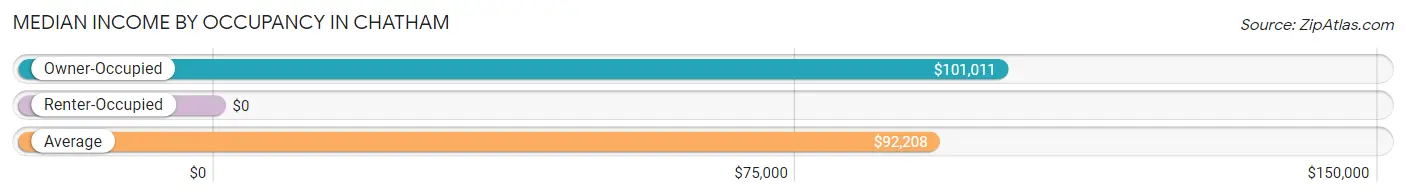
| Occupancy Type | # Households | Median Income |
| Owner-Occupied | 446 (55.3%) | $101,011 |
| Renter-Occupied | 361 (44.7%) | $0 |
| Average | 807 (100.0%) | $92,208 |
Occupancy by Householder Income Bracket in Chatham
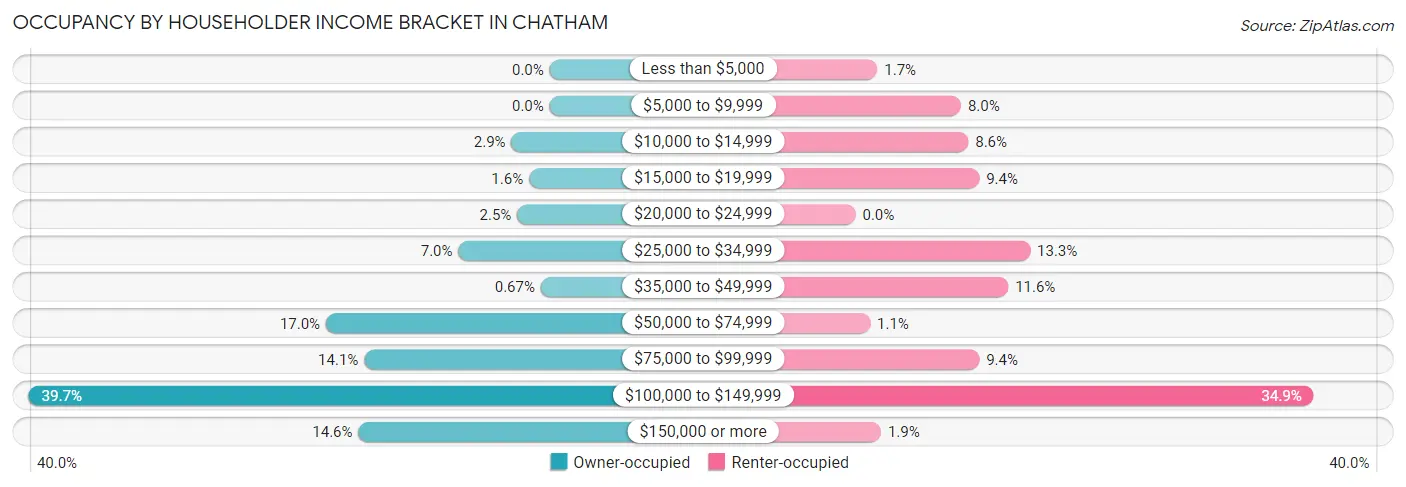
| Income Bracket | Owner-occupied | Renter-occupied |
| Less than $5,000 | 0 (0.0%) | 6 (1.7%) |
| $5,000 to $9,999 | 0 (0.0%) | 29 (8.0%) |
| $10,000 to $14,999 | 13 (2.9%) | 31 (8.6%) |
| $15,000 to $19,999 | 7 (1.6%) | 34 (9.4%) |
| $20,000 to $24,999 | 11 (2.5%) | 0 (0.0%) |
| $25,000 to $34,999 | 31 (7.0%) | 48 (13.3%) |
| $35,000 to $49,999 | 3 (0.7%) | 42 (11.6%) |
| $50,000 to $74,999 | 76 (17.0%) | 4 (1.1%) |
| $75,000 to $99,999 | 63 (14.1%) | 34 (9.4%) |
| $100,000 to $149,999 | 177 (39.7%) | 126 (34.9%) |
| $150,000 or more | 65 (14.6%) | 7 (1.9%) |
| Total | 446 (100.0%) | 361 (100.0%) |
Monthly Housing Cost Tiers in Chatham
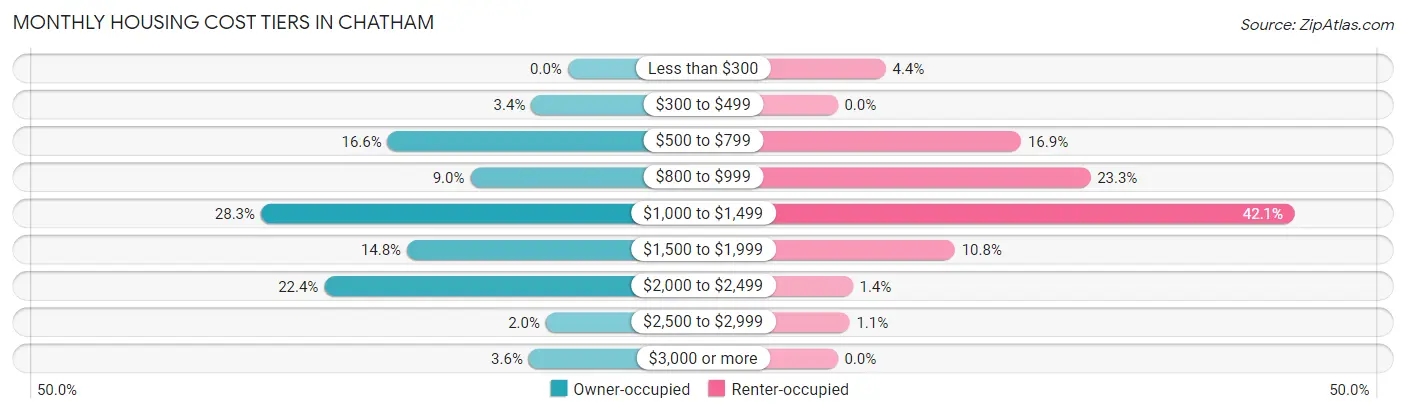
| Monthly Cost | Owner-occupied | Renter-occupied |
| Less than $300 | 0 (0.0%) | 16 (4.4%) |
| $300 to $499 | 15 (3.4%) | 0 (0.0%) |
| $500 to $799 | 74 (16.6%) | 61 (16.9%) |
| $800 to $999 | 40 (9.0%) | 84 (23.3%) |
| $1,000 to $1,499 | 126 (28.2%) | 152 (42.1%) |
| $1,500 to $1,999 | 66 (14.8%) | 39 (10.8%) |
| $2,000 to $2,499 | 100 (22.4%) | 5 (1.4%) |
| $2,500 to $2,999 | 9 (2.0%) | 4 (1.1%) |
| $3,000 or more | 16 (3.6%) | 0 (0.0%) |
| Total | 446 (100.0%) | 361 (100.0%) |
Physical Housing Characteristics in Chatham
Housing Structures in Chatham
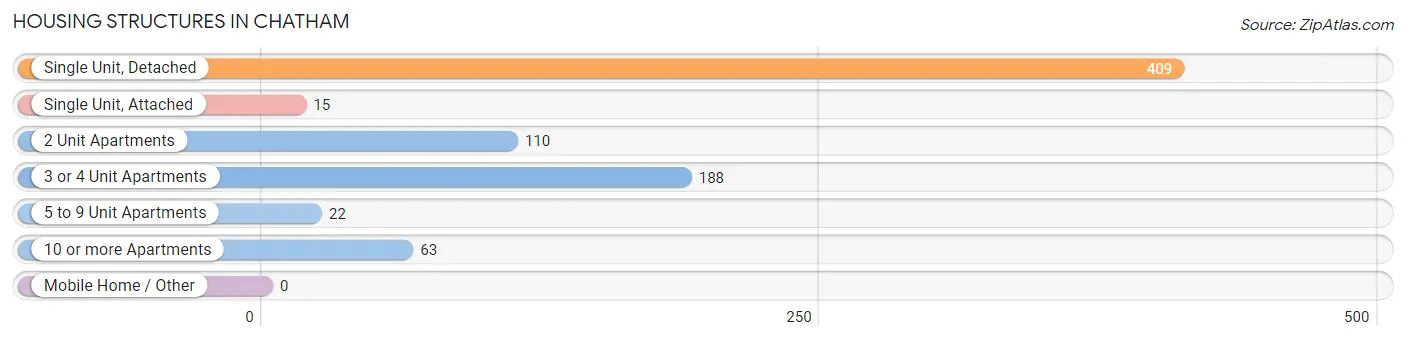
| Structure Type | # Housing Units | % Housing Units |
| Single Unit, Detached | 409 | 50.7% |
| Single Unit, Attached | 15 | 1.9% |
| 2 Unit Apartments | 110 | 13.6% |
| 3 or 4 Unit Apartments | 188 | 23.3% |
| 5 to 9 Unit Apartments | 22 | 2.7% |
| 10 or more Apartments | 63 | 7.8% |
| Mobile Home / Other | 0 | 0.0% |
| Total | 807 | 100.0% |
Housing Structures by Occupancy in Chatham
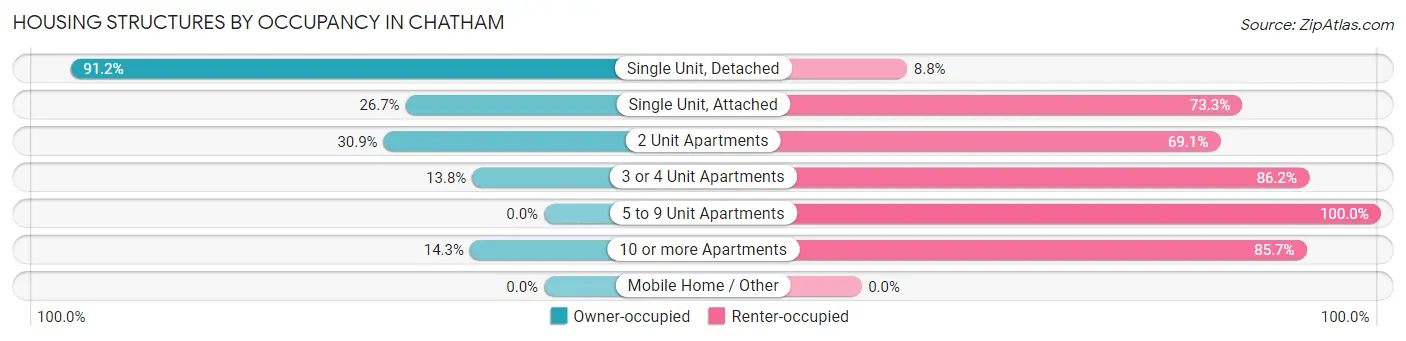
| Structure Type | Owner-occupied | Renter-occupied |
| Single Unit, Detached | 373 (91.2%) | 36 (8.8%) |
| Single Unit, Attached | 4 (26.7%) | 11 (73.3%) |
| 2 Unit Apartments | 34 (30.9%) | 76 (69.1%) |
| 3 or 4 Unit Apartments | 26 (13.8%) | 162 (86.2%) |
| 5 to 9 Unit Apartments | 0 (0.0%) | 22 (100.0%) |
| 10 or more Apartments | 9 (14.3%) | 54 (85.7%) |
| Mobile Home / Other | 0 (0.0%) | 0 (0.0%) |
| Total | 446 (55.3%) | 361 (44.7%) |
Housing Structures by Number of Rooms in Chatham
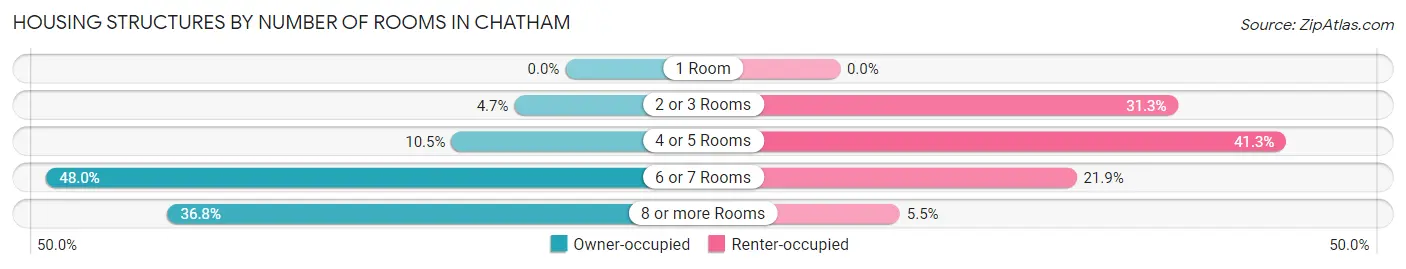
| Number of Rooms | Owner-occupied | Renter-occupied |
| 1 Room | 0 (0.0%) | 0 (0.0%) |
| 2 or 3 Rooms | 21 (4.7%) | 113 (31.3%) |
| 4 or 5 Rooms | 47 (10.5%) | 149 (41.3%) |
| 6 or 7 Rooms | 214 (48.0%) | 79 (21.9%) |
| 8 or more Rooms | 164 (36.8%) | 20 (5.5%) |
| Total | 446 (100.0%) | 361 (100.0%) |
Housing Structure by Heating Type in Chatham
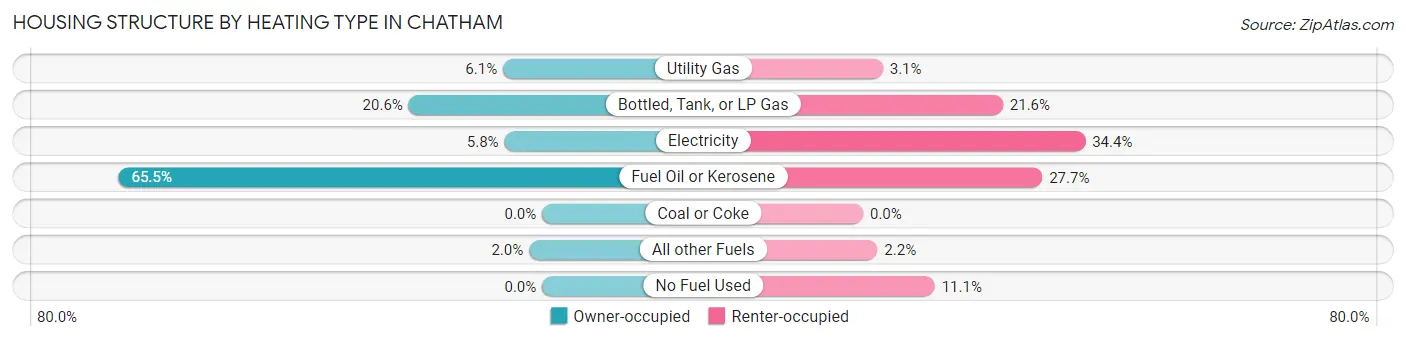
| Heating Type | Owner-occupied | Renter-occupied |
| Utility Gas | 27 (6.0%) | 11 (3.0%) |
| Bottled, Tank, or LP Gas | 92 (20.6%) | 78 (21.6%) |
| Electricity | 26 (5.8%) | 124 (34.4%) |
| Fuel Oil or Kerosene | 292 (65.5%) | 100 (27.7%) |
| Coal or Coke | 0 (0.0%) | 0 (0.0%) |
| All other Fuels | 9 (2.0%) | 8 (2.2%) |
| No Fuel Used | 0 (0.0%) | 40 (11.1%) |
| Total | 446 (100.0%) | 361 (100.0%) |
Household Vehicle Usage in Chatham
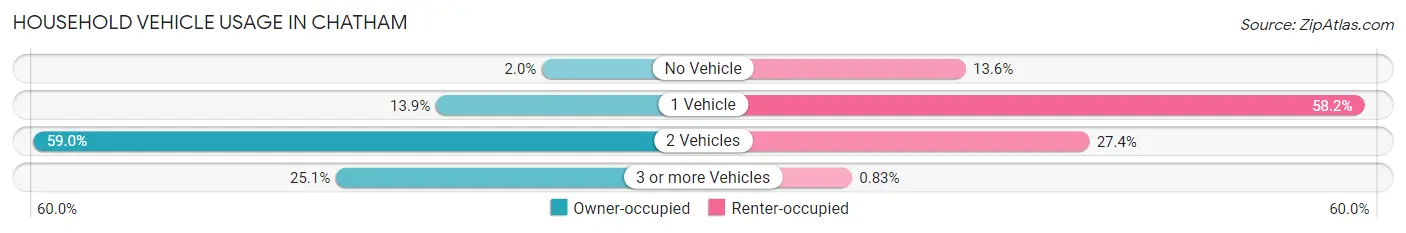
| Vehicles per Household | Owner-occupied | Renter-occupied |
| No Vehicle | 9 (2.0%) | 49 (13.6%) |
| 1 Vehicle | 62 (13.9%) | 210 (58.2%) |
| 2 Vehicles | 263 (59.0%) | 99 (27.4%) |
| 3 or more Vehicles | 112 (25.1%) | 3 (0.8%) |
| Total | 446 (100.0%) | 361 (100.0%) |
Real Estate & Mortgages in Chatham
Real Estate and Mortgage Overview in Chatham
| Characteristic | Without Mortgage | With Mortgage |
| Housing Units | 171 | 275 |
| Median Property Value | $308,500 | $228,700 |
| Median Household Income | $73,029 | $41 |
| Monthly Housing Costs | $788 | $16 |
| Real Estate Taxes | $4,567 | $26 |
Property Value by Mortgage Status in Chatham
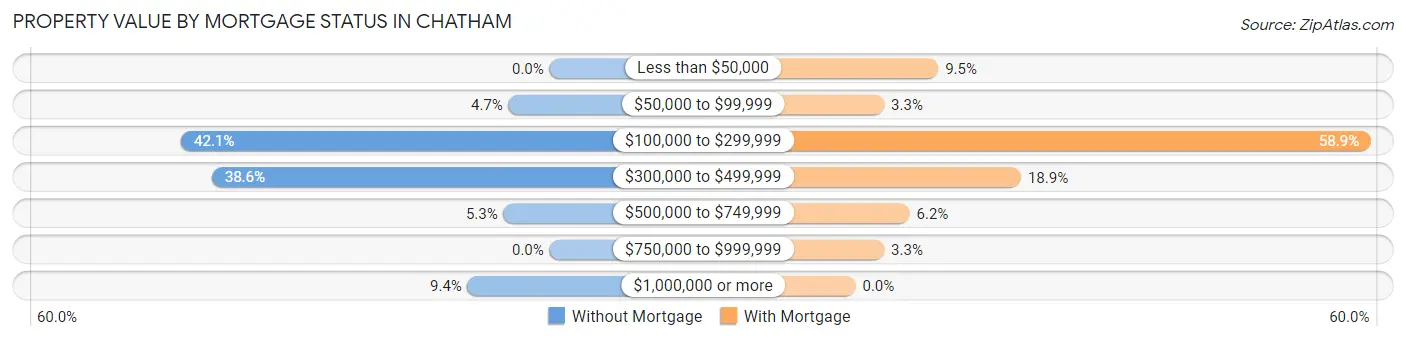
| Property Value | Without Mortgage | With Mortgage |
| Less than $50,000 | 0 (0.0%) | 26 (9.5%) |
| $50,000 to $99,999 | 8 (4.7%) | 9 (3.3%) |
| $100,000 to $299,999 | 72 (42.1%) | 162 (58.9%) |
| $300,000 to $499,999 | 66 (38.6%) | 52 (18.9%) |
| $500,000 to $749,999 | 9 (5.3%) | 17 (6.2%) |
| $750,000 to $999,999 | 0 (0.0%) | 9 (3.3%) |
| $1,000,000 or more | 16 (9.4%) | 0 (0.0%) |
| Total | 171 (100.0%) | 275 (100.0%) |
Household Income by Mortgage Status in Chatham
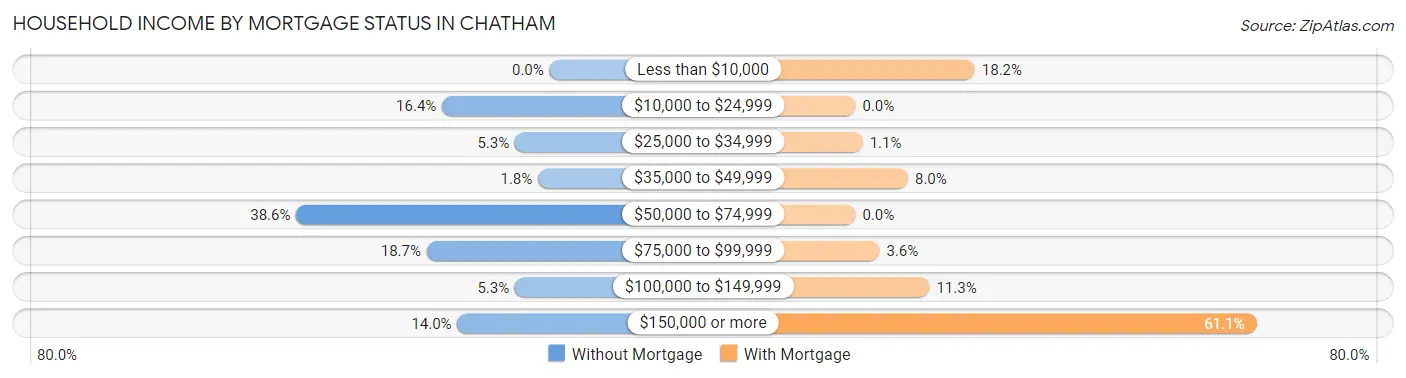
| Household Income | Without Mortgage | With Mortgage |
| Less than $10,000 | 0 (0.0%) | 50 (18.2%) |
| $10,000 to $24,999 | 28 (16.4%) | 0 (0.0%) |
| $25,000 to $34,999 | 9 (5.3%) | 3 (1.1%) |
| $35,000 to $49,999 | 3 (1.8%) | 22 (8.0%) |
| $50,000 to $74,999 | 66 (38.6%) | 0 (0.0%) |
| $75,000 to $99,999 | 32 (18.7%) | 10 (3.6%) |
| $100,000 to $149,999 | 9 (5.3%) | 31 (11.3%) |
| $150,000 or more | 24 (14.0%) | 168 (61.1%) |
| Total | 171 (100.0%) | 275 (100.0%) |
Property Value to Household Income Ratio in Chatham
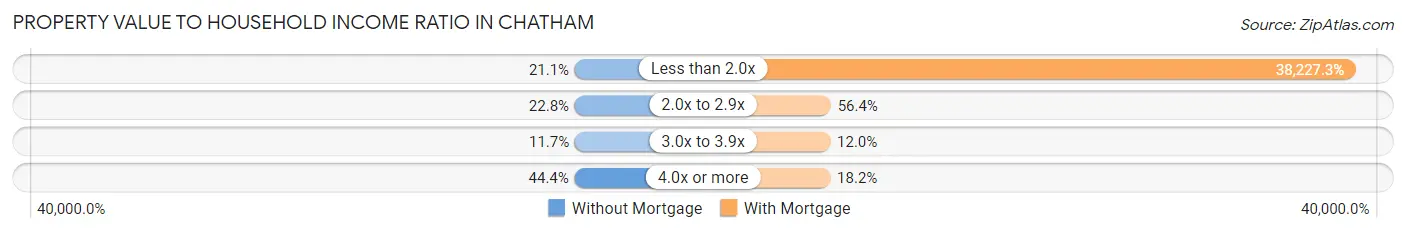
| Value-to-Income Ratio | Without Mortgage | With Mortgage |
| Less than 2.0x | 36 (21.0%) | 105,125 (38,227.3%) |
| 2.0x to 2.9x | 39 (22.8%) | 155 (56.4%) |
| 3.0x to 3.9x | 20 (11.7%) | 33 (12.0%) |
| 4.0x or more | 76 (44.4%) | 50 (18.2%) |
| Total | 171 (100.0%) | 275 (100.0%) |
Real Estate Taxes by Mortgage Status in Chatham
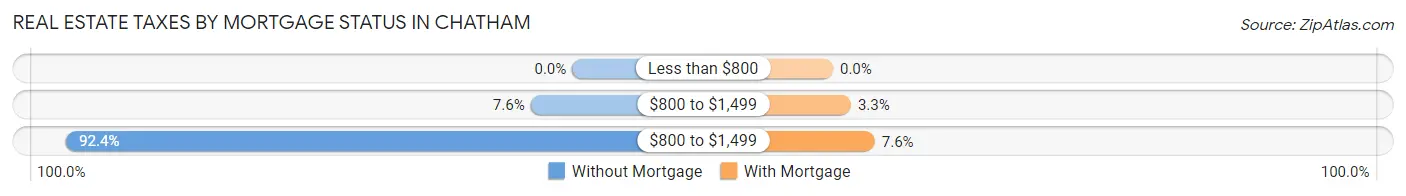
| Property Taxes | Without Mortgage | With Mortgage |
| Less than $800 | 0 (0.0%) | 0 (0.0%) |
| $800 to $1,499 | 13 (7.6%) | 9 (3.3%) |
| $800 to $1,499 | 158 (92.4%) | 21 (7.6%) |
| Total | 171 (100.0%) | 275 (100.0%) |
Health & Disability in Chatham
Health Insurance Coverage by Age in Chatham
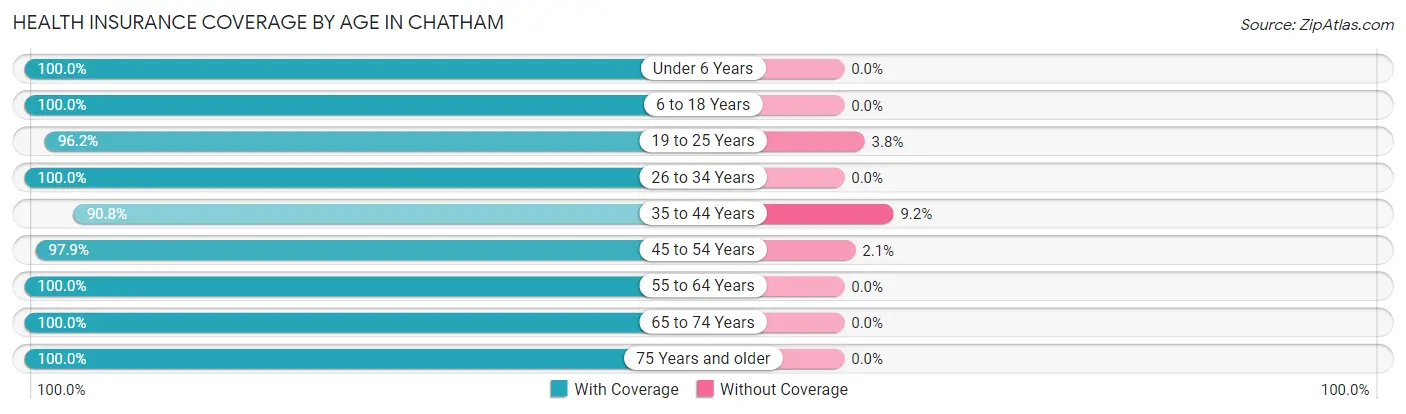
| Age Bracket | With Coverage | Without Coverage |
| Under 6 Years | 46 (100.0%) | 0 (0.0%) |
| 6 to 18 Years | 223 (100.0%) | 0 (0.0%) |
| 19 to 25 Years | 228 (96.2%) | 9 (3.8%) |
| 26 to 34 Years | 162 (100.0%) | 0 (0.0%) |
| 35 to 44 Years | 99 (90.8%) | 10 (9.2%) |
| 45 to 54 Years | 380 (97.9%) | 8 (2.1%) |
| 55 to 64 Years | 275 (100.0%) | 0 (0.0%) |
| 65 to 74 Years | 229 (100.0%) | 0 (0.0%) |
| 75 Years and older | 94 (100.0%) | 0 (0.0%) |
| Total | 1,736 (98.5%) | 27 (1.5%) |
Health Insurance Coverage by Citizenship Status in Chatham
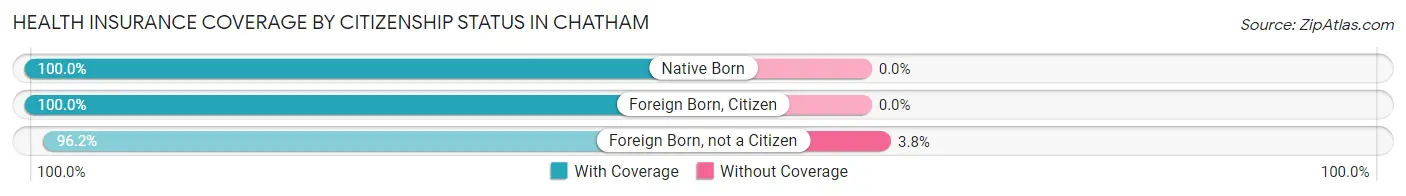
| Citizenship Status | With Coverage | Without Coverage |
| Native Born | 46 (100.0%) | 0 (0.0%) |
| Foreign Born, Citizen | 223 (100.0%) | 0 (0.0%) |
| Foreign Born, not a Citizen | 228 (96.2%) | 9 (3.8%) |
Health Insurance Coverage by Household Income in Chatham
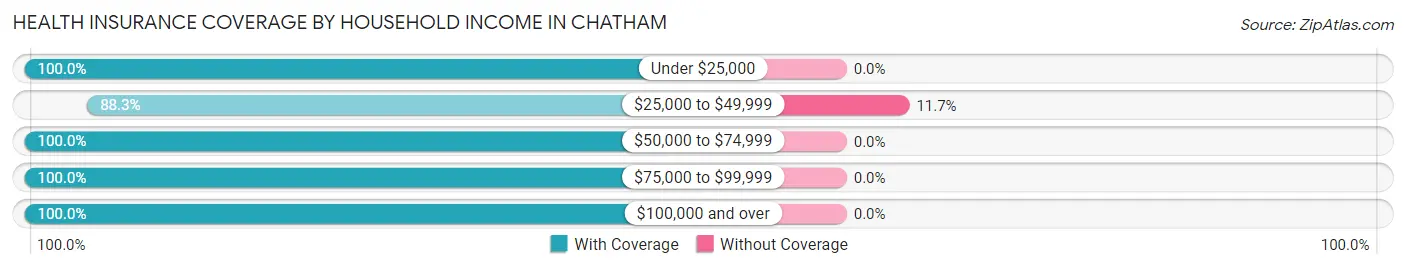
| Household Income | With Coverage | Without Coverage |
| Under $25,000 | 155 (100.0%) | 0 (0.0%) |
| $25,000 to $49,999 | 203 (88.3%) | 27 (11.7%) |
| $50,000 to $74,999 | 217 (100.0%) | 0 (0.0%) |
| $75,000 to $99,999 | 209 (100.0%) | 0 (0.0%) |
| $100,000 and over | 949 (100.0%) | 0 (0.0%) |
Public vs Private Health Insurance Coverage by Age in Chatham
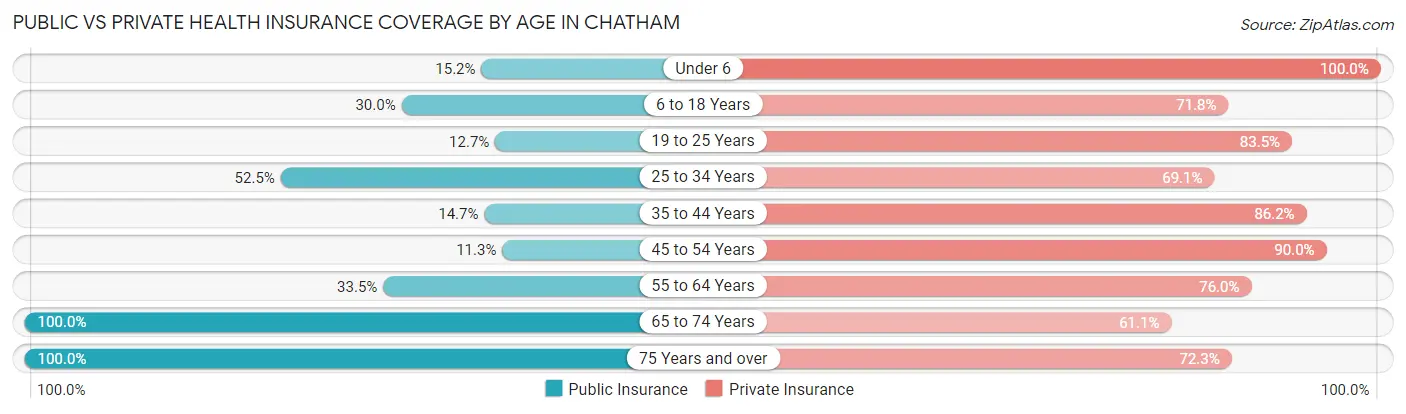
| Age Bracket | Public Insurance | Private Insurance |
| Under 6 | 7 (15.2%) | 46 (100.0%) |
| 6 to 18 Years | 67 (30.0%) | 160 (71.8%) |
| 19 to 25 Years | 30 (12.7%) | 198 (83.5%) |
| 25 to 34 Years | 85 (52.5%) | 112 (69.1%) |
| 35 to 44 Years | 16 (14.7%) | 94 (86.2%) |
| 45 to 54 Years | 44 (11.3%) | 349 (89.9%) |
| 55 to 64 Years | 92 (33.5%) | 209 (76.0%) |
| 65 to 74 Years | 229 (100.0%) | 140 (61.1%) |
| 75 Years and over | 94 (100.0%) | 68 (72.3%) |
| Total | 664 (37.7%) | 1,376 (78.0%) |
Disability Status by Sex by Age in Chatham
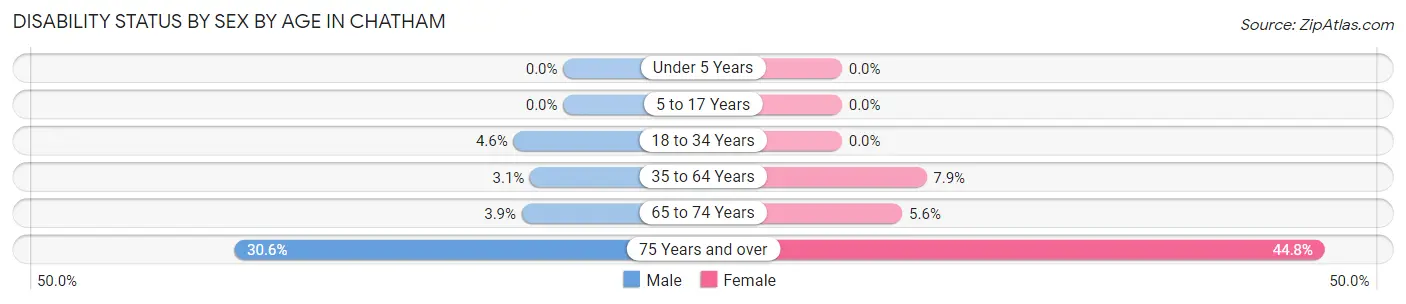
| Age Bracket | Male | Female |
| Under 5 Years | 0 (0.0%) | 0 (0.0%) |
| 5 to 17 Years | 0 (0.0%) | 0 (0.0%) |
| 18 to 34 Years | 9 (4.6%) | 0 (0.0%) |
| 35 to 64 Years | 12 (3.1%) | 30 (7.9%) |
| 65 to 74 Years | 4 (3.8%) | 7 (5.6%) |
| 75 Years and over | 11 (30.6%) | 26 (44.8%) |
Disability Class by Sex by Age in Chatham
Disability Class: Hearing Difficulty
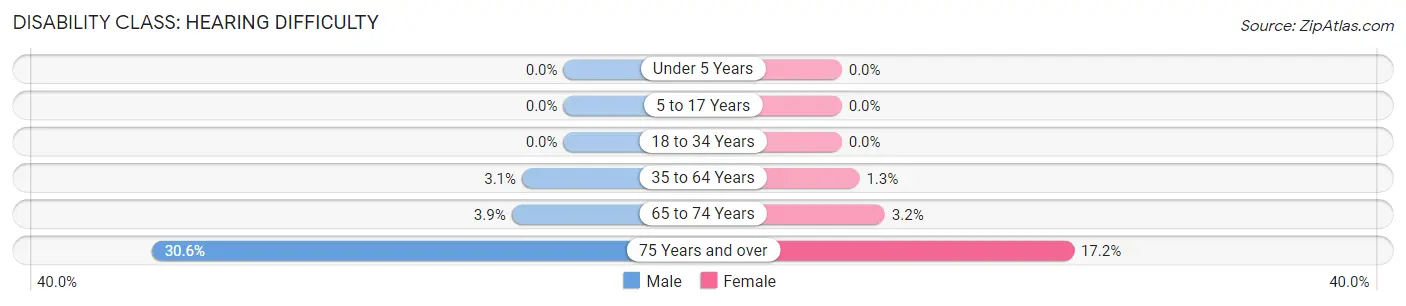
| Age Bracket | Male | Female |
| Under 5 Years | 0 (0.0%) | 0 (0.0%) |
| 5 to 17 Years | 0 (0.0%) | 0 (0.0%) |
| 18 to 34 Years | 0 (0.0%) | 0 (0.0%) |
| 35 to 64 Years | 12 (3.1%) | 5 (1.3%) |
| 65 to 74 Years | 4 (3.8%) | 4 (3.2%) |
| 75 Years and over | 11 (30.6%) | 10 (17.2%) |
Disability Class: Vision Difficulty
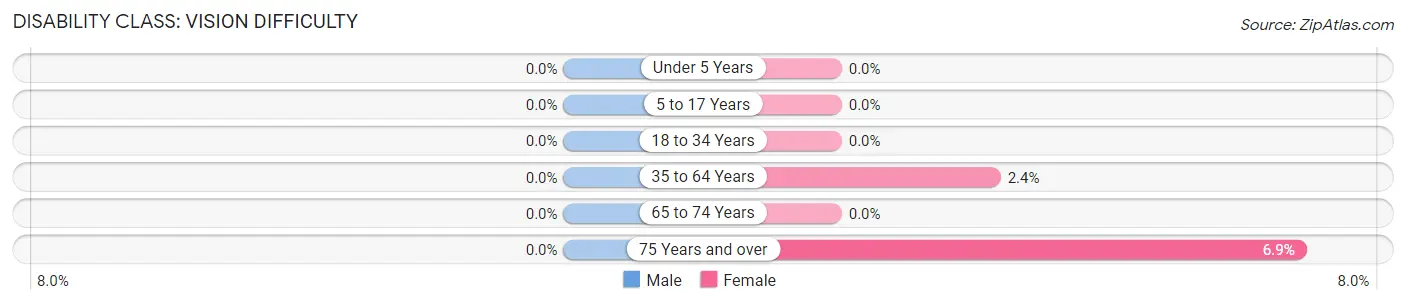
| Age Bracket | Male | Female |
| Under 5 Years | 0 (0.0%) | 0 (0.0%) |
| 5 to 17 Years | 0 (0.0%) | 0 (0.0%) |
| 18 to 34 Years | 0 (0.0%) | 0 (0.0%) |
| 35 to 64 Years | 0 (0.0%) | 9 (2.4%) |
| 65 to 74 Years | 0 (0.0%) | 0 (0.0%) |
| 75 Years and over | 0 (0.0%) | 4 (6.9%) |
Disability Class: Cognitive Difficulty
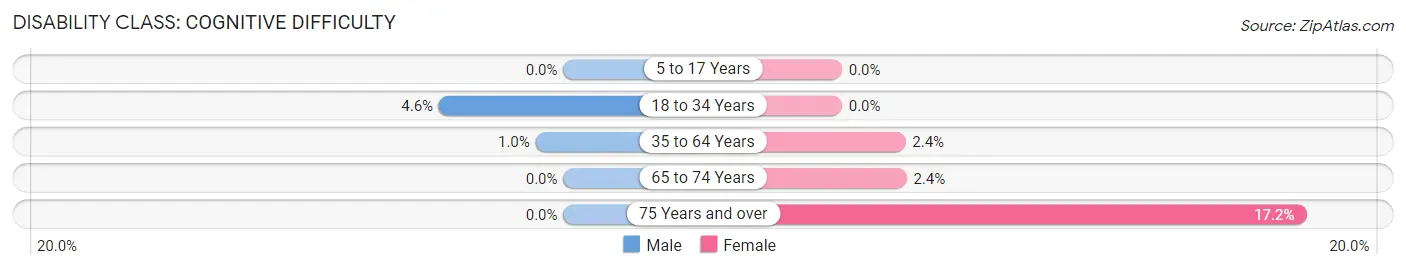
| Age Bracket | Male | Female |
| 5 to 17 Years | 0 (0.0%) | 0 (0.0%) |
| 18 to 34 Years | 9 (4.6%) | 0 (0.0%) |
| 35 to 64 Years | 4 (1.0%) | 9 (2.4%) |
| 65 to 74 Years | 0 (0.0%) | 3 (2.4%) |
| 75 Years and over | 0 (0.0%) | 10 (17.2%) |
Disability Class: Ambulatory Difficulty
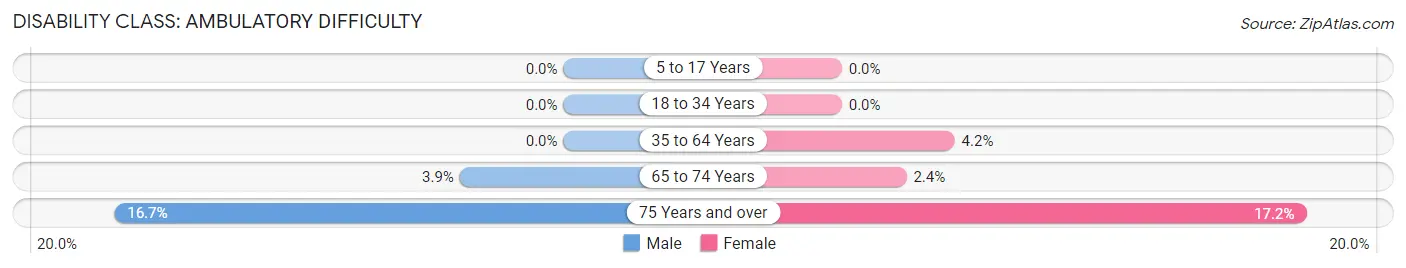
| Age Bracket | Male | Female |
| 5 to 17 Years | 0 (0.0%) | 0 (0.0%) |
| 18 to 34 Years | 0 (0.0%) | 0 (0.0%) |
| 35 to 64 Years | 0 (0.0%) | 16 (4.2%) |
| 65 to 74 Years | 4 (3.8%) | 3 (2.4%) |
| 75 Years and over | 6 (16.7%) | 10 (17.2%) |
Disability Class: Self-Care Difficulty
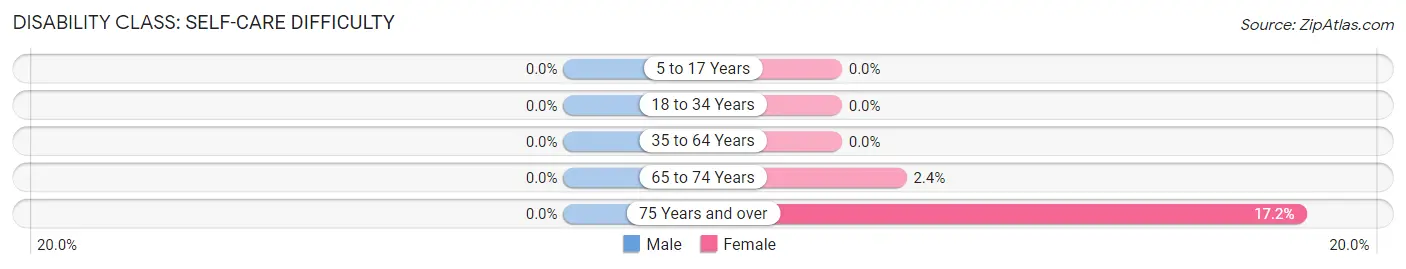
| Age Bracket | Male | Female |
| 5 to 17 Years | 0 (0.0%) | 0 (0.0%) |
| 18 to 34 Years | 0 (0.0%) | 0 (0.0%) |
| 35 to 64 Years | 0 (0.0%) | 0 (0.0%) |
| 65 to 74 Years | 0 (0.0%) | 3 (2.4%) |
| 75 Years and over | 0 (0.0%) | 10 (17.2%) |
Technology Access in Chatham
Computing Device Access in Chatham
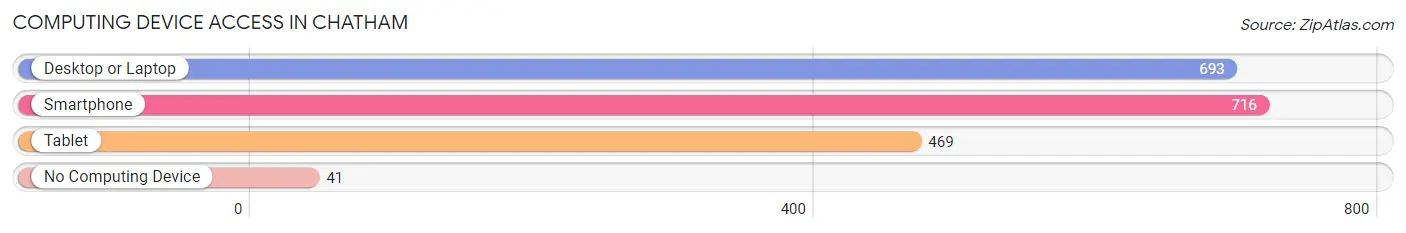
| Device Type | # Households | % Households |
| Desktop or Laptop | 693 | 85.9% |
| Smartphone | 716 | 88.7% |
| Tablet | 469 | 58.1% |
| No Computing Device | 41 | 5.1% |
| Total | 807 | 100.0% |
Internet Access in Chatham
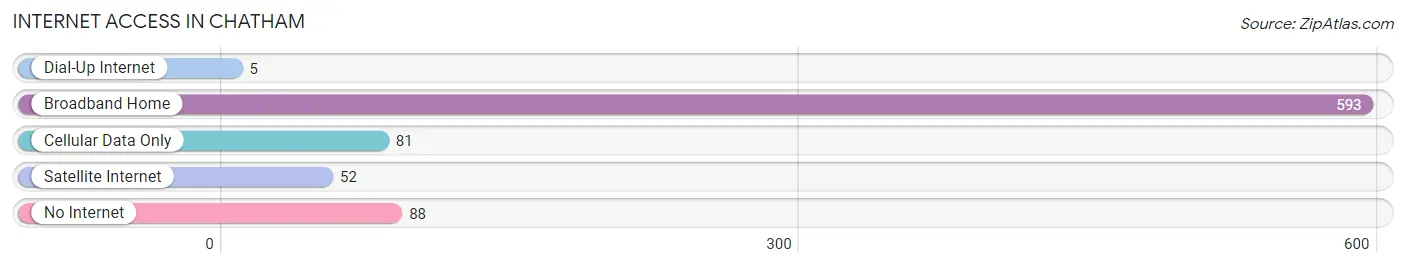
| Internet Type | # Households | % Households |
| Dial-Up Internet | 5 | 0.6% |
| Broadband Home | 593 | 73.5% |
| Cellular Data Only | 81 | 10.0% |
| Satellite Internet | 52 | 6.4% |
| No Internet | 88 | 10.9% |
| Total | 807 | 100.0% |
Chatham Summary
Chatham is a town located in Columbia County, New York, United States. The population was 5,082 at the 2010 census. It is part of the Albany metropolitan area. The town is in the northwest corner of the county and is bordered by the towns of Canaan, Ghent, and Kinderhook.
History
The area that is now Chatham was first settled in 1730 by Dutch and English settlers. The town was originally part of the town of Kinderhook, but was separated in 1795 and incorporated as the town of Chatham. The town was named after William Pitt, 1st Earl of Chatham, a British statesman.
The town was an agricultural community for much of its history, with dairy farming being the primary industry. In the late 19th century, the town began to develop as a summer resort area, with many wealthy New Yorkers building large summer homes in the area.
Geography
Chatham is located in the northwest corner of Columbia County, bordered by the towns of Canaan, Ghent, and Kinderhook. The town is located in the Hudson Valley, and is approximately 40 miles south of Albany.
The town is located in the Hudson Valley, and is approximately 40 miles south of Albany. The terrain is mostly rolling hills, with the highest point being 1,400 feet above sea level. The town is drained by the Kinderhook Creek, which flows through the center of the town.
The town has a total area of 33.2 square miles, of which 33.1 square miles is land and 0.1 square miles is water.
Economy
The economy of Chatham is largely based on agriculture and tourism. The town is home to several dairy farms, as well as several wineries and cideries. The town is also home to several small businesses, including restaurants, retail stores, and professional services.
The town is also a popular tourist destination, with many visitors coming to the area to enjoy the natural beauty of the Hudson Valley. The town is home to several historic sites, including the Chatham Historic District, which is listed on the National Register of Historic Places.
Demographics
As of the 2010 census, there were 5,082 people, 2,068 households, and 1,372 families residing in the town. The population density was 153.2 people per square mile. There were 2,323 housing units at an average density of 70.3 per square mile.
The racial makeup of the town was 94.3% White, 1.7% African American, 0.2% Native American, 0.7% Asian, 0.1% Pacific Islander, 1.3% from other races, and 1.9% from two or more races. Hispanic or Latino of any race were 4.2% of the population.
There were 2,068 households, out of which 28.3% had children under the age of 18 living with them, 51.2% were married couples living together, 10.2% had a female householder with no husband present, and 34.2% were non-families. 28.7% of all households were made up of individuals, and 12.2% had someone living alone who was 65 years of age or older. The average household size was 2.44 and the average family size was 3.00.
In the town, the population was spread out, with 24.2% under the age of 18, 6.2% from 18 to 24, 25.2% from 25 to 44, 28.2% from 45 to 64, and 16.2% who were 65 years of age or older. The median age was 41 years. For every 100 females, there were 94.2 males. For every 100 females age 18 and over, there were 91.2 males.
The median income for a household in the town was $50,938, and the median income for a family was $60,938. Males had a median income of $41,938 versus $30,938 for females. The per capita income for the town was $25,938. About 4.2% of families and 6.2% of the population were below the poverty line, including 8.2% of those under age 18 and 5.2% of those age 65 or over.
Common Questions
What is Per Capita Income in Chatham?
Per Capita income in Chatham is $44,850.
What is the Median Family Income in Chatham?
Median Family Income in Chatham is $100,053.
What is the Median Household income in Chatham?
Median Household Income in Chatham is $92,208.
What is Income or Wage Gap in Chatham?
Income or Wage Gap in Chatham is 30.0%.
Women in Chatham earn 70.0 cents for every dollar earned by a man.
What is Inequality or Gini Index in Chatham?
Inequality or Gini Index in Chatham is 0.38.
What is the Total Population of Chatham?
Total Population of Chatham is 1,763.
What is the Total Male Population of Chatham?
Total Male Population of Chatham is 837.
What is the Total Female Population of Chatham?
Total Female Population of Chatham is 926.
What is the Ratio of Males per 100 Females in Chatham?
There are 90.39 Males per 100 Females in Chatham.
What is the Ratio of Females per 100 Males in Chatham?
There are 110.63 Females per 100 Males in Chatham.
What is the Median Population Age in Chatham?
Median Population Age in Chatham is 48.1 Years.
What is the Average Family Size in Chatham
Average Family Size in Chatham is 2.7 People.
What is the Average Household Size in Chatham
Average Household Size in Chatham is 2.2 People.
How Large is the Labor Force in Chatham?
There are 1,098 People in the Labor Forcein in Chatham.
What is the Percentage of People in the Labor Force in Chatham?
70.9% of People are in the Labor Force in Chatham.
What is the Unemployment Rate in Chatham?
Unemployment Rate in Chatham is 2.8%.