Pine Bush, NY Map & Demographics
Pine Bush Map
Pine Bush Overview
$39,341
PER CAPITA INCOME
$92,813
AVG FAMILY INCOME
$96,429
AVG HOUSEHOLD INCOME
29.0%
WAGE / INCOME GAP [ % ]
71.0¢/ $1
WAGE / INCOME GAP [ $ ]
0.35
INEQUALITY / GINI INDEX
1,659
TOTAL POPULATION
642
MALE POPULATION
1,017
FEMALE POPULATION
63.13
MALES / 100 FEMALES
158.41
FEMALES / 100 MALES
39.9
MEDIAN AGE
3.2
AVG FAMILY SIZE
2.5
AVG HOUSEHOLD SIZE
877
LABOR FORCE [ PEOPLE ]
60.0%
PERCENT IN LABOR FORCE
18.2%
UNEMPLOYMENT RATE
Pine Bush Zip Codes
Pine Bush Area Codes
Income in Pine Bush
Income Overview in Pine Bush
Per Capita Income in Pine Bush is $39,341, while median incomes of families and households are $92,813 and $96,429 respectively.
| Characteristic | Number | Measure |
| Per Capita Income | 1,659 | $39,341 |
| Median Family Income | 335 | $92,813 |
| Mean Family Income | 335 | $95,756 |
| Median Household Income | 658 | $96,429 |
| Mean Household Income | 658 | $97,588 |
| Income Deficit | 335 | $0 |
| Wage / Income Gap (%) | 1,659 | 29.03% |
| Wage / Income Gap ($) | 1,659 | 70.97¢ per $1 |
| Gini / Inequality Index | 1,659 | 0.35 |
Earnings by Sex in Pine Bush
Average Earnings in Pine Bush are $45,880, $56,875 for men and $40,364 for women, a difference of 29.0%.
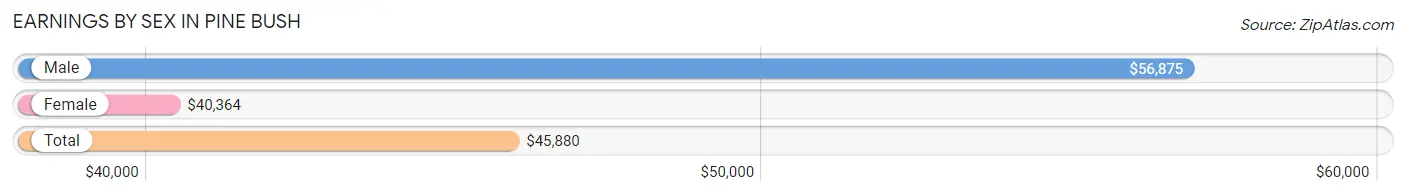
| Sex | Number | Average Earnings |
| Male | 399 (44.3%) | $56,875 |
| Female | 502 (55.7%) | $40,364 |
| Total | 901 (100.0%) | $45,880 |
Earnings by Sex by Income Bracket in Pine Bush
The most common earnings brackets in Pine Bush are $75,000 to $99,999 for men (80 | 20.1%) and $22,500 to $24,999 for women (104 | 20.7%).
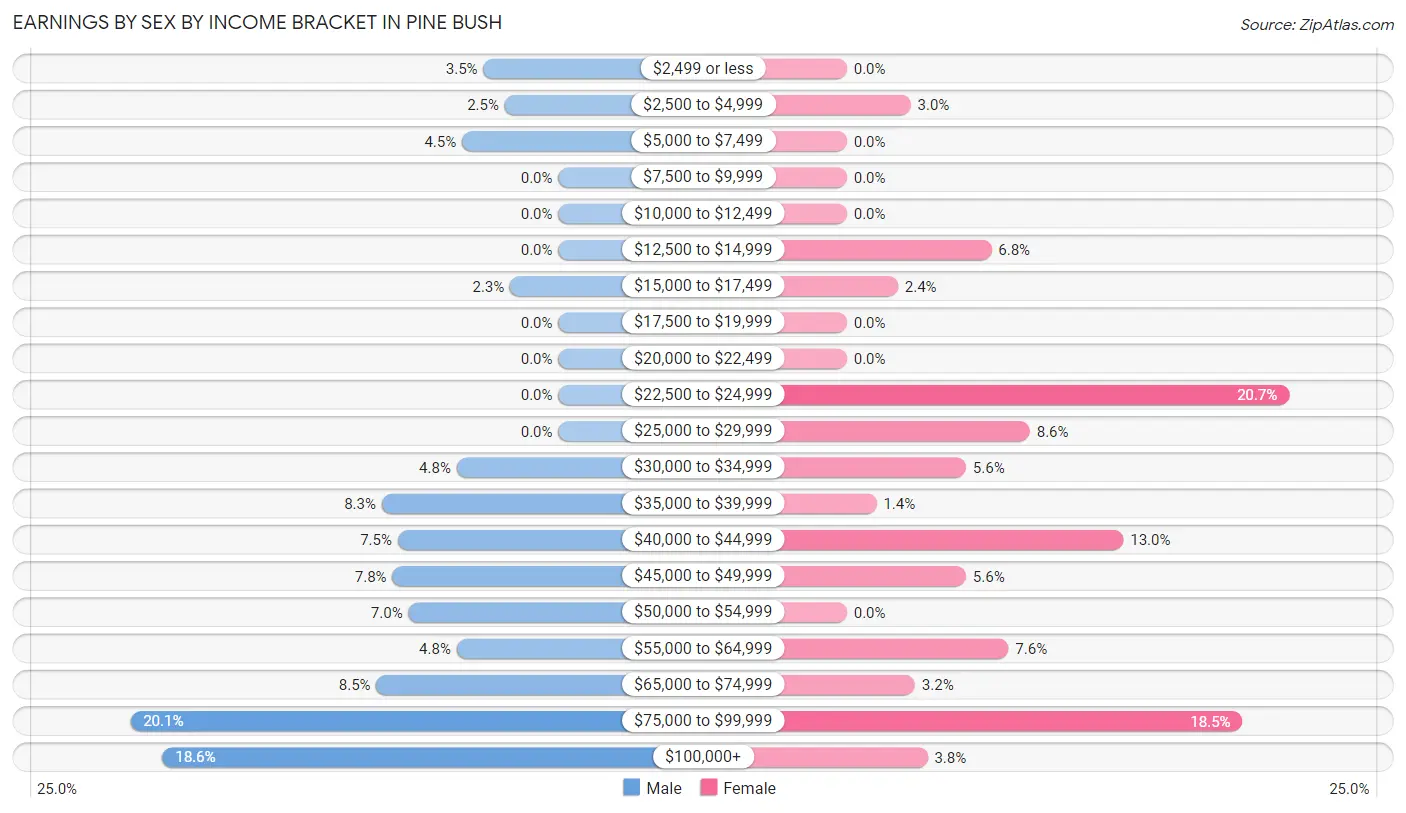
| Income | Male | Female |
| $2,499 or less | 14 (3.5%) | 0 (0.0%) |
| $2,500 to $4,999 | 10 (2.5%) | 15 (3.0%) |
| $5,000 to $7,499 | 18 (4.5%) | 0 (0.0%) |
| $7,500 to $9,999 | 0 (0.0%) | 0 (0.0%) |
| $10,000 to $12,499 | 0 (0.0%) | 0 (0.0%) |
| $12,500 to $14,999 | 0 (0.0%) | 34 (6.8%) |
| $15,000 to $17,499 | 9 (2.3%) | 12 (2.4%) |
| $17,500 to $19,999 | 0 (0.0%) | 0 (0.0%) |
| $20,000 to $22,499 | 0 (0.0%) | 0 (0.0%) |
| $22,500 to $24,999 | 0 (0.0%) | 104 (20.7%) |
| $25,000 to $29,999 | 0 (0.0%) | 43 (8.6%) |
| $30,000 to $34,999 | 19 (4.8%) | 28 (5.6%) |
| $35,000 to $39,999 | 33 (8.3%) | 7 (1.4%) |
| $40,000 to $44,999 | 30 (7.5%) | 65 (13.0%) |
| $45,000 to $49,999 | 31 (7.8%) | 28 (5.6%) |
| $50,000 to $54,999 | 28 (7.0%) | 0 (0.0%) |
| $55,000 to $64,999 | 19 (4.8%) | 38 (7.6%) |
| $65,000 to $74,999 | 34 (8.5%) | 16 (3.2%) |
| $75,000 to $99,999 | 80 (20.1%) | 93 (18.5%) |
| $100,000+ | 74 (18.5%) | 19 (3.8%) |
| Total | 399 (100.0%) | 502 (100.0%) |
Earnings by Sex by Educational Attainment in Pine Bush
Average earnings in Pine Bush are $62,222 for men and $42,188 for women, a difference of 32.2%. Men with an educational attainment of graduate degree enjoy the highest average annual earnings of $142,560, while those with high school diploma education earn the least with $52,813. Women with an educational attainment of graduate degree earn the most with the average annual earnings of $74,464, while those with college or associate's degree education have the smallest earnings of $41,250.
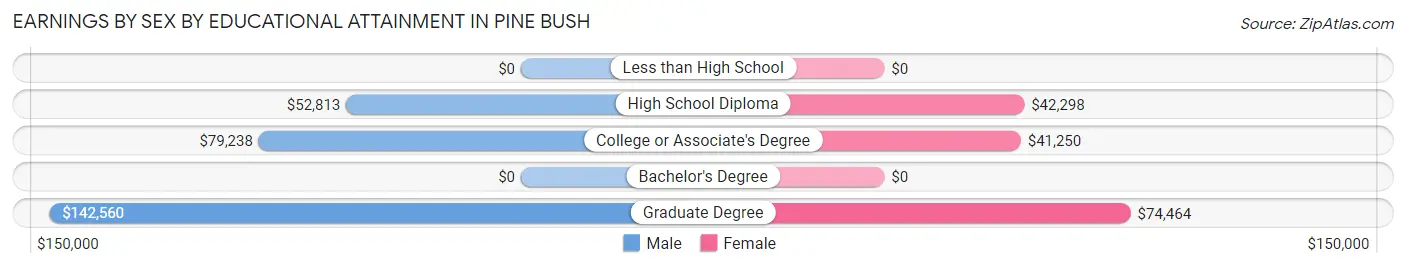
| Educational Attainment | Male Income | Female Income |
| Less than High School | - | - |
| High School Diploma | $52,813 | $42,298 |
| College or Associate's Degree | $79,238 | $41,250 |
| Bachelor's Degree | - | - |
| Graduate Degree | $142,560 | $74,464 |
| Total | $62,222 | $42,188 |
Family Income in Pine Bush
Family Income Brackets in Pine Bush
According to the Pine Bush family income data, there are 99 families falling into the $75,000 to $99,999 income range, which is the most common income bracket and makes up 29.5% of all families.
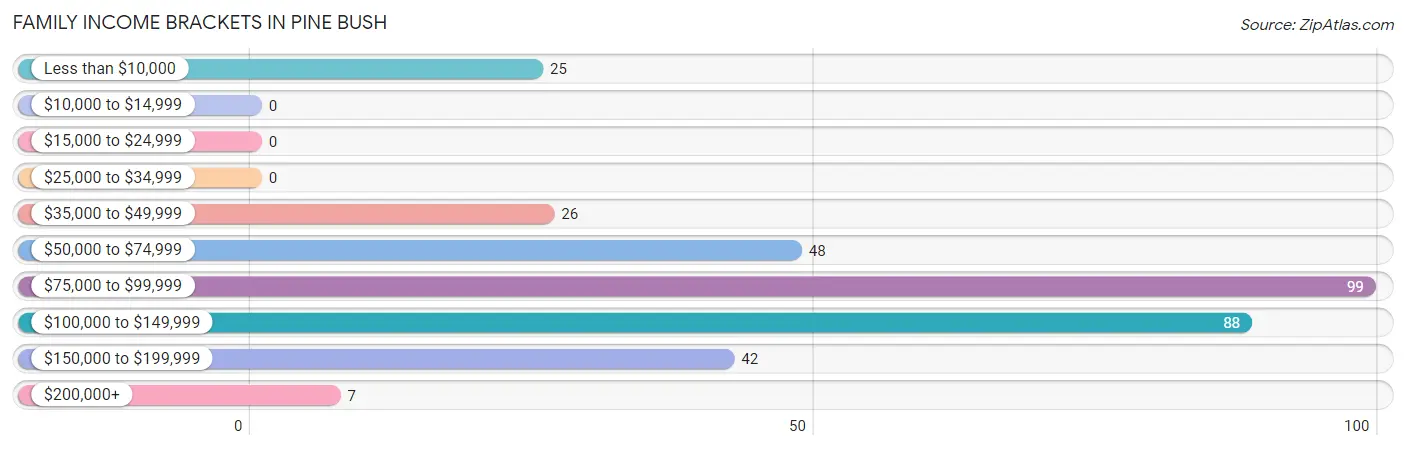
| Income Bracket | # Families | % Families |
| Less than $10,000 | 25 | 7.5% |
| $10,000 to $14,999 | 0 | 0.0% |
| $15,000 to $24,999 | 0 | 0.0% |
| $25,000 to $34,999 | 0 | 0.0% |
| $35,000 to $49,999 | 26 | 7.8% |
| $50,000 to $74,999 | 48 | 14.3% |
| $75,000 to $99,999 | 99 | 29.6% |
| $100,000 to $149,999 | 88 | 26.3% |
| $150,000 to $199,999 | 42 | 12.5% |
| $200,000+ | 7 | 2.1% |
Family Income by Famaliy Size in Pine Bush
4-person families (48 | 14.3%) account for the highest median family income in Pine Bush with $117,167 per family, while 3-person families (86 | 25.7%) have the highest median income of $36,071 per family member.
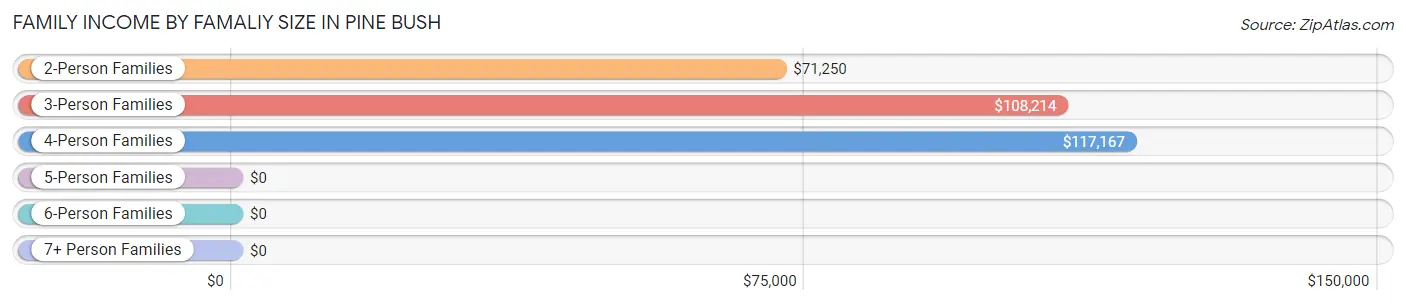
| Income Bracket | # Families | Median Income |
| 2-Person Families | 155 (46.3%) | $71,250 |
| 3-Person Families | 86 (25.7%) | $108,214 |
| 4-Person Families | 48 (14.3%) | $117,167 |
| 5-Person Families | 31 (9.2%) | $0 |
| 6-Person Families | 15 (4.5%) | $0 |
| 7+ Person Families | 0 (0.0%) | $0 |
| Total | 335 (100.0%) | $92,813 |
Family Income by Number of Earners in Pine Bush
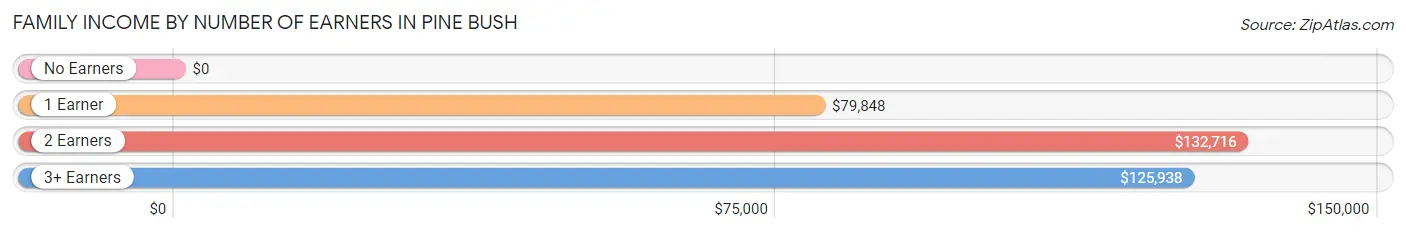
| Number of Earners | # Families | Median Income |
| No Earners | 60 (17.9%) | $0 |
| 1 Earner | 121 (36.1%) | $79,848 |
| 2 Earners | 95 (28.4%) | $132,716 |
| 3+ Earners | 59 (17.6%) | $125,938 |
| Total | 335 (100.0%) | $92,813 |
Household Income in Pine Bush
Household Income Brackets in Pine Bush
With 212 households falling in the category, the $100,000 to $149,999 income range is the most frequent in Pine Bush, accounting for 32.2% of all households. In contrast, only 19 households (2.9%) fall into the $10,000 to $14,999 income bracket, making it the least populous group.
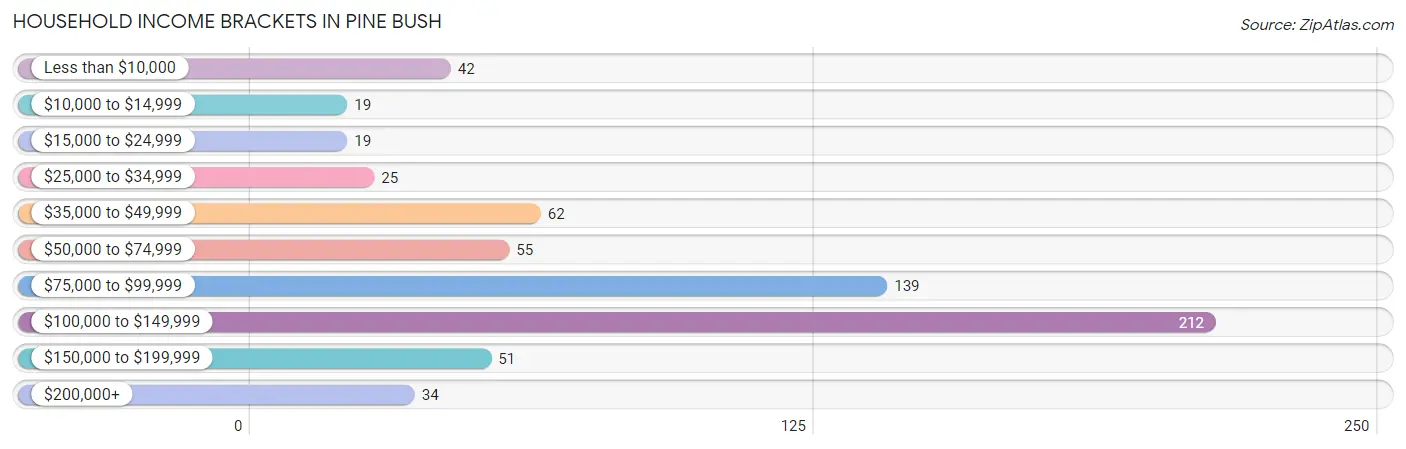
| Income Bracket | # Households | % Households |
| Less than $10,000 | 42 | 6.4% |
| $10,000 to $14,999 | 19 | 2.9% |
| $15,000 to $24,999 | 19 | 2.9% |
| $25,000 to $34,999 | 25 | 3.8% |
| $35,000 to $49,999 | 62 | 9.4% |
| $50,000 to $74,999 | 55 | 8.4% |
| $75,000 to $99,999 | 139 | 21.1% |
| $100,000 to $149,999 | 212 | 32.2% |
| $150,000 to $199,999 | 51 | 7.8% |
| $200,000+ | 34 | 5.2% |
Household Income by Householder Age in Pine Bush
The median household income in Pine Bush is $96,429, with the highest median household income of $121,105 found in the 25 to 44 years age bracket for the primary householder. A total of 202 households (30.7%) fall into this category.
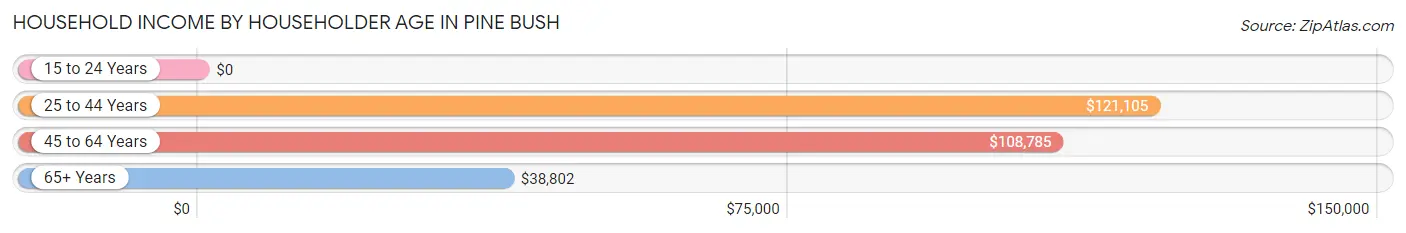
| Income Bracket | # Households | Median Income |
| 15 to 24 Years | 0 (0.0%) | $0 |
| 25 to 44 Years | 202 (30.7%) | $121,105 |
| 45 to 64 Years | 217 (33.0%) | $108,785 |
| 65+ Years | 239 (36.3%) | $38,802 |
| Total | 658 (100.0%) | $96,429 |
Poverty in Pine Bush
Income Below Poverty by Sex and Age in Pine Bush
With 5.3% poverty level for males and 8.0% for females among the residents of Pine Bush, 65 to 74 year old males and 65 to 74 year old females are the most vulnerable to poverty, with 34 males (32.1%) and 40 females (36.7%) in their respective age groups living below the poverty level.
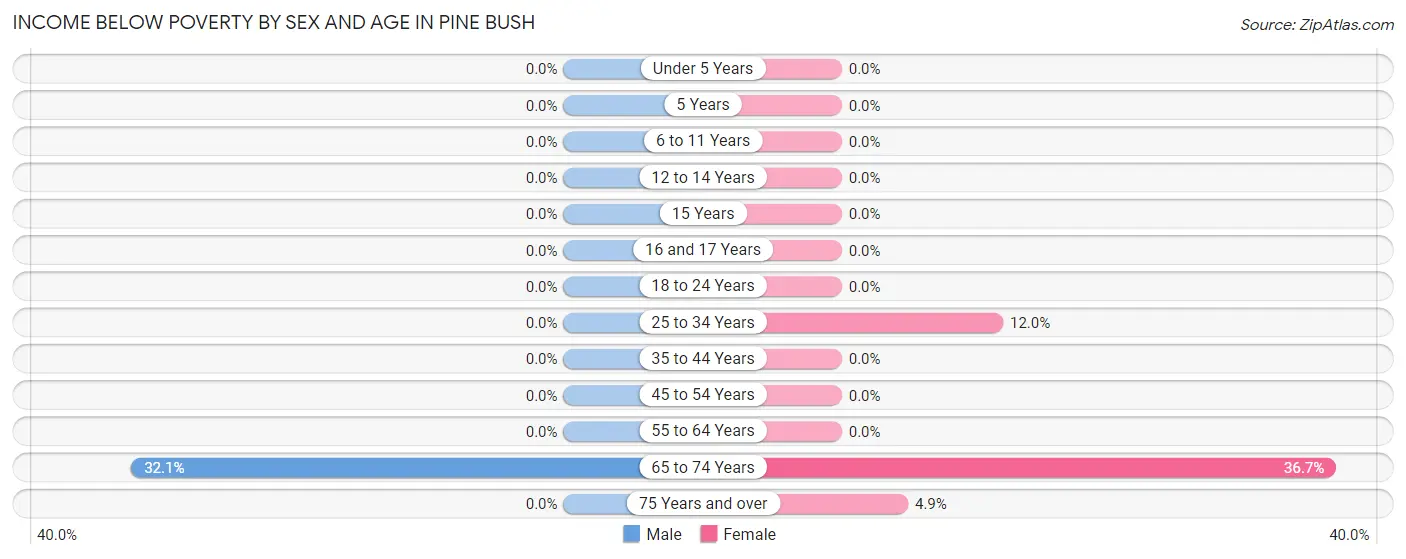
| Age Bracket | Male | Female |
| Under 5 Years | 0 (0.0%) | 0 (0.0%) |
| 5 Years | 0 (0.0%) | 0 (0.0%) |
| 6 to 11 Years | 0 (0.0%) | 0 (0.0%) |
| 12 to 14 Years | 0 (0.0%) | 0 (0.0%) |
| 15 Years | 0 (0.0%) | 0 (0.0%) |
| 16 and 17 Years | 0 (0.0%) | 0 (0.0%) |
| 18 to 24 Years | 0 (0.0%) | 0 (0.0%) |
| 25 to 34 Years | 0 (0.0%) | 34 (12.0%) |
| 35 to 44 Years | 0 (0.0%) | 0 (0.0%) |
| 45 to 54 Years | 0 (0.0%) | 0 (0.0%) |
| 55 to 64 Years | 0 (0.0%) | 0 (0.0%) |
| 65 to 74 Years | 34 (32.1%) | 40 (36.7%) |
| 75 Years and over | 0 (0.0%) | 6 (4.9%) |
| Total | 34 (5.3%) | 80 (8.0%) |
Income Above Poverty by Sex and Age in Pine Bush
According to the poverty statistics in Pine Bush, males aged 6 to 11 years and females aged under 5 years are the age groups that are most secure financially, with 100.0% of males and 100.0% of females in these age groups living above the poverty line.
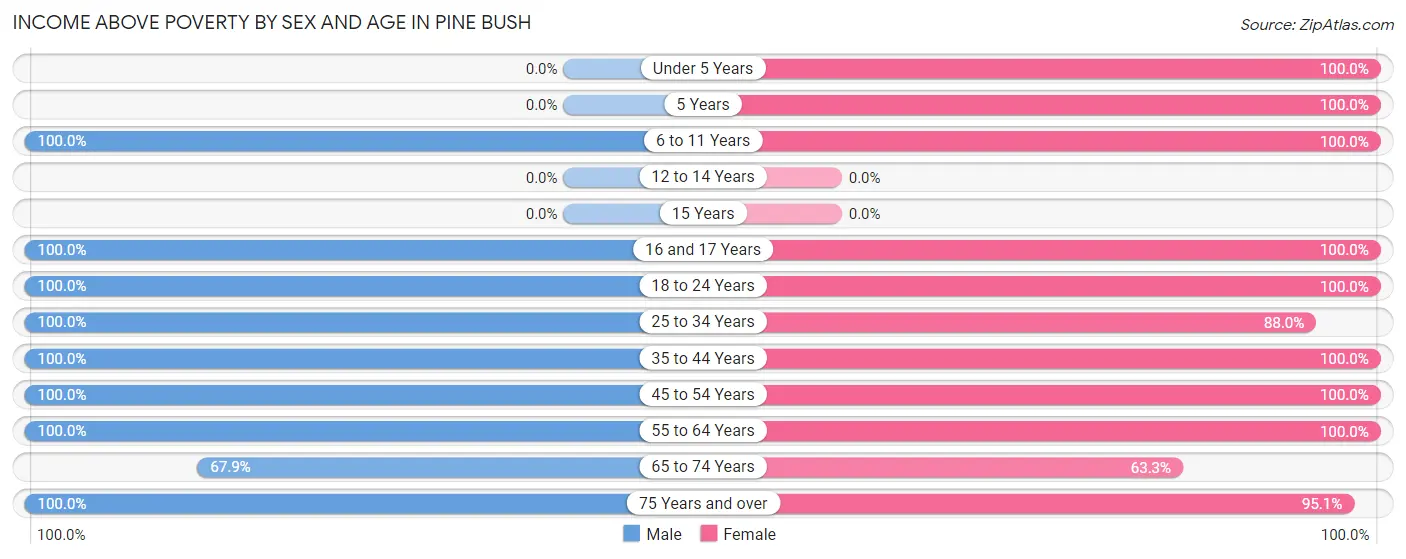
| Age Bracket | Male | Female |
| Under 5 Years | 0 (0.0%) | 58 (100.0%) |
| 5 Years | 0 (0.0%) | 22 (100.0%) |
| 6 to 11 Years | 25 (100.0%) | 92 (100.0%) |
| 12 to 14 Years | 0 (0.0%) | 0 (0.0%) |
| 15 Years | 0 (0.0%) | 0 (0.0%) |
| 16 and 17 Years | 99 (100.0%) | 15 (100.0%) |
| 18 to 24 Years | 25 (100.0%) | 68 (100.0%) |
| 25 to 34 Years | 71 (100.0%) | 250 (88.0%) |
| 35 to 44 Years | 89 (100.0%) | 65 (100.0%) |
| 45 to 54 Years | 123 (100.0%) | 53 (100.0%) |
| 55 to 64 Years | 65 (100.0%) | 118 (100.0%) |
| 65 to 74 Years | 72 (67.9%) | 69 (63.3%) |
| 75 Years and over | 39 (100.0%) | 116 (95.1%) |
| Total | 608 (94.7%) | 926 (92.0%) |
Income Below Poverty Among Married-Couple Families in Pine Bush
The poverty statistics for married-couple families in Pine Bush show that 11.4% or 25 of the total 219 families live below the poverty line. Families with no children have the highest poverty rate of 21.5%, comprising of 25 families. On the other hand, families with 1 or 2 children have the lowest poverty rate of 0.0%, which includes 0 families.
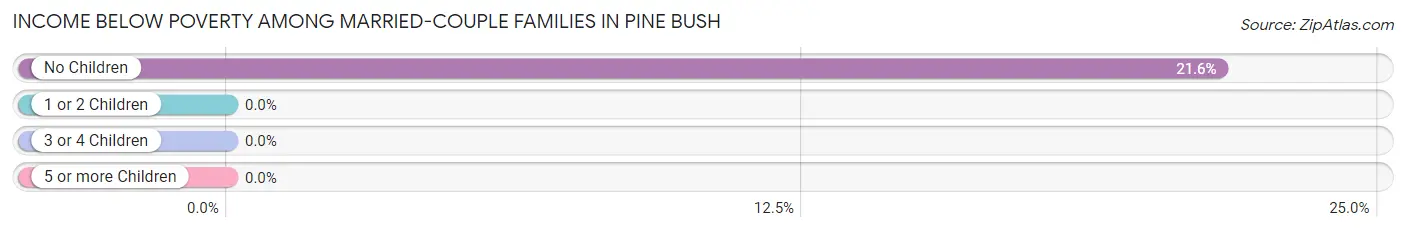
| Children | Above Poverty | Below Poverty |
| No Children | 91 (78.4%) | 25 (21.5%) |
| 1 or 2 Children | 77 (100.0%) | 0 (0.0%) |
| 3 or 4 Children | 26 (100.0%) | 0 (0.0%) |
| 5 or more Children | 0 (0.0%) | 0 (0.0%) |
| Total | 194 (88.6%) | 25 (11.4%) |
Income Below Poverty Among Single-Parent Households in Pine Bush
| Children | Single Father | Single Mother |
| No Children | 0 (0.0%) | 0 (0.0%) |
| 1 or 2 Children | 0 (0.0%) | 0 (0.0%) |
| 3 or 4 Children | 0 (0.0%) | 0 (0.0%) |
| 5 or more Children | 0 (0.0%) | 0 (0.0%) |
| Total | 0 (0.0%) | 0 (0.0%) |
Income Below Poverty Among Married-Couple vs Single-Parent Households in Pine Bush
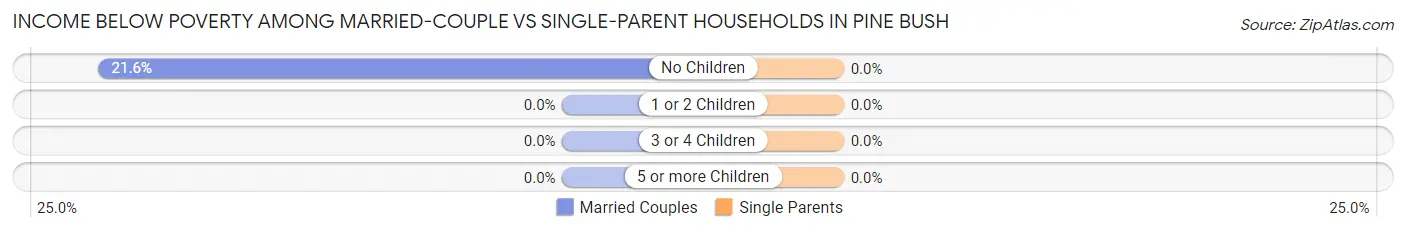
| Children | Married-Couple Families | Single-Parent Households |
| No Children | 25 (21.5%) | 0 (0.0%) |
| 1 or 2 Children | 0 (0.0%) | 0 (0.0%) |
| 3 or 4 Children | 0 (0.0%) | 0 (0.0%) |
| 5 or more Children | 0 (0.0%) | 0 (0.0%) |
| Total | 25 (11.4%) | 0 (0.0%) |
Race in Pine Bush
The most populous races in Pine Bush are White / Caucasian (1,088 | 65.6%), Hispanic or Latino (382 | 23.0%), and Two or more Races (320 | 19.3%).
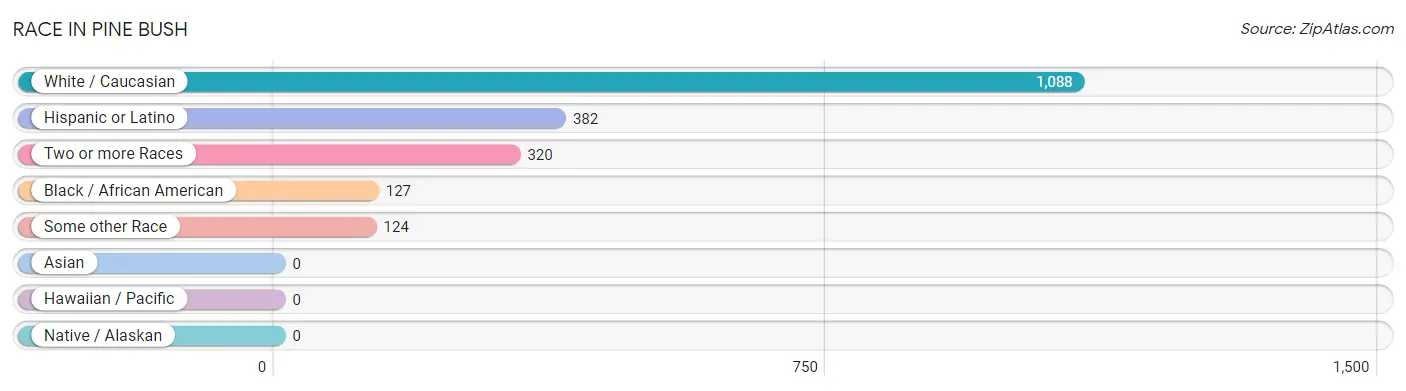
| Race | # Population | % Population |
| Asian | 0 | 0.0% |
| Black / African American | 127 | 7.7% |
| Hawaiian / Pacific | 0 | 0.0% |
| Hispanic or Latino | 382 | 23.0% |
| Native / Alaskan | 0 | 0.0% |
| White / Caucasian | 1,088 | 65.6% |
| Two or more Races | 320 | 19.3% |
| Some other Race | 124 | 7.5% |
| Total | 1,659 | 100.0% |
Ancestry in Pine Bush
The most populous ancestries reported in Pine Bush are German (348 | 21.0%), Mexican (302 | 18.2%), Irish (231 | 13.9%), English (228 | 13.7%), and Italian (216 | 13.0%), together accounting for 79.9% of all Pine Bush residents.
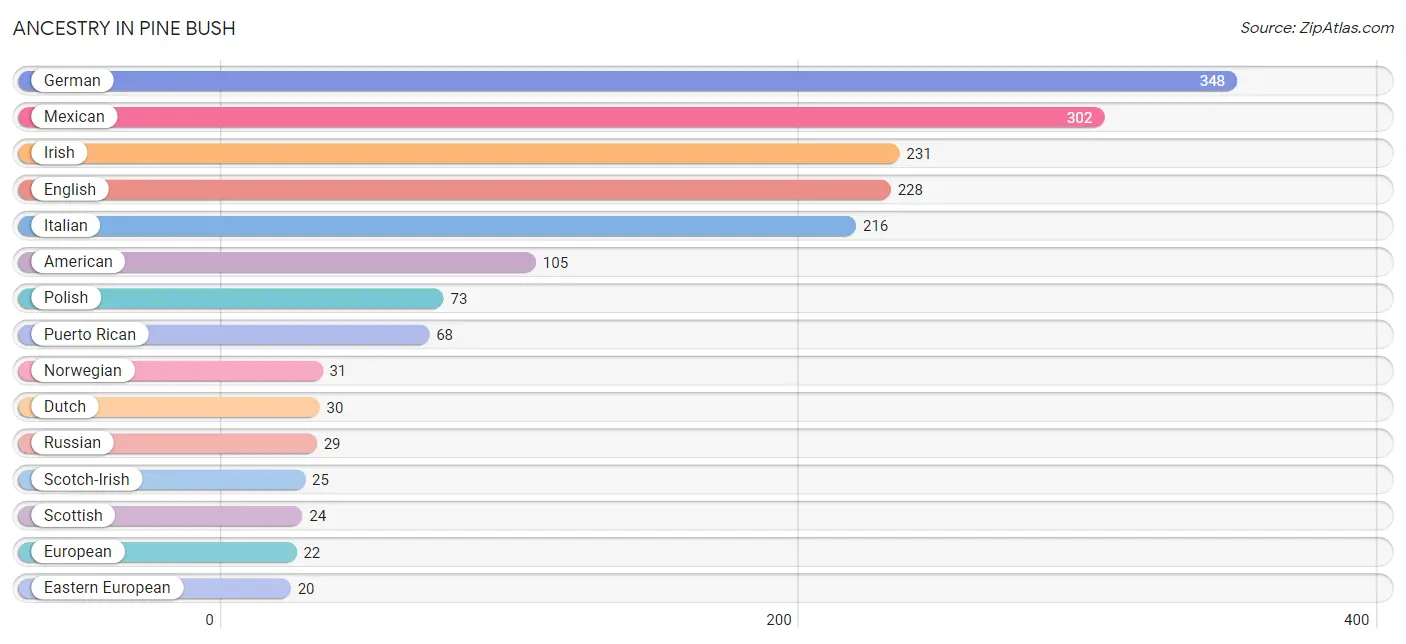
| Ancestry | # Population | % Population |
| American | 105 | 6.3% |
| British | 7 | 0.4% |
| Dutch | 30 | 1.8% |
| Eastern European | 20 | 1.2% |
| English | 228 | 13.7% |
| European | 22 | 1.3% |
| German | 348 | 21.0% |
| Hungarian | 9 | 0.5% |
| Irish | 231 | 13.9% |
| Italian | 216 | 13.0% |
| Mexican | 302 | 18.2% |
| Norwegian | 31 | 1.9% |
| Peruvian | 11 | 0.7% |
| Polish | 73 | 4.4% |
| Portuguese | 9 | 0.5% |
| Puerto Rican | 68 | 4.1% |
| Russian | 29 | 1.8% |
| Scotch-Irish | 25 | 1.5% |
| Scottish | 24 | 1.5% |
| South American | 11 | 0.7% |
| Swedish | 11 | 0.7% |
| Ukrainian | 8 | 0.5% |
| Welsh | 3 | 0.2% |
| Yugoslavian | 8 | 0.5% | View All 24 Rows |
Immigrants in Pine Bush
The most numerous immigrant groups reported in Pine Bush came from Latin America (87 | 5.2%), Central America (67 | 4.0%), Mexico (67 | 4.0%), Europe (56 | 3.4%), and Germany (21 | 1.3%), together accounting for 18.0% of all Pine Bush residents.
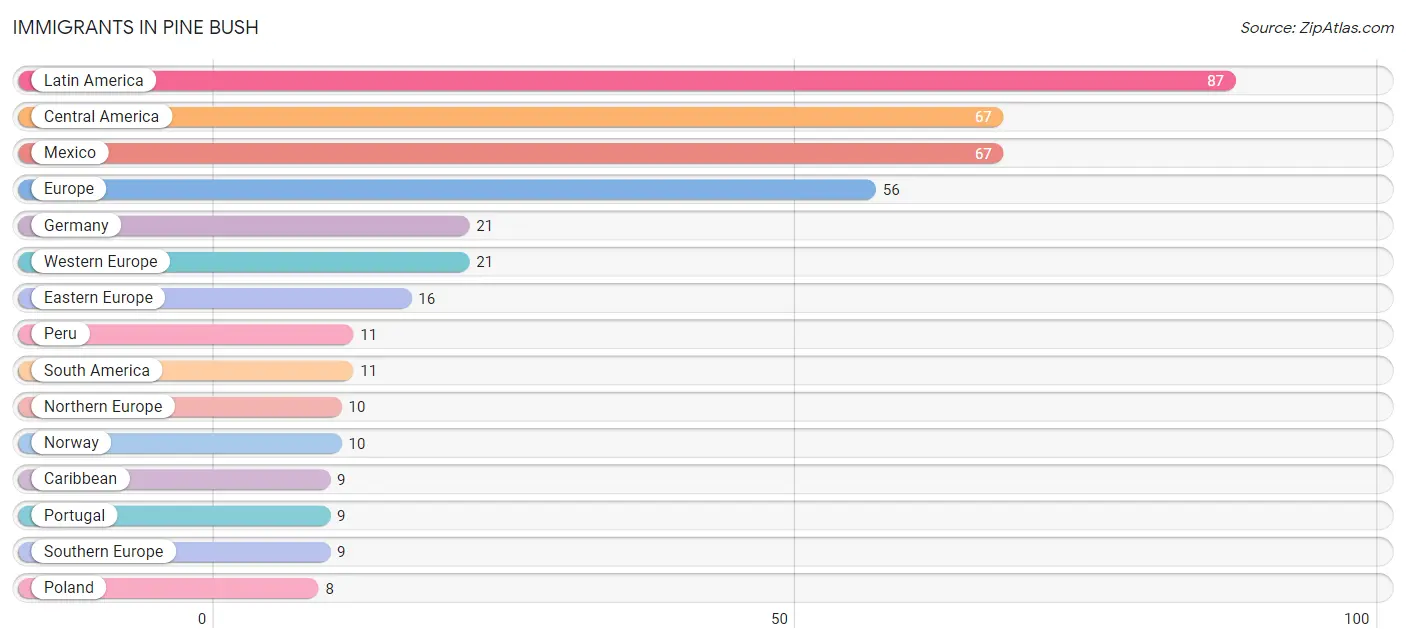
| Immigration Origin | # Population | % Population |
| Caribbean | 9 | 0.5% |
| Central America | 67 | 4.0% |
| Cuba | 1 | 0.1% |
| Eastern Europe | 16 | 1.0% |
| Europe | 56 | 3.4% |
| Germany | 21 | 1.3% |
| Latin America | 87 | 5.2% |
| Mexico | 67 | 4.0% |
| Northern Europe | 10 | 0.6% |
| Norway | 10 | 0.6% |
| Peru | 11 | 0.7% |
| Poland | 8 | 0.5% |
| Portugal | 9 | 0.5% |
| South America | 11 | 0.7% |
| Southern Europe | 9 | 0.5% |
| Western Europe | 21 | 1.3% | View All 16 Rows |
Sex and Age in Pine Bush
Sex and Age in Pine Bush
The most populous age groups in Pine Bush are 15 to 19 Years (113 | 17.6%) for men and 30 to 34 Years (164 | 16.1%) for women.
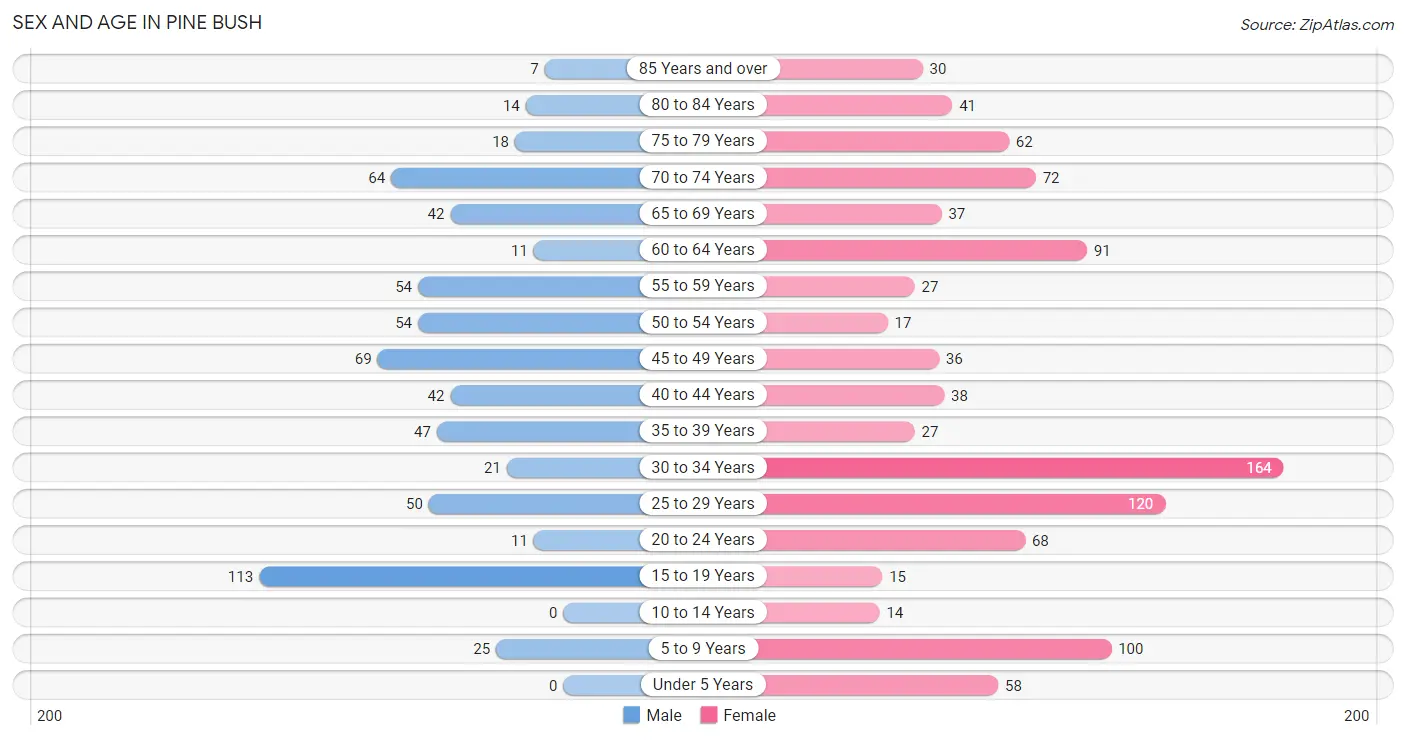
| Age Bracket | Male | Female |
| Under 5 Years | 0 (0.0%) | 58 (5.7%) |
| 5 to 9 Years | 25 (3.9%) | 100 (9.8%) |
| 10 to 14 Years | 0 (0.0%) | 14 (1.4%) |
| 15 to 19 Years | 113 (17.6%) | 15 (1.5%) |
| 20 to 24 Years | 11 (1.7%) | 68 (6.7%) |
| 25 to 29 Years | 50 (7.8%) | 120 (11.8%) |
| 30 to 34 Years | 21 (3.3%) | 164 (16.1%) |
| 35 to 39 Years | 47 (7.3%) | 27 (2.6%) |
| 40 to 44 Years | 42 (6.5%) | 38 (3.7%) |
| 45 to 49 Years | 69 (10.7%) | 36 (3.5%) |
| 50 to 54 Years | 54 (8.4%) | 17 (1.7%) |
| 55 to 59 Years | 54 (8.4%) | 27 (2.6%) |
| 60 to 64 Years | 11 (1.7%) | 91 (8.9%) |
| 65 to 69 Years | 42 (6.5%) | 37 (3.6%) |
| 70 to 74 Years | 64 (10.0%) | 72 (7.1%) |
| 75 to 79 Years | 18 (2.8%) | 62 (6.1%) |
| 80 to 84 Years | 14 (2.2%) | 41 (4.0%) |
| 85 Years and over | 7 (1.1%) | 30 (2.9%) |
| Total | 642 (100.0%) | 1,017 (100.0%) |
Families and Households in Pine Bush
Median Family Size in Pine Bush
The median family size in Pine Bush is 3.25 persons per family, with single male/father families (41 | 12.2%) accounting for the largest median family size of 3.51 persons per family. On the other hand, single female/mother families (75 | 22.4%) represent the smallest median family size with 2.40 persons per family.
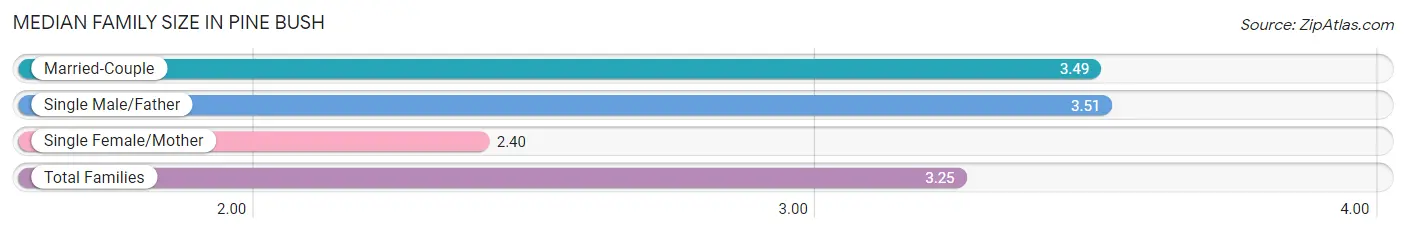
| Family Type | # Families | Family Size |
| Married-Couple | 219 (65.4%) | 3.49 |
| Single Male/Father | 41 (12.2%) | 3.51 |
| Single Female/Mother | 75 (22.4%) | 2.40 |
| Total Families | 335 (100.0%) | 3.25 |
Median Household Size in Pine Bush
The median household size in Pine Bush is 2.45 persons per household, with married-couple households (219 | 33.3%) accounting for the largest median household size of 3.59 persons per household. non-family households (323 | 49.1%) represent the smallest median household size with 1.49 persons per household.
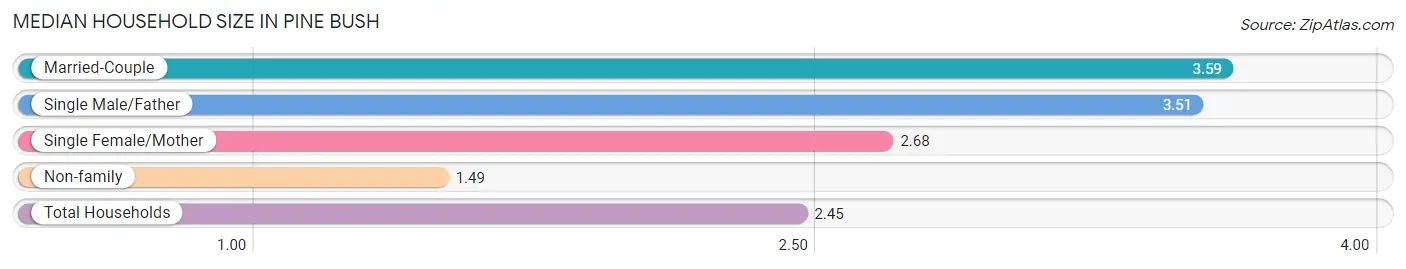
| Household Type | # Households | Household Size |
| Married-Couple | 219 (33.3%) | 3.59 |
| Single Male/Father | 41 (6.2%) | 3.51 |
| Single Female/Mother | 75 (11.4%) | 2.68 |
| Non-family | 323 (49.1%) | 1.49 |
| Total Households | 658 (100.0%) | 2.45 |
Household Size by Marriage Status in Pine Bush
Out of a total of 658 households in Pine Bush, 335 (50.9%) are family households, while 323 (49.1%) are nonfamily households. The most numerous type of family households are 2-person households, comprising 127, and the most common type of nonfamily households are 1-person households, comprising 207.
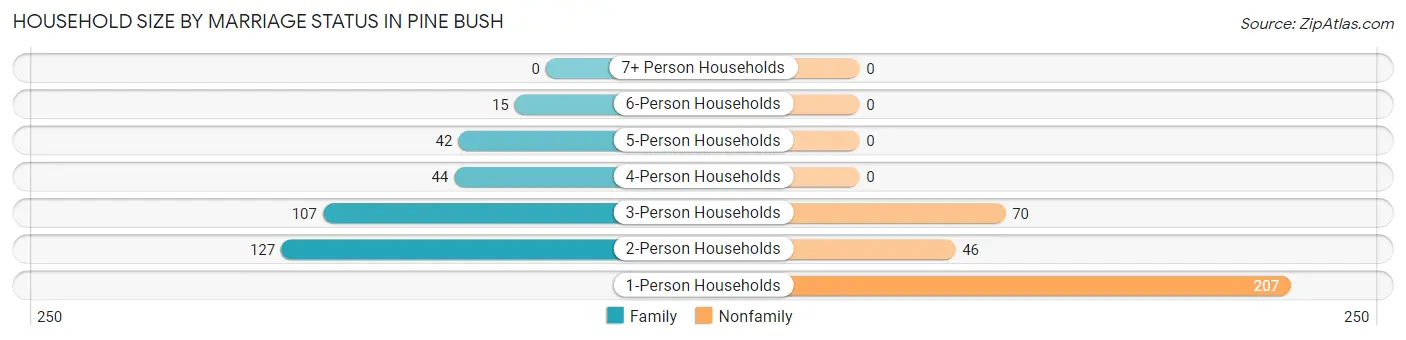
| Household Size | Family Households | Nonfamily Households |
| 1-Person Households | - | 207 (31.5%) |
| 2-Person Households | 127 (19.3%) | 46 (7.0%) |
| 3-Person Households | 107 (16.3%) | 70 (10.6%) |
| 4-Person Households | 44 (6.7%) | 0 (0.0%) |
| 5-Person Households | 42 (6.4%) | 0 (0.0%) |
| 6-Person Households | 15 (2.3%) | 0 (0.0%) |
| 7+ Person Households | 0 (0.0%) | 0 (0.0%) |
| Total | 335 (50.9%) | 323 (49.1%) |
Female Fertility in Pine Bush
Fertility by Age in Pine Bush
Average fertility rate in Pine Bush is 45.0 births per 1,000 women. Women in the age bracket of 20 to 34 years have the highest fertility rate with 60.0 births per 1,000 women. Women in the age bracket of 20 to 34 years acount for 100.0% of all women with births.
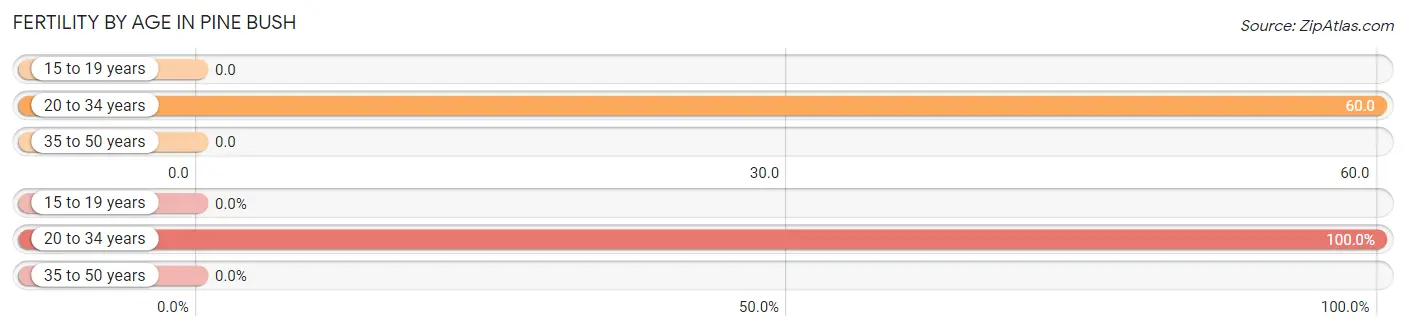
| Age Bracket | Women with Births | Births / 1,000 Women |
| 15 to 19 years | 0 (0.0%) | 0.0 |
| 20 to 34 years | 21 (100.0%) | 60.0 |
| 35 to 50 years | 0 (0.0%) | 0.0 |
| Total | 21 (100.0%) | 45.0 |
Fertility by Age by Marriage Status in Pine Bush
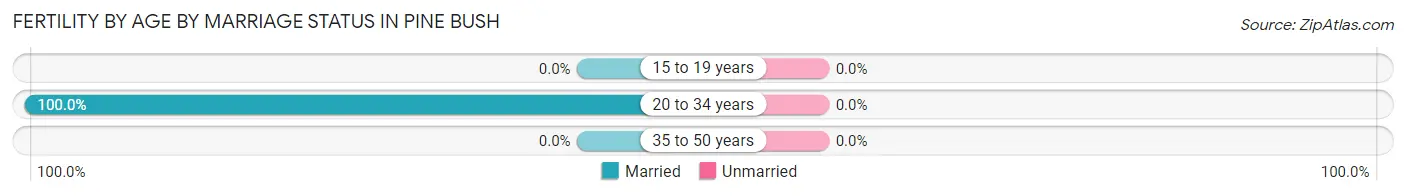
| Age Bracket | Married | Unmarried |
| 15 to 19 years | 0 (0.0%) | 0 (0.0%) |
| 20 to 34 years | 21 (100.0%) | 0 (0.0%) |
| 35 to 50 years | 0 (0.0%) | 0 (0.0%) |
| Total | 21 (100.0%) | 0 (0.0%) |
Fertility by Education in Pine Bush
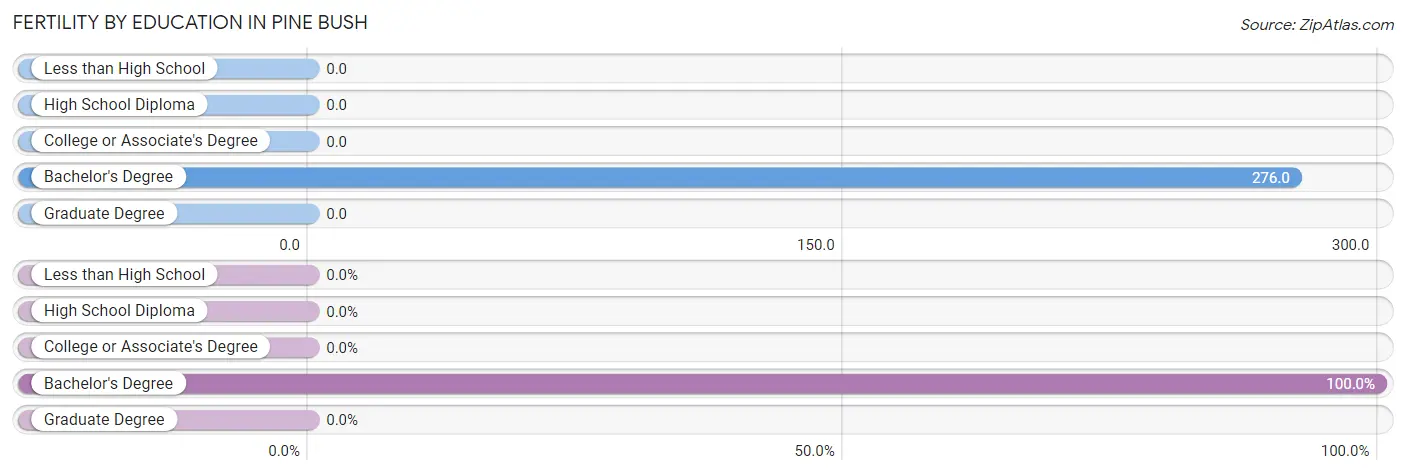
| Educational Attainment | Women with Births | Births / 1,000 Women |
| Less than High School | 0 (0.0%) | 0.0 |
| High School Diploma | 0 (0.0%) | 0.0 |
| College or Associate's Degree | 0 (0.0%) | 0.0 |
| Bachelor's Degree | 21 (100.0%) | 276.0 |
| Graduate Degree | 0 (0.0%) | 0.0 |
| Total | 21 (100.0%) | 45.0 |
Fertility by Education by Marriage Status in Pine Bush
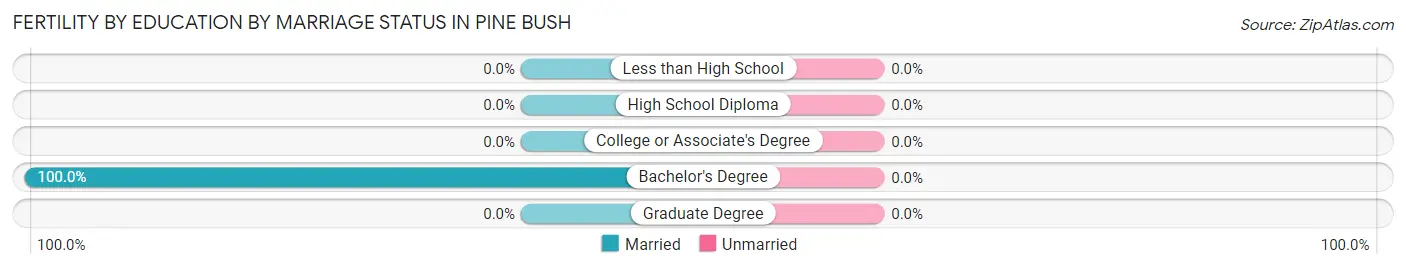
| Educational Attainment | Married | Unmarried |
| Less than High School | 0 (0.0%) | 0 (0.0%) |
| High School Diploma | 0 (0.0%) | 0 (0.0%) |
| College or Associate's Degree | 0 (0.0%) | 0 (0.0%) |
| Bachelor's Degree | 21 (100.0%) | 0 (0.0%) |
| Graduate Degree | 0 (0.0%) | 0 (0.0%) |
| Total | 21 (100.0%) | 0 (0.0%) |
Employment Characteristics in Pine Bush
Employment by Class of Employer in Pine Bush
Among the 717 employed individuals in Pine Bush, private company employees (543 | 75.7%), local government employees (91 | 12.7%), and state government employees (39 | 5.4%) make up the most common classes of employment.
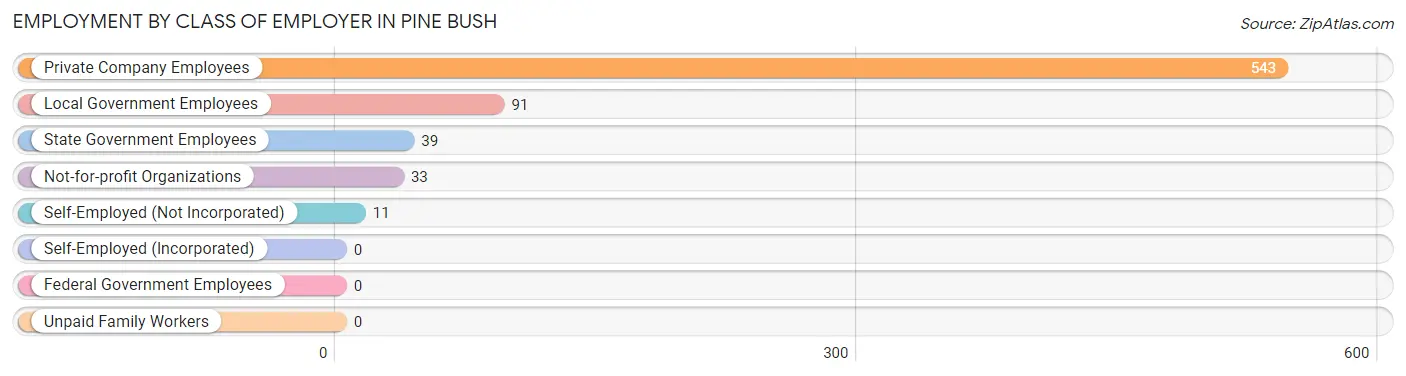
| Employer Class | # Employees | % Employees |
| Private Company Employees | 543 | 75.7% |
| Self-Employed (Incorporated) | 0 | 0.0% |
| Self-Employed (Not Incorporated) | 11 | 1.5% |
| Not-for-profit Organizations | 33 | 4.6% |
| Local Government Employees | 91 | 12.7% |
| State Government Employees | 39 | 5.4% |
| Federal Government Employees | 0 | 0.0% |
| Unpaid Family Workers | 0 | 0.0% |
| Total | 717 | 100.0% |
Employment Status by Age in Pine Bush
According to the labor force statistics for Pine Bush, out of the total population over 16 years of age (1,462), 60.0% or 877 individuals are in the labor force, with 18.2% or 160 of them unemployed. The age group with the highest labor force participation rate is 20 to 24 years, with 100.0% or 79 individuals in the labor force. Within the labor force, the 30 to 34 years age range has the highest percentage of unemployed individuals, with 69.9% or 116 of them being unemployed.
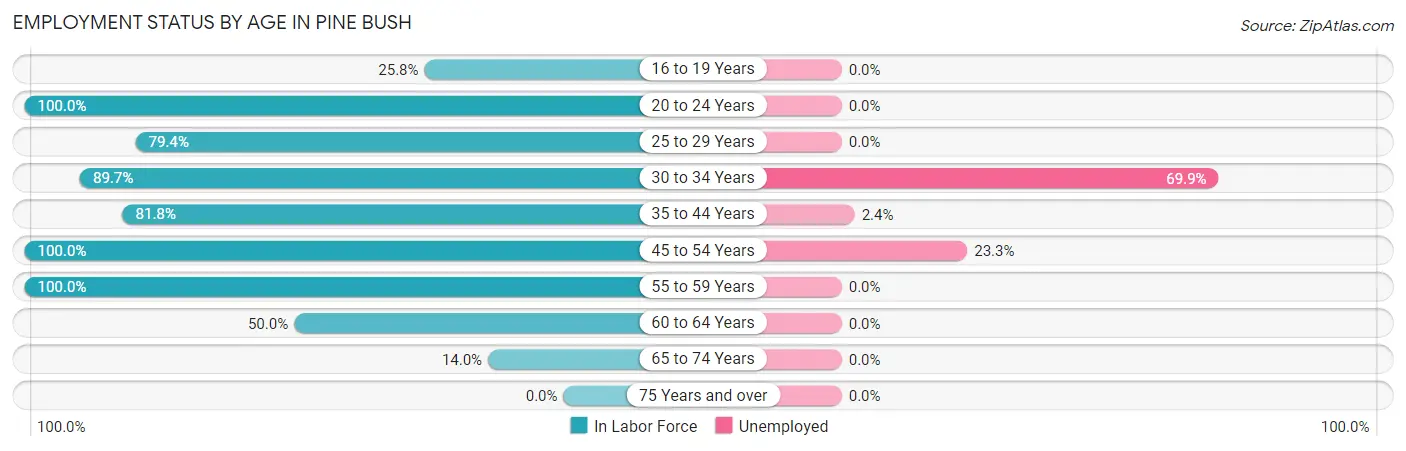
| Age Bracket | In Labor Force | Unemployed |
| 16 to 19 Years | 33 (25.8%) | 0 (0.0%) |
| 20 to 24 Years | 79 (100.0%) | 0 (0.0%) |
| 25 to 29 Years | 135 (79.4%) | 0 (0.0%) |
| 30 to 34 Years | 166 (89.7%) | 116 (69.9%) |
| 35 to 44 Years | 126 (81.8%) | 3 (2.4%) |
| 45 to 54 Years | 176 (100.0%) | 41 (23.3%) |
| 55 to 59 Years | 81 (100.0%) | 0 (0.0%) |
| 60 to 64 Years | 51 (50.0%) | 0 (0.0%) |
| 65 to 74 Years | 30 (14.0%) | 0 (0.0%) |
| 75 Years and over | 0 (0.0%) | 0 (0.0%) |
| Total | 877 (60.0%) | 160 (18.2%) |
Employment Status by Educational Attainment in Pine Bush
According to labor force statistics for Pine Bush, 84.7% of individuals (735) out of the total population between 25 and 64 years of age (868) are in the labor force, with 21.8% or 160 of them being unemployed. The group with the highest labor force participation rate are those with the educational attainment of college / associate degree, with 93.8% or 244 individuals in the labor force. Within the labor force, individuals with college / associate degree education have the highest percentage of unemployment, with 32.0% or 78 of them being unemployed.
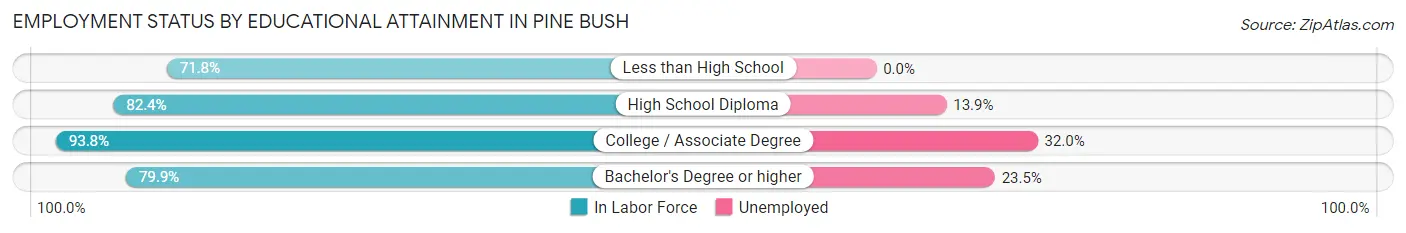
| Educational Attainment | In Labor Force | Unemployed |
| Less than High School | 28 (71.8%) | 0 (0.0%) |
| High School Diploma | 280 (82.4%) | 47 (13.9%) |
| College / Associate Degree | 244 (93.8%) | 83 (32.0%) |
| Bachelor's Degree or higher | 183 (79.9%) | 54 (23.5%) |
| Total | 735 (84.7%) | 189 (21.8%) |
Employment Occupations by Sex in Pine Bush
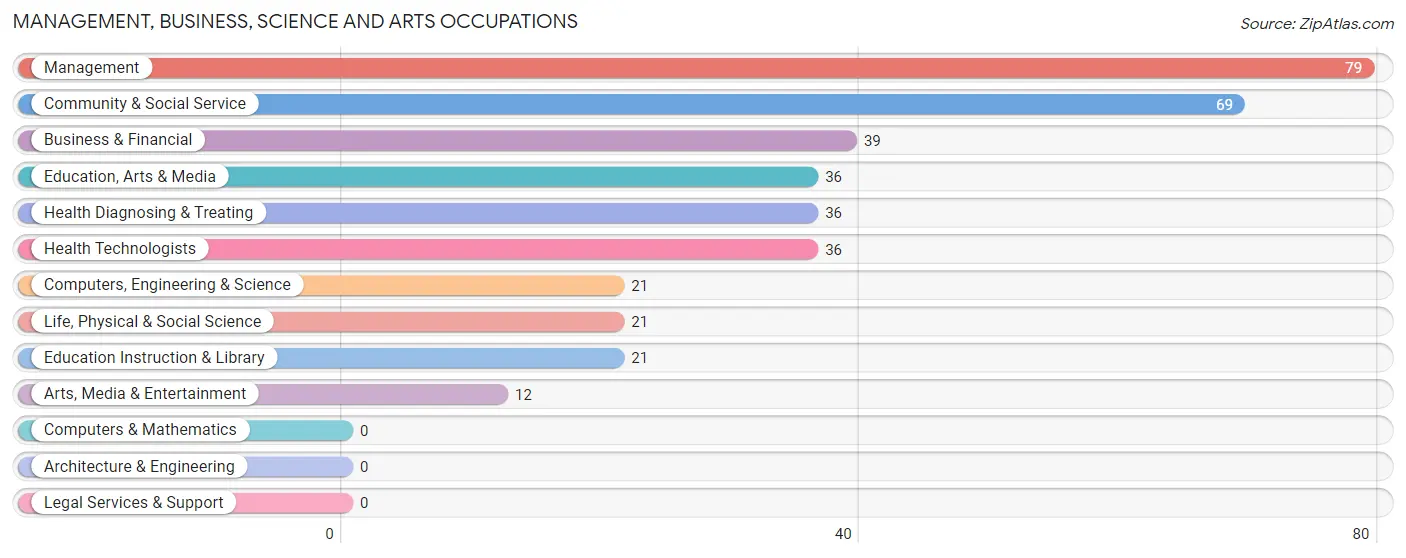
Management, Business, Science and Arts Occupations
The most common Management, Business, Science and Arts occupations in Pine Bush are Management (79 | 11.0%), Community & Social Service (69 | 9.6%), Business & Financial (39 | 5.4%), Education, Arts & Media (36 | 5.0%), and Health Diagnosing & Treating (36 | 5.0%).
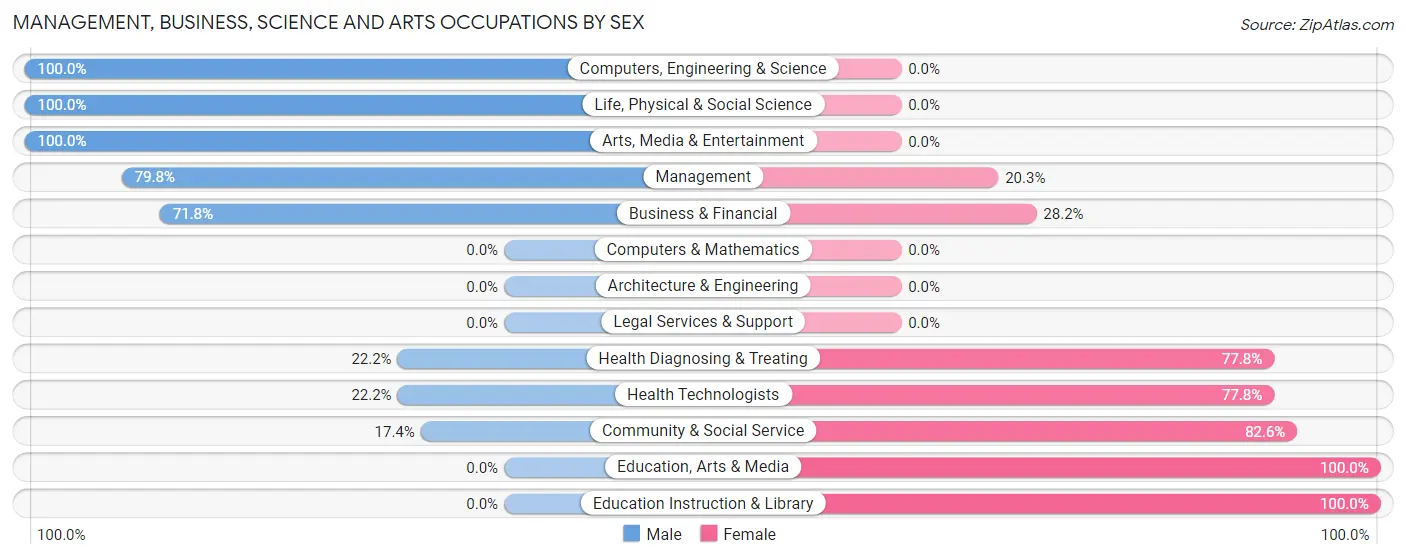
Management, Business, Science and Arts Occupations by Sex
Within the Management, Business, Science and Arts occupations in Pine Bush, the most male-oriented occupations are Computers, Engineering & Science (100.0%), Life, Physical & Social Science (100.0%), and Arts, Media & Entertainment (100.0%), while the most female-oriented occupations are Education, Arts & Media (100.0%), Education Instruction & Library (100.0%), and Community & Social Service (82.6%).
| Occupation | Male | Female |
| Management | 63 (79.7%) | 16 (20.3%) |
| Business & Financial | 28 (71.8%) | 11 (28.2%) |
| Computers, Engineering & Science | 21 (100.0%) | 0 (0.0%) |
| Computers & Mathematics | 0 (0.0%) | 0 (0.0%) |
| Architecture & Engineering | 0 (0.0%) | 0 (0.0%) |
| Life, Physical & Social Science | 21 (100.0%) | 0 (0.0%) |
| Community & Social Service | 12 (17.4%) | 57 (82.6%) |
| Education, Arts & Media | 0 (0.0%) | 36 (100.0%) |
| Legal Services & Support | 0 (0.0%) | 0 (0.0%) |
| Education Instruction & Library | 0 (0.0%) | 21 (100.0%) |
| Arts, Media & Entertainment | 12 (100.0%) | 0 (0.0%) |
| Health Diagnosing & Treating | 8 (22.2%) | 28 (77.8%) |
| Health Technologists | 8 (22.2%) | 28 (77.8%) |
| Total (Category) | 132 (54.1%) | 112 (45.9%) |
| Total (Overall) | 334 (46.6%) | 383 (53.4%) |
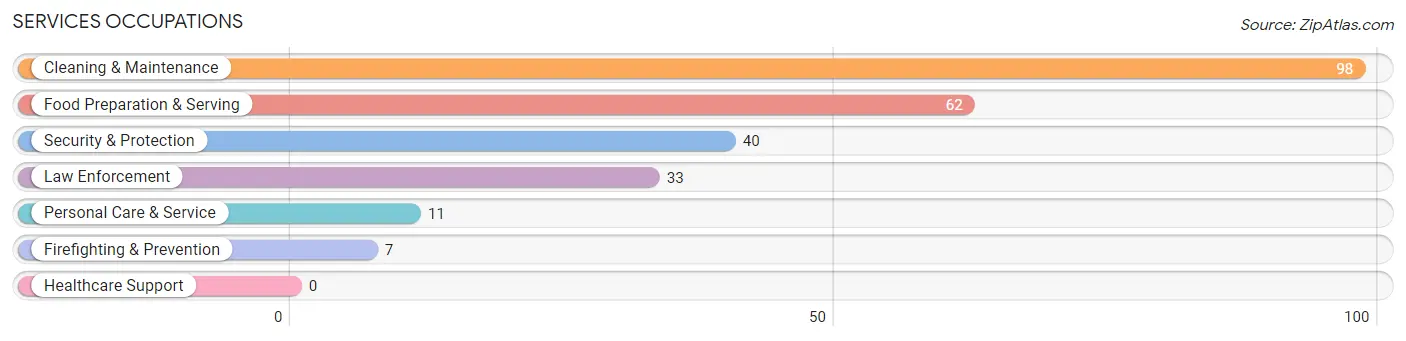
Services Occupations
The most common Services occupations in Pine Bush are Cleaning & Maintenance (98 | 13.7%), Food Preparation & Serving (62 | 8.6%), Security & Protection (40 | 5.6%), Law Enforcement (33 | 4.6%), and Personal Care & Service (11 | 1.5%).
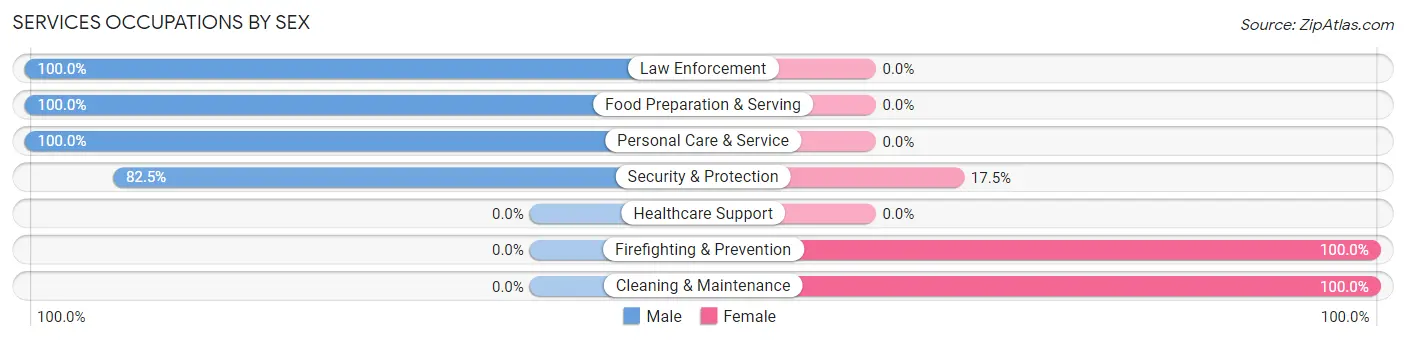
Services Occupations by Sex
Within the Services occupations in Pine Bush, the most male-oriented occupations are Law Enforcement (100.0%), Food Preparation & Serving (100.0%), and Personal Care & Service (100.0%), while the most female-oriented occupations are Firefighting & Prevention (100.0%), Cleaning & Maintenance (100.0%), and Security & Protection (17.5%).
| Occupation | Male | Female |
| Healthcare Support | 0 (0.0%) | 0 (0.0%) |
| Security & Protection | 33 (82.5%) | 7 (17.5%) |
| Firefighting & Prevention | 0 (0.0%) | 7 (100.0%) |
| Law Enforcement | 33 (100.0%) | 0 (0.0%) |
| Food Preparation & Serving | 62 (100.0%) | 0 (0.0%) |
| Cleaning & Maintenance | 0 (0.0%) | 98 (100.0%) |
| Personal Care & Service | 11 (100.0%) | 0 (0.0%) |
| Total (Category) | 106 (50.2%) | 105 (49.8%) |
| Total (Overall) | 334 (46.6%) | 383 (53.4%) |
Sales and Office Occupations
The most common Sales and Office occupations in Pine Bush are Office & Administration (117 | 16.3%), and Sales & Related (34 | 4.7%).

Sales and Office Occupations by Sex

| Occupation | Male | Female |
| Sales & Related | 0 (0.0%) | 34 (100.0%) |
| Office & Administration | 9 (7.7%) | 108 (92.3%) |
| Total (Category) | 9 (6.0%) | 142 (94.0%) |
| Total (Overall) | 334 (46.6%) | 383 (53.4%) |
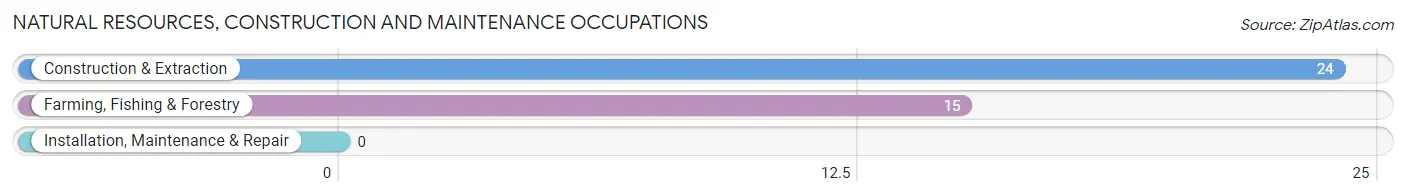
Natural Resources, Construction and Maintenance Occupations
The most common Natural Resources, Construction and Maintenance occupations in Pine Bush are Construction & Extraction (24 | 3.4%), and Farming, Fishing & Forestry (15 | 2.1%).
Natural Resources, Construction and Maintenance Occupations by Sex
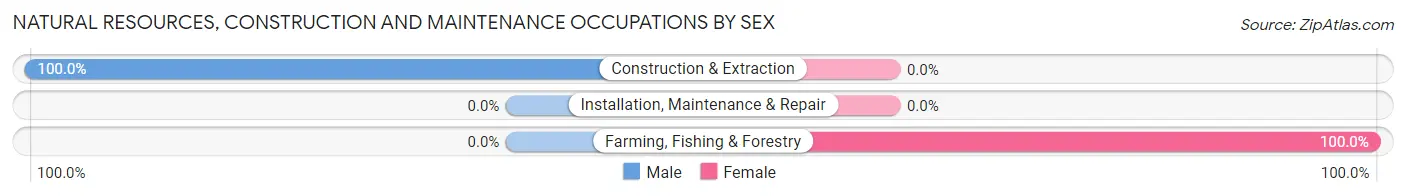
| Occupation | Male | Female |
| Farming, Fishing & Forestry | 0 (0.0%) | 15 (100.0%) |
| Construction & Extraction | 24 (100.0%) | 0 (0.0%) |
| Installation, Maintenance & Repair | 0 (0.0%) | 0 (0.0%) |
| Total (Category) | 24 (61.5%) | 15 (38.5%) |
| Total (Overall) | 334 (46.6%) | 383 (53.4%) |
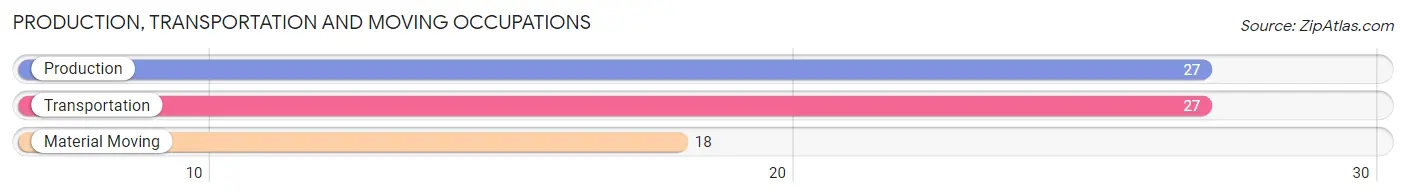
Production, Transportation and Moving Occupations
The most common Production, Transportation and Moving occupations in Pine Bush are Production (27 | 3.8%), Transportation (27 | 3.8%), and Material Moving (18 | 2.5%).
Production, Transportation and Moving Occupations by Sex
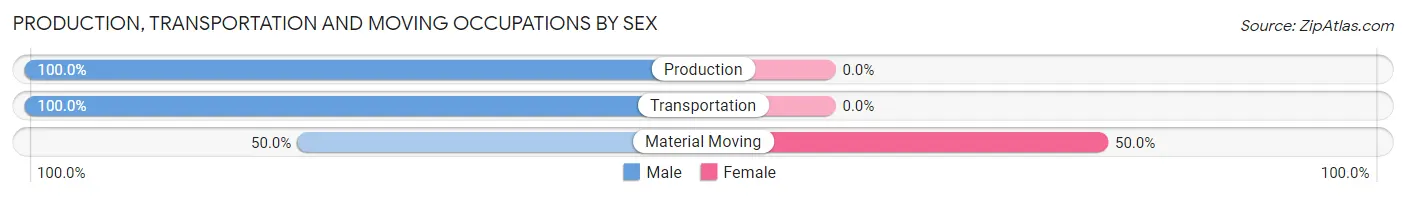
| Occupation | Male | Female |
| Production | 27 (100.0%) | 0 (0.0%) |
| Transportation | 27 (100.0%) | 0 (0.0%) |
| Material Moving | 9 (50.0%) | 9 (50.0%) |
| Total (Category) | 63 (87.5%) | 9 (12.5%) |
| Total (Overall) | 334 (46.6%) | 383 (53.4%) |
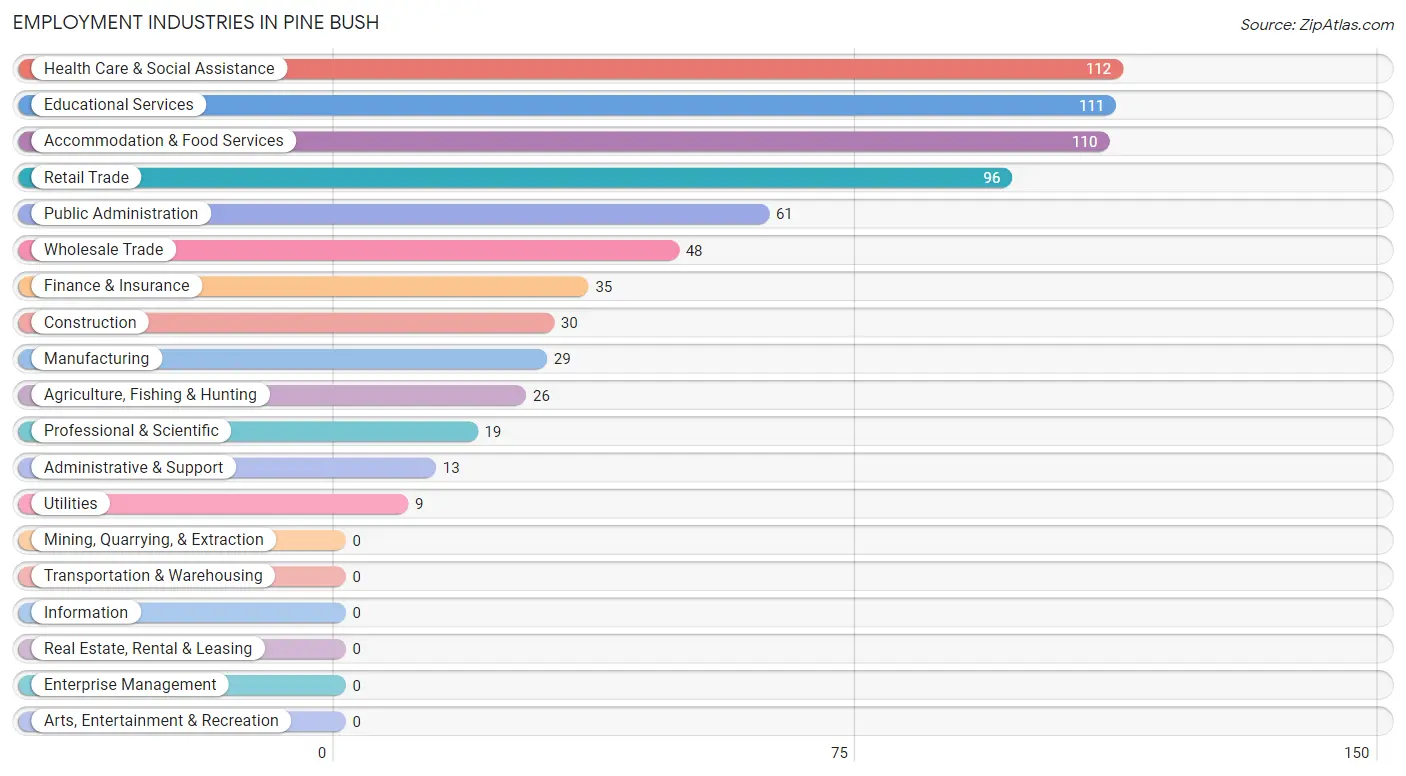
Employment Industries by Sex in Pine Bush
Employment Industries in Pine Bush
The major employment industries in Pine Bush include Health Care & Social Assistance (112 | 15.6%), Educational Services (111 | 15.5%), Accommodation & Food Services (110 | 15.3%), Retail Trade (96 | 13.4%), and Public Administration (61 | 8.5%).
Employment Industries by Sex in Pine Bush
The Pine Bush industries that see more men than women are Construction (100.0%), Administrative & Support (100.0%), and Public Administration (88.5%), whereas the industries that tend to have a higher number of women are Utilities (100.0%), Retail Trade (90.6%), and Health Care & Social Assistance (79.5%).
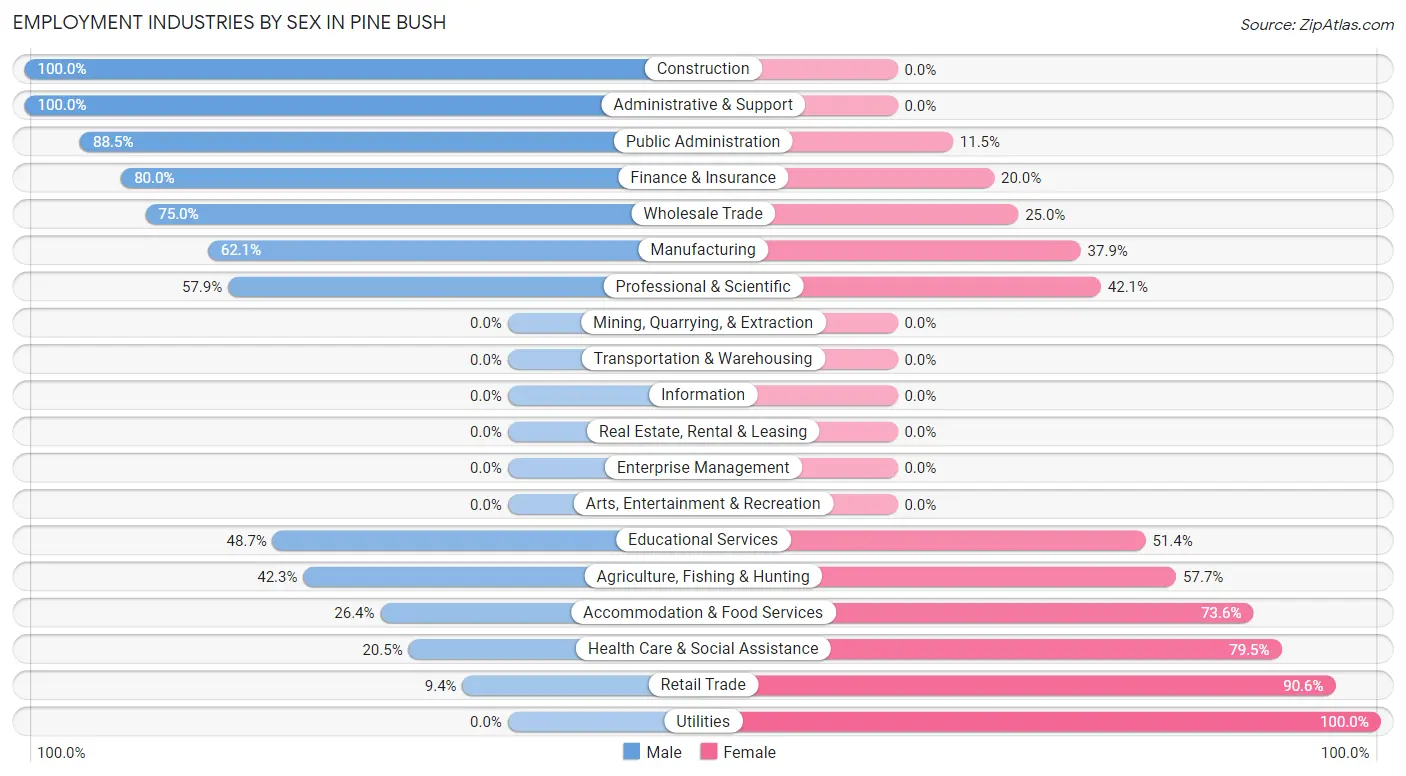
| Industry | Male | Female |
| Agriculture, Fishing & Hunting | 11 (42.3%) | 15 (57.7%) |
| Mining, Quarrying, & Extraction | 0 (0.0%) | 0 (0.0%) |
| Construction | 30 (100.0%) | 0 (0.0%) |
| Manufacturing | 18 (62.1%) | 11 (37.9%) |
| Wholesale Trade | 36 (75.0%) | 12 (25.0%) |
| Retail Trade | 9 (9.4%) | 87 (90.6%) |
| Transportation & Warehousing | 0 (0.0%) | 0 (0.0%) |
| Utilities | 0 (0.0%) | 9 (100.0%) |
| Information | 0 (0.0%) | 0 (0.0%) |
| Finance & Insurance | 28 (80.0%) | 7 (20.0%) |
| Real Estate, Rental & Leasing | 0 (0.0%) | 0 (0.0%) |
| Professional & Scientific | 11 (57.9%) | 8 (42.1%) |
| Enterprise Management | 0 (0.0%) | 0 (0.0%) |
| Administrative & Support | 13 (100.0%) | 0 (0.0%) |
| Educational Services | 54 (48.6%) | 57 (51.3%) |
| Health Care & Social Assistance | 23 (20.5%) | 89 (79.5%) |
| Arts, Entertainment & Recreation | 0 (0.0%) | 0 (0.0%) |
| Accommodation & Food Services | 29 (26.4%) | 81 (73.6%) |
| Public Administration | 54 (88.5%) | 7 (11.5%) |
| Total | 334 (46.6%) | 383 (53.4%) |
Education in Pine Bush
School Enrollment in Pine Bush
The most common levels of schooling among the 253 students in Pine Bush are elementary school (105 | 41.5%), high school (94 | 37.1%), and graduate / professional (19 | 7.5%).
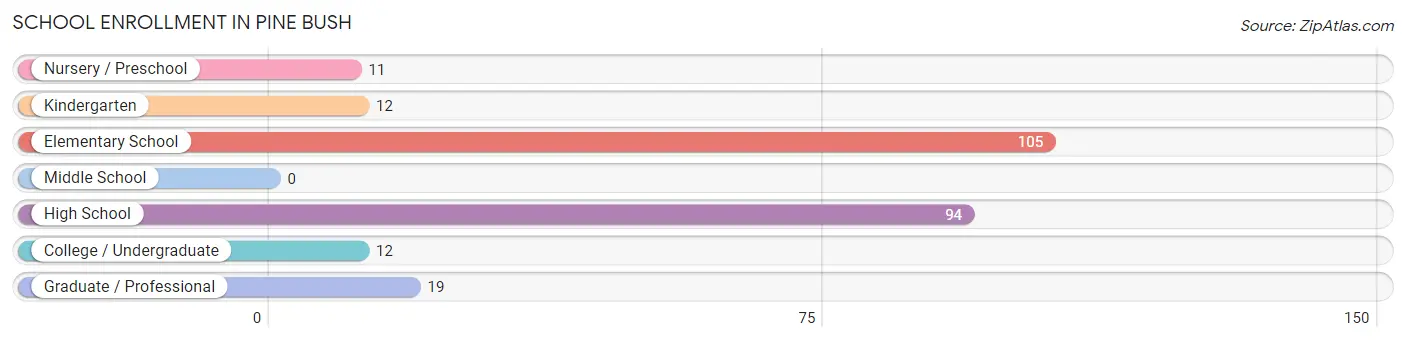
| School Level | # Students | % Students |
| Nursery / Preschool | 11 | 4.3% |
| Kindergarten | 12 | 4.7% |
| Elementary School | 105 | 41.5% |
| Middle School | 0 | 0.0% |
| High School | 94 | 37.1% |
| College / Undergraduate | 12 | 4.7% |
| Graduate / Professional | 19 | 7.5% |
| Total | 253 | 100.0% |
School Enrollment by Age by Funding Source in Pine Bush
Out of a total of 253 students who are enrolled in schools in Pine Bush, 108 (42.7%) attend a private institution, while the remaining 145 (57.3%) are enrolled in public schools. The age group of 10 to 14 year olds has the highest likelihood of being enrolled in private schools, with 14 (100.0% in the age bracket) enrolled. Conversely, the age group of 35 years and over has the lowest likelihood of being enrolled in a private school, with 9 (75.0% in the age bracket) attending a public institution.
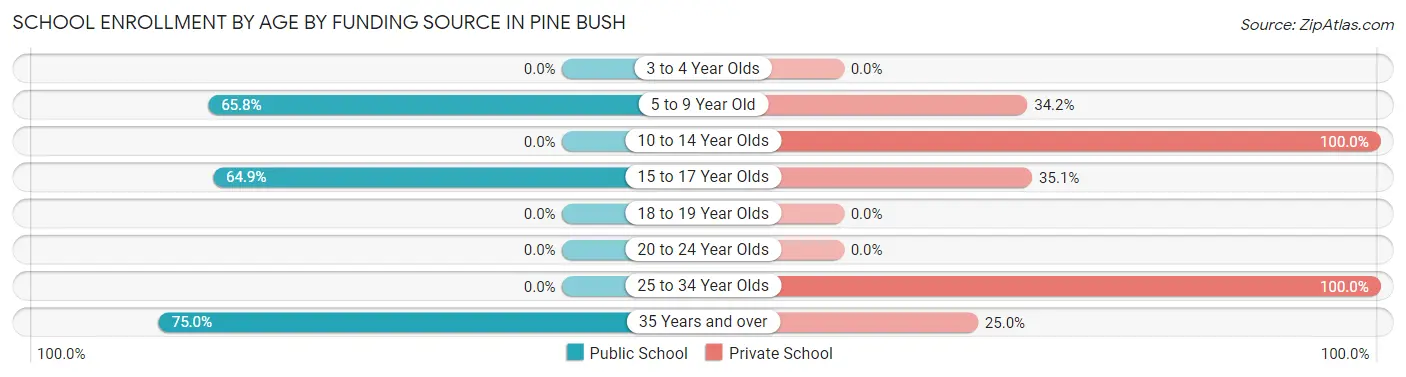
| Age Bracket | Public School | Private School |
| 3 to 4 Year Olds | 0 (0.0%) | 0 (0.0%) |
| 5 to 9 Year Old | 75 (65.8%) | 39 (34.2%) |
| 10 to 14 Year Olds | 0 (0.0%) | 14 (100.0%) |
| 15 to 17 Year Olds | 61 (64.9%) | 33 (35.1%) |
| 18 to 19 Year Olds | 0 (0.0%) | 0 (0.0%) |
| 20 to 24 Year Olds | 0 (0.0%) | 0 (0.0%) |
| 25 to 34 Year Olds | 0 (0.0%) | 19 (100.0%) |
| 35 Years and over | 9 (75.0%) | 3 (25.0%) |
| Total | 145 (57.3%) | 108 (42.7%) |
Educational Attainment by Field of Study in Pine Bush
Arts & humanities (73 | 27.7%), physical & health sciences (43 | 16.3%), bio, nature & agricultural (37 | 14.0%), education (35 | 13.3%), and science & technology (22 | 8.3%) are the most common fields of study among 264 individuals in Pine Bush who have obtained a bachelor's degree or higher.
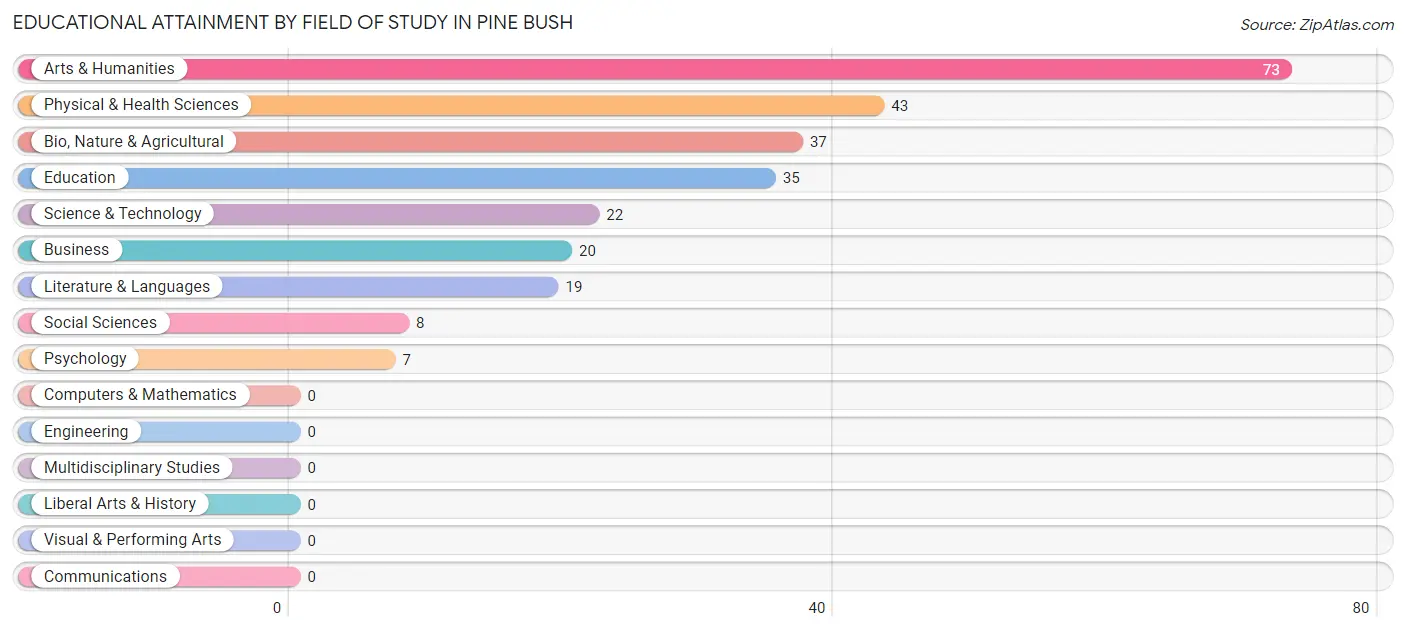
| Field of Study | # Graduates | % Graduates |
| Computers & Mathematics | 0 | 0.0% |
| Bio, Nature & Agricultural | 37 | 14.0% |
| Physical & Health Sciences | 43 | 16.3% |
| Psychology | 7 | 2.6% |
| Social Sciences | 8 | 3.0% |
| Engineering | 0 | 0.0% |
| Multidisciplinary Studies | 0 | 0.0% |
| Science & Technology | 22 | 8.3% |
| Business | 20 | 7.6% |
| Education | 35 | 13.3% |
| Literature & Languages | 19 | 7.2% |
| Liberal Arts & History | 0 | 0.0% |
| Visual & Performing Arts | 0 | 0.0% |
| Communications | 0 | 0.0% |
| Arts & Humanities | 73 | 27.7% |
| Total | 264 | 100.0% |
Transportation & Commute in Pine Bush
Vehicle Availability by Sex in Pine Bush
The most prevalent vehicle ownership categories in Pine Bush are males with 2 vehicles (163, accounting for 48.8%) and females with 2 vehicles (91, making up 42.6%).
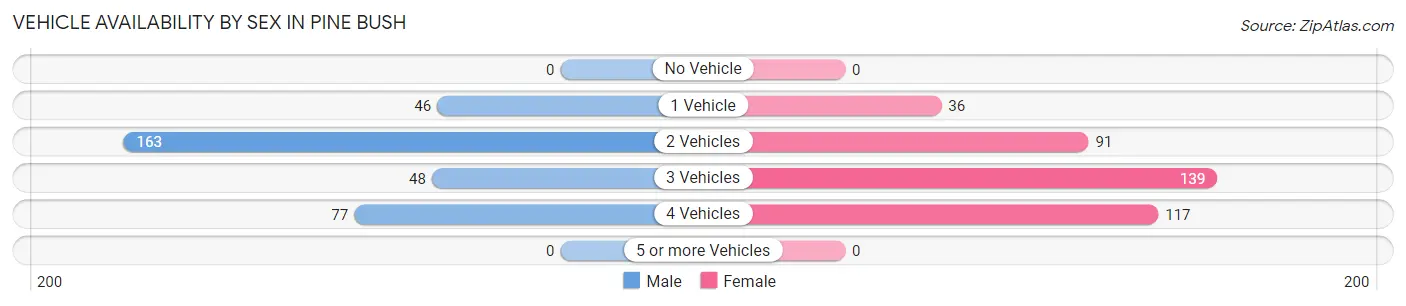
| Vehicles Available | Male | Female |
| No Vehicle | 0 (0.0%) | 0 (0.0%) |
| 1 Vehicle | 46 (13.8%) | 36 (9.4%) |
| 2 Vehicles | 163 (48.8%) | 91 (23.8%) |
| 3 Vehicles | 48 (14.4%) | 139 (36.3%) |
| 4 Vehicles | 77 (23.1%) | 117 (30.5%) |
| 5 or more Vehicles | 0 (0.0%) | 0 (0.0%) |
| Total | 334 (100.0%) | 383 (100.0%) |
Commute Time in Pine Bush
The most frequently occuring commute durations in Pine Bush are 30 to 34 minutes (119 commuters, 16.8%), 10 to 14 minutes (113 commuters, 16.0%), and 60 to 89 minutes (102 commuters, 14.4%).
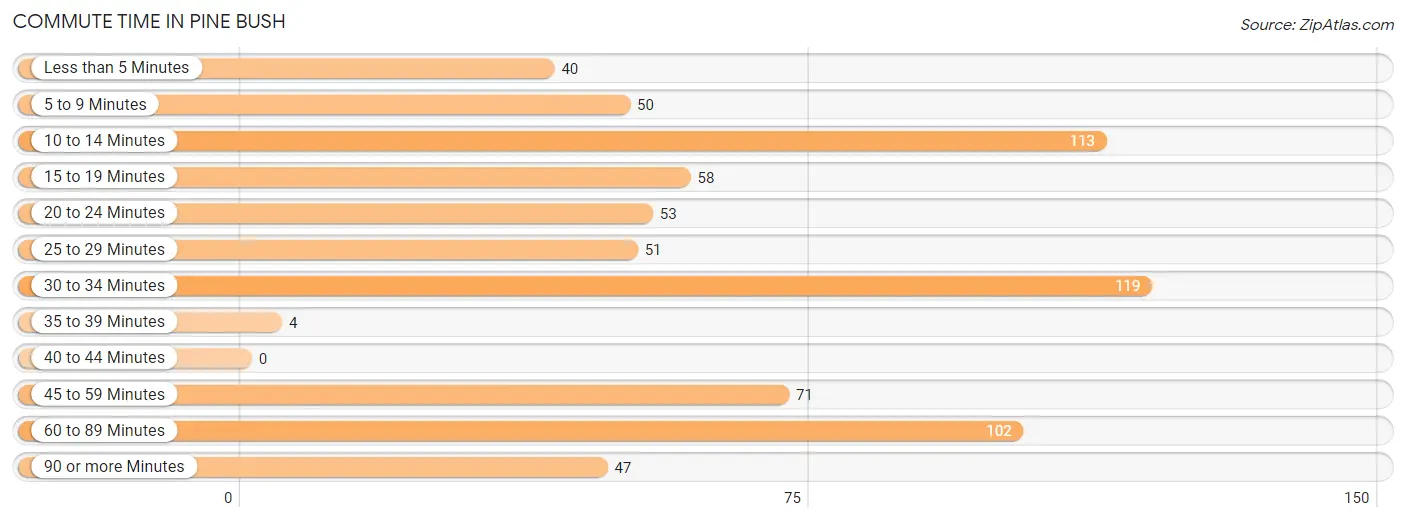
| Commute Time | # Commuters | % Commuters |
| Less than 5 Minutes | 40 | 5.7% |
| 5 to 9 Minutes | 50 | 7.1% |
| 10 to 14 Minutes | 113 | 16.0% |
| 15 to 19 Minutes | 58 | 8.2% |
| 20 to 24 Minutes | 53 | 7.5% |
| 25 to 29 Minutes | 51 | 7.2% |
| 30 to 34 Minutes | 119 | 16.8% |
| 35 to 39 Minutes | 4 | 0.6% |
| 40 to 44 Minutes | 0 | 0.0% |
| 45 to 59 Minutes | 71 | 10.0% |
| 60 to 89 Minutes | 102 | 14.4% |
| 90 or more Minutes | 47 | 6.6% |
Commute Time by Sex in Pine Bush
The most common commute times in Pine Bush are 60 to 89 minutes (83 commuters, 24.8%) for males and 10 to 14 minutes (113 commuters, 30.2%) for females.
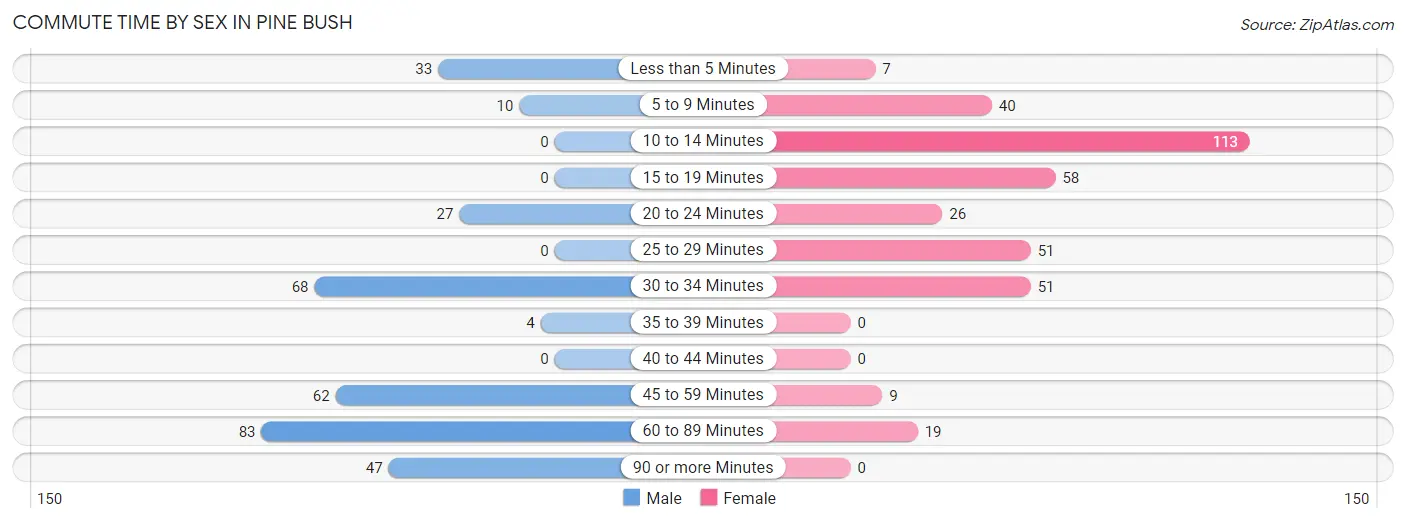
| Commute Time | Male | Female |
| Less than 5 Minutes | 33 (9.9%) | 7 (1.9%) |
| 5 to 9 Minutes | 10 (3.0%) | 40 (10.7%) |
| 10 to 14 Minutes | 0 (0.0%) | 113 (30.2%) |
| 15 to 19 Minutes | 0 (0.0%) | 58 (15.5%) |
| 20 to 24 Minutes | 27 (8.1%) | 26 (7.0%) |
| 25 to 29 Minutes | 0 (0.0%) | 51 (13.6%) |
| 30 to 34 Minutes | 68 (20.4%) | 51 (13.6%) |
| 35 to 39 Minutes | 4 (1.2%) | 0 (0.0%) |
| 40 to 44 Minutes | 0 (0.0%) | 0 (0.0%) |
| 45 to 59 Minutes | 62 (18.6%) | 9 (2.4%) |
| 60 to 89 Minutes | 83 (24.8%) | 19 (5.1%) |
| 90 or more Minutes | 47 (14.1%) | 0 (0.0%) |
Time of Departure to Work by Sex in Pine Bush
The most frequent times of departure to work in Pine Bush are 6:00 AM to 6:29 AM (95, 28.4%) for males and 7:00 AM to 7:29 AM (144, 38.5%) for females.
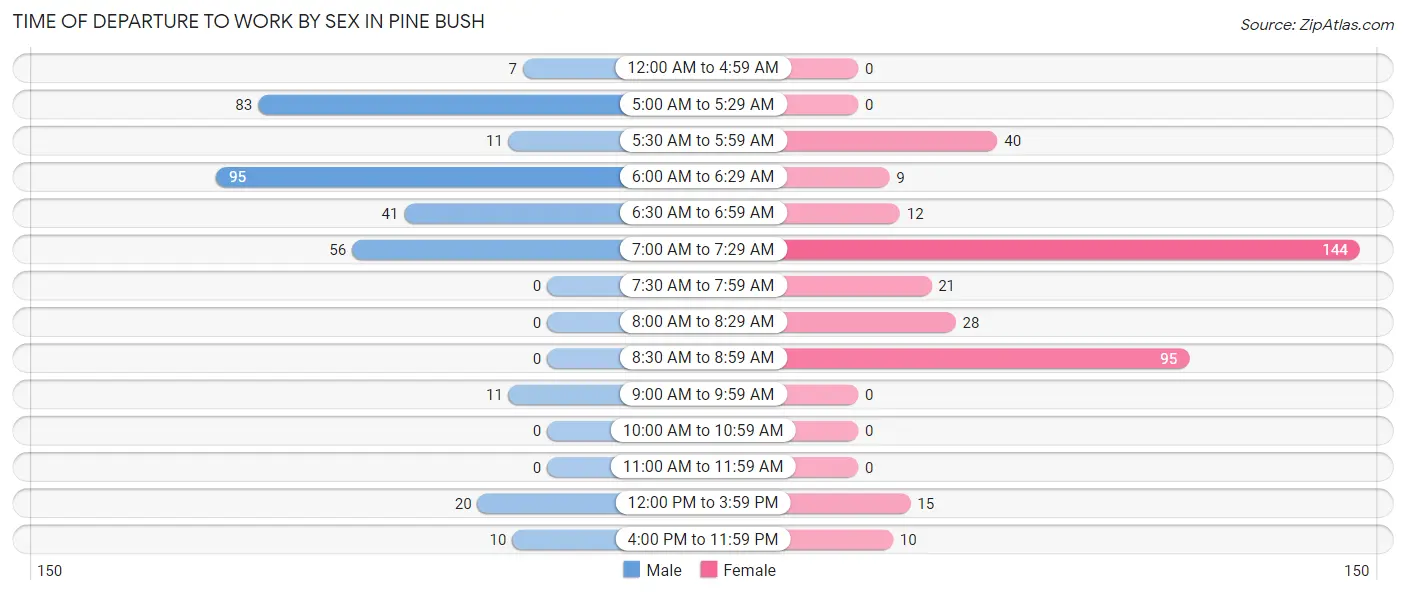
| Time of Departure | Male | Female |
| 12:00 AM to 4:59 AM | 7 (2.1%) | 0 (0.0%) |
| 5:00 AM to 5:29 AM | 83 (24.8%) | 0 (0.0%) |
| 5:30 AM to 5:59 AM | 11 (3.3%) | 40 (10.7%) |
| 6:00 AM to 6:29 AM | 95 (28.4%) | 9 (2.4%) |
| 6:30 AM to 6:59 AM | 41 (12.3%) | 12 (3.2%) |
| 7:00 AM to 7:29 AM | 56 (16.8%) | 144 (38.5%) |
| 7:30 AM to 7:59 AM | 0 (0.0%) | 21 (5.6%) |
| 8:00 AM to 8:29 AM | 0 (0.0%) | 28 (7.5%) |
| 8:30 AM to 8:59 AM | 0 (0.0%) | 95 (25.4%) |
| 9:00 AM to 9:59 AM | 11 (3.3%) | 0 (0.0%) |
| 10:00 AM to 10:59 AM | 0 (0.0%) | 0 (0.0%) |
| 11:00 AM to 11:59 AM | 0 (0.0%) | 0 (0.0%) |
| 12:00 PM to 3:59 PM | 20 (6.0%) | 15 (4.0%) |
| 4:00 PM to 11:59 PM | 10 (3.0%) | 10 (2.7%) |
| Total | 334 (100.0%) | 374 (100.0%) |
Housing Occupancy in Pine Bush
Occupancy by Ownership in Pine Bush
Of the total 658 dwellings in Pine Bush, owner-occupied units account for 287 (43.6%), while renter-occupied units make up 371 (56.4%).
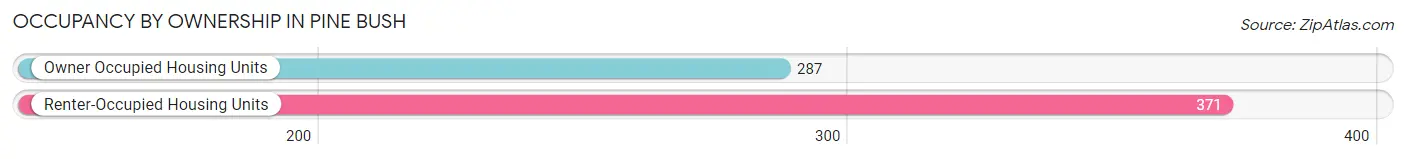
| Occupancy | # Housing Units | % Housing Units |
| Owner Occupied Housing Units | 287 | 43.6% |
| Renter-Occupied Housing Units | 371 | 56.4% |
| Total Occupied Housing Units | 658 | 100.0% |
Occupancy by Household Size in Pine Bush
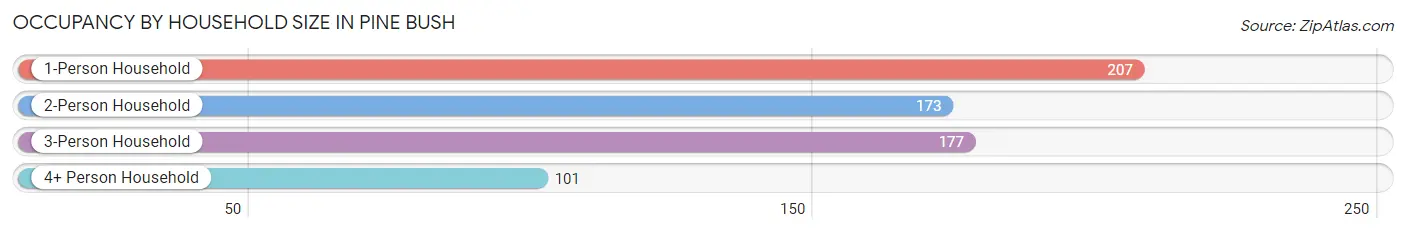
| Household Size | # Housing Units | % Housing Units |
| 1-Person Household | 207 | 31.5% |
| 2-Person Household | 173 | 26.3% |
| 3-Person Household | 177 | 26.9% |
| 4+ Person Household | 101 | 15.3% |
| Total Housing Units | 658 | 100.0% |
Occupancy by Ownership by Household Size in Pine Bush
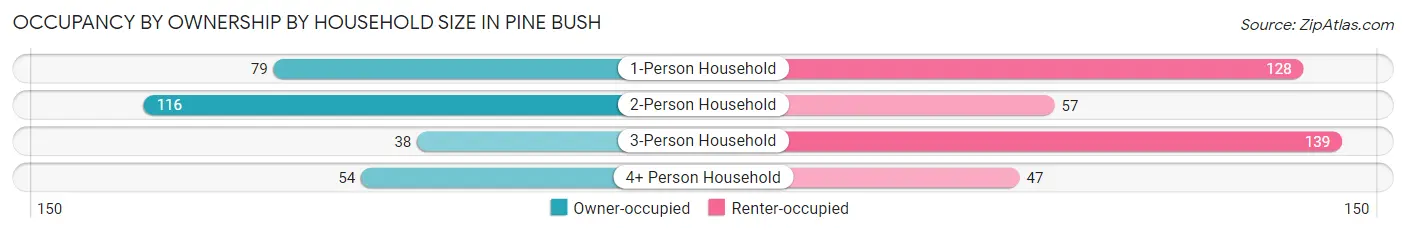
| Household Size | Owner-occupied | Renter-occupied |
| 1-Person Household | 79 (38.2%) | 128 (61.8%) |
| 2-Person Household | 116 (67.0%) | 57 (33.0%) |
| 3-Person Household | 38 (21.5%) | 139 (78.5%) |
| 4+ Person Household | 54 (53.5%) | 47 (46.5%) |
| Total Housing Units | 287 (43.6%) | 371 (56.4%) |
Occupancy by Educational Attainment in Pine Bush
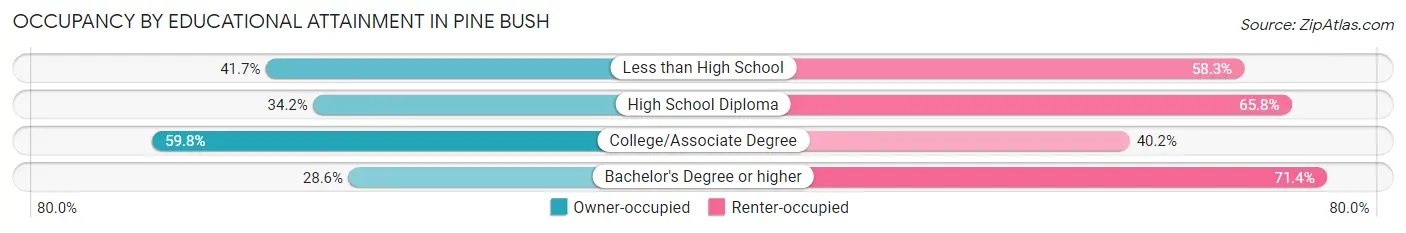
| Household Size | Owner-occupied | Renter-occupied |
| Less than High School | 10 (41.7%) | 14 (58.3%) |
| High School Diploma | 69 (34.2%) | 133 (65.8%) |
| College/Associate Degree | 162 (59.8%) | 109 (40.2%) |
| Bachelor's Degree or higher | 46 (28.6%) | 115 (71.4%) |
Occupancy by Age of Householder in Pine Bush
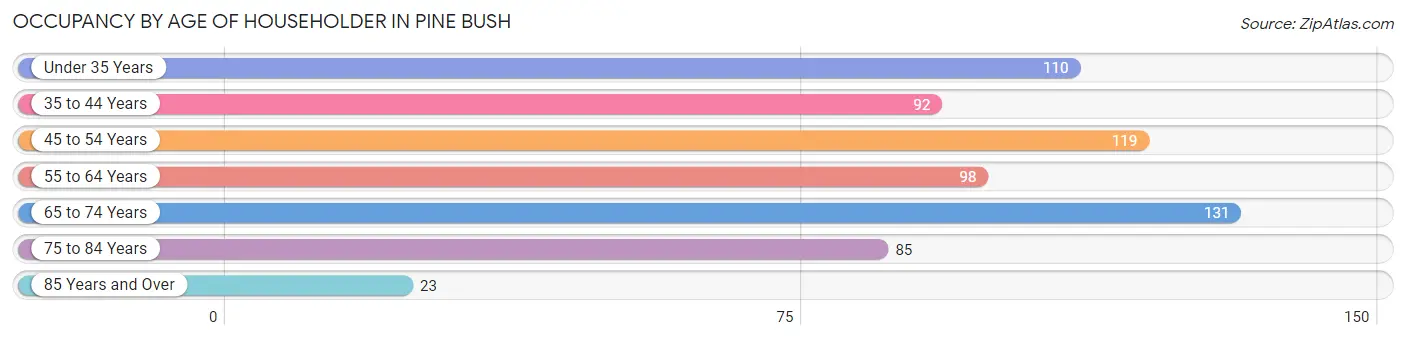
| Age Bracket | # Households | % Households |
| Under 35 Years | 110 | 16.7% |
| 35 to 44 Years | 92 | 14.0% |
| 45 to 54 Years | 119 | 18.1% |
| 55 to 64 Years | 98 | 14.9% |
| 65 to 74 Years | 131 | 19.9% |
| 75 to 84 Years | 85 | 12.9% |
| 85 Years and Over | 23 | 3.5% |
| Total | 658 | 100.0% |
Housing Finances in Pine Bush
Median Income by Occupancy in Pine Bush
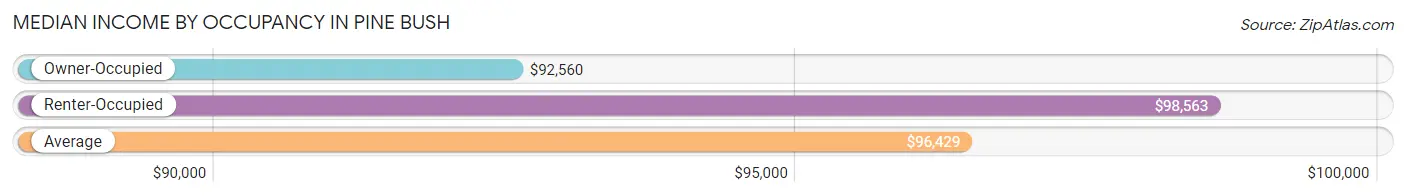
| Occupancy Type | # Households | Median Income |
| Owner-Occupied | 287 (43.6%) | $92,560 |
| Renter-Occupied | 371 (56.4%) | $98,563 |
| Average | 658 (100.0%) | $96,429 |
Occupancy by Householder Income Bracket in Pine Bush
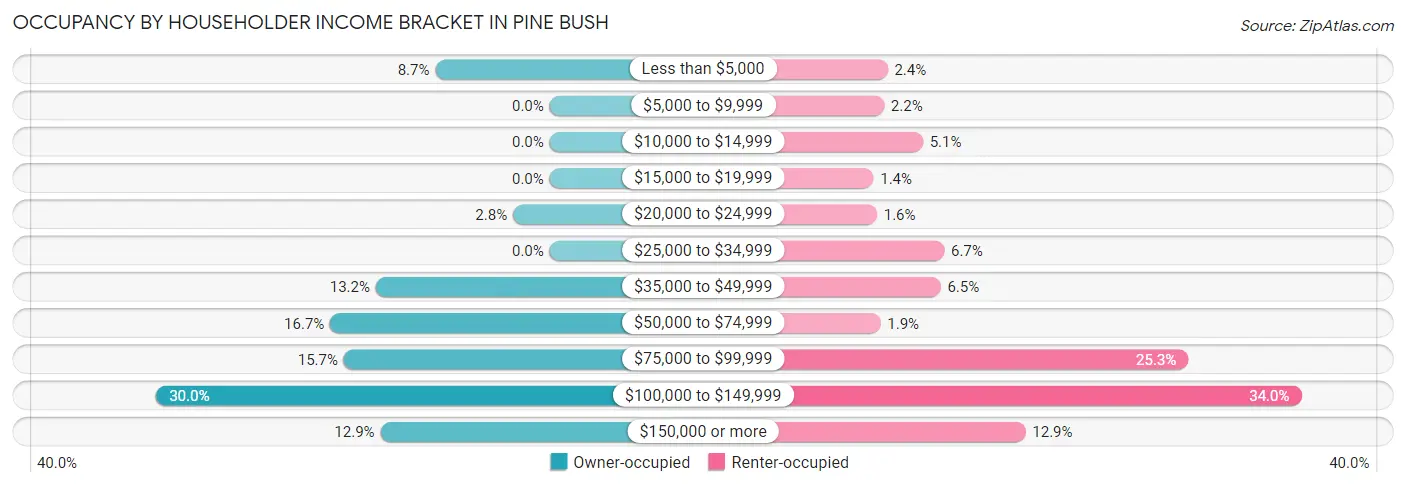
| Income Bracket | Owner-occupied | Renter-occupied |
| Less than $5,000 | 25 (8.7%) | 9 (2.4%) |
| $5,000 to $9,999 | 0 (0.0%) | 8 (2.2%) |
| $10,000 to $14,999 | 0 (0.0%) | 19 (5.1%) |
| $15,000 to $19,999 | 0 (0.0%) | 5 (1.3%) |
| $20,000 to $24,999 | 8 (2.8%) | 6 (1.6%) |
| $25,000 to $34,999 | 0 (0.0%) | 25 (6.7%) |
| $35,000 to $49,999 | 38 (13.2%) | 24 (6.5%) |
| $50,000 to $74,999 | 48 (16.7%) | 7 (1.9%) |
| $75,000 to $99,999 | 45 (15.7%) | 94 (25.3%) |
| $100,000 to $149,999 | 86 (30.0%) | 126 (34.0%) |
| $150,000 or more | 37 (12.9%) | 48 (12.9%) |
| Total | 287 (100.0%) | 371 (100.0%) |
Monthly Housing Cost Tiers in Pine Bush
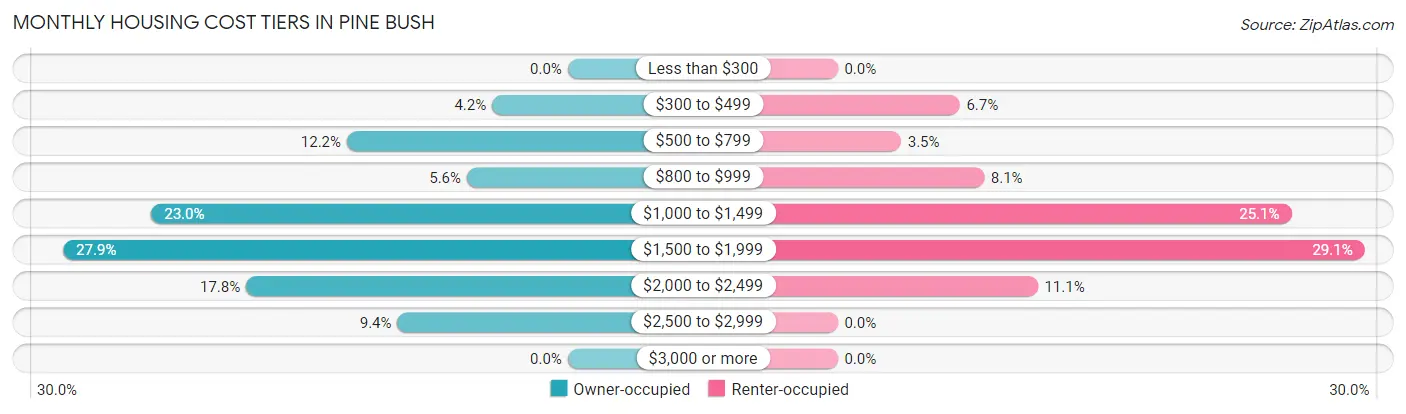
| Monthly Cost | Owner-occupied | Renter-occupied |
| Less than $300 | 0 (0.0%) | 0 (0.0%) |
| $300 to $499 | 12 (4.2%) | 25 (6.7%) |
| $500 to $799 | 35 (12.2%) | 13 (3.5%) |
| $800 to $999 | 16 (5.6%) | 30 (8.1%) |
| $1,000 to $1,499 | 66 (23.0%) | 93 (25.1%) |
| $1,500 to $1,999 | 80 (27.9%) | 108 (29.1%) |
| $2,000 to $2,499 | 51 (17.8%) | 41 (11.1%) |
| $2,500 to $2,999 | 27 (9.4%) | 0 (0.0%) |
| $3,000 or more | 0 (0.0%) | 0 (0.0%) |
| Total | 287 (100.0%) | 371 (100.0%) |
Physical Housing Characteristics in Pine Bush
Housing Structures in Pine Bush
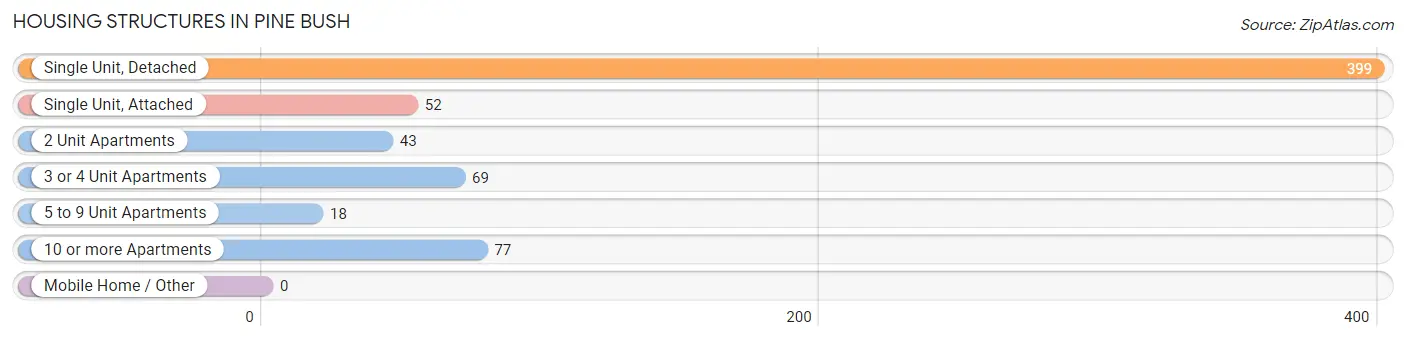
| Structure Type | # Housing Units | % Housing Units |
| Single Unit, Detached | 399 | 60.6% |
| Single Unit, Attached | 52 | 7.9% |
| 2 Unit Apartments | 43 | 6.5% |
| 3 or 4 Unit Apartments | 69 | 10.5% |
| 5 to 9 Unit Apartments | 18 | 2.7% |
| 10 or more Apartments | 77 | 11.7% |
| Mobile Home / Other | 0 | 0.0% |
| Total | 658 | 100.0% |
Housing Structures by Occupancy in Pine Bush
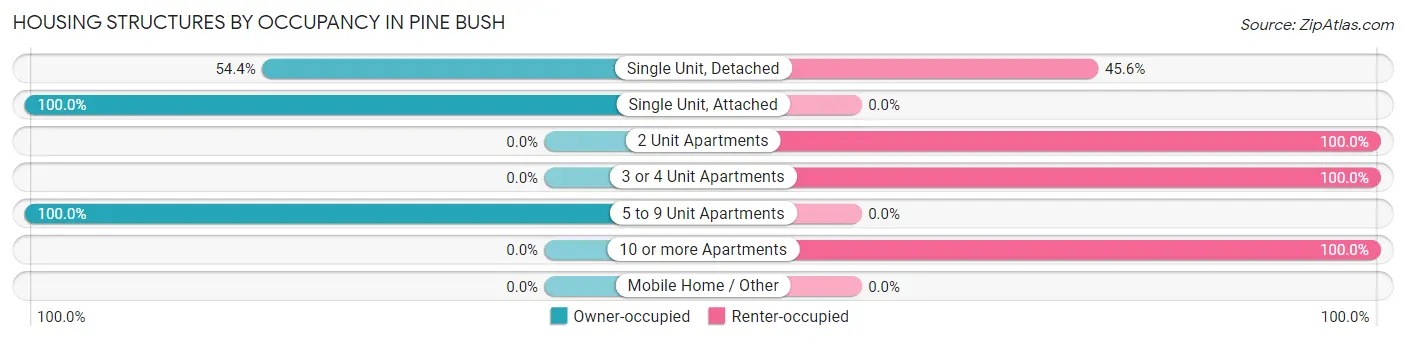
| Structure Type | Owner-occupied | Renter-occupied |
| Single Unit, Detached | 217 (54.4%) | 182 (45.6%) |
| Single Unit, Attached | 52 (100.0%) | 0 (0.0%) |
| 2 Unit Apartments | 0 (0.0%) | 43 (100.0%) |
| 3 or 4 Unit Apartments | 0 (0.0%) | 69 (100.0%) |
| 5 to 9 Unit Apartments | 18 (100.0%) | 0 (0.0%) |
| 10 or more Apartments | 0 (0.0%) | 77 (100.0%) |
| Mobile Home / Other | 0 (0.0%) | 0 (0.0%) |
| Total | 287 (43.6%) | 371 (56.4%) |
Housing Structures by Number of Rooms in Pine Bush
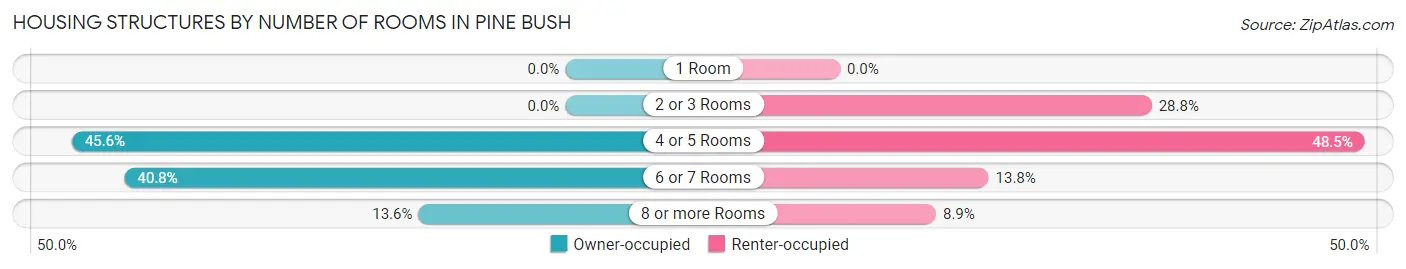
| Number of Rooms | Owner-occupied | Renter-occupied |
| 1 Room | 0 (0.0%) | 0 (0.0%) |
| 2 or 3 Rooms | 0 (0.0%) | 107 (28.8%) |
| 4 or 5 Rooms | 131 (45.6%) | 180 (48.5%) |
| 6 or 7 Rooms | 117 (40.8%) | 51 (13.8%) |
| 8 or more Rooms | 39 (13.6%) | 33 (8.9%) |
| Total | 287 (100.0%) | 371 (100.0%) |
Housing Structure by Heating Type in Pine Bush
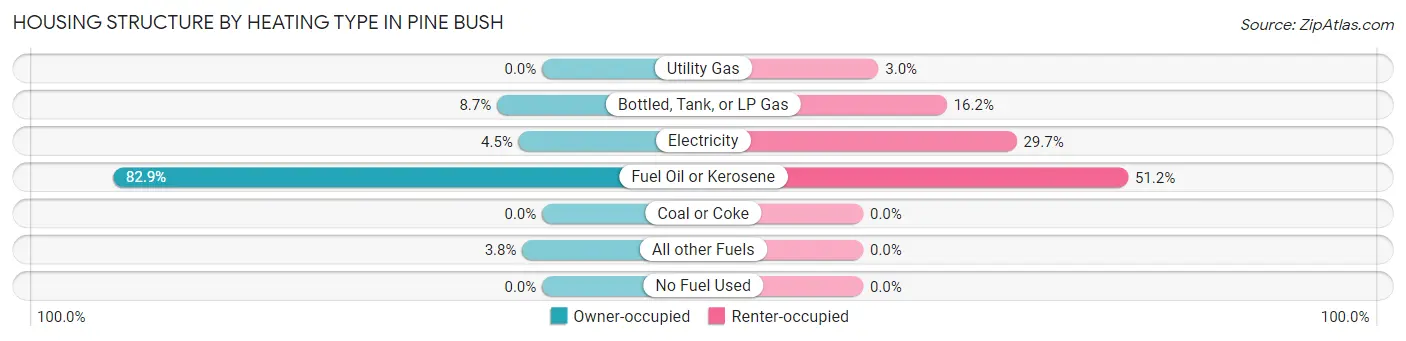
| Heating Type | Owner-occupied | Renter-occupied |
| Utility Gas | 0 (0.0%) | 11 (3.0%) |
| Bottled, Tank, or LP Gas | 25 (8.7%) | 60 (16.2%) |
| Electricity | 13 (4.5%) | 110 (29.6%) |
| Fuel Oil or Kerosene | 238 (82.9%) | 190 (51.2%) |
| Coal or Coke | 0 (0.0%) | 0 (0.0%) |
| All other Fuels | 11 (3.8%) | 0 (0.0%) |
| No Fuel Used | 0 (0.0%) | 0 (0.0%) |
| Total | 287 (100.0%) | 371 (100.0%) |
Household Vehicle Usage in Pine Bush
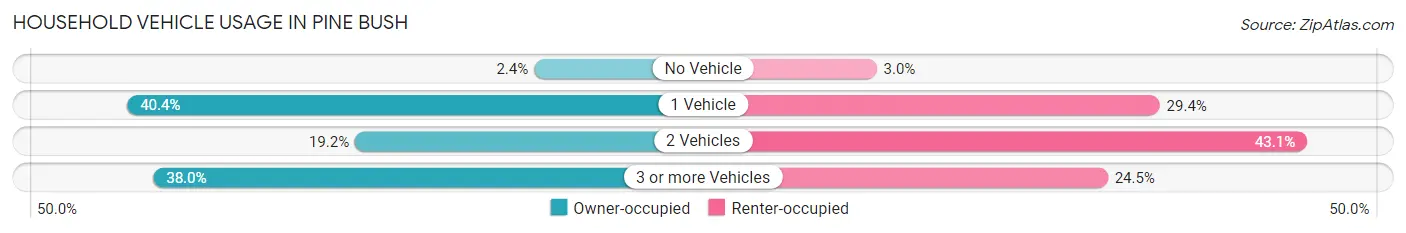
| Vehicles per Household | Owner-occupied | Renter-occupied |
| No Vehicle | 7 (2.4%) | 11 (3.0%) |
| 1 Vehicle | 116 (40.4%) | 109 (29.4%) |
| 2 Vehicles | 55 (19.2%) | 160 (43.1%) |
| 3 or more Vehicles | 109 (38.0%) | 91 (24.5%) |
| Total | 287 (100.0%) | 371 (100.0%) |
Real Estate & Mortgages in Pine Bush
Real Estate and Mortgage Overview in Pine Bush
| Characteristic | Without Mortgage | With Mortgage |
| Housing Units | 84 | 203 |
| Median Property Value | $275,000 | $250,900 |
| Median Household Income | - | - |
| Monthly Housing Costs | $781 | $0 |
| Real Estate Taxes | - | - |
Property Value by Mortgage Status in Pine Bush
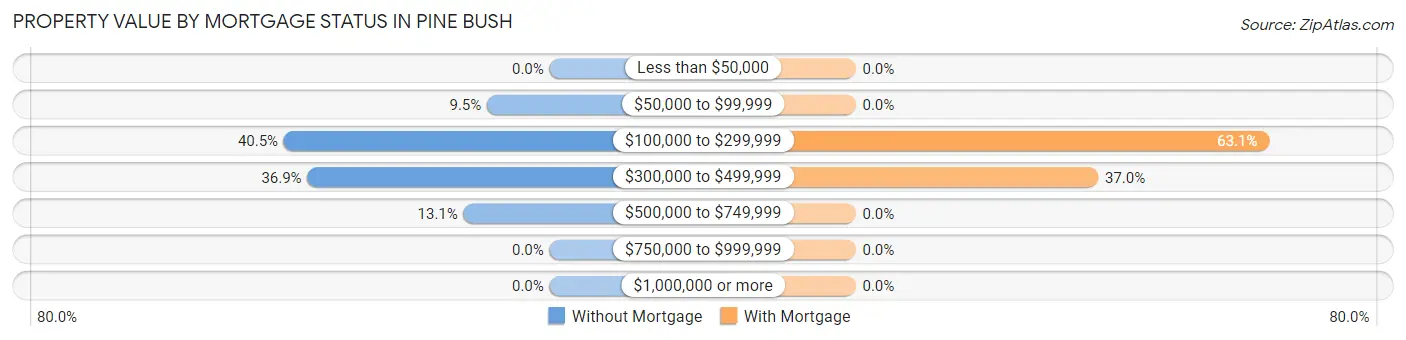
| Property Value | Without Mortgage | With Mortgage |
| Less than $50,000 | 0 (0.0%) | 0 (0.0%) |
| $50,000 to $99,999 | 8 (9.5%) | 0 (0.0%) |
| $100,000 to $299,999 | 34 (40.5%) | 128 (63.0%) |
| $300,000 to $499,999 | 31 (36.9%) | 75 (36.9%) |
| $500,000 to $749,999 | 11 (13.1%) | 0 (0.0%) |
| $750,000 to $999,999 | 0 (0.0%) | 0 (0.0%) |
| $1,000,000 or more | 0 (0.0%) | 0 (0.0%) |
| Total | 84 (100.0%) | 203 (100.0%) |
Household Income by Mortgage Status in Pine Bush
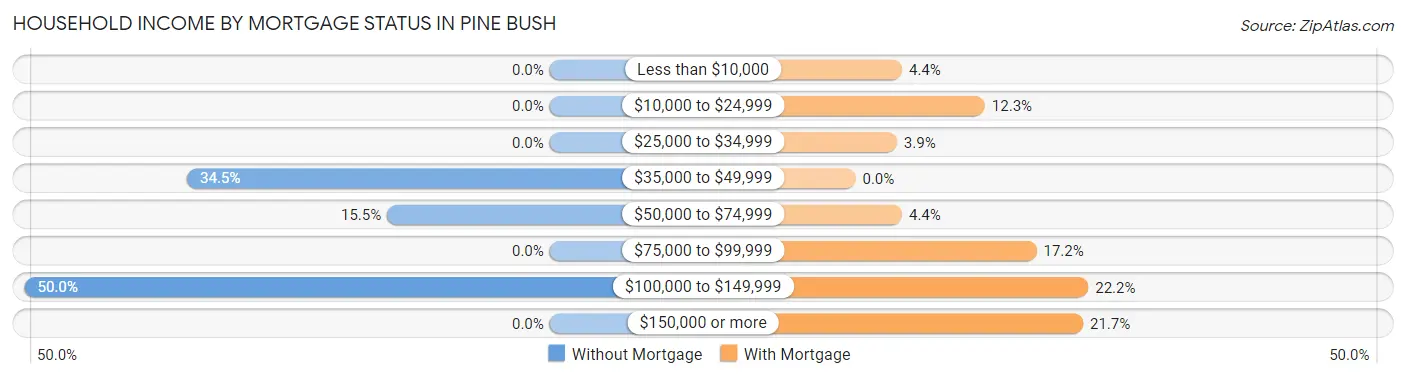
| Household Income | Without Mortgage | With Mortgage |
| Less than $10,000 | 0 (0.0%) | 9 (4.4%) |
| $10,000 to $24,999 | 0 (0.0%) | 25 (12.3%) |
| $25,000 to $34,999 | 0 (0.0%) | 8 (3.9%) |
| $35,000 to $49,999 | 29 (34.5%) | 0 (0.0%) |
| $50,000 to $74,999 | 13 (15.5%) | 9 (4.4%) |
| $75,000 to $99,999 | 0 (0.0%) | 35 (17.2%) |
| $100,000 to $149,999 | 42 (50.0%) | 45 (22.2%) |
| $150,000 or more | 0 (0.0%) | 44 (21.7%) |
| Total | 84 (100.0%) | 203 (100.0%) |
Property Value to Household Income Ratio in Pine Bush
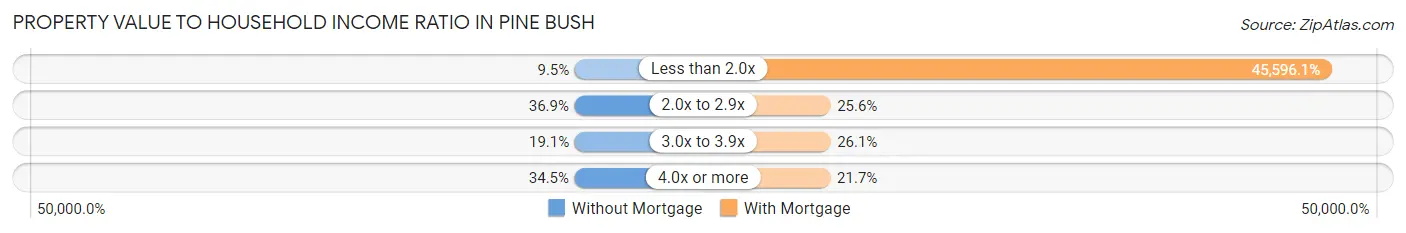
| Value-to-Income Ratio | Without Mortgage | With Mortgage |
| Less than 2.0x | 8 (9.5%) | 92,560 (45,596.1%) |
| 2.0x to 2.9x | 31 (36.9%) | 52 (25.6%) |
| 3.0x to 3.9x | 16 (19.1%) | 53 (26.1%) |
| 4.0x or more | 29 (34.5%) | 44 (21.7%) |
| Total | 84 (100.0%) | 203 (100.0%) |
Real Estate Taxes by Mortgage Status in Pine Bush

| Property Taxes | Without Mortgage | With Mortgage |
| Less than $800 | 7 (8.3%) | 0 (0.0%) |
| $800 to $1,499 | 0 (0.0%) | 0 (0.0%) |
| $800 to $1,499 | 69 (82.1%) | 6 (3.0%) |
| Total | 84 (100.0%) | 203 (100.0%) |
Health & Disability in Pine Bush
Health Insurance Coverage by Age in Pine Bush
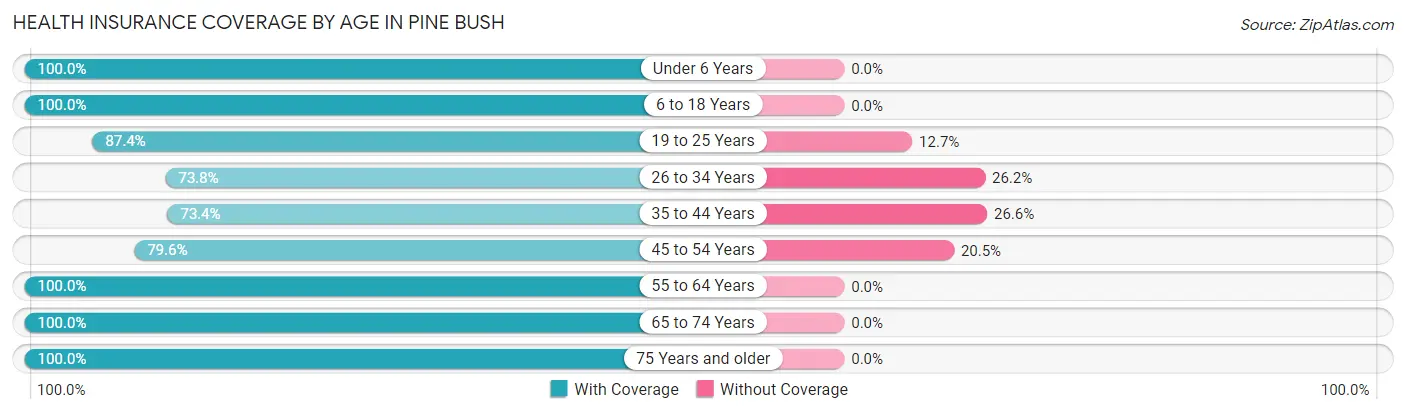
| Age Bracket | With Coverage | Without Coverage |
| Under 6 Years | 80 (100.0%) | 0 (0.0%) |
| 6 to 18 Years | 231 (100.0%) | 0 (0.0%) |
| 19 to 25 Years | 145 (87.4%) | 21 (12.7%) |
| 26 to 34 Years | 208 (73.8%) | 74 (26.2%) |
| 35 to 44 Years | 113 (73.4%) | 41 (26.6%) |
| 45 to 54 Years | 140 (79.5%) | 36 (20.4%) |
| 55 to 64 Years | 183 (100.0%) | 0 (0.0%) |
| 65 to 74 Years | 215 (100.0%) | 0 (0.0%) |
| 75 Years and older | 161 (100.0%) | 0 (0.0%) |
| Total | 1,476 (89.6%) | 172 (10.4%) |
Health Insurance Coverage by Citizenship Status in Pine Bush

| Citizenship Status | With Coverage | Without Coverage |
| Native Born | 80 (100.0%) | 0 (0.0%) |
| Foreign Born, Citizen | 231 (100.0%) | 0 (0.0%) |
| Foreign Born, not a Citizen | 145 (87.4%) | 21 (12.7%) |
Health Insurance Coverage by Household Income in Pine Bush
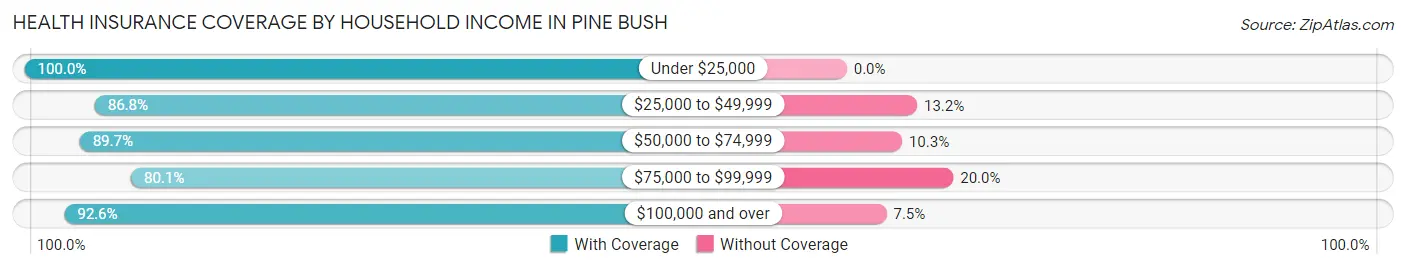
| Household Income | With Coverage | Without Coverage |
| Under $25,000 | 106 (100.0%) | 0 (0.0%) |
| $25,000 to $49,999 | 99 (86.8%) | 15 (13.2%) |
| $50,000 to $74,999 | 78 (89.7%) | 9 (10.3%) |
| $75,000 to $99,999 | 325 (80.0%) | 81 (20.0%) |
| $100,000 and over | 832 (92.5%) | 67 (7.4%) |
Public vs Private Health Insurance Coverage by Age in Pine Bush
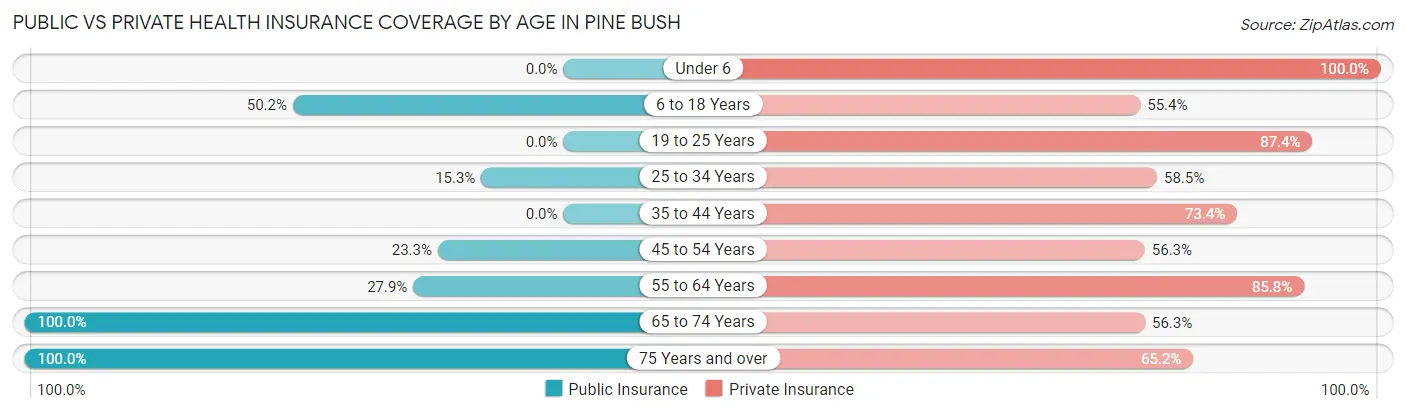
| Age Bracket | Public Insurance | Private Insurance |
| Under 6 | 0 (0.0%) | 80 (100.0%) |
| 6 to 18 Years | 116 (50.2%) | 128 (55.4%) |
| 19 to 25 Years | 0 (0.0%) | 145 (87.4%) |
| 25 to 34 Years | 43 (15.2%) | 165 (58.5%) |
| 35 to 44 Years | 0 (0.0%) | 113 (73.4%) |
| 45 to 54 Years | 41 (23.3%) | 99 (56.2%) |
| 55 to 64 Years | 51 (27.9%) | 157 (85.8%) |
| 65 to 74 Years | 215 (100.0%) | 121 (56.3%) |
| 75 Years and over | 161 (100.0%) | 105 (65.2%) |
| Total | 627 (38.1%) | 1,113 (67.5%) |
Disability Status by Sex by Age in Pine Bush
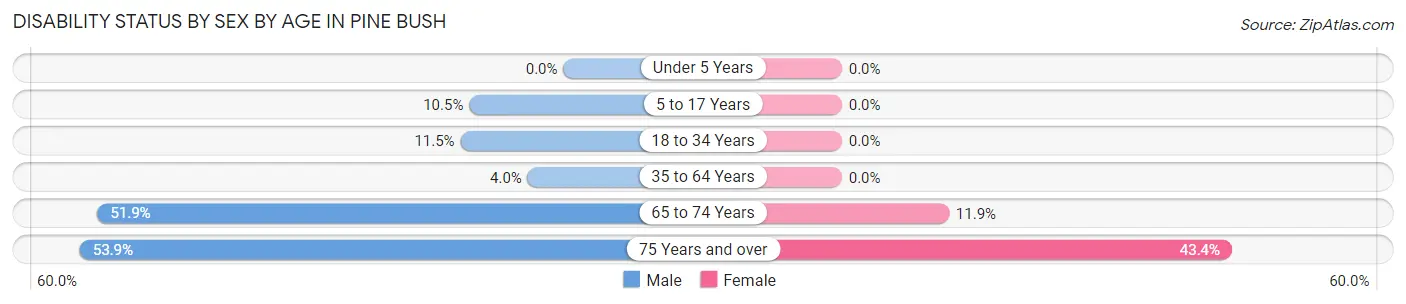
| Age Bracket | Male | Female |
| Under 5 Years | 0 (0.0%) | 0 (0.0%) |
| 5 to 17 Years | 13 (10.5%) | 0 (0.0%) |
| 18 to 34 Years | 11 (11.5%) | 0 (0.0%) |
| 35 to 64 Years | 11 (4.0%) | 0 (0.0%) |
| 65 to 74 Years | 55 (51.9%) | 13 (11.9%) |
| 75 Years and over | 21 (53.8%) | 53 (43.4%) |
Disability Class by Sex by Age in Pine Bush
Disability Class: Hearing Difficulty
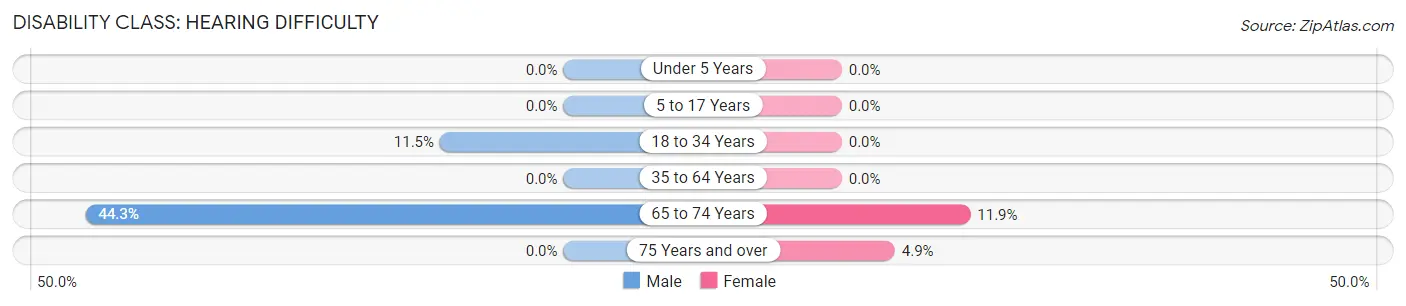
| Age Bracket | Male | Female |
| Under 5 Years | 0 (0.0%) | 0 (0.0%) |
| 5 to 17 Years | 0 (0.0%) | 0 (0.0%) |
| 18 to 34 Years | 11 (11.5%) | 0 (0.0%) |
| 35 to 64 Years | 0 (0.0%) | 0 (0.0%) |
| 65 to 74 Years | 47 (44.3%) | 13 (11.9%) |
| 75 Years and over | 0 (0.0%) | 6 (4.9%) |
Disability Class: Vision Difficulty
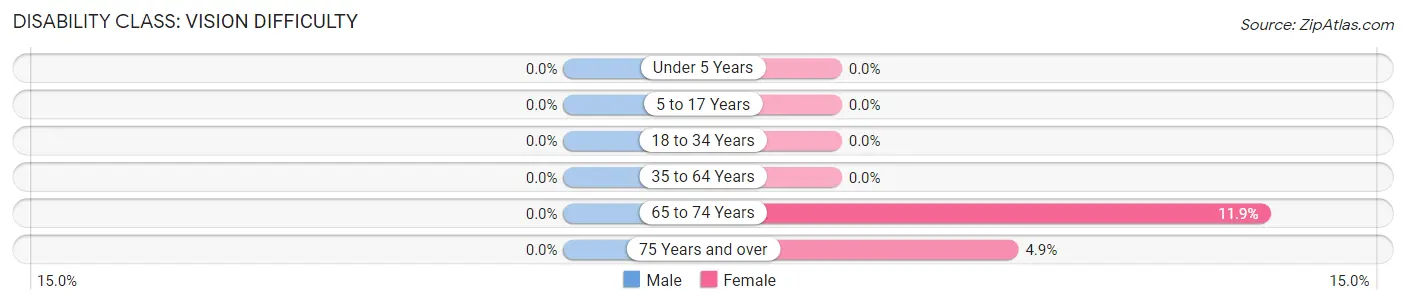
| Age Bracket | Male | Female |
| Under 5 Years | 0 (0.0%) | 0 (0.0%) |
| 5 to 17 Years | 0 (0.0%) | 0 (0.0%) |
| 18 to 34 Years | 0 (0.0%) | 0 (0.0%) |
| 35 to 64 Years | 0 (0.0%) | 0 (0.0%) |
| 65 to 74 Years | 0 (0.0%) | 13 (11.9%) |
| 75 Years and over | 0 (0.0%) | 6 (4.9%) |
Disability Class: Cognitive Difficulty
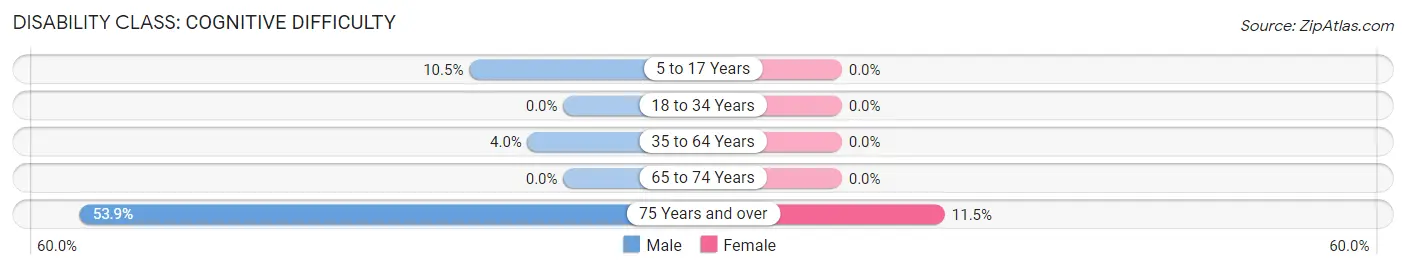
| Age Bracket | Male | Female |
| 5 to 17 Years | 13 (10.5%) | 0 (0.0%) |
| 18 to 34 Years | 0 (0.0%) | 0 (0.0%) |
| 35 to 64 Years | 11 (4.0%) | 0 (0.0%) |
| 65 to 74 Years | 0 (0.0%) | 0 (0.0%) |
| 75 Years and over | 21 (53.8%) | 14 (11.5%) |
Disability Class: Ambulatory Difficulty
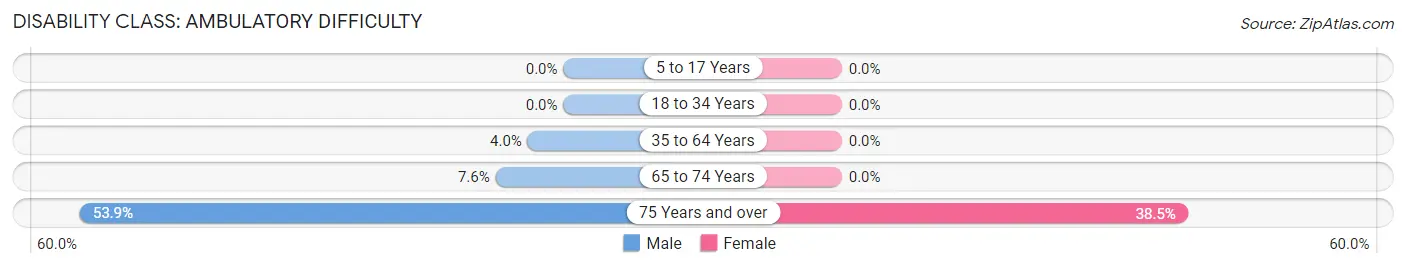
| Age Bracket | Male | Female |
| 5 to 17 Years | 0 (0.0%) | 0 (0.0%) |
| 18 to 34 Years | 0 (0.0%) | 0 (0.0%) |
| 35 to 64 Years | 11 (4.0%) | 0 (0.0%) |
| 65 to 74 Years | 8 (7.5%) | 0 (0.0%) |
| 75 Years and over | 21 (53.8%) | 47 (38.5%) |
Disability Class: Self-Care Difficulty
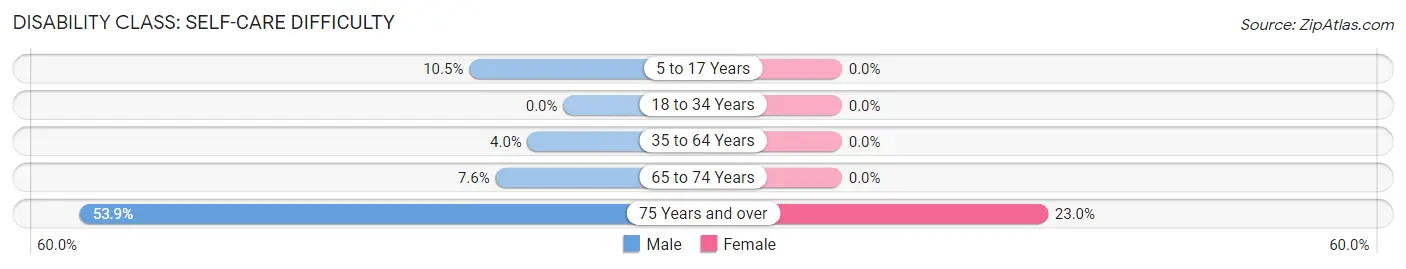
| Age Bracket | Male | Female |
| 5 to 17 Years | 13 (10.5%) | 0 (0.0%) |
| 18 to 34 Years | 0 (0.0%) | 0 (0.0%) |
| 35 to 64 Years | 11 (4.0%) | 0 (0.0%) |
| 65 to 74 Years | 8 (7.5%) | 0 (0.0%) |
| 75 Years and over | 21 (53.8%) | 28 (23.0%) |
Technology Access in Pine Bush
Computing Device Access in Pine Bush
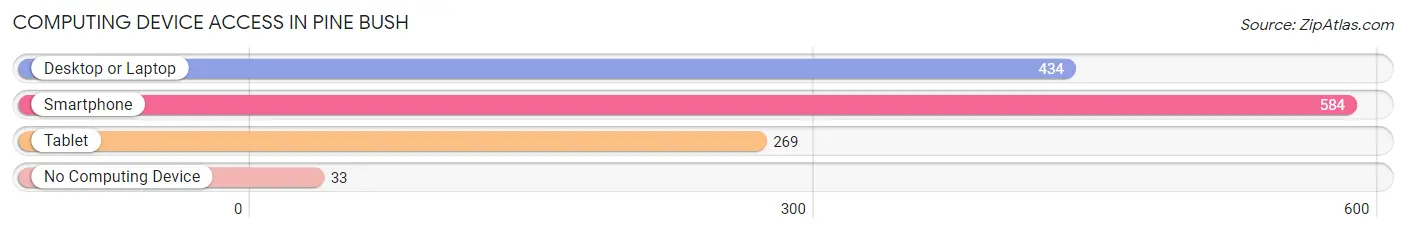
| Device Type | # Households | % Households |
| Desktop or Laptop | 434 | 66.0% |
| Smartphone | 584 | 88.7% |
| Tablet | 269 | 40.9% |
| No Computing Device | 33 | 5.0% |
| Total | 658 | 100.0% |
Internet Access in Pine Bush
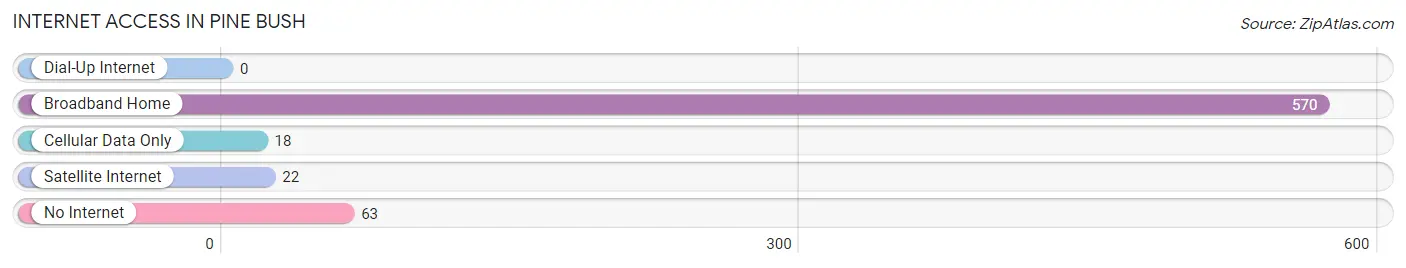
| Internet Type | # Households | % Households |
| Dial-Up Internet | 0 | 0.0% |
| Broadband Home | 570 | 86.6% |
| Cellular Data Only | 18 | 2.7% |
| Satellite Internet | 22 | 3.3% |
| No Internet | 63 | 9.6% |
| Total | 658 | 100.0% |
Pine Bush Summary
Pine Bush is a hamlet located in the Town of Crawford in Orange County, New York. It is situated in the foothills of the Shawangunk Mountains, approximately 70 miles north of New York City. The hamlet is home to a diverse population of approximately 4,000 people, and is known for its rural charm and scenic beauty.
History
The area now known as Pine Bush was originally inhabited by the Munsee-speaking Lenape Native Americans. The first European settlers arrived in the area in the late 1700s, and the hamlet was officially established in 1798. The name “Pine Bush” is derived from the abundance of pine trees in the area.
In the early 1800s, the hamlet was a bustling center of commerce, with several mills, a tannery, and a blacksmith shop. The hamlet was also home to a number of churches, including the Pine Bush Presbyterian Church, which was established in 1809.
In the late 1800s, the hamlet began to decline in population as many of its residents moved away in search of better economic opportunities. However, the hamlet experienced a resurgence in the early 1900s, when it became a popular summer destination for city dwellers looking to escape the heat of the city.
Geography
Pine Bush is located in the foothills of the Shawangunk Mountains, approximately 70 miles north of New York City. The hamlet is situated on the banks of the Wallkill River, and is surrounded by rolling hills and lush forests. The hamlet is home to a number of parks and nature preserves, including the Pine Bush Preserve, which is a popular destination for hikers and nature lovers.
Economy
Pine Bush is a largely residential community, and the majority of its residents are employed in the service sector. The hamlet is home to a number of small businesses, including restaurants, retail stores, and professional services. The hamlet is also home to a number of farms, which produce a variety of fruits and vegetables.
Demographics
As of the 2010 census, the population of Pine Bush was 4,039. The racial makeup of the hamlet was 87.3% White, 5.2% African American, 0.7% Native American, 1.2% Asian, and 4.6% from other races. The median household income was $50,945, and the median age was 41.7 years.
Conclusion
Pine Bush is a charming hamlet located in the foothills of the Shawangunk Mountains in Orange County, New York. The hamlet is home to a diverse population of approximately 4,000 people, and is known for its rural charm and scenic beauty. The hamlet is largely residential, and its economy is largely based on the service sector. The hamlet is also home to a number of small businesses, farms, and parks.
Common Questions
What is Per Capita Income in Pine Bush?
Per Capita income in Pine Bush is $39,341.
What is the Median Family Income in Pine Bush?
Median Family Income in Pine Bush is $92,813.
What is the Median Household income in Pine Bush?
Median Household Income in Pine Bush is $96,429.
What is Income or Wage Gap in Pine Bush?
Income or Wage Gap in Pine Bush is 29.0%.
Women in Pine Bush earn 71.0 cents for every dollar earned by a man.
What is Inequality or Gini Index in Pine Bush?
Inequality or Gini Index in Pine Bush is 0.35.
What is the Total Population of Pine Bush?
Total Population of Pine Bush is 1,659.
What is the Total Male Population of Pine Bush?
Total Male Population of Pine Bush is 642.
What is the Total Female Population of Pine Bush?
Total Female Population of Pine Bush is 1,017.
What is the Ratio of Males per 100 Females in Pine Bush?
There are 63.13 Males per 100 Females in Pine Bush.
What is the Ratio of Females per 100 Males in Pine Bush?
There are 158.41 Females per 100 Males in Pine Bush.
What is the Median Population Age in Pine Bush?
Median Population Age in Pine Bush is 39.9 Years.
What is the Average Family Size in Pine Bush
Average Family Size in Pine Bush is 3.2 People.
What is the Average Household Size in Pine Bush
Average Household Size in Pine Bush is 2.5 People.
How Large is the Labor Force in Pine Bush?
There are 877 People in the Labor Forcein in Pine Bush.
What is the Percentage of People in the Labor Force in Pine Bush?
60.0% of People are in the Labor Force in Pine Bush.
What is the Unemployment Rate in Pine Bush?
Unemployment Rate in Pine Bush is 18.2%.