Smithville Flats, NY Map & Demographics
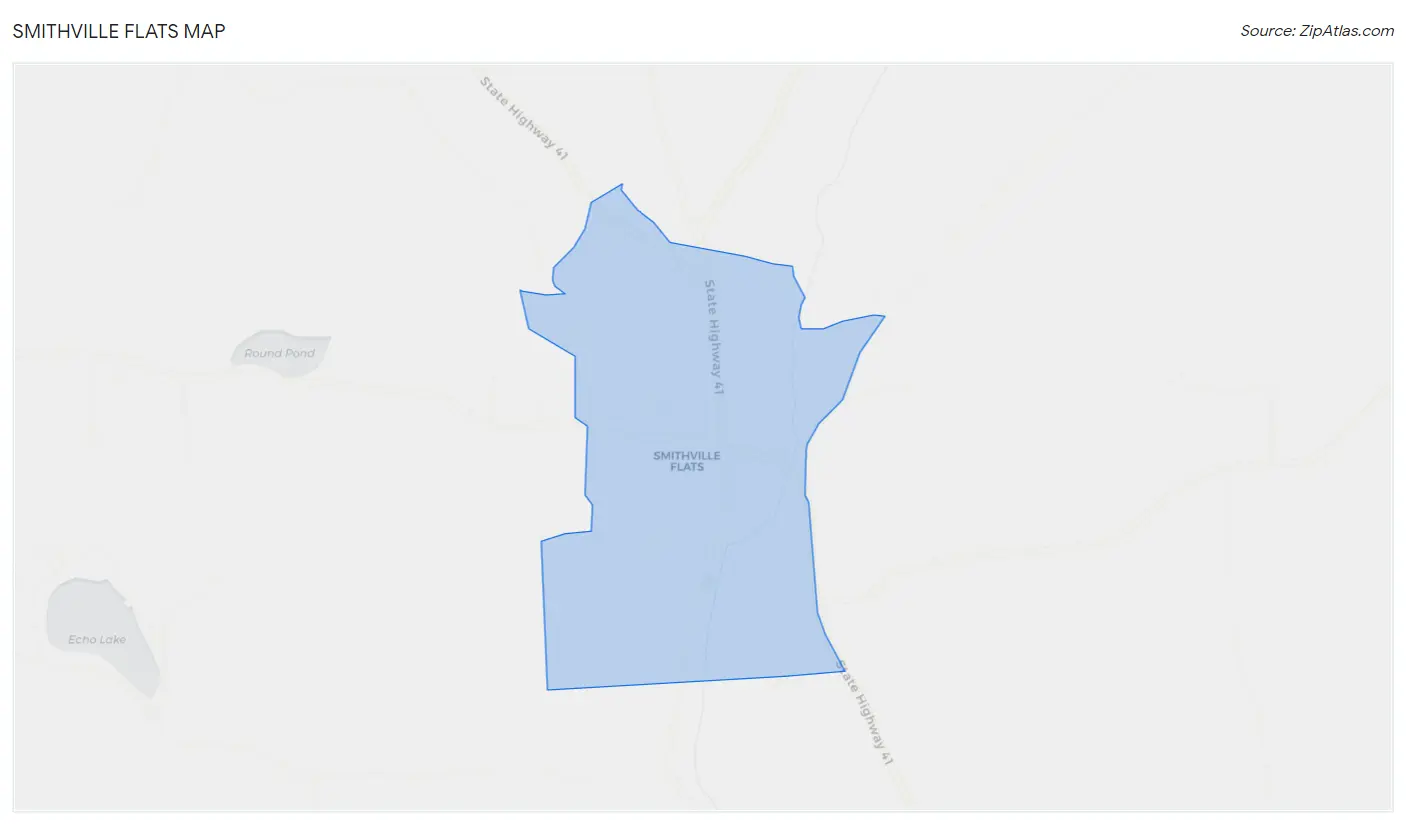
Smithville Flats Map
Smithville Flats Overview
$38,290
PER CAPITA INCOME
$69,063
AVG FAMILY INCOME
$55,938
AVG HOUSEHOLD INCOME
48.7%
WAGE / INCOME GAP [ % ]
51.3¢/ $1
WAGE / INCOME GAP [ $ ]
0.49
INEQUALITY / GINI INDEX
344
TOTAL POPULATION
144
MALE POPULATION
200
FEMALE POPULATION
72.00
MALES / 100 FEMALES
138.89
FEMALES / 100 MALES
38.4
MEDIAN AGE
2.5
AVG FAMILY SIZE
2.1
AVG HOUSEHOLD SIZE
179
LABOR FORCE [ PEOPLE ]
71.0%
PERCENT IN LABOR FORCE
3.9%
UNEMPLOYMENT RATE
Smithville Flats Zip Codes
Smithville Flats Area Codes
Income in Smithville Flats
Income Overview in Smithville Flats
Per Capita Income in Smithville Flats is $38,290, while median incomes of families and households are $69,063 and $55,938 respectively.
| Characteristic | Number | Measure |
| Per Capita Income | 344 | $38,290 |
| Median Family Income | 113 | $69,063 |
| Mean Family Income | 113 | $104,045 |
| Median Household Income | 164 | $55,938 |
| Mean Household Income | 164 | $85,441 |
| Income Deficit | 113 | $0 |
| Wage / Income Gap (%) | 344 | 48.67% |
| Wage / Income Gap ($) | 344 | 51.33¢ per $1 |
| Gini / Inequality Index | 344 | 0.49 |
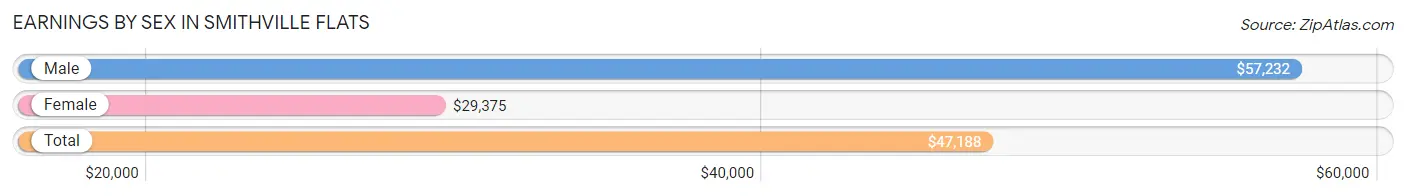
Earnings by Sex in Smithville Flats
Average Earnings in Smithville Flats are $47,188, $57,232 for men and $29,375 for women, a difference of 48.7%.
| Sex | Number | Average Earnings |
| Male | 91 (50.6%) | $57,232 |
| Female | 89 (49.4%) | $29,375 |
| Total | 180 (100.0%) | $47,188 |
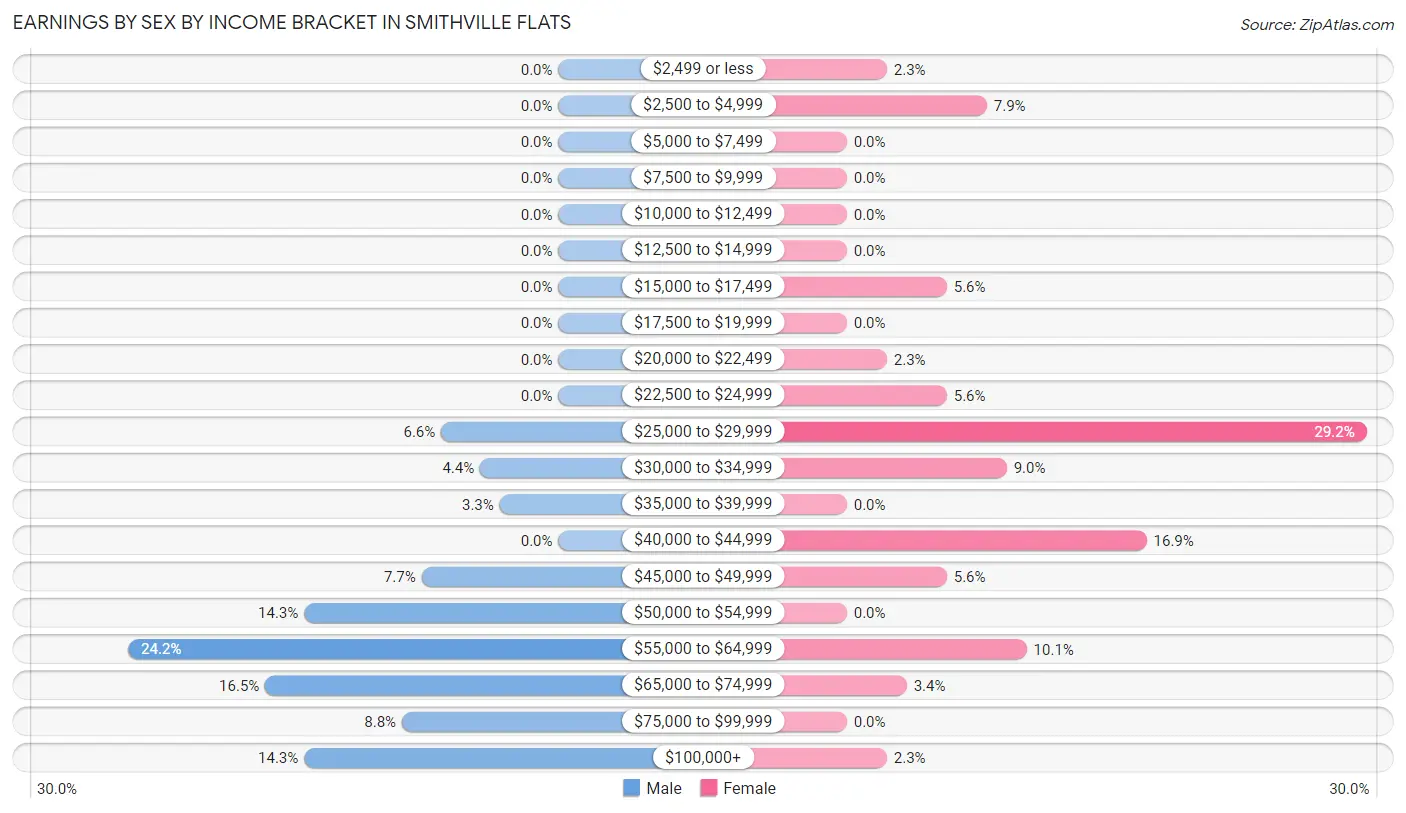
Earnings by Sex by Income Bracket in Smithville Flats
The most common earnings brackets in Smithville Flats are $55,000 to $64,999 for men (22 | 24.2%) and $25,000 to $29,999 for women (26 | 29.2%).
| Income | Male | Female |
| $2,499 or less | 0 (0.0%) | 2 (2.2%) |
| $2,500 to $4,999 | 0 (0.0%) | 7 (7.9%) |
| $5,000 to $7,499 | 0 (0.0%) | 0 (0.0%) |
| $7,500 to $9,999 | 0 (0.0%) | 0 (0.0%) |
| $10,000 to $12,499 | 0 (0.0%) | 0 (0.0%) |
| $12,500 to $14,999 | 0 (0.0%) | 0 (0.0%) |
| $15,000 to $17,499 | 0 (0.0%) | 5 (5.6%) |
| $17,500 to $19,999 | 0 (0.0%) | 0 (0.0%) |
| $20,000 to $22,499 | 0 (0.0%) | 2 (2.2%) |
| $22,500 to $24,999 | 0 (0.0%) | 5 (5.6%) |
| $25,000 to $29,999 | 6 (6.6%) | 26 (29.2%) |
| $30,000 to $34,999 | 4 (4.4%) | 8 (9.0%) |
| $35,000 to $39,999 | 3 (3.3%) | 0 (0.0%) |
| $40,000 to $44,999 | 0 (0.0%) | 15 (16.9%) |
| $45,000 to $49,999 | 7 (7.7%) | 5 (5.6%) |
| $50,000 to $54,999 | 13 (14.3%) | 0 (0.0%) |
| $55,000 to $64,999 | 22 (24.2%) | 9 (10.1%) |
| $65,000 to $74,999 | 15 (16.5%) | 3 (3.4%) |
| $75,000 to $99,999 | 8 (8.8%) | 0 (0.0%) |
| $100,000+ | 13 (14.3%) | 2 (2.2%) |
| Total | 91 (100.0%) | 89 (100.0%) |
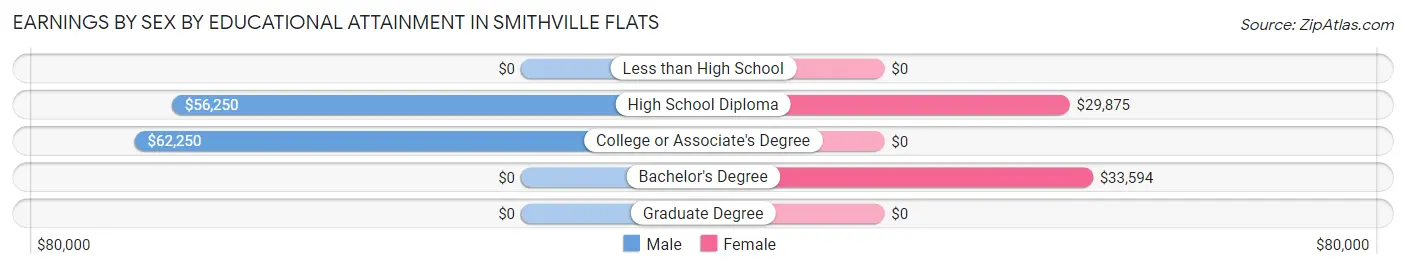
Earnings by Sex by Educational Attainment in Smithville Flats
Average earnings in Smithville Flats are $60,750 for men and $34,531 for women, a difference of 43.2%. Men with an educational attainment of college or associate's degree enjoy the highest average annual earnings of $62,250, while those with high school diploma education earn the least with $56,250. Women with an educational attainment of bachelor's degree earn the most with the average annual earnings of $33,594, while those with high school diploma education have the smallest earnings of $29,875.
| Educational Attainment | Male Income | Female Income |
| Less than High School | - | - |
| High School Diploma | $56,250 | $29,875 |
| College or Associate's Degree | $62,250 | $0 |
| Bachelor's Degree | - | - |
| Graduate Degree | - | - |
| Total | $60,750 | $34,531 |
Family Income in Smithville Flats
Family Income Brackets in Smithville Flats
According to the Smithville Flats family income data, there are 31 families falling into the $50,000 to $74,999 income range, which is the most common income bracket and makes up 27.4% of all families.
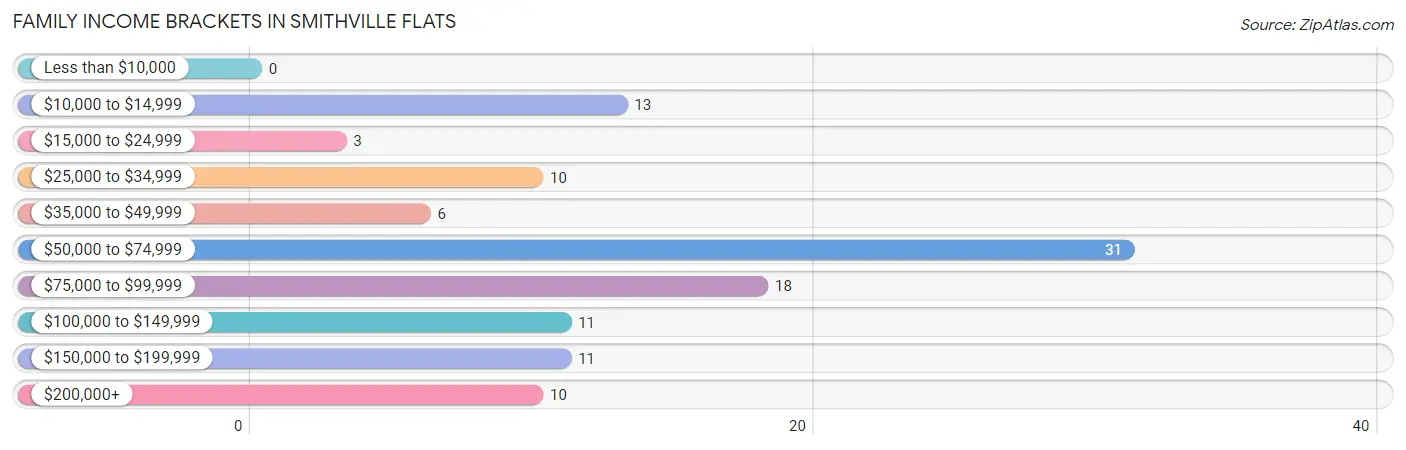
| Income Bracket | # Families | % Families |
| Less than $10,000 | 0 | 0.0% |
| $10,000 to $14,999 | 13 | 11.5% |
| $15,000 to $24,999 | 3 | 2.7% |
| $25,000 to $34,999 | 10 | 8.8% |
| $35,000 to $49,999 | 6 | 5.3% |
| $50,000 to $74,999 | 31 | 27.4% |
| $75,000 to $99,999 | 18 | 15.9% |
| $100,000 to $149,999 | 11 | 9.7% |
| $150,000 to $199,999 | 11 | 9.7% |
| $200,000+ | 10 | 8.8% |
Family Income by Famaliy Size in Smithville Flats
3-person families (31 | 27.4%) account for the highest median family income in Smithville Flats with $93,125 per family, while 2-person families (49 | 43.4%) have the highest median income of $31,875 per family member.
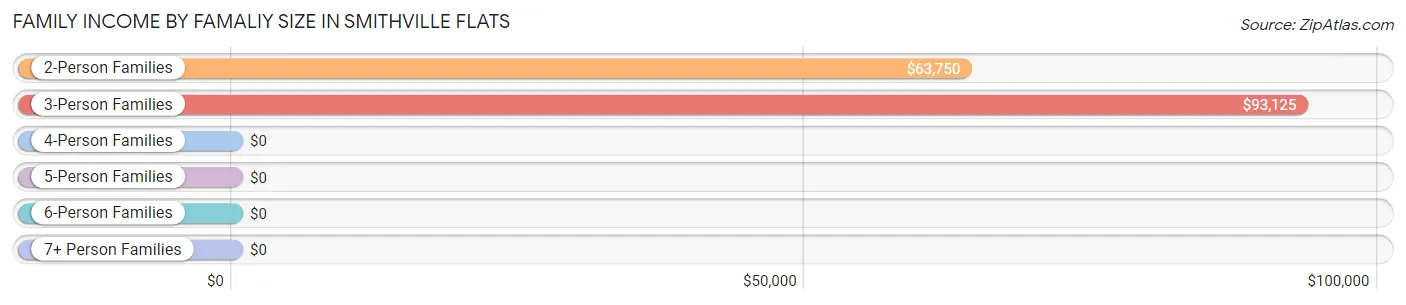
| Income Bracket | # Families | Median Income |
| 2-Person Families | 49 (43.4%) | $63,750 |
| 3-Person Families | 31 (27.4%) | $93,125 |
| 4-Person Families | 6 (5.3%) | $0 |
| 5-Person Families | 27 (23.9%) | $0 |
| 6-Person Families | 0 (0.0%) | $0 |
| 7+ Person Families | 0 (0.0%) | $0 |
| Total | 113 (100.0%) | $69,063 |
Family Income by Number of Earners in Smithville Flats
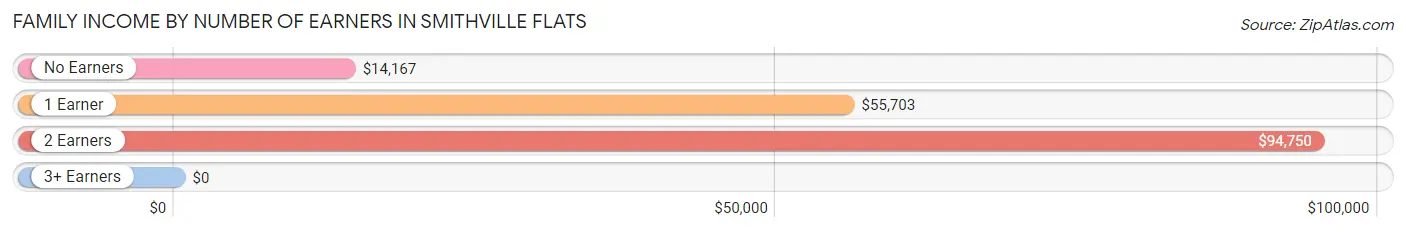
| Number of Earners | # Families | Median Income |
| No Earners | 24 (21.2%) | $14,167 |
| 1 Earner | 37 (32.7%) | $55,703 |
| 2 Earners | 44 (38.9%) | $94,750 |
| 3+ Earners | 8 (7.1%) | $0 |
| Total | 113 (100.0%) | $69,063 |
Household Income in Smithville Flats
Household Income Brackets in Smithville Flats
With 46 households falling in the category, the $50,000 to $74,999 income range is the most frequent in Smithville Flats, accounting for 28.1% of all households. In contrast, only 3 households (1.8%) fall into the less than $10,000 income bracket, making it the least populous group.
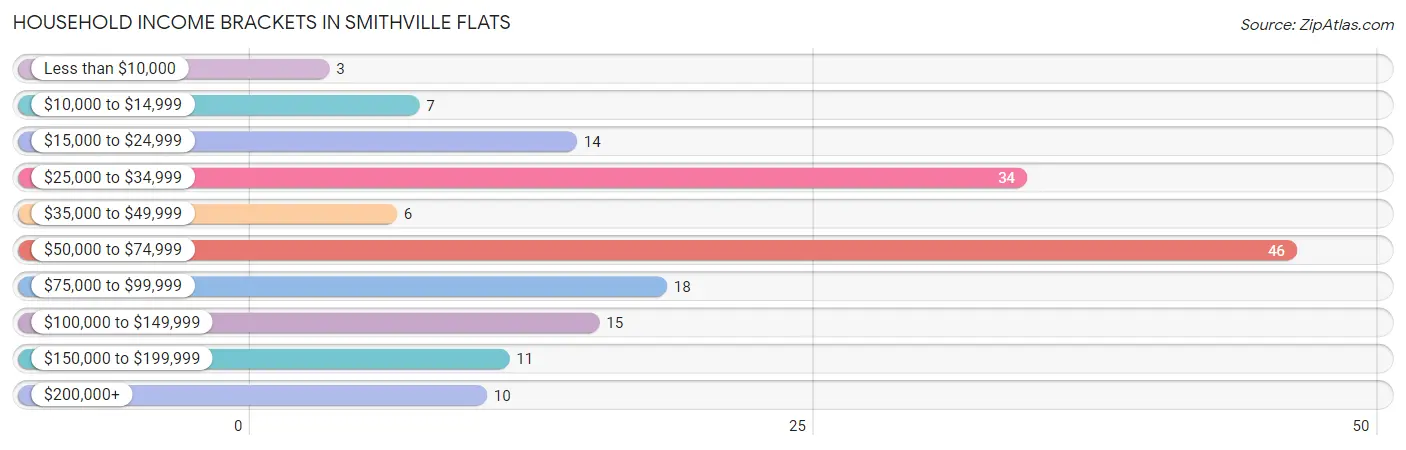
| Income Bracket | # Households | % Households |
| Less than $10,000 | 3 | 1.8% |
| $10,000 to $14,999 | 7 | 4.3% |
| $15,000 to $24,999 | 14 | 8.5% |
| $25,000 to $34,999 | 34 | 20.7% |
| $35,000 to $49,999 | 6 | 3.7% |
| $50,000 to $74,999 | 46 | 28.0% |
| $75,000 to $99,999 | 18 | 11.0% |
| $100,000 to $149,999 | 15 | 9.1% |
| $150,000 to $199,999 | 11 | 6.7% |
| $200,000+ | 10 | 6.1% |
Household Income by Householder Age in Smithville Flats
The median household income in Smithville Flats is $55,938, with the highest median household income of $63,333 found in the 45 to 64 years age bracket for the primary householder. A total of 60 households (36.6%) fall into this category. Meanwhile, the 15 to 24 years age bracket for the primary householder has the lowest median household income of $0, with 18 households (11.0%) in this group.

| Income Bracket | # Households | Median Income |
| 15 to 24 Years | 18 (11.0%) | $0 |
| 25 to 44 Years | 62 (37.8%) | $56,719 |
| 45 to 64 Years | 60 (36.6%) | $63,333 |
| 65+ Years | 24 (14.6%) | $0 |
| Total | 164 (100.0%) | $55,938 |
Poverty in Smithville Flats
Income Below Poverty by Sex and Age in Smithville Flats
With 12.5% poverty level for males and 11.5% for females among the residents of Smithville Flats, 5 year old males and 12 to 14 year old females are the most vulnerable to poverty, with 2 males (100.0%) and 6 females (66.7%) in their respective age groups living below the poverty level.
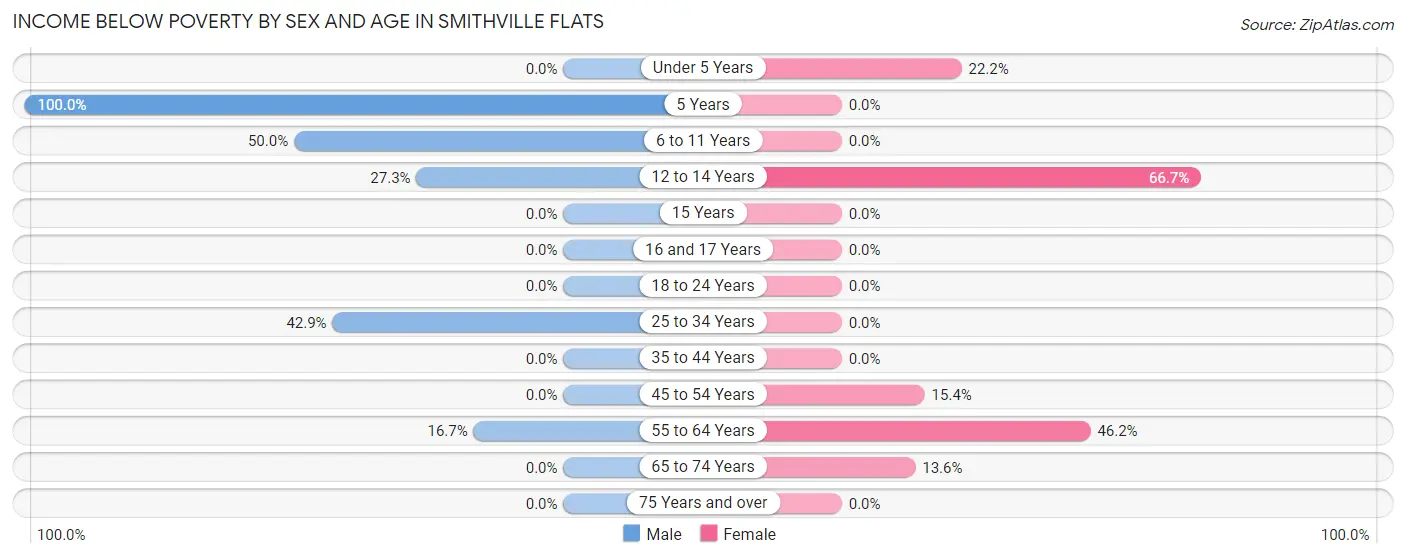
| Age Bracket | Male | Female |
| Under 5 Years | 0 (0.0%) | 4 (22.2%) |
| 5 Years | 2 (100.0%) | 0 (0.0%) |
| 6 to 11 Years | 4 (50.0%) | 0 (0.0%) |
| 12 to 14 Years | 3 (27.3%) | 6 (66.7%) |
| 15 Years | 0 (0.0%) | 0 (0.0%) |
| 16 and 17 Years | 0 (0.0%) | 0 (0.0%) |
| 18 to 24 Years | 0 (0.0%) | 0 (0.0%) |
| 25 to 34 Years | 6 (42.9%) | 0 (0.0%) |
| 35 to 44 Years | 0 (0.0%) | 0 (0.0%) |
| 45 to 54 Years | 0 (0.0%) | 4 (15.4%) |
| 55 to 64 Years | 3 (16.7%) | 6 (46.2%) |
| 65 to 74 Years | 0 (0.0%) | 3 (13.6%) |
| 75 Years and over | 0 (0.0%) | 0 (0.0%) |
| Total | 18 (12.5%) | 23 (11.5%) |
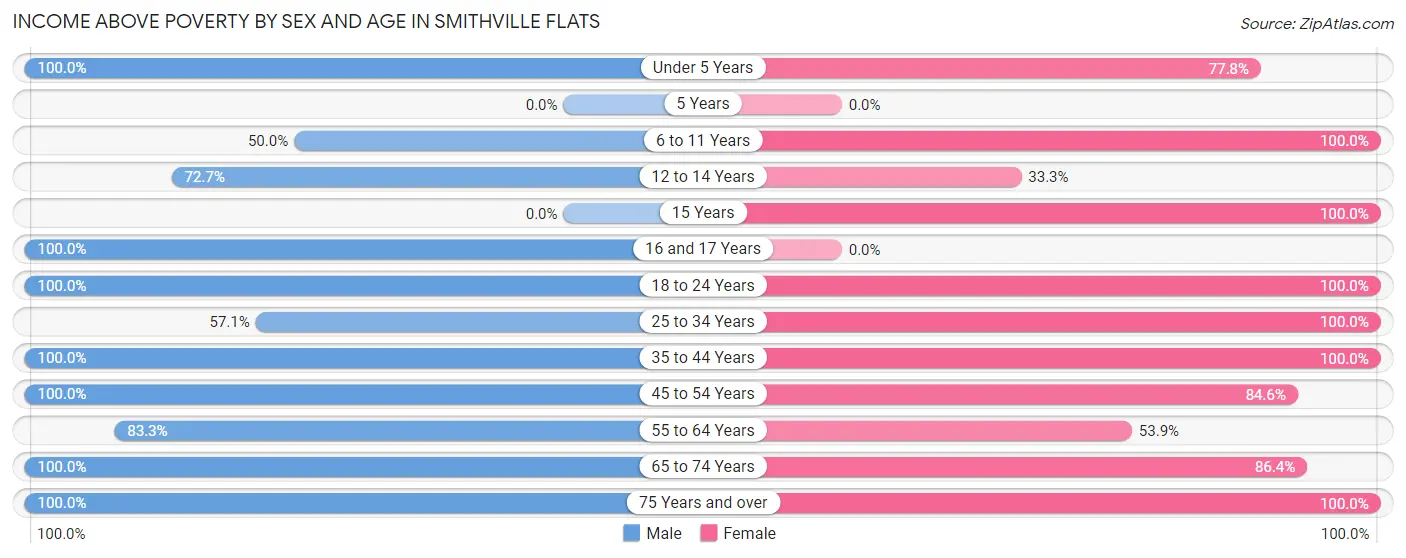
Income Above Poverty by Sex and Age in Smithville Flats
According to the poverty statistics in Smithville Flats, males aged under 5 years and females aged 6 to 11 years are the age groups that are most secure financially, with 100.0% of males and 100.0% of females in these age groups living above the poverty line.
| Age Bracket | Male | Female |
| Under 5 Years | 10 (100.0%) | 14 (77.8%) |
| 5 Years | 0 (0.0%) | 0 (0.0%) |
| 6 to 11 Years | 4 (50.0%) | 27 (100.0%) |
| 12 to 14 Years | 8 (72.7%) | 3 (33.3%) |
| 15 Years | 0 (0.0%) | 7 (100.0%) |
| 16 and 17 Years | 3 (100.0%) | 0 (0.0%) |
| 18 to 24 Years | 6 (100.0%) | 18 (100.0%) |
| 25 to 34 Years | 8 (57.1%) | 17 (100.0%) |
| 35 to 44 Years | 38 (100.0%) | 39 (100.0%) |
| 45 to 54 Years | 19 (100.0%) | 22 (84.6%) |
| 55 to 64 Years | 15 (83.3%) | 7 (53.8%) |
| 65 to 74 Years | 10 (100.0%) | 19 (86.4%) |
| 75 Years and over | 5 (100.0%) | 4 (100.0%) |
| Total | 126 (87.5%) | 177 (88.5%) |
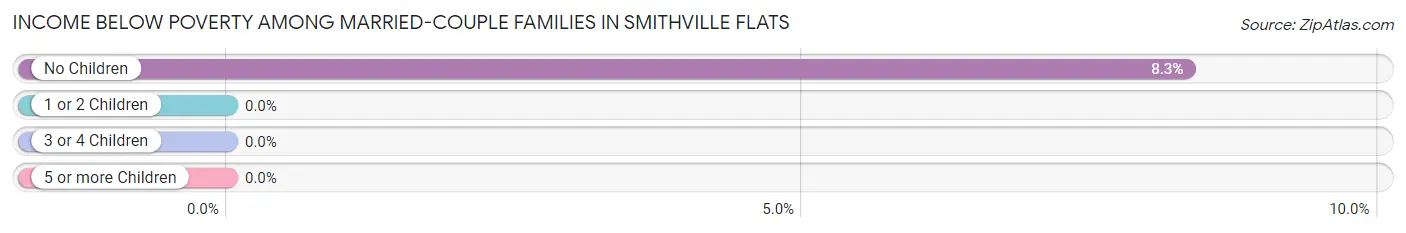
Income Below Poverty Among Married-Couple Families in Smithville Flats
The poverty statistics for married-couple families in Smithville Flats show that 4.0% or 3 of the total 76 families live below the poverty line. Families with no children have the highest poverty rate of 8.3%, comprising of 3 families. On the other hand, families with 1 or 2 children have the lowest poverty rate of 0.0%, which includes 0 families.
| Children | Above Poverty | Below Poverty |
| No Children | 33 (91.7%) | 3 (8.3%) |
| 1 or 2 Children | 13 (100.0%) | 0 (0.0%) |
| 3 or 4 Children | 27 (100.0%) | 0 (0.0%) |
| 5 or more Children | 0 (0.0%) | 0 (0.0%) |
| Total | 73 (96.1%) | 3 (4.0%) |
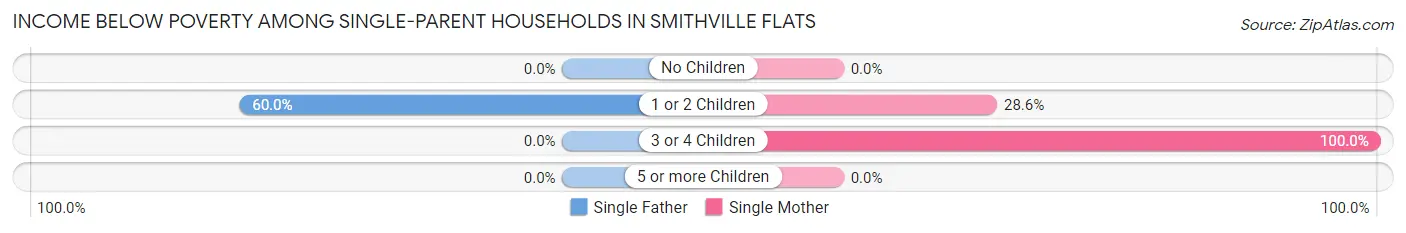
Income Below Poverty Among Single-Parent Households in Smithville Flats
According to the poverty data in Smithville Flats, 40.0% or 6 single-father households and 31.8% or 7 single-mother households are living below the poverty line. Among single-father households, those with 1 or 2 children have the highest poverty rate, with 6 households (60.0%) experiencing poverty. Likewise, among single-mother households, those with 3 or 4 children have the highest poverty rate, with 3 households (100.0%) falling below the poverty line.
| Children | Single Father | Single Mother |
| No Children | 0 (0.0%) | 0 (0.0%) |
| 1 or 2 Children | 6 (60.0%) | 4 (28.6%) |
| 3 or 4 Children | 0 (0.0%) | 3 (100.0%) |
| 5 or more Children | 0 (0.0%) | 0 (0.0%) |
| Total | 6 (40.0%) | 7 (31.8%) |
Income Below Poverty Among Married-Couple vs Single-Parent Households in Smithville Flats
The poverty data for Smithville Flats shows that 3 of the married-couple family households (4.0%) and 13 of the single-parent households (35.1%) are living below the poverty level. Within the married-couple family households, those with no children have the highest poverty rate, with 3 households (8.3%) falling below the poverty line. Among the single-parent households, those with 3 or 4 children have the highest poverty rate, with 3 household (100.0%) living below poverty.
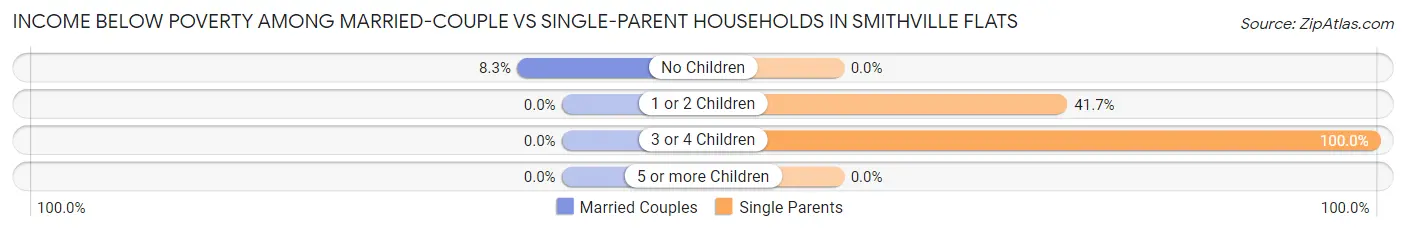
| Children | Married-Couple Families | Single-Parent Households |
| No Children | 3 (8.3%) | 0 (0.0%) |
| 1 or 2 Children | 0 (0.0%) | 10 (41.7%) |
| 3 or 4 Children | 0 (0.0%) | 3 (100.0%) |
| 5 or more Children | 0 (0.0%) | 0 (0.0%) |
| Total | 3 (4.0%) | 13 (35.1%) |
Race in Smithville Flats
The most populous races in Smithville Flats are White / Caucasian (302 | 87.8%), Two or more Races (18 | 5.2%), and Asian (16 | 4.6%).
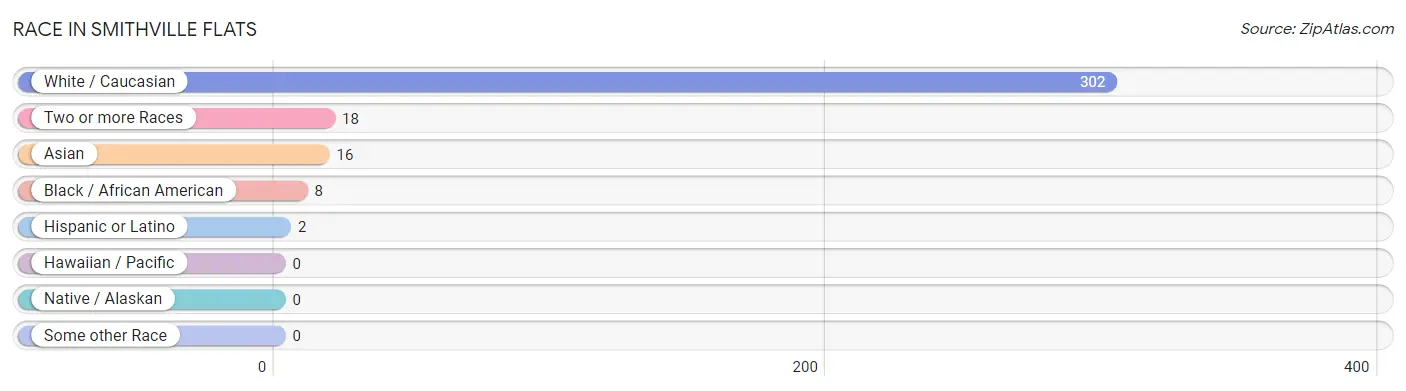
| Race | # Population | % Population |
| Asian | 16 | 4.6% |
| Black / African American | 8 | 2.3% |
| Hawaiian / Pacific | 0 | 0.0% |
| Hispanic or Latino | 2 | 0.6% |
| Native / Alaskan | 0 | 0.0% |
| White / Caucasian | 302 | 87.8% |
| Two or more Races | 18 | 5.2% |
| Some other Race | 0 | 0.0% |
| Total | 344 | 100.0% |
Ancestry in Smithville Flats
The most populous ancestries reported in Smithville Flats are Irish (90 | 26.2%), American (46 | 13.4%), Welsh (41 | 11.9%), Vietnamese (32 | 9.3%), and English (26 | 7.6%), together accounting for 68.3% of all Smithville Flats residents.
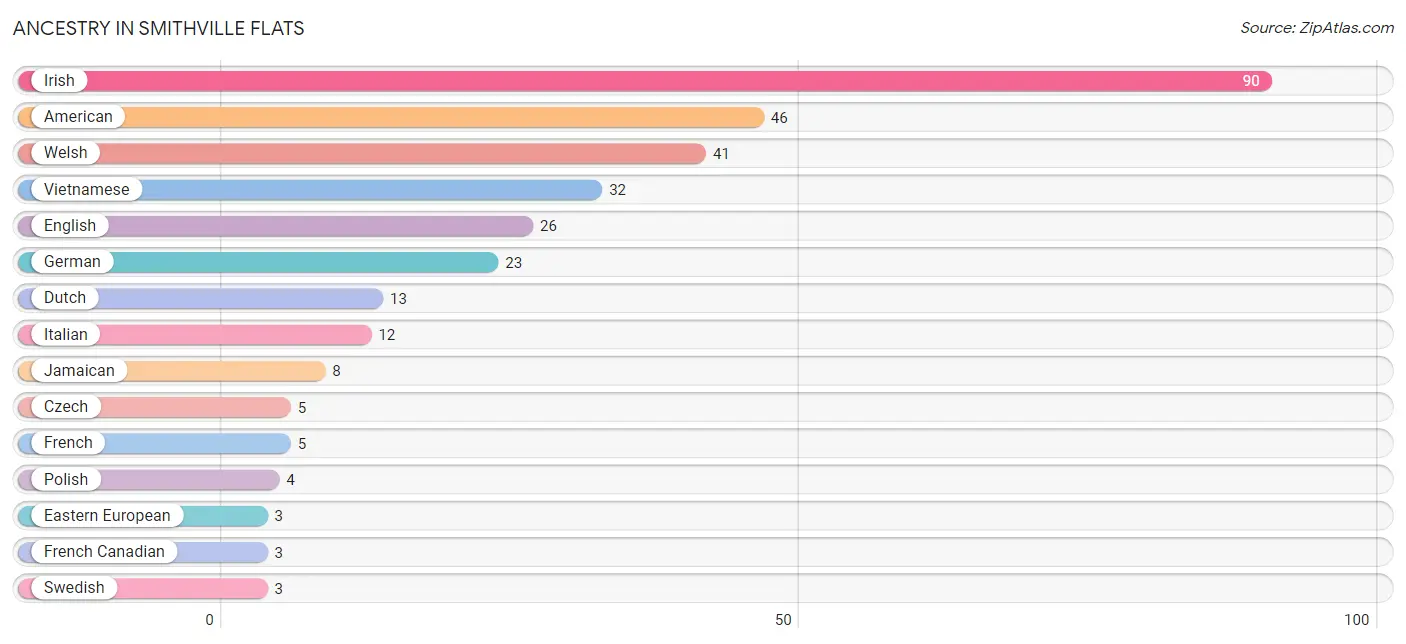
| Ancestry | # Population | % Population |
| American | 46 | 13.4% |
| Czech | 5 | 1.5% |
| Dutch | 13 | 3.8% |
| Eastern European | 3 | 0.9% |
| English | 26 | 7.6% |
| French | 5 | 1.5% |
| French Canadian | 3 | 0.9% |
| German | 23 | 6.7% |
| Irish | 90 | 26.2% |
| Italian | 12 | 3.5% |
| Jamaican | 8 | 2.3% |
| Polish | 4 | 1.2% |
| Puerto Rican | 2 | 0.6% |
| Swedish | 3 | 0.9% |
| Vietnamese | 32 | 9.3% |
| Welsh | 41 | 11.9% | View All 16 Rows |
Immigrants in Smithville Flats

| Immigration Origin | # Population | % Population | View All 0 Rows |
Sex and Age in Smithville Flats
Sex and Age in Smithville Flats
The most populous age groups in Smithville Flats are 35 to 39 Years (25 | 17.4%) for men and 35 to 39 Years (28 | 14.0%) for women.
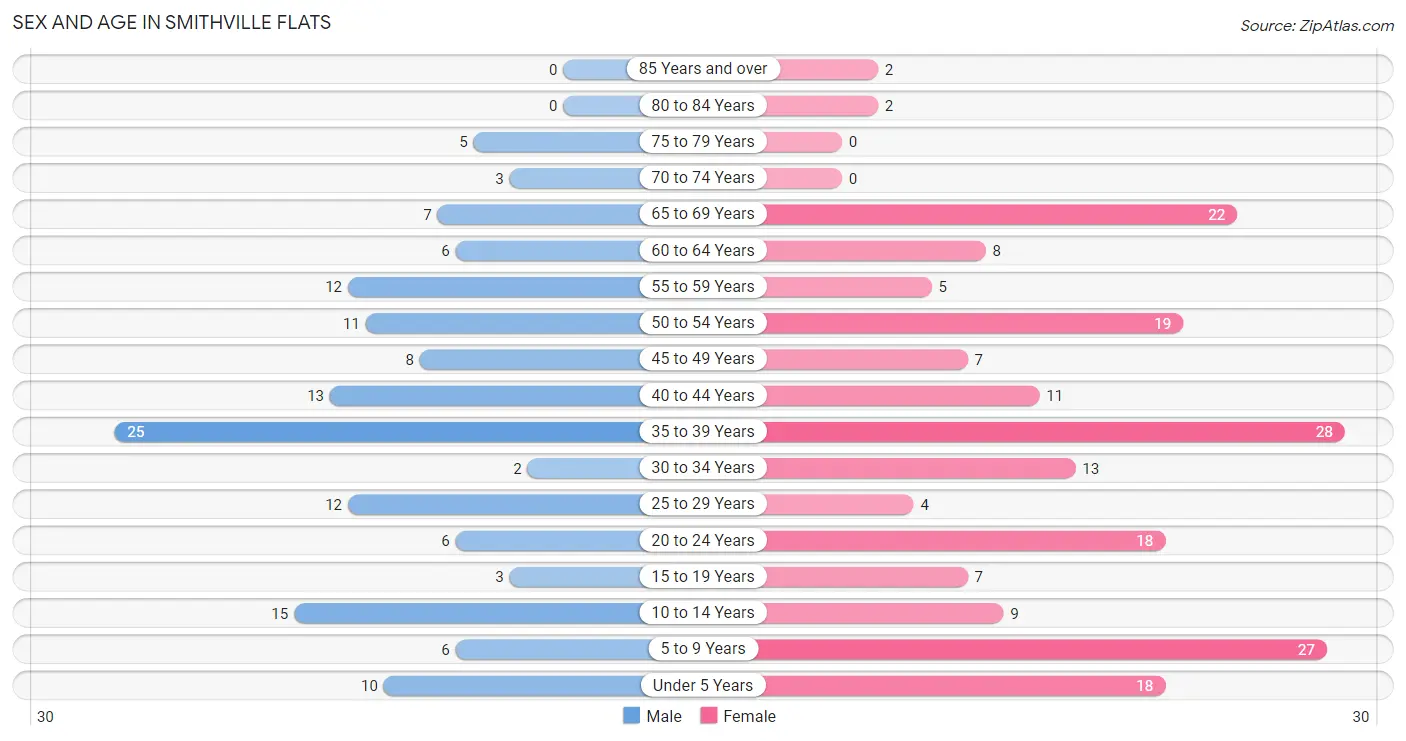
| Age Bracket | Male | Female |
| Under 5 Years | 10 (6.9%) | 18 (9.0%) |
| 5 to 9 Years | 6 (4.2%) | 27 (13.5%) |
| 10 to 14 Years | 15 (10.4%) | 9 (4.5%) |
| 15 to 19 Years | 3 (2.1%) | 7 (3.5%) |
| 20 to 24 Years | 6 (4.2%) | 18 (9.0%) |
| 25 to 29 Years | 12 (8.3%) | 4 (2.0%) |
| 30 to 34 Years | 2 (1.4%) | 13 (6.5%) |
| 35 to 39 Years | 25 (17.4%) | 28 (14.0%) |
| 40 to 44 Years | 13 (9.0%) | 11 (5.5%) |
| 45 to 49 Years | 8 (5.6%) | 7 (3.5%) |
| 50 to 54 Years | 11 (7.6%) | 19 (9.5%) |
| 55 to 59 Years | 12 (8.3%) | 5 (2.5%) |
| 60 to 64 Years | 6 (4.2%) | 8 (4.0%) |
| 65 to 69 Years | 7 (4.9%) | 22 (11.0%) |
| 70 to 74 Years | 3 (2.1%) | 0 (0.0%) |
| 75 to 79 Years | 5 (3.5%) | 0 (0.0%) |
| 80 to 84 Years | 0 (0.0%) | 2 (1.0%) |
| 85 Years and over | 0 (0.0%) | 2 (1.0%) |
| Total | 144 (100.0%) | 200 (100.0%) |
Families and Households in Smithville Flats
Median Family Size in Smithville Flats
The median family size in Smithville Flats is 2.54 persons per family, with married-couple families (76 | 67.3%) accounting for the largest median family size of 2.7 persons per family. On the other hand, single female/mother families (22 | 19.5%) represent the smallest median family size with 2.18 persons per family.
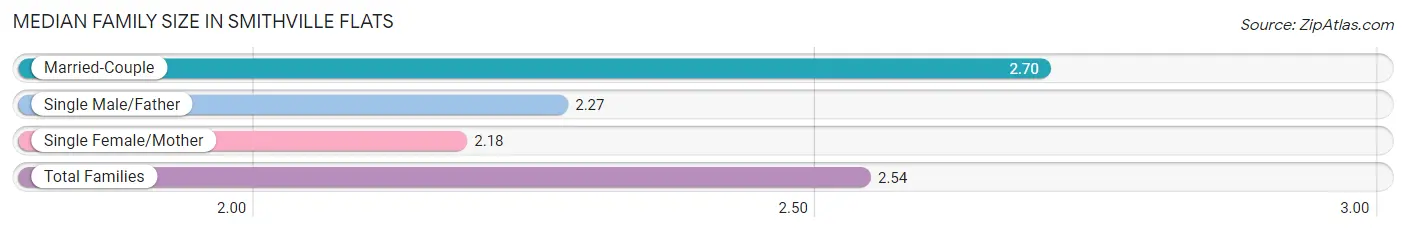
| Family Type | # Families | Family Size |
| Married-Couple | 76 (67.3%) | 2.70 |
| Single Male/Father | 15 (13.3%) | 2.27 |
| Single Female/Mother | 22 (19.5%) | 2.18 |
| Total Families | 113 (100.0%) | 2.54 |
Median Household Size in Smithville Flats
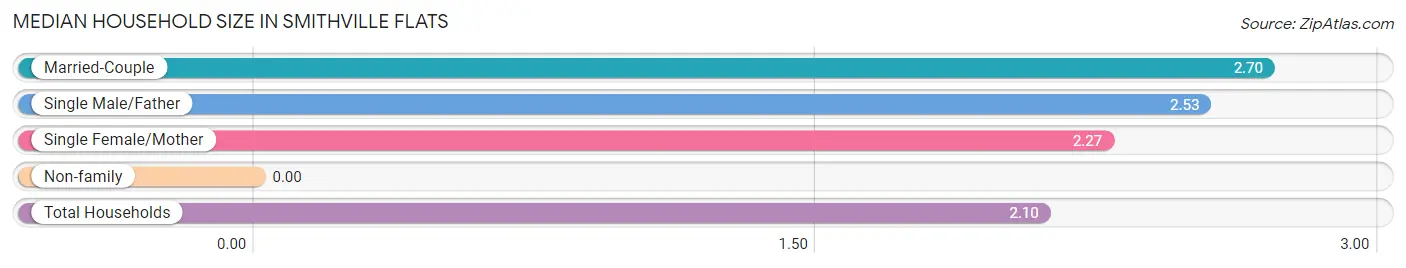
| Household Type | # Households | Household Size |
| Married-Couple | 76 (46.3%) | 2.70 |
| Single Male/Father | 15 (9.1%) | 2.53 |
| Single Female/Mother | 22 (13.4%) | 2.27 |
| Non-family | 51 (31.1%) | - |
| Total Households | 164 (100.0%) | 2.10 |
Household Size by Marriage Status in Smithville Flats
Out of a total of 164 households in Smithville Flats, 113 (68.9%) are family households, while 51 (31.1%) are nonfamily households. The most numerous type of family households are 2-person households, comprising 47, and the most common type of nonfamily households are 1-person households, comprising 51.
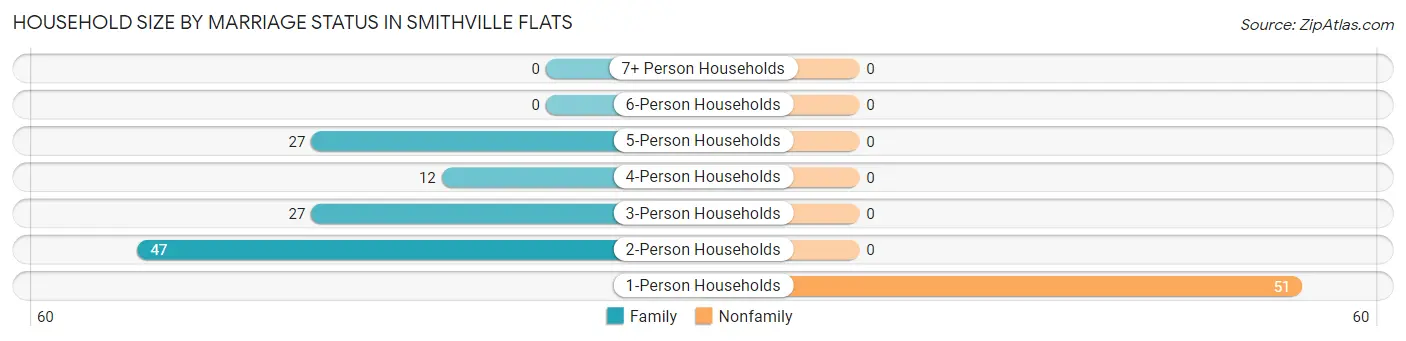
| Household Size | Family Households | Nonfamily Households |
| 1-Person Households | - | 51 (31.1%) |
| 2-Person Households | 47 (28.7%) | 0 (0.0%) |
| 3-Person Households | 27 (16.5%) | 0 (0.0%) |
| 4-Person Households | 12 (7.3%) | 0 (0.0%) |
| 5-Person Households | 27 (16.5%) | 0 (0.0%) |
| 6-Person Households | 0 (0.0%) | 0 (0.0%) |
| 7+ Person Households | 0 (0.0%) | 0 (0.0%) |
| Total | 113 (68.9%) | 51 (31.1%) |
Female Fertility in Smithville Flats
Fertility by Age in Smithville Flats
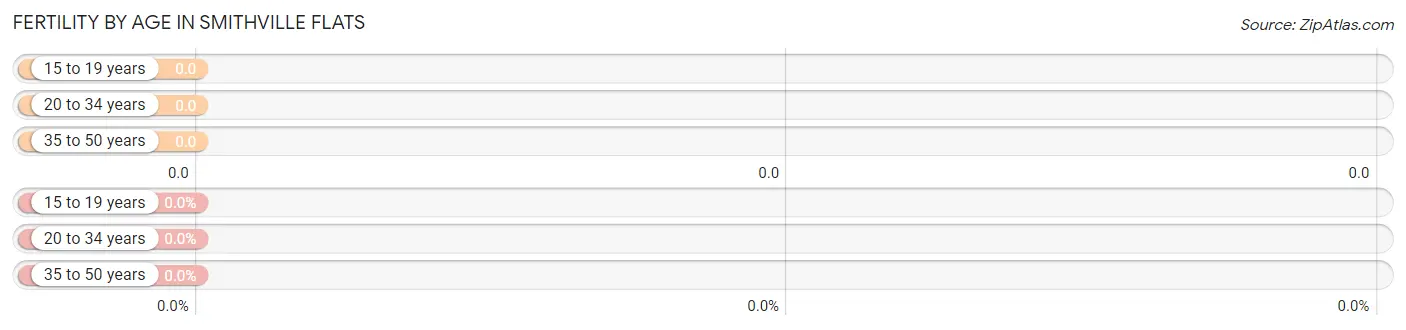
| Age Bracket | Women with Births | Births / 1,000 Women |
| 15 to 19 years | 0 (0.0%) | 0.0 |
| 20 to 34 years | 0 (0.0%) | 0.0 |
| 35 to 50 years | 0 (0.0%) | 0.0 |
| Total | 0 (0.0%) | 0.0 |
Fertility by Age by Marriage Status in Smithville Flats
| Age Bracket | Married | Unmarried |
| 15 to 19 years | 0 (0.0%) | 0 (0.0%) |
| 20 to 34 years | 0 (0.0%) | 0 (0.0%) |
| 35 to 50 years | 0 (0.0%) | 0 (0.0%) |
| Total | 0 (0.0%) | 0 (0.0%) |
Fertility by Education in Smithville Flats
| Educational Attainment | Women with Births | Births / 1,000 Women |
| Less than High School | 0 (0.0%) | 0.0 |
| High School Diploma | 0 (0.0%) | 0.0 |
| College or Associate's Degree | 0 (0.0%) | 0.0 |
| Bachelor's Degree | 0 (0.0%) | 0.0 |
| Graduate Degree | 0 (0.0%) | 0.0 |
| Total | 0 (0.0%) | 0.0 |
Fertility by Education by Marriage Status in Smithville Flats
| Educational Attainment | Married | Unmarried |
| Less than High School | 0 (0.0%) | 0 (0.0%) |
| High School Diploma | 0 (0.0%) | 0 (0.0%) |
| College or Associate's Degree | 0 (0.0%) | 0 (0.0%) |
| Bachelor's Degree | 0 (0.0%) | 0 (0.0%) |
| Graduate Degree | 0 (0.0%) | 0 (0.0%) |
| Total | 0 (0.0%) | 0 (0.0%) |
Employment Characteristics in Smithville Flats
Employment by Class of Employer in Smithville Flats
Among the 168 employed individuals in Smithville Flats, private company employees (105 | 62.5%), self-employed (not incorporated) (28 | 16.7%), and state government employees (20 | 11.9%) make up the most common classes of employment.
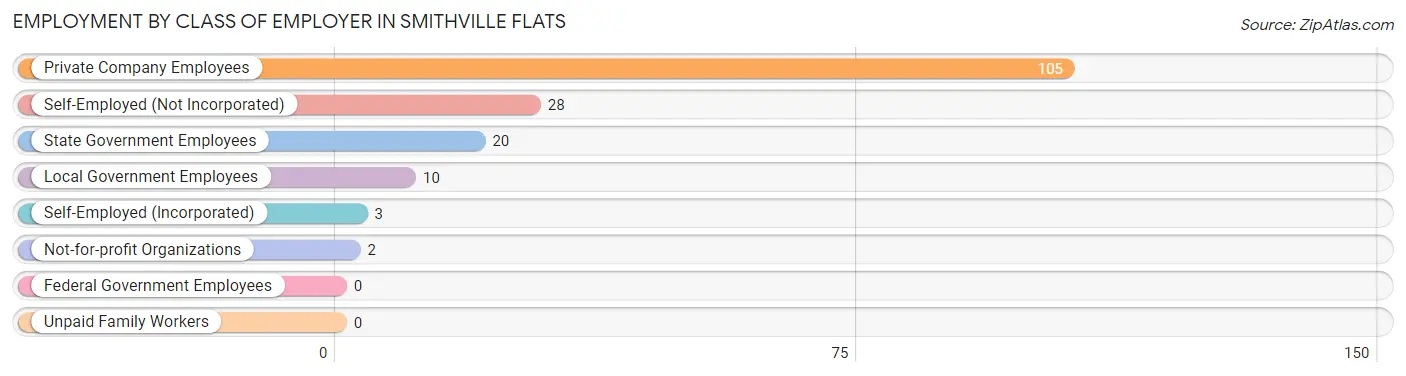
| Employer Class | # Employees | % Employees |
| Private Company Employees | 105 | 62.5% |
| Self-Employed (Incorporated) | 3 | 1.8% |
| Self-Employed (Not Incorporated) | 28 | 16.7% |
| Not-for-profit Organizations | 2 | 1.2% |
| Local Government Employees | 10 | 5.9% |
| State Government Employees | 20 | 11.9% |
| Federal Government Employees | 0 | 0.0% |
| Unpaid Family Workers | 0 | 0.0% |
| Total | 168 | 100.0% |
Employment Status by Age in Smithville Flats
According to the labor force statistics for Smithville Flats, out of the total population over 16 years of age (252), 71.0% or 179 individuals are in the labor force, with 3.9% or 7 of them unemployed. The age group with the highest labor force participation rate is 20 to 24 years, with 100.0% or 24 individuals in the labor force. Within the labor force, the 60 to 64 years age range has the highest percentage of unemployed individuals, with 37.5% or 3 of them being unemployed.
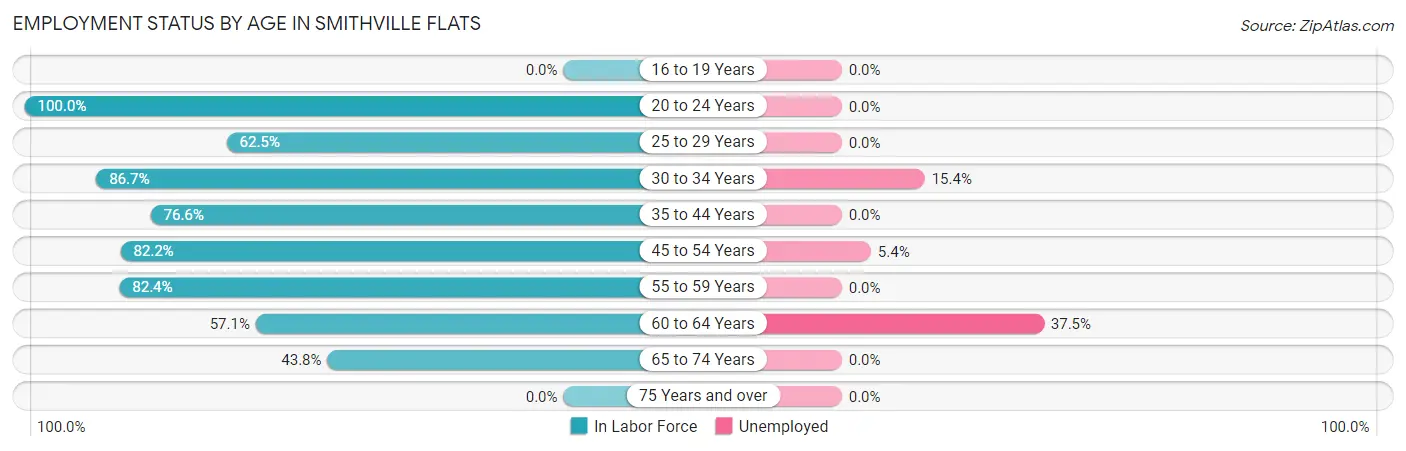
| Age Bracket | In Labor Force | Unemployed |
| 16 to 19 Years | 0 (0.0%) | 0 (0.0%) |
| 20 to 24 Years | 24 (100.0%) | 0 (0.0%) |
| 25 to 29 Years | 10 (62.5%) | 0 (0.0%) |
| 30 to 34 Years | 13 (86.7%) | 2 (15.4%) |
| 35 to 44 Years | 59 (76.6%) | 0 (0.0%) |
| 45 to 54 Years | 37 (82.2%) | 2 (5.4%) |
| 55 to 59 Years | 14 (82.4%) | 0 (0.0%) |
| 60 to 64 Years | 8 (57.1%) | 3 (37.5%) |
| 65 to 74 Years | 14 (43.8%) | 0 (0.0%) |
| 75 Years and over | 0 (0.0%) | 0 (0.0%) |
| Total | 179 (71.0%) | 7 (3.9%) |
Employment Status by Educational Attainment in Smithville Flats
According to labor force statistics for Smithville Flats, 76.6% of individuals (141) out of the total population between 25 and 64 years of age (184) are in the labor force, with 5.0% or 7 of them being unemployed. The group with the highest labor force participation rate are those with the educational attainment of high school diploma, with 92.8% or 77 individuals in the labor force. Within the labor force, individuals with college / associate degree education have the highest percentage of unemployment, with 11.8% or 2 of them being unemployed.
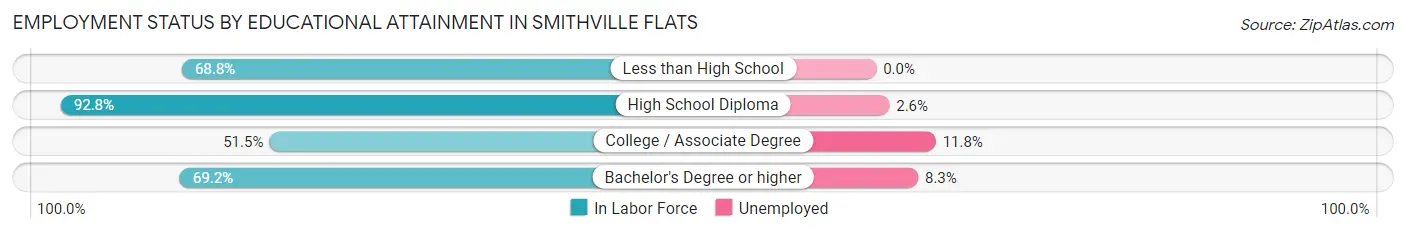
| Educational Attainment | In Labor Force | Unemployed |
| Less than High School | 11 (68.8%) | 0 (0.0%) |
| High School Diploma | 77 (92.8%) | 2 (2.6%) |
| College / Associate Degree | 17 (51.5%) | 4 (11.8%) |
| Bachelor's Degree or higher | 36 (69.2%) | 4 (8.3%) |
| Total | 141 (76.6%) | 9 (5.0%) |
Employment Occupations by Sex in Smithville Flats
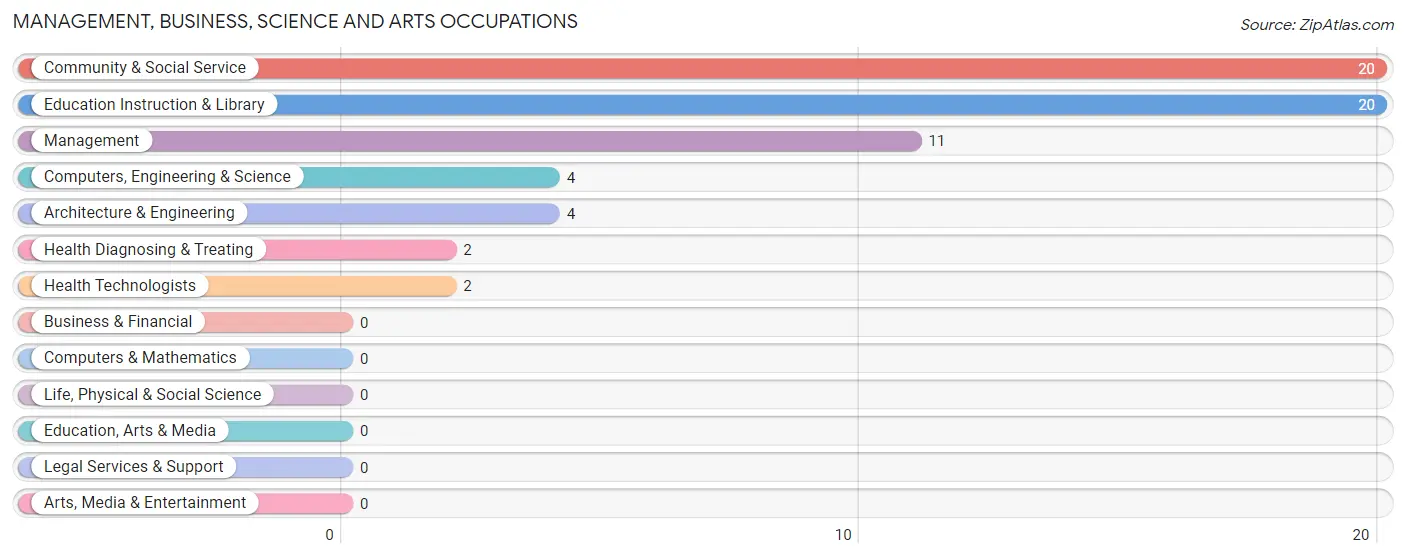
Management, Business, Science and Arts Occupations
The most common Management, Business, Science and Arts occupations in Smithville Flats are Community & Social Service (20 | 11.6%), Education Instruction & Library (20 | 11.6%), Management (11 | 6.4%), Computers, Engineering & Science (4 | 2.3%), and Architecture & Engineering (4 | 2.3%).
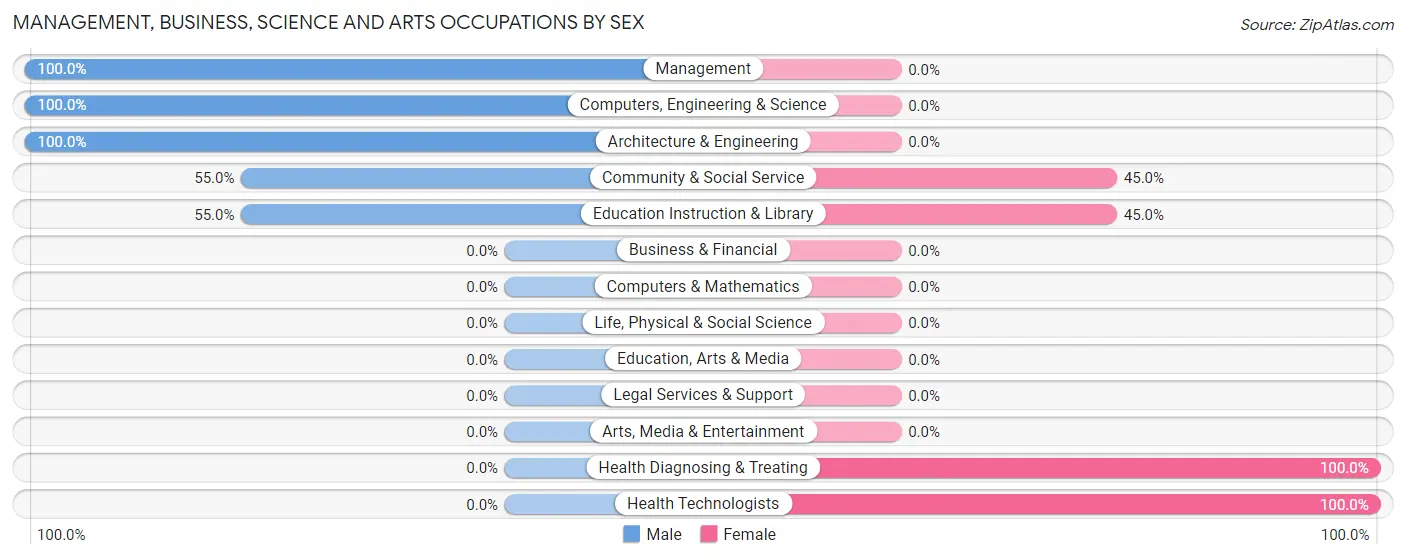
Management, Business, Science and Arts Occupations by Sex
Within the Management, Business, Science and Arts occupations in Smithville Flats, the most male-oriented occupations are Management (100.0%), Computers, Engineering & Science (100.0%), and Architecture & Engineering (100.0%), while the most female-oriented occupations are Health Diagnosing & Treating (100.0%), Health Technologists (100.0%), and Community & Social Service (45.0%).
| Occupation | Male | Female |
| Management | 11 (100.0%) | 0 (0.0%) |
| Business & Financial | 0 (0.0%) | 0 (0.0%) |
| Computers, Engineering & Science | 4 (100.0%) | 0 (0.0%) |
| Computers & Mathematics | 0 (0.0%) | 0 (0.0%) |
| Architecture & Engineering | 4 (100.0%) | 0 (0.0%) |
| Life, Physical & Social Science | 0 (0.0%) | 0 (0.0%) |
| Community & Social Service | 11 (55.0%) | 9 (45.0%) |
| Education, Arts & Media | 0 (0.0%) | 0 (0.0%) |
| Legal Services & Support | 0 (0.0%) | 0 (0.0%) |
| Education Instruction & Library | 11 (55.0%) | 9 (45.0%) |
| Arts, Media & Entertainment | 0 (0.0%) | 0 (0.0%) |
| Health Diagnosing & Treating | 0 (0.0%) | 2 (100.0%) |
| Health Technologists | 0 (0.0%) | 2 (100.0%) |
| Total (Category) | 26 (70.3%) | 11 (29.7%) |
| Total (Overall) | 88 (51.2%) | 84 (48.8%) |
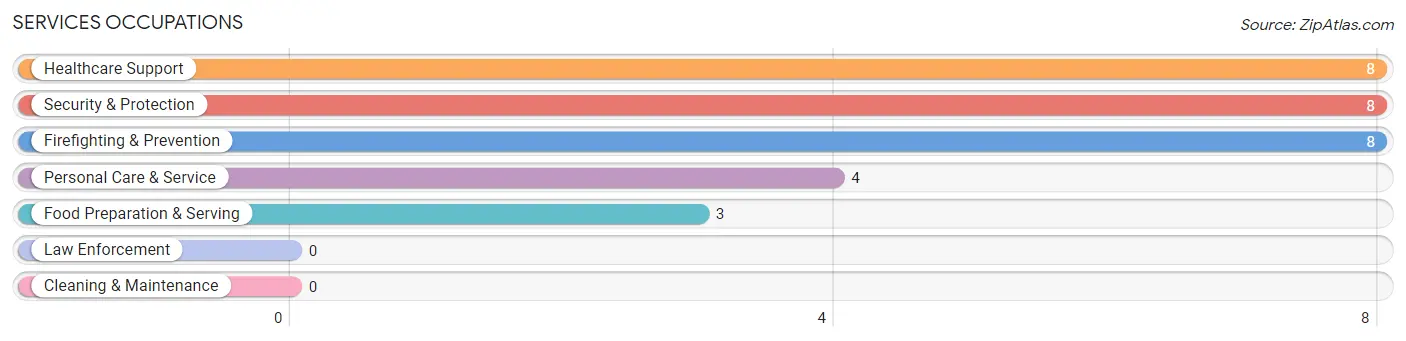
Services Occupations
The most common Services occupations in Smithville Flats are Healthcare Support (8 | 4.6%), Security & Protection (8 | 4.6%), Firefighting & Prevention (8 | 4.6%), Personal Care & Service (4 | 2.3%), and Food Preparation & Serving (3 | 1.7%).
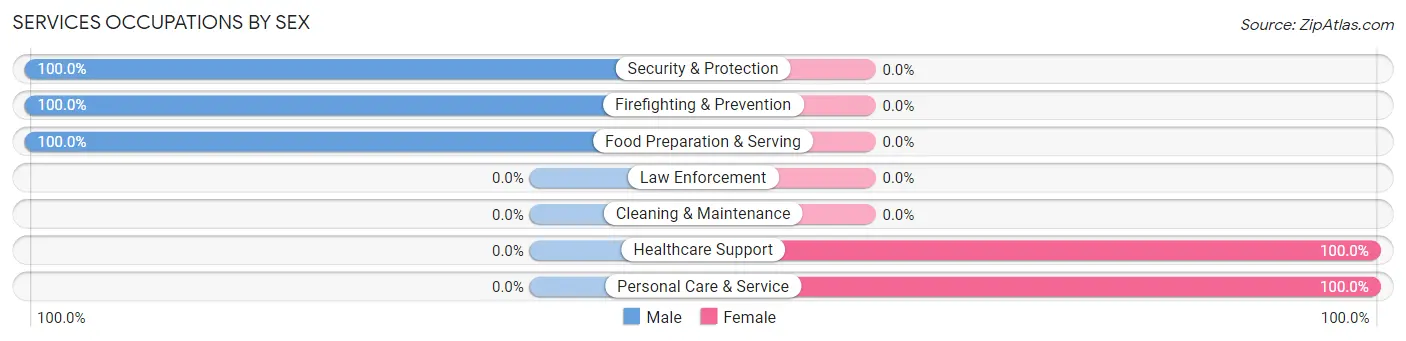
Services Occupations by Sex
Within the Services occupations in Smithville Flats, the most male-oriented occupations are Security & Protection (100.0%), Firefighting & Prevention (100.0%), and Food Preparation & Serving (100.0%), while the most female-oriented occupations are Healthcare Support (100.0%), and Personal Care & Service (100.0%).
| Occupation | Male | Female |
| Healthcare Support | 0 (0.0%) | 8 (100.0%) |
| Security & Protection | 8 (100.0%) | 0 (0.0%) |
| Firefighting & Prevention | 8 (100.0%) | 0 (0.0%) |
| Law Enforcement | 0 (0.0%) | 0 (0.0%) |
| Food Preparation & Serving | 3 (100.0%) | 0 (0.0%) |
| Cleaning & Maintenance | 0 (0.0%) | 0 (0.0%) |
| Personal Care & Service | 0 (0.0%) | 4 (100.0%) |
| Total (Category) | 11 (47.8%) | 12 (52.2%) |
| Total (Overall) | 88 (51.2%) | 84 (48.8%) |
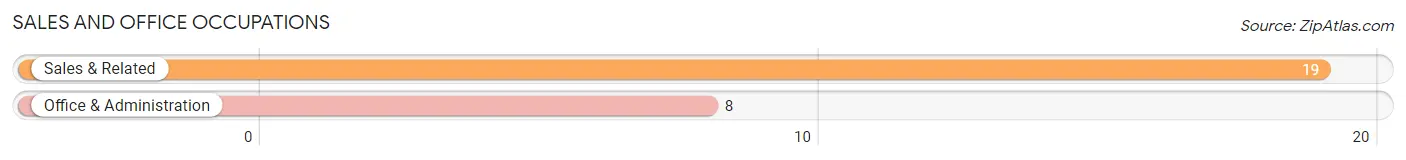
Sales and Office Occupations
The most common Sales and Office occupations in Smithville Flats are Sales & Related (19 | 11.1%), and Office & Administration (8 | 4.6%).
Sales and Office Occupations by Sex
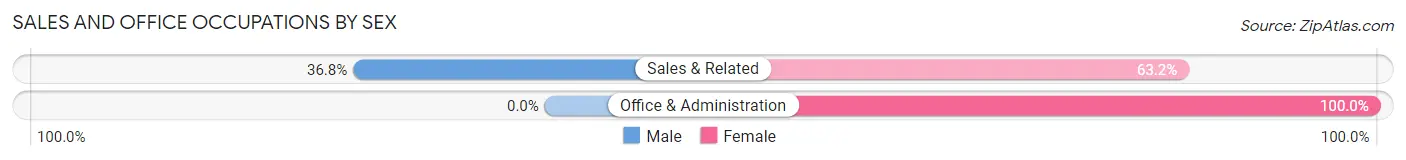
| Occupation | Male | Female |
| Sales & Related | 7 (36.8%) | 12 (63.2%) |
| Office & Administration | 0 (0.0%) | 8 (100.0%) |
| Total (Category) | 7 (25.9%) | 20 (74.1%) |
| Total (Overall) | 88 (51.2%) | 84 (48.8%) |
Natural Resources, Construction and Maintenance Occupations
The most common Natural Resources, Construction and Maintenance occupations in Smithville Flats are Construction & Extraction (17 | 9.9%), and Farming, Fishing & Forestry (3 | 1.7%).
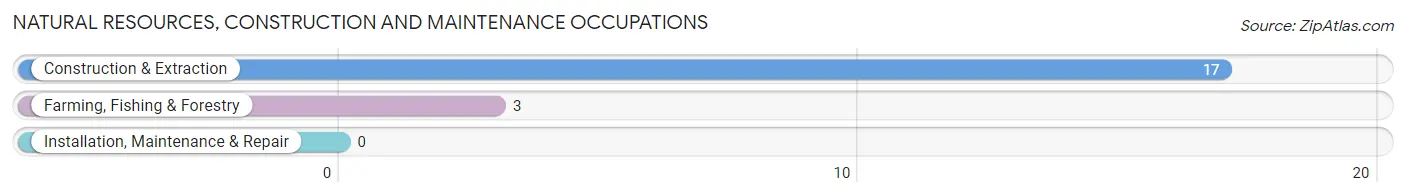
Natural Resources, Construction and Maintenance Occupations by Sex
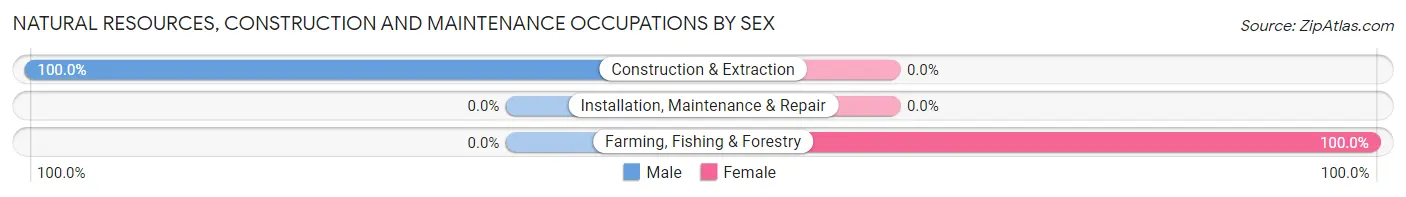
| Occupation | Male | Female |
| Farming, Fishing & Forestry | 0 (0.0%) | 3 (100.0%) |
| Construction & Extraction | 17 (100.0%) | 0 (0.0%) |
| Installation, Maintenance & Repair | 0 (0.0%) | 0 (0.0%) |
| Total (Category) | 17 (85.0%) | 3 (15.0%) |
| Total (Overall) | 88 (51.2%) | 84 (48.8%) |
Production, Transportation and Moving Occupations
The most common Production, Transportation and Moving occupations in Smithville Flats are Production (38 | 22.1%), Transportation (23 | 13.4%), and Material Moving (4 | 2.3%).
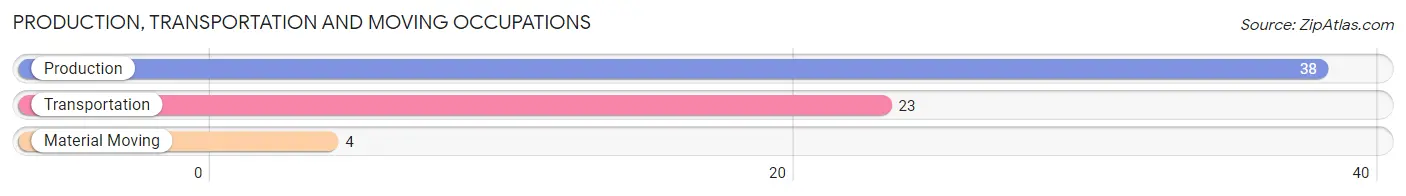
Production, Transportation and Moving Occupations by Sex
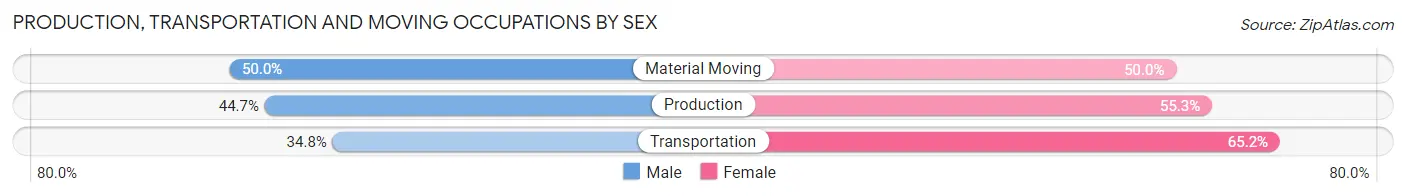
| Occupation | Male | Female |
| Production | 17 (44.7%) | 21 (55.3%) |
| Transportation | 8 (34.8%) | 15 (65.2%) |
| Material Moving | 2 (50.0%) | 2 (50.0%) |
| Total (Category) | 27 (41.5%) | 38 (58.5%) |
| Total (Overall) | 88 (51.2%) | 84 (48.8%) |
Employment Industries by Sex in Smithville Flats
Employment Industries in Smithville Flats
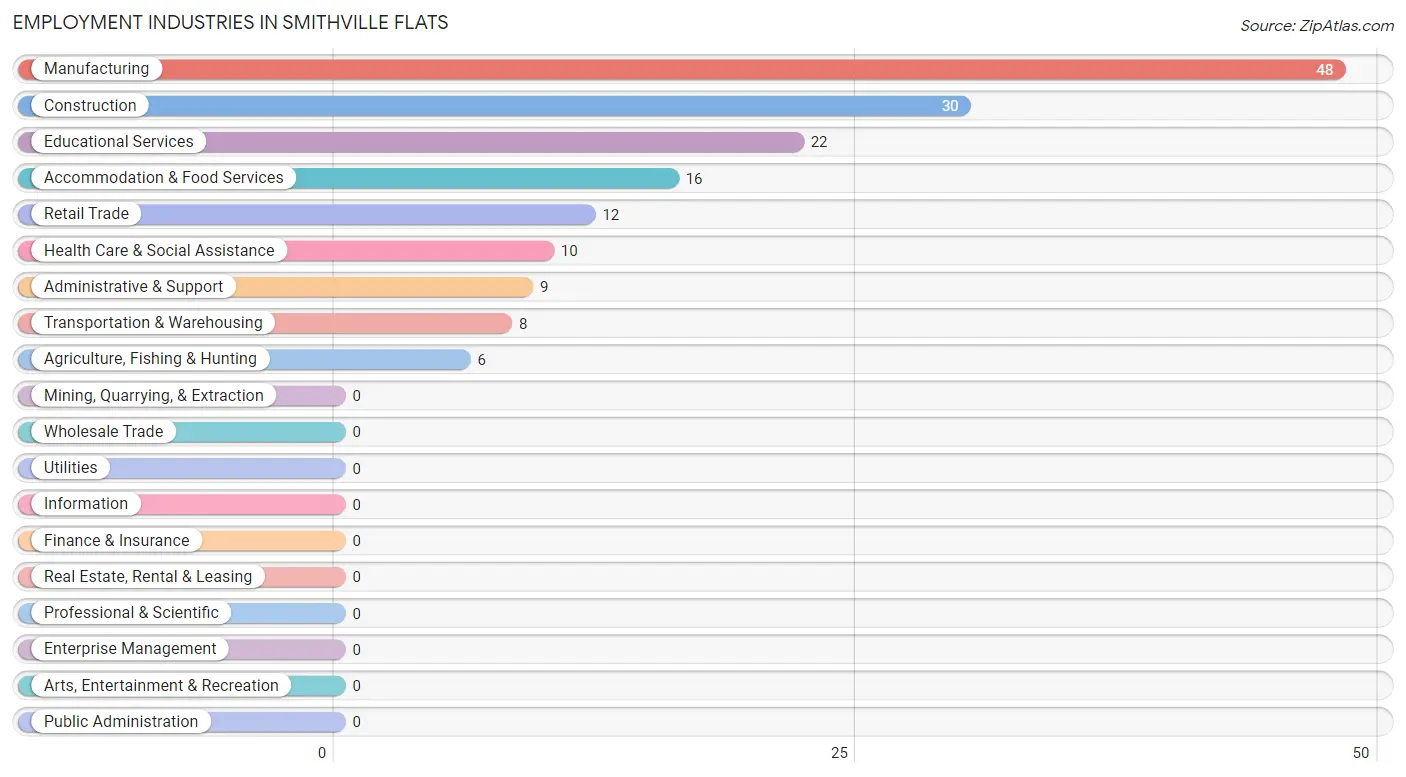
The major employment industries in Smithville Flats include Manufacturing (48 | 27.9%), Construction (30 | 17.4%), Educational Services (22 | 12.8%), Accommodation & Food Services (16 | 9.3%), and Retail Trade (12 | 7.0%).
Employment Industries by Sex in Smithville Flats
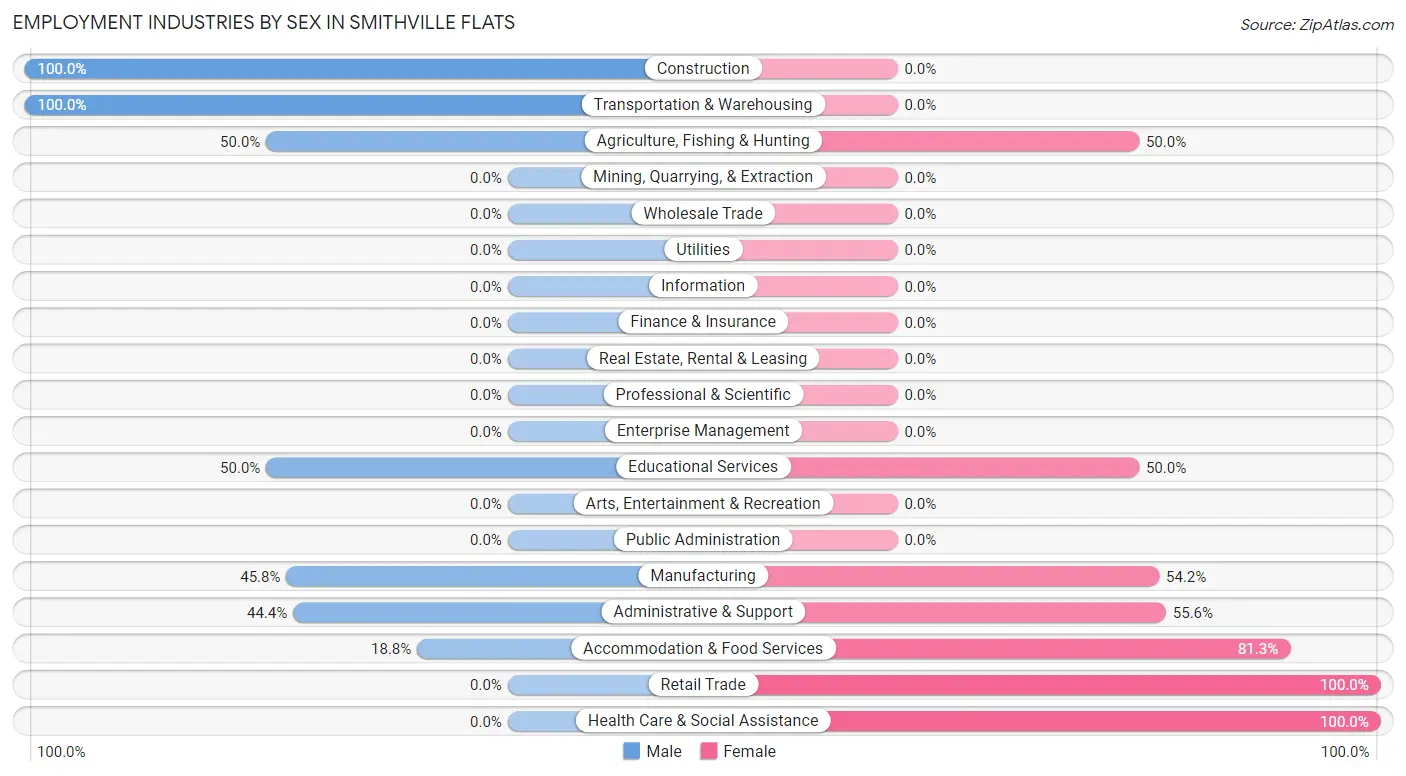
The Smithville Flats industries that see more men than women are Construction (100.0%), Transportation & Warehousing (100.0%), and Agriculture, Fishing & Hunting (50.0%), whereas the industries that tend to have a higher number of women are Retail Trade (100.0%), Health Care & Social Assistance (100.0%), and Accommodation & Food Services (81.2%).
| Industry | Male | Female |
| Agriculture, Fishing & Hunting | 3 (50.0%) | 3 (50.0%) |
| Mining, Quarrying, & Extraction | 0 (0.0%) | 0 (0.0%) |
| Construction | 30 (100.0%) | 0 (0.0%) |
| Manufacturing | 22 (45.8%) | 26 (54.2%) |
| Wholesale Trade | 0 (0.0%) | 0 (0.0%) |
| Retail Trade | 0 (0.0%) | 12 (100.0%) |
| Transportation & Warehousing | 8 (100.0%) | 0 (0.0%) |
| Utilities | 0 (0.0%) | 0 (0.0%) |
| Information | 0 (0.0%) | 0 (0.0%) |
| Finance & Insurance | 0 (0.0%) | 0 (0.0%) |
| Real Estate, Rental & Leasing | 0 (0.0%) | 0 (0.0%) |
| Professional & Scientific | 0 (0.0%) | 0 (0.0%) |
| Enterprise Management | 0 (0.0%) | 0 (0.0%) |
| Administrative & Support | 4 (44.4%) | 5 (55.6%) |
| Educational Services | 11 (50.0%) | 11 (50.0%) |
| Health Care & Social Assistance | 0 (0.0%) | 10 (100.0%) |
| Arts, Entertainment & Recreation | 0 (0.0%) | 0 (0.0%) |
| Accommodation & Food Services | 3 (18.8%) | 13 (81.2%) |
| Public Administration | 0 (0.0%) | 0 (0.0%) |
| Total | 88 (51.2%) | 84 (48.8%) |
Education in Smithville Flats
School Enrollment in Smithville Flats
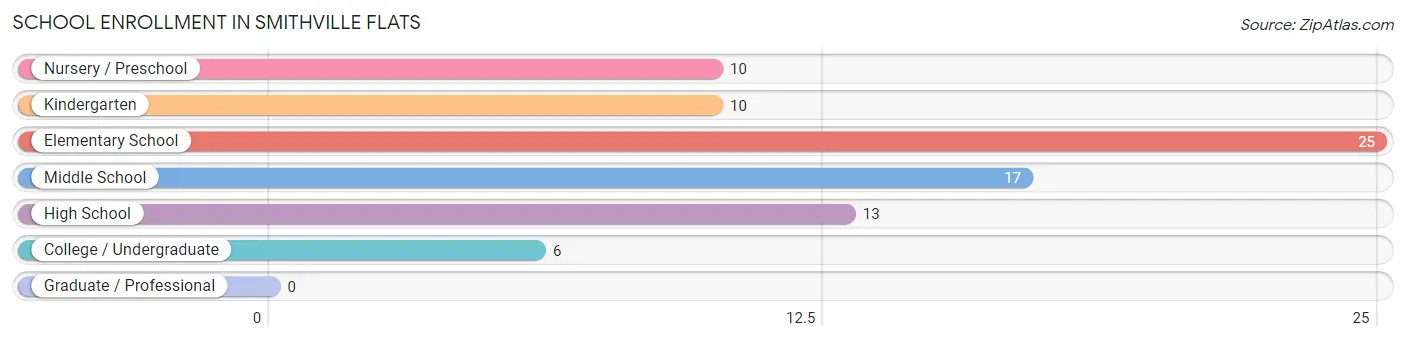
The most common levels of schooling among the 81 students in Smithville Flats are elementary school (25 | 30.9%), middle school (17 | 21.0%), and high school (13 | 16.1%).
| School Level | # Students | % Students |
| Nursery / Preschool | 10 | 12.3% |
| Kindergarten | 10 | 12.3% |
| Elementary School | 25 | 30.9% |
| Middle School | 17 | 21.0% |
| High School | 13 | 16.1% |
| College / Undergraduate | 6 | 7.4% |
| Graduate / Professional | 0 | 0.0% |
| Total | 81 | 100.0% |
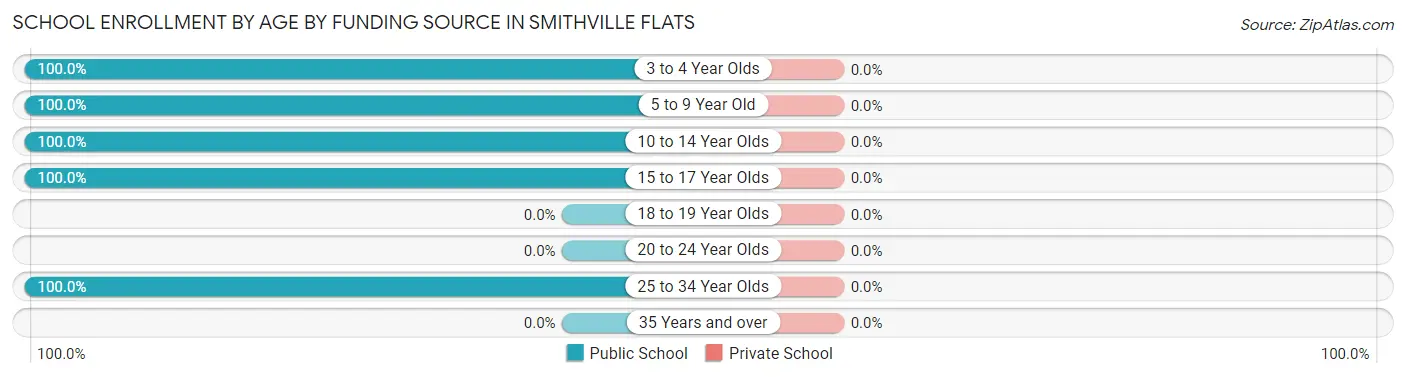
School Enrollment by Age by Funding Source in Smithville Flats
| Age Bracket | Public School | Private School |
| 3 to 4 Year Olds | 10 (100.0%) | 0 (0.0%) |
| 5 to 9 Year Old | 31 (100.0%) | 0 (0.0%) |
| 10 to 14 Year Olds | 24 (100.0%) | 0 (0.0%) |
| 15 to 17 Year Olds | 10 (100.0%) | 0 (0.0%) |
| 18 to 19 Year Olds | 0 (0.0%) | 0 (0.0%) |
| 20 to 24 Year Olds | 0 (0.0%) | 0 (0.0%) |
| 25 to 34 Year Olds | 6 (100.0%) | 0 (0.0%) |
| 35 Years and over | 0 (0.0%) | 0 (0.0%) |
| Total | 81 (100.0%) | 0 (0.0%) |
Educational Attainment by Field of Study in Smithville Flats
Education (20 | 33.9%), business (16 | 27.1%), science & technology (11 | 18.6%), engineering (6 | 10.2%), and computers & mathematics (2 | 3.4%) are the most common fields of study among 59 individuals in Smithville Flats who have obtained a bachelor's degree or higher.
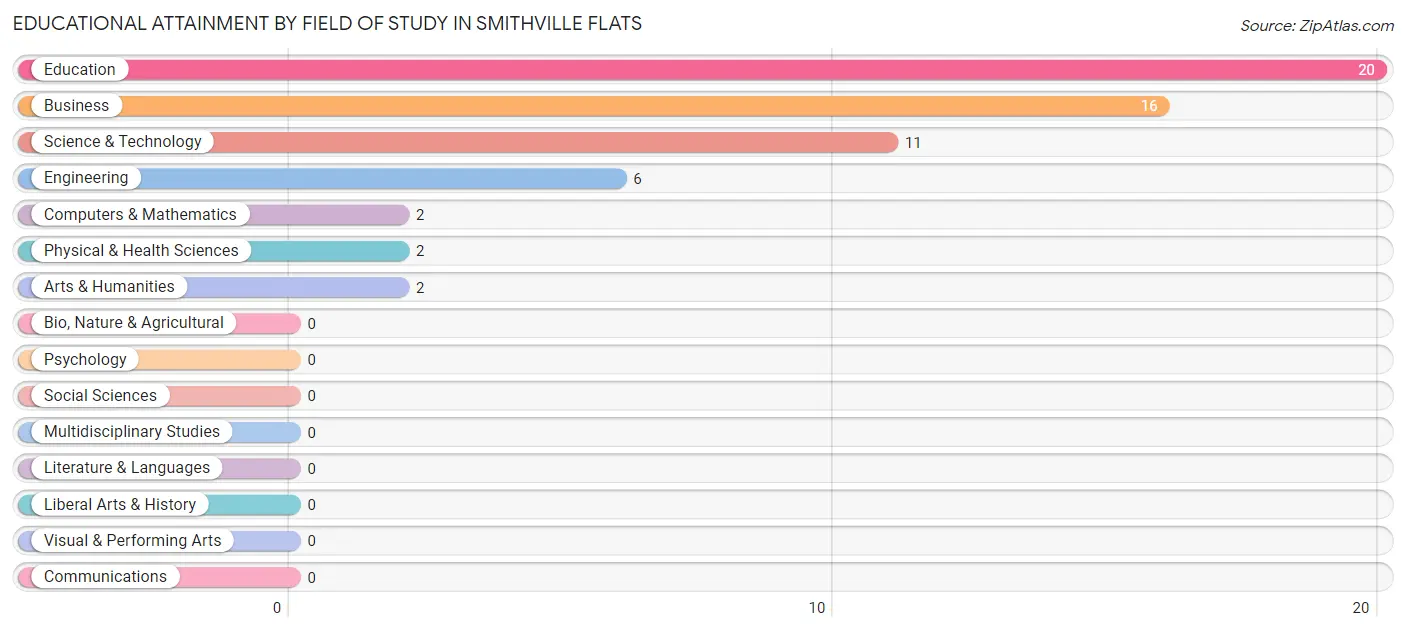
| Field of Study | # Graduates | % Graduates |
| Computers & Mathematics | 2 | 3.4% |
| Bio, Nature & Agricultural | 0 | 0.0% |
| Physical & Health Sciences | 2 | 3.4% |
| Psychology | 0 | 0.0% |
| Social Sciences | 0 | 0.0% |
| Engineering | 6 | 10.2% |
| Multidisciplinary Studies | 0 | 0.0% |
| Science & Technology | 11 | 18.6% |
| Business | 16 | 27.1% |
| Education | 20 | 33.9% |
| Literature & Languages | 0 | 0.0% |
| Liberal Arts & History | 0 | 0.0% |
| Visual & Performing Arts | 0 | 0.0% |
| Communications | 0 | 0.0% |
| Arts & Humanities | 2 | 3.4% |
| Total | 59 | 100.0% |
Transportation & Commute in Smithville Flats
Vehicle Availability by Sex in Smithville Flats
The most prevalent vehicle ownership categories in Smithville Flats are males with 2 vehicles (51, accounting for 60.7%) and females with 2 vehicles (40, making up 60.7%).
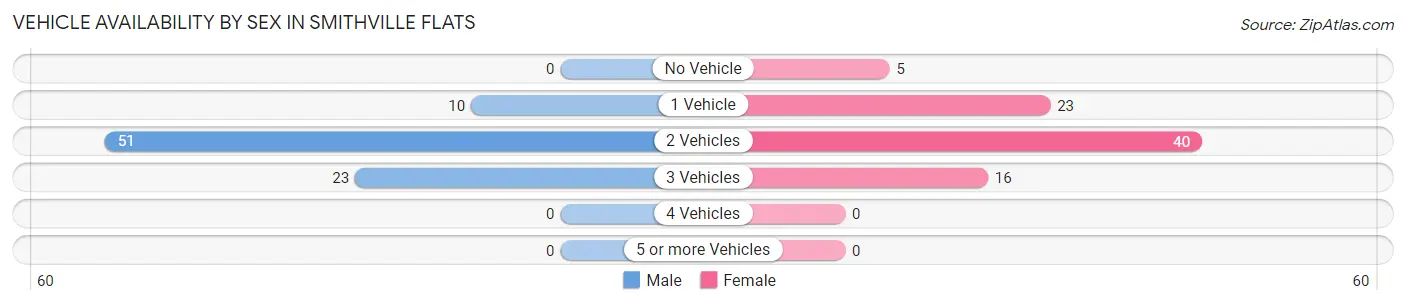
| Vehicles Available | Male | Female |
| No Vehicle | 0 (0.0%) | 5 (5.9%) |
| 1 Vehicle | 10 (11.9%) | 23 (27.4%) |
| 2 Vehicles | 51 (60.7%) | 40 (47.6%) |
| 3 Vehicles | 23 (27.4%) | 16 (19.1%) |
| 4 Vehicles | 0 (0.0%) | 0 (0.0%) |
| 5 or more Vehicles | 0 (0.0%) | 0 (0.0%) |
| Total | 84 (100.0%) | 84 (100.0%) |
Commute Time in Smithville Flats
The most frequently occuring commute durations in Smithville Flats are 5 to 9 minutes (37 commuters, 23.0%), 15 to 19 minutes (26 commuters, 16.2%), and 35 to 39 minutes (20 commuters, 12.4%).
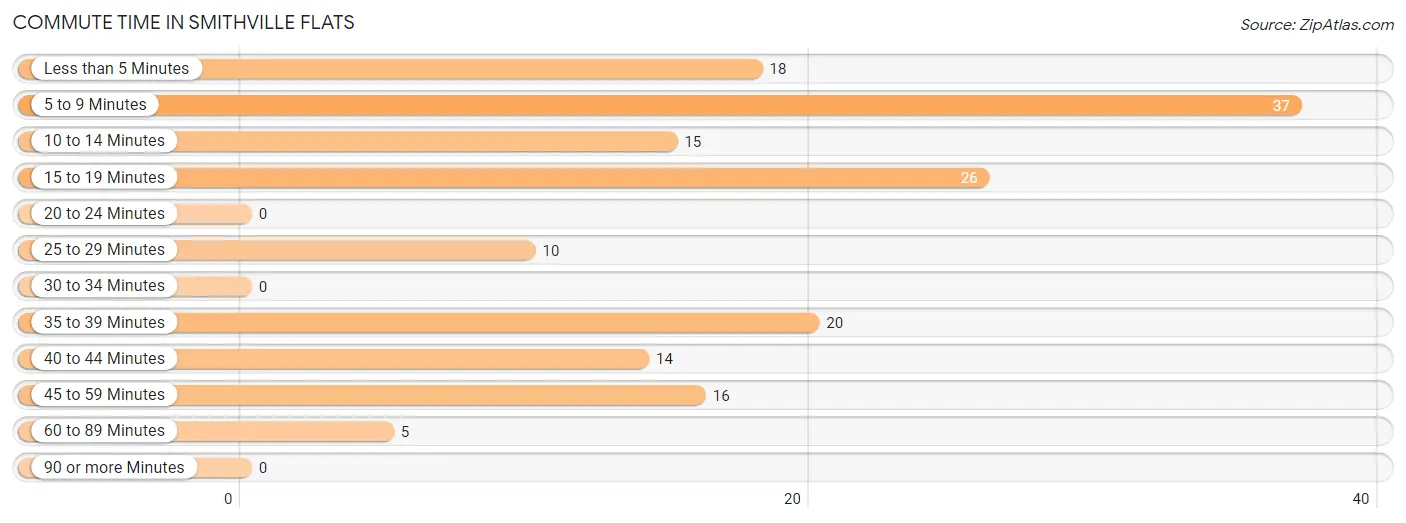
| Commute Time | # Commuters | % Commuters |
| Less than 5 Minutes | 18 | 11.2% |
| 5 to 9 Minutes | 37 | 23.0% |
| 10 to 14 Minutes | 15 | 9.3% |
| 15 to 19 Minutes | 26 | 16.2% |
| 20 to 24 Minutes | 0 | 0.0% |
| 25 to 29 Minutes | 10 | 6.2% |
| 30 to 34 Minutes | 0 | 0.0% |
| 35 to 39 Minutes | 20 | 12.4% |
| 40 to 44 Minutes | 14 | 8.7% |
| 45 to 59 Minutes | 16 | 9.9% |
| 60 to 89 Minutes | 5 | 3.1% |
| 90 or more Minutes | 0 | 0.0% |
Commute Time by Sex in Smithville Flats
The most common commute times in Smithville Flats are 5 to 9 minutes (19 commuters, 23.7%) for males and 5 to 9 minutes (18 commuters, 22.2%) for females.
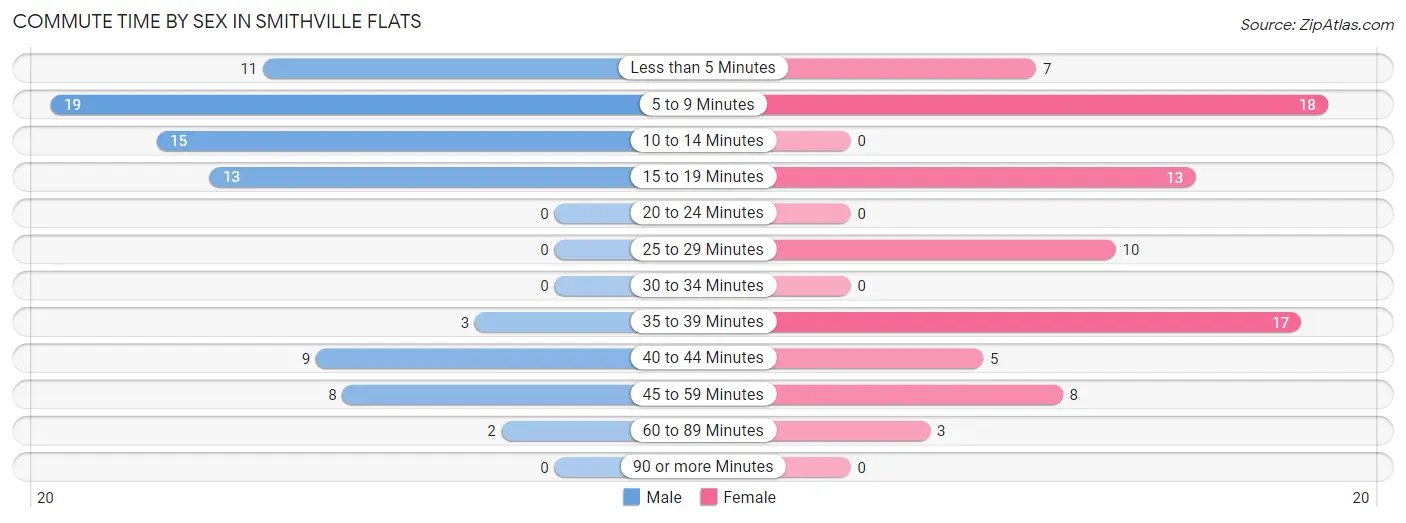
| Commute Time | Male | Female |
| Less than 5 Minutes | 11 (13.8%) | 7 (8.6%) |
| 5 to 9 Minutes | 19 (23.7%) | 18 (22.2%) |
| 10 to 14 Minutes | 15 (18.8%) | 0 (0.0%) |
| 15 to 19 Minutes | 13 (16.3%) | 13 (16.1%) |
| 20 to 24 Minutes | 0 (0.0%) | 0 (0.0%) |
| 25 to 29 Minutes | 0 (0.0%) | 10 (12.3%) |
| 30 to 34 Minutes | 0 (0.0%) | 0 (0.0%) |
| 35 to 39 Minutes | 3 (3.7%) | 17 (21.0%) |
| 40 to 44 Minutes | 9 (11.3%) | 5 (6.2%) |
| 45 to 59 Minutes | 8 (10.0%) | 8 (9.9%) |
| 60 to 89 Minutes | 2 (2.5%) | 3 (3.7%) |
| 90 or more Minutes | 0 (0.0%) | 0 (0.0%) |
Time of Departure to Work by Sex in Smithville Flats
The most frequent times of departure to work in Smithville Flats are 5:30 AM to 5:59 AM (27, 33.8%) for males and 7:00 AM to 7:29 AM (17, 21.0%) for females.
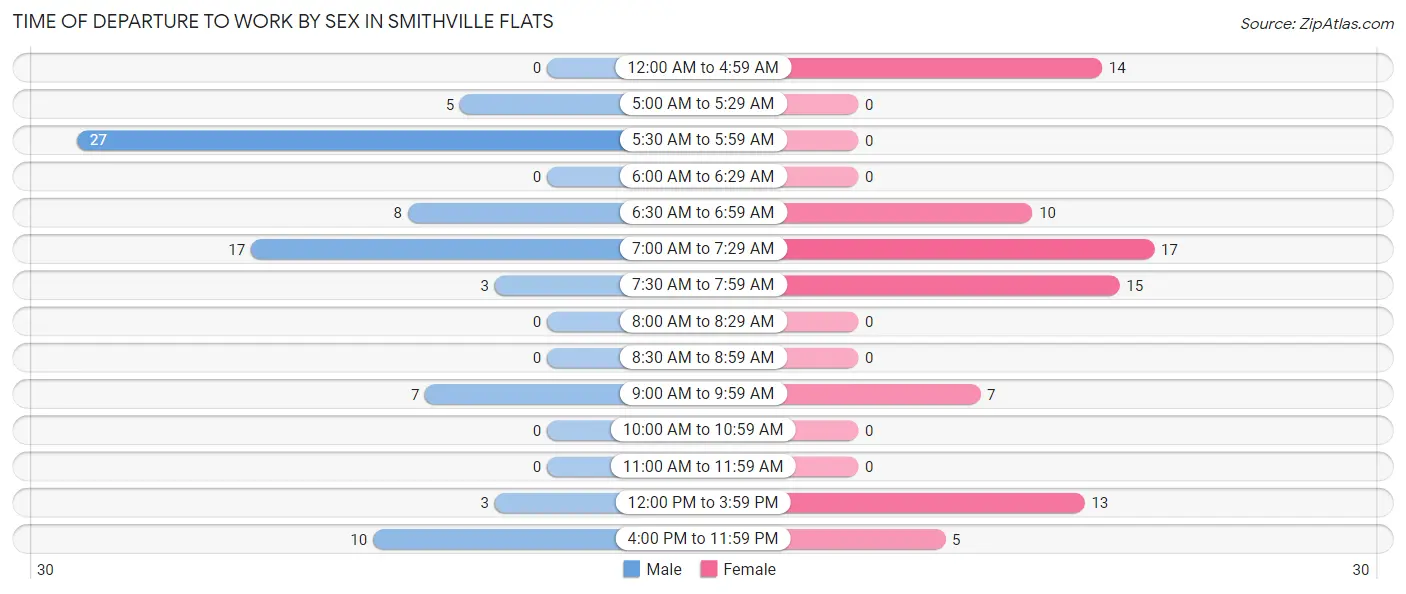
| Time of Departure | Male | Female |
| 12:00 AM to 4:59 AM | 0 (0.0%) | 14 (17.3%) |
| 5:00 AM to 5:29 AM | 5 (6.2%) | 0 (0.0%) |
| 5:30 AM to 5:59 AM | 27 (33.8%) | 0 (0.0%) |
| 6:00 AM to 6:29 AM | 0 (0.0%) | 0 (0.0%) |
| 6:30 AM to 6:59 AM | 8 (10.0%) | 10 (12.3%) |
| 7:00 AM to 7:29 AM | 17 (21.2%) | 17 (21.0%) |
| 7:30 AM to 7:59 AM | 3 (3.7%) | 15 (18.5%) |
| 8:00 AM to 8:29 AM | 0 (0.0%) | 0 (0.0%) |
| 8:30 AM to 8:59 AM | 0 (0.0%) | 0 (0.0%) |
| 9:00 AM to 9:59 AM | 7 (8.7%) | 7 (8.6%) |
| 10:00 AM to 10:59 AM | 0 (0.0%) | 0 (0.0%) |
| 11:00 AM to 11:59 AM | 0 (0.0%) | 0 (0.0%) |
| 12:00 PM to 3:59 PM | 3 (3.7%) | 13 (16.1%) |
| 4:00 PM to 11:59 PM | 10 (12.5%) | 5 (6.2%) |
| Total | 80 (100.0%) | 81 (100.0%) |
Housing Occupancy in Smithville Flats
Occupancy by Ownership in Smithville Flats
Of the total 164 dwellings in Smithville Flats, owner-occupied units account for 110 (67.1%), while renter-occupied units make up 54 (32.9%).
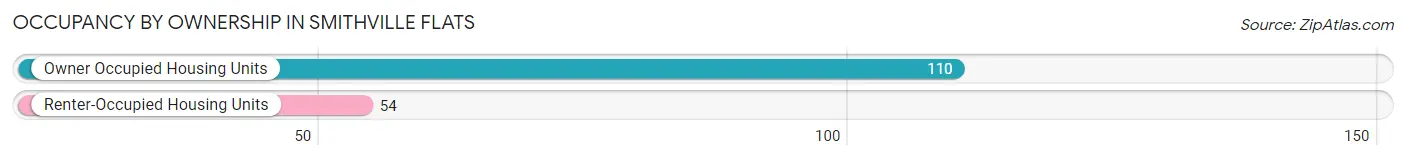
| Occupancy | # Housing Units | % Housing Units |
| Owner Occupied Housing Units | 110 | 67.1% |
| Renter-Occupied Housing Units | 54 | 32.9% |
| Total Occupied Housing Units | 164 | 100.0% |
Occupancy by Household Size in Smithville Flats
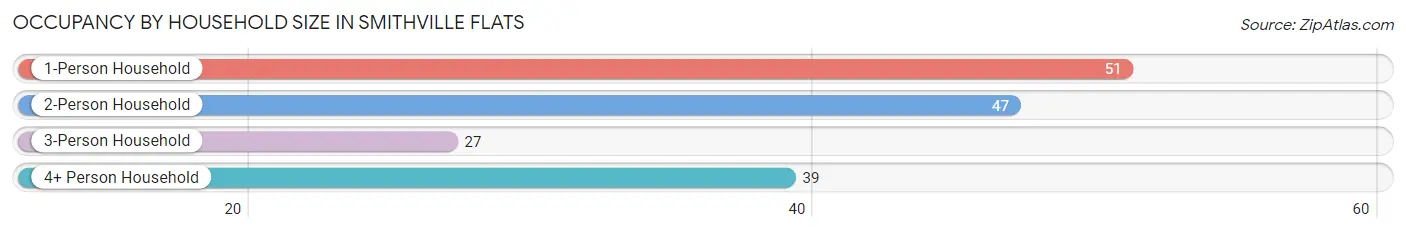
| Household Size | # Housing Units | % Housing Units |
| 1-Person Household | 51 | 31.1% |
| 2-Person Household | 47 | 28.7% |
| 3-Person Household | 27 | 16.5% |
| 4+ Person Household | 39 | 23.8% |
| Total Housing Units | 164 | 100.0% |
Occupancy by Ownership by Household Size in Smithville Flats
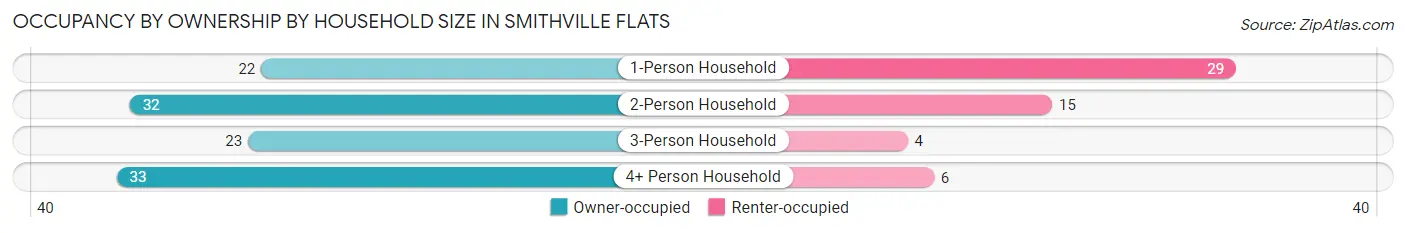
| Household Size | Owner-occupied | Renter-occupied |
| 1-Person Household | 22 (43.1%) | 29 (56.9%) |
| 2-Person Household | 32 (68.1%) | 15 (31.9%) |
| 3-Person Household | 23 (85.2%) | 4 (14.8%) |
| 4+ Person Household | 33 (84.6%) | 6 (15.4%) |
| Total Housing Units | 110 (67.1%) | 54 (32.9%) |
Occupancy by Educational Attainment in Smithville Flats
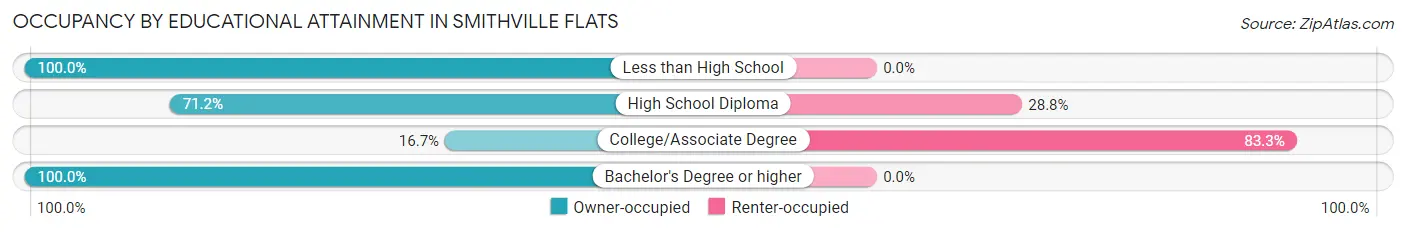
| Household Size | Owner-occupied | Renter-occupied |
| Less than High School | 8 (100.0%) | 0 (0.0%) |
| High School Diploma | 47 (71.2%) | 19 (28.8%) |
| College/Associate Degree | 7 (16.7%) | 35 (83.3%) |
| Bachelor's Degree or higher | 48 (100.0%) | 0 (0.0%) |
Occupancy by Age of Householder in Smithville Flats
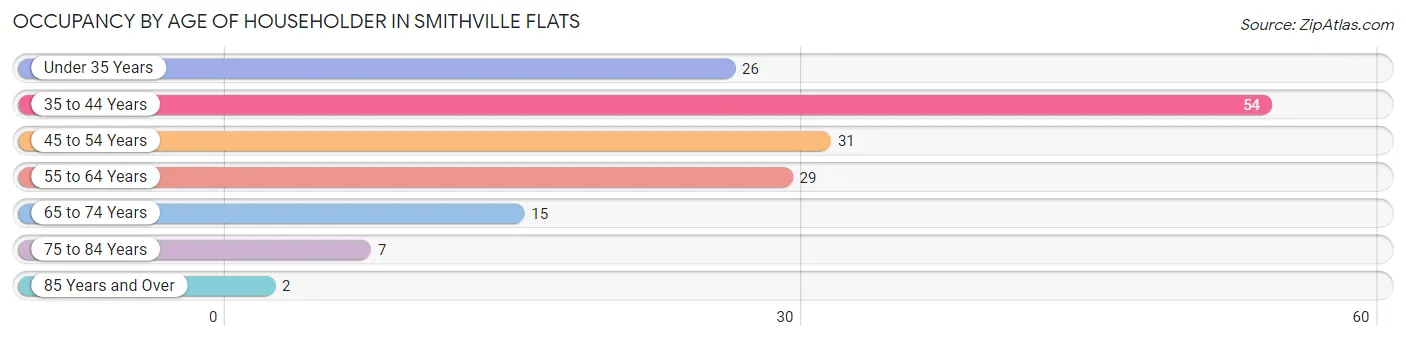
| Age Bracket | # Households | % Households |
| Under 35 Years | 26 | 15.9% |
| 35 to 44 Years | 54 | 32.9% |
| 45 to 54 Years | 31 | 18.9% |
| 55 to 64 Years | 29 | 17.7% |
| 65 to 74 Years | 15 | 9.1% |
| 75 to 84 Years | 7 | 4.3% |
| 85 Years and Over | 2 | 1.2% |
| Total | 164 | 100.0% |
Housing Finances in Smithville Flats
Median Income by Occupancy in Smithville Flats
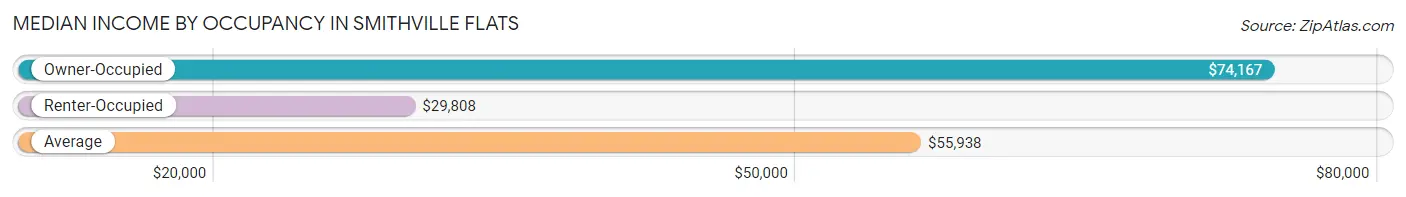
| Occupancy Type | # Households | Median Income |
| Owner-Occupied | 110 (67.1%) | $74,167 |
| Renter-Occupied | 54 (32.9%) | $29,808 |
| Average | 164 (100.0%) | $55,938 |
Occupancy by Householder Income Bracket in Smithville Flats
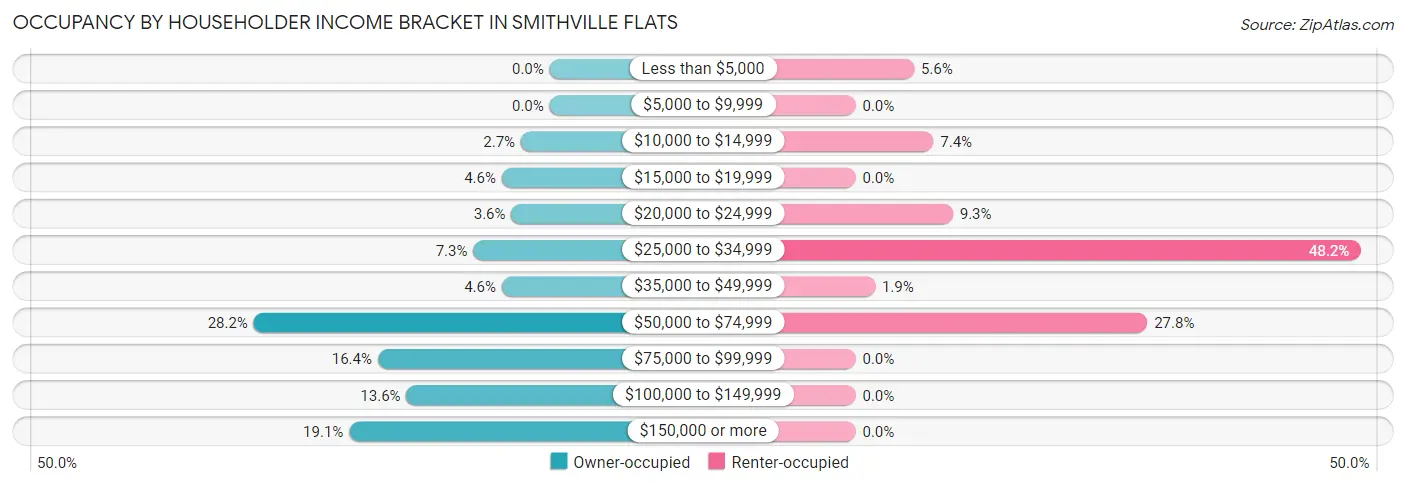
| Income Bracket | Owner-occupied | Renter-occupied |
| Less than $5,000 | 0 (0.0%) | 3 (5.6%) |
| $5,000 to $9,999 | 0 (0.0%) | 0 (0.0%) |
| $10,000 to $14,999 | 3 (2.7%) | 4 (7.4%) |
| $15,000 to $19,999 | 5 (4.5%) | 0 (0.0%) |
| $20,000 to $24,999 | 4 (3.6%) | 5 (9.3%) |
| $25,000 to $34,999 | 8 (7.3%) | 26 (48.1%) |
| $35,000 to $49,999 | 5 (4.5%) | 1 (1.8%) |
| $50,000 to $74,999 | 31 (28.2%) | 15 (27.8%) |
| $75,000 to $99,999 | 18 (16.4%) | 0 (0.0%) |
| $100,000 to $149,999 | 15 (13.6%) | 0 (0.0%) |
| $150,000 or more | 21 (19.1%) | 0 (0.0%) |
| Total | 110 (100.0%) | 54 (100.0%) |
Monthly Housing Cost Tiers in Smithville Flats
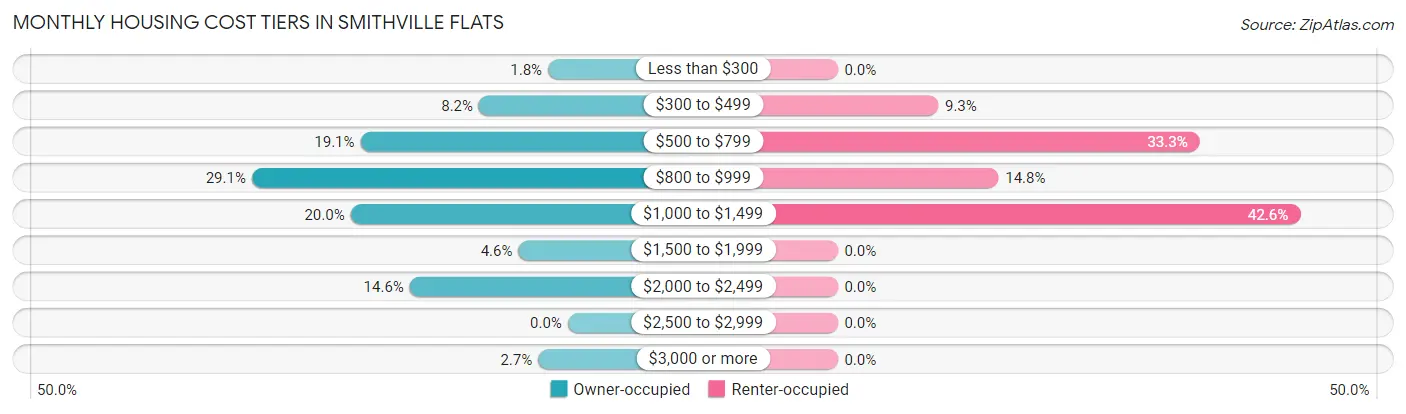
| Monthly Cost | Owner-occupied | Renter-occupied |
| Less than $300 | 2 (1.8%) | 0 (0.0%) |
| $300 to $499 | 9 (8.2%) | 5 (9.3%) |
| $500 to $799 | 21 (19.1%) | 18 (33.3%) |
| $800 to $999 | 32 (29.1%) | 8 (14.8%) |
| $1,000 to $1,499 | 22 (20.0%) | 23 (42.6%) |
| $1,500 to $1,999 | 5 (4.5%) | 0 (0.0%) |
| $2,000 to $2,499 | 16 (14.5%) | 0 (0.0%) |
| $2,500 to $2,999 | 0 (0.0%) | 0 (0.0%) |
| $3,000 or more | 3 (2.7%) | 0 (0.0%) |
| Total | 110 (100.0%) | 54 (100.0%) |
Physical Housing Characteristics in Smithville Flats
Housing Structures in Smithville Flats
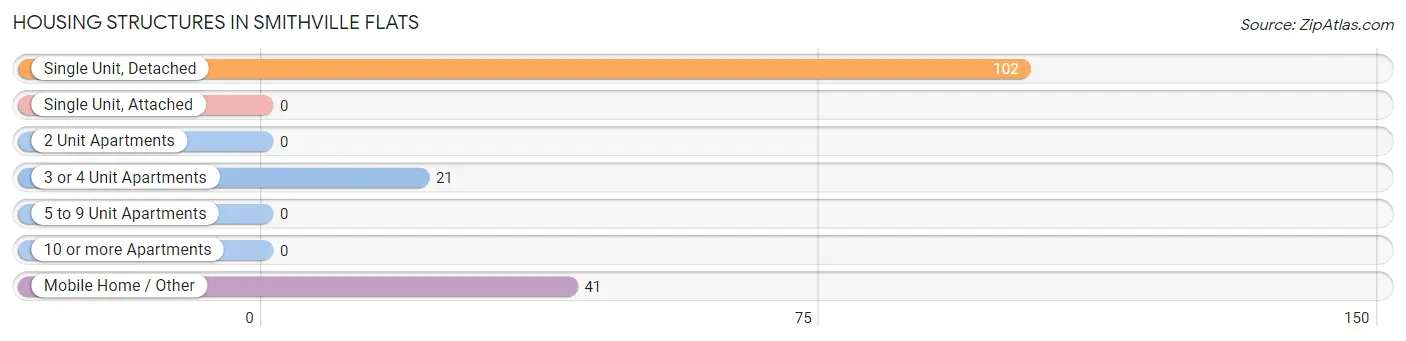
| Structure Type | # Housing Units | % Housing Units |
| Single Unit, Detached | 102 | 62.2% |
| Single Unit, Attached | 0 | 0.0% |
| 2 Unit Apartments | 0 | 0.0% |
| 3 or 4 Unit Apartments | 21 | 12.8% |
| 5 to 9 Unit Apartments | 0 | 0.0% |
| 10 or more Apartments | 0 | 0.0% |
| Mobile Home / Other | 41 | 25.0% |
| Total | 164 | 100.0% |
Housing Structures by Occupancy in Smithville Flats
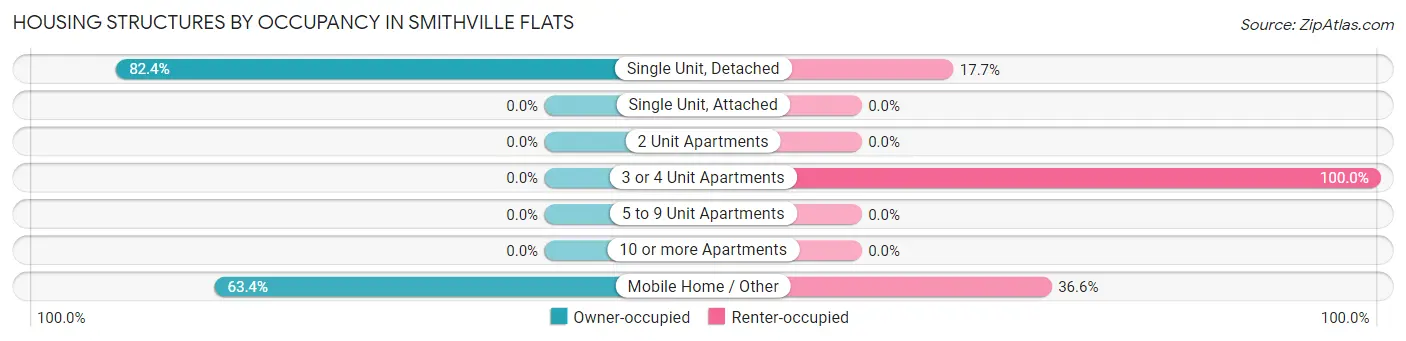
| Structure Type | Owner-occupied | Renter-occupied |
| Single Unit, Detached | 84 (82.4%) | 18 (17.6%) |
| Single Unit, Attached | 0 (0.0%) | 0 (0.0%) |
| 2 Unit Apartments | 0 (0.0%) | 0 (0.0%) |
| 3 or 4 Unit Apartments | 0 (0.0%) | 21 (100.0%) |
| 5 to 9 Unit Apartments | 0 (0.0%) | 0 (0.0%) |
| 10 or more Apartments | 0 (0.0%) | 0 (0.0%) |
| Mobile Home / Other | 26 (63.4%) | 15 (36.6%) |
| Total | 110 (67.1%) | 54 (32.9%) |
Housing Structures by Number of Rooms in Smithville Flats
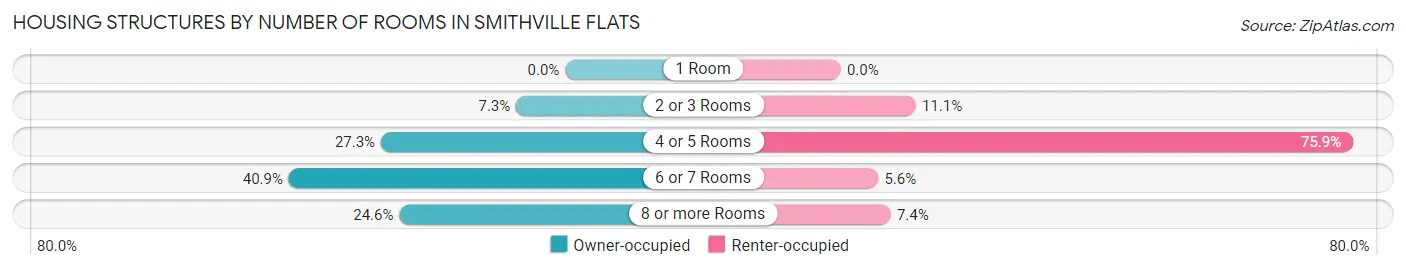
| Number of Rooms | Owner-occupied | Renter-occupied |
| 1 Room | 0 (0.0%) | 0 (0.0%) |
| 2 or 3 Rooms | 8 (7.3%) | 6 (11.1%) |
| 4 or 5 Rooms | 30 (27.3%) | 41 (75.9%) |
| 6 or 7 Rooms | 45 (40.9%) | 3 (5.6%) |
| 8 or more Rooms | 27 (24.5%) | 4 (7.4%) |
| Total | 110 (100.0%) | 54 (100.0%) |
Housing Structure by Heating Type in Smithville Flats
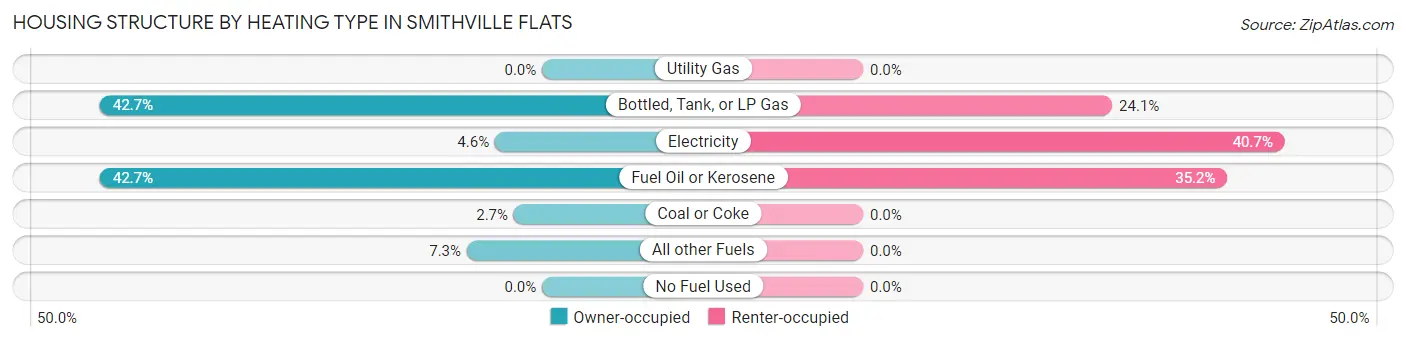
| Heating Type | Owner-occupied | Renter-occupied |
| Utility Gas | 0 (0.0%) | 0 (0.0%) |
| Bottled, Tank, or LP Gas | 47 (42.7%) | 13 (24.1%) |
| Electricity | 5 (4.5%) | 22 (40.7%) |
| Fuel Oil or Kerosene | 47 (42.7%) | 19 (35.2%) |
| Coal or Coke | 3 (2.7%) | 0 (0.0%) |
| All other Fuels | 8 (7.3%) | 0 (0.0%) |
| No Fuel Used | 0 (0.0%) | 0 (0.0%) |
| Total | 110 (100.0%) | 54 (100.0%) |
Household Vehicle Usage in Smithville Flats
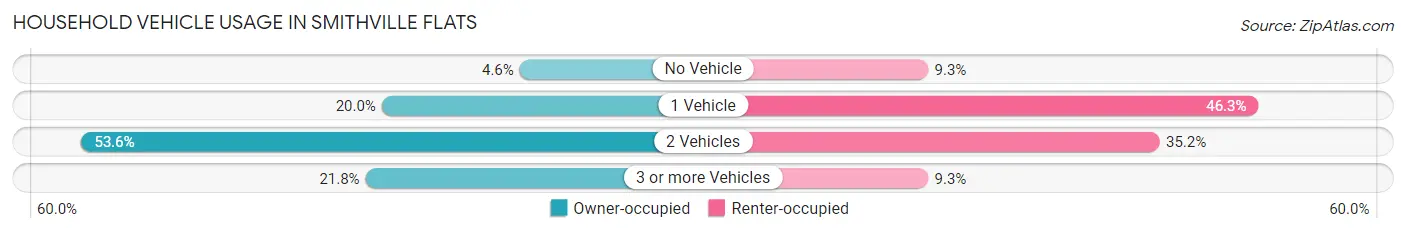
| Vehicles per Household | Owner-occupied | Renter-occupied |
| No Vehicle | 5 (4.5%) | 5 (9.3%) |
| 1 Vehicle | 22 (20.0%) | 25 (46.3%) |
| 2 Vehicles | 59 (53.6%) | 19 (35.2%) |
| 3 or more Vehicles | 24 (21.8%) | 5 (9.3%) |
| Total | 110 (100.0%) | 54 (100.0%) |
Real Estate & Mortgages in Smithville Flats
Real Estate and Mortgage Overview in Smithville Flats
| Characteristic | Without Mortgage | With Mortgage |
| Housing Units | 39 | 71 |
| Median Property Value | - | - |
| Median Household Income | $74,583 | $14 |
| Monthly Housing Costs | $705 | $3 |
| Real Estate Taxes | $1,923 | $3 |
Property Value by Mortgage Status in Smithville Flats
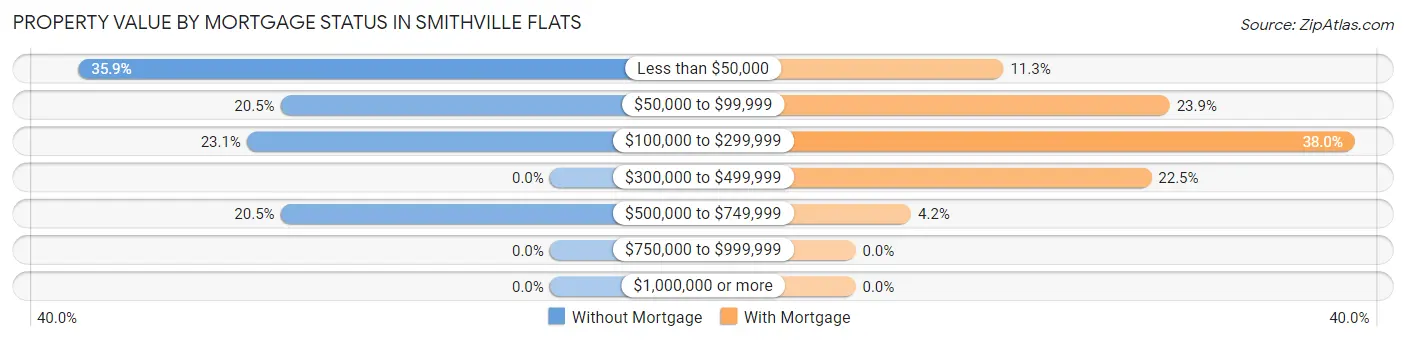
| Property Value | Without Mortgage | With Mortgage |
| Less than $50,000 | 14 (35.9%) | 8 (11.3%) |
| $50,000 to $99,999 | 8 (20.5%) | 17 (23.9%) |
| $100,000 to $299,999 | 9 (23.1%) | 27 (38.0%) |
| $300,000 to $499,999 | 0 (0.0%) | 16 (22.5%) |
| $500,000 to $749,999 | 8 (20.5%) | 3 (4.2%) |
| $750,000 to $999,999 | 0 (0.0%) | 0 (0.0%) |
| $1,000,000 or more | 0 (0.0%) | 0 (0.0%) |
| Total | 39 (100.0%) | 71 (100.0%) |
Household Income by Mortgage Status in Smithville Flats
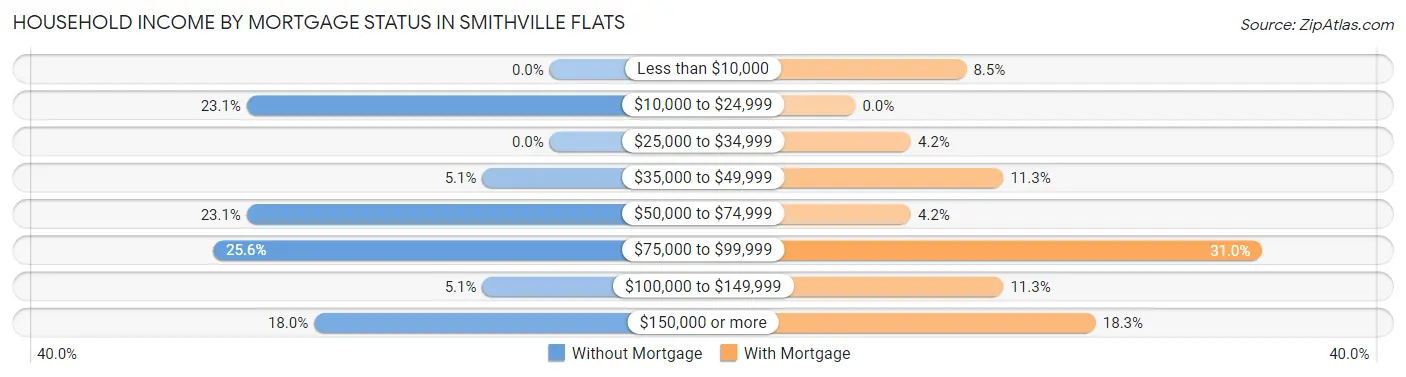
| Household Income | Without Mortgage | With Mortgage |
| Less than $10,000 | 0 (0.0%) | 6 (8.5%) |
| $10,000 to $24,999 | 9 (23.1%) | 0 (0.0%) |
| $25,000 to $34,999 | 0 (0.0%) | 3 (4.2%) |
| $35,000 to $49,999 | 2 (5.1%) | 8 (11.3%) |
| $50,000 to $74,999 | 9 (23.1%) | 3 (4.2%) |
| $75,000 to $99,999 | 10 (25.6%) | 22 (31.0%) |
| $100,000 to $149,999 | 2 (5.1%) | 8 (11.3%) |
| $150,000 or more | 7 (17.9%) | 13 (18.3%) |
| Total | 39 (100.0%) | 71 (100.0%) |
Property Value to Household Income Ratio in Smithville Flats
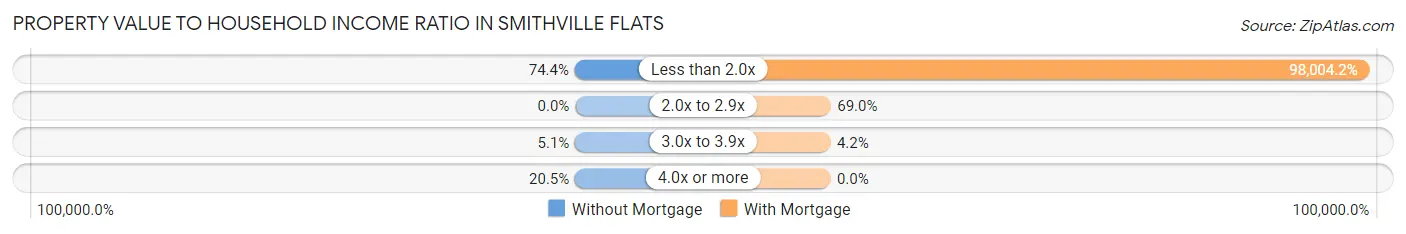
| Value-to-Income Ratio | Without Mortgage | With Mortgage |
| Less than 2.0x | 29 (74.4%) | 69,583 (98,004.2%) |
| 2.0x to 2.9x | 0 (0.0%) | 49 (69.0%) |
| 3.0x to 3.9x | 2 (5.1%) | 3 (4.2%) |
| 4.0x or more | 8 (20.5%) | 0 (0.0%) |
| Total | 39 (100.0%) | 71 (100.0%) |
Real Estate Taxes by Mortgage Status in Smithville Flats
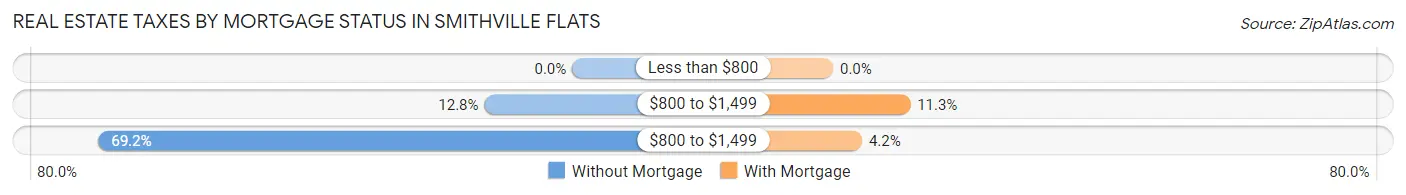
| Property Taxes | Without Mortgage | With Mortgage |
| Less than $800 | 0 (0.0%) | 0 (0.0%) |
| $800 to $1,499 | 5 (12.8%) | 8 (11.3%) |
| $800 to $1,499 | 27 (69.2%) | 3 (4.2%) |
| Total | 39 (100.0%) | 71 (100.0%) |
Health & Disability in Smithville Flats
Health Insurance Coverage by Age in Smithville Flats
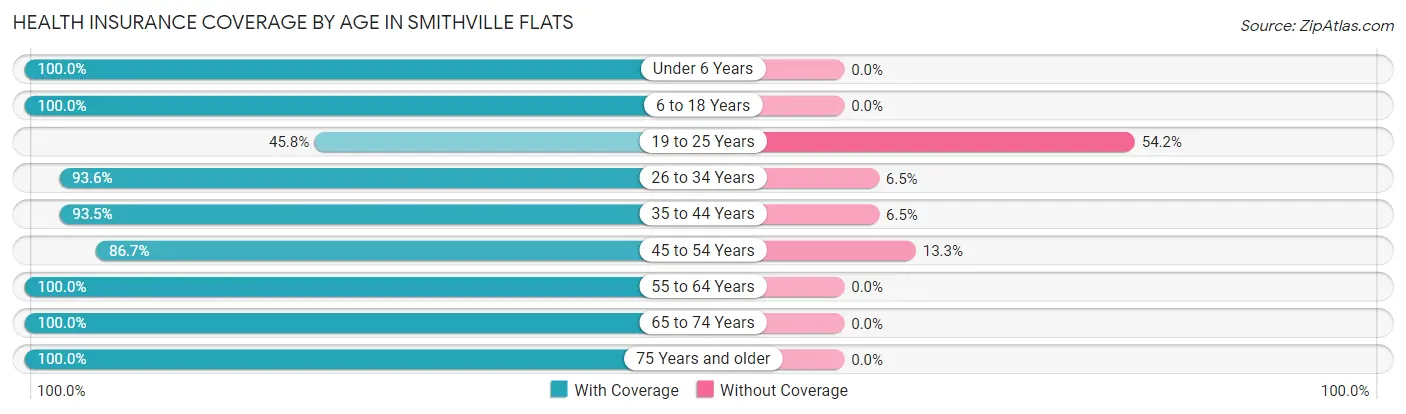
| Age Bracket | With Coverage | Without Coverage |
| Under 6 Years | 30 (100.0%) | 0 (0.0%) |
| 6 to 18 Years | 65 (100.0%) | 0 (0.0%) |
| 19 to 25 Years | 11 (45.8%) | 13 (54.2%) |
| 26 to 34 Years | 29 (93.5%) | 2 (6.5%) |
| 35 to 44 Years | 72 (93.5%) | 5 (6.5%) |
| 45 to 54 Years | 39 (86.7%) | 6 (13.3%) |
| 55 to 64 Years | 31 (100.0%) | 0 (0.0%) |
| 65 to 74 Years | 32 (100.0%) | 0 (0.0%) |
| 75 Years and older | 9 (100.0%) | 0 (0.0%) |
| Total | 318 (92.4%) | 26 (7.6%) |
Health Insurance Coverage by Citizenship Status in Smithville Flats
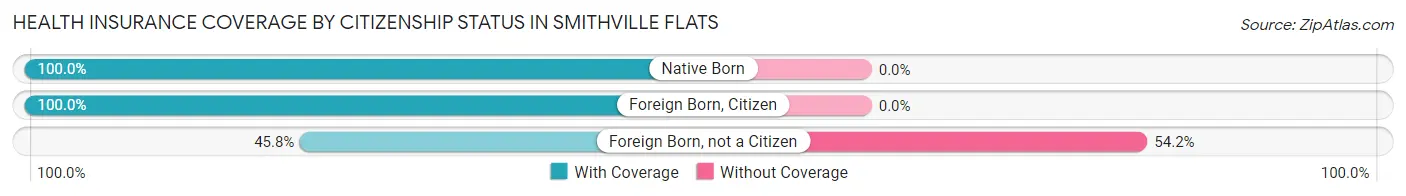
| Citizenship Status | With Coverage | Without Coverage |
| Native Born | 30 (100.0%) | 0 (0.0%) |
| Foreign Born, Citizen | 65 (100.0%) | 0 (0.0%) |
| Foreign Born, not a Citizen | 11 (45.8%) | 13 (54.2%) |
Health Insurance Coverage by Household Income in Smithville Flats
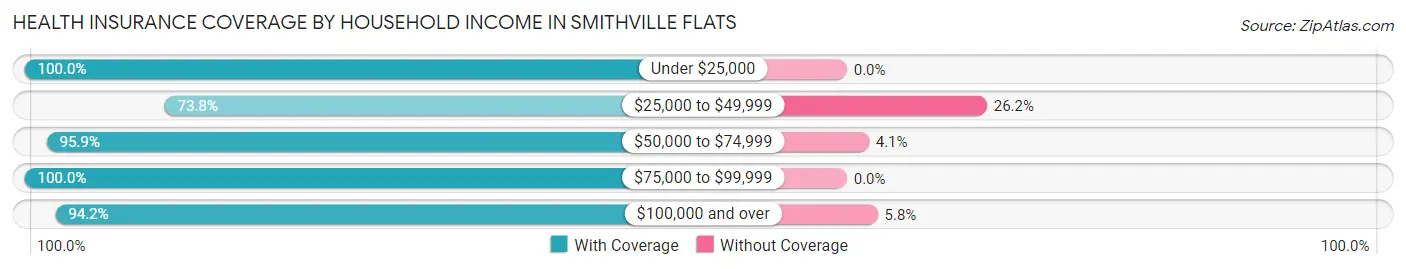
| Household Income | With Coverage | Without Coverage |
| Under $25,000 | 38 (100.0%) | 0 (0.0%) |
| $25,000 to $49,999 | 45 (73.8%) | 16 (26.2%) |
| $50,000 to $74,999 | 93 (95.9%) | 4 (4.1%) |
| $75,000 to $99,999 | 44 (100.0%) | 0 (0.0%) |
| $100,000 and over | 98 (94.2%) | 6 (5.8%) |
Public vs Private Health Insurance Coverage by Age in Smithville Flats
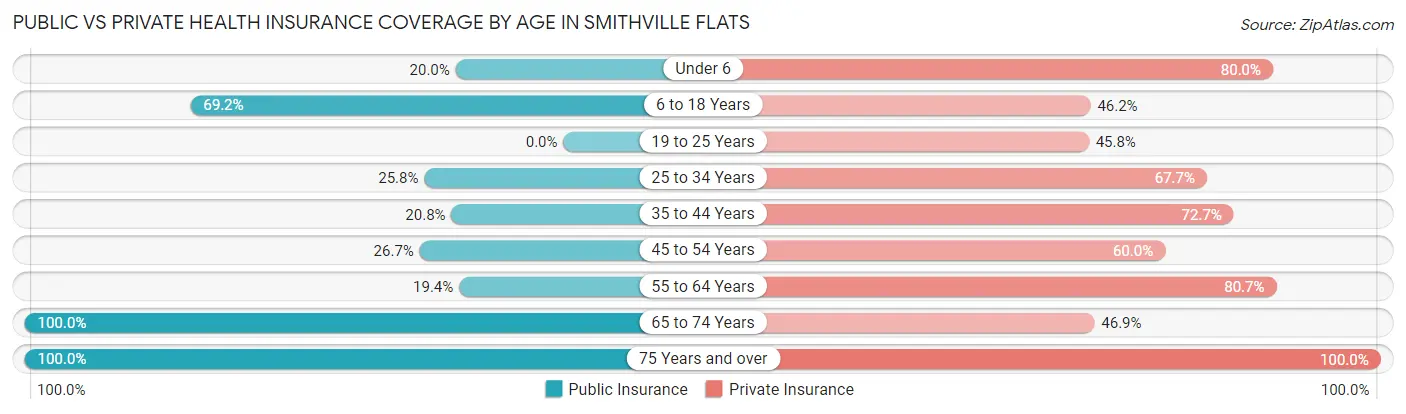
| Age Bracket | Public Insurance | Private Insurance |
| Under 6 | 6 (20.0%) | 24 (80.0%) |
| 6 to 18 Years | 45 (69.2%) | 30 (46.2%) |
| 19 to 25 Years | 0 (0.0%) | 11 (45.8%) |
| 25 to 34 Years | 8 (25.8%) | 21 (67.7%) |
| 35 to 44 Years | 16 (20.8%) | 56 (72.7%) |
| 45 to 54 Years | 12 (26.7%) | 27 (60.0%) |
| 55 to 64 Years | 6 (19.4%) | 25 (80.6%) |
| 65 to 74 Years | 32 (100.0%) | 15 (46.9%) |
| 75 Years and over | 9 (100.0%) | 9 (100.0%) |
| Total | 134 (39.0%) | 218 (63.4%) |
Disability Status by Sex by Age in Smithville Flats
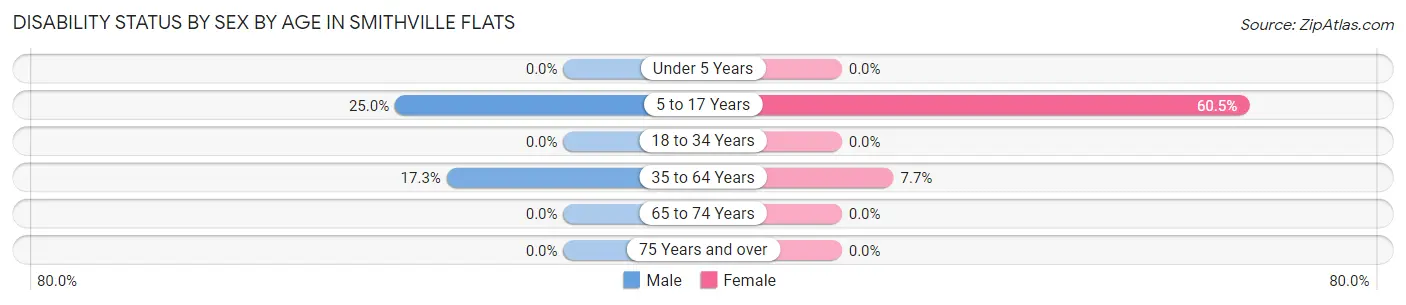
| Age Bracket | Male | Female |
| Under 5 Years | 0 (0.0%) | 0 (0.0%) |
| 5 to 17 Years | 6 (25.0%) | 26 (60.5%) |
| 18 to 34 Years | 0 (0.0%) | 0 (0.0%) |
| 35 to 64 Years | 13 (17.3%) | 6 (7.7%) |
| 65 to 74 Years | 0 (0.0%) | 0 (0.0%) |
| 75 Years and over | 0 (0.0%) | 0 (0.0%) |
Disability Class by Sex by Age in Smithville Flats
Disability Class: Hearing Difficulty
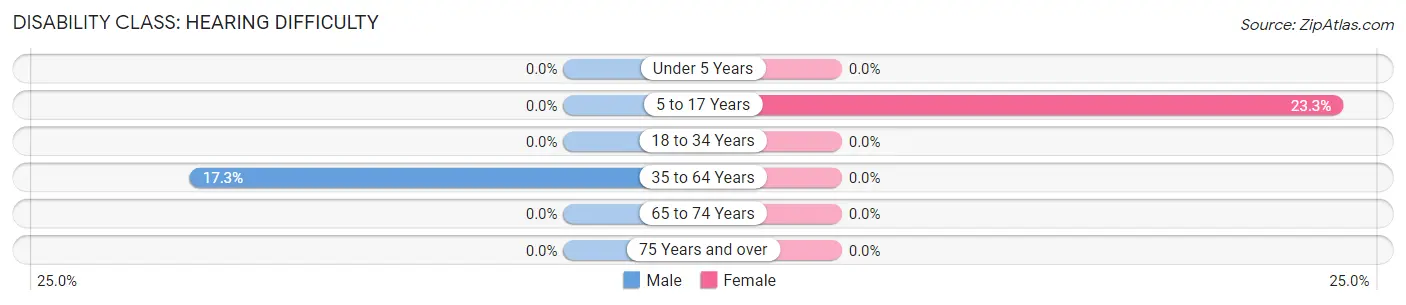
| Age Bracket | Male | Female |
| Under 5 Years | 0 (0.0%) | 0 (0.0%) |
| 5 to 17 Years | 0 (0.0%) | 10 (23.3%) |
| 18 to 34 Years | 0 (0.0%) | 0 (0.0%) |
| 35 to 64 Years | 13 (17.3%) | 0 (0.0%) |
| 65 to 74 Years | 0 (0.0%) | 0 (0.0%) |
| 75 Years and over | 0 (0.0%) | 0 (0.0%) |
Disability Class: Vision Difficulty
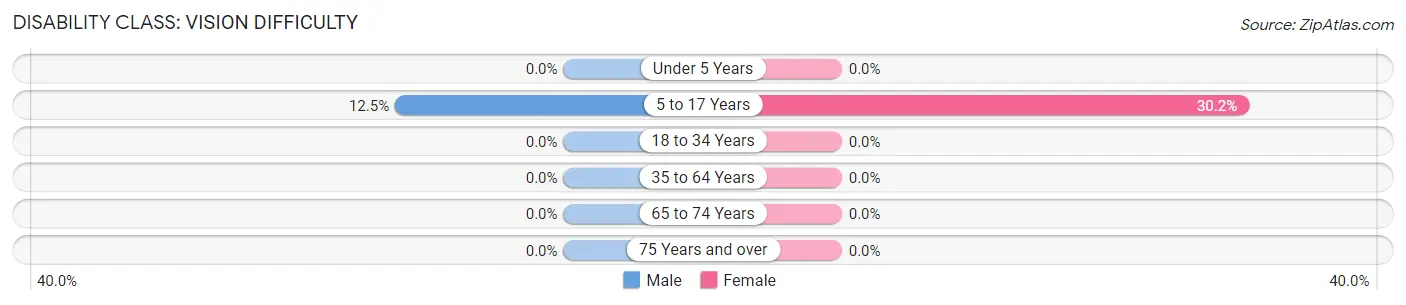
| Age Bracket | Male | Female |
| Under 5 Years | 0 (0.0%) | 0 (0.0%) |
| 5 to 17 Years | 3 (12.5%) | 13 (30.2%) |
| 18 to 34 Years | 0 (0.0%) | 0 (0.0%) |
| 35 to 64 Years | 0 (0.0%) | 0 (0.0%) |
| 65 to 74 Years | 0 (0.0%) | 0 (0.0%) |
| 75 Years and over | 0 (0.0%) | 0 (0.0%) |
Disability Class: Cognitive Difficulty
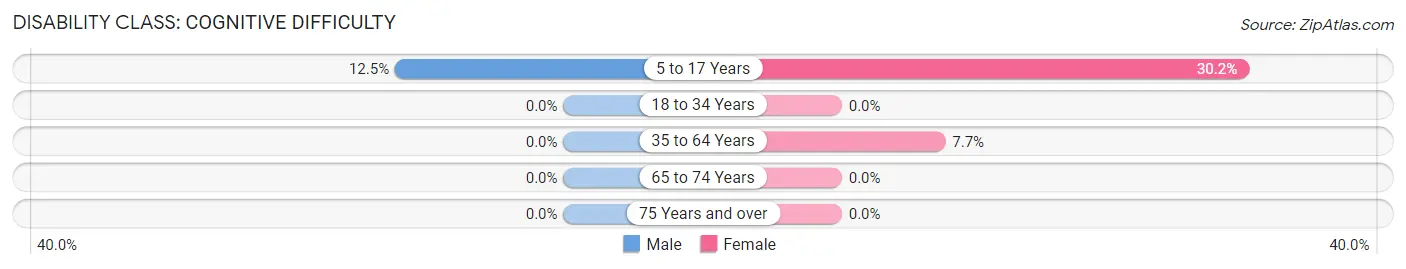
| Age Bracket | Male | Female |
| 5 to 17 Years | 3 (12.5%) | 13 (30.2%) |
| 18 to 34 Years | 0 (0.0%) | 0 (0.0%) |
| 35 to 64 Years | 0 (0.0%) | 6 (7.7%) |
| 65 to 74 Years | 0 (0.0%) | 0 (0.0%) |
| 75 Years and over | 0 (0.0%) | 0 (0.0%) |
Disability Class: Ambulatory Difficulty
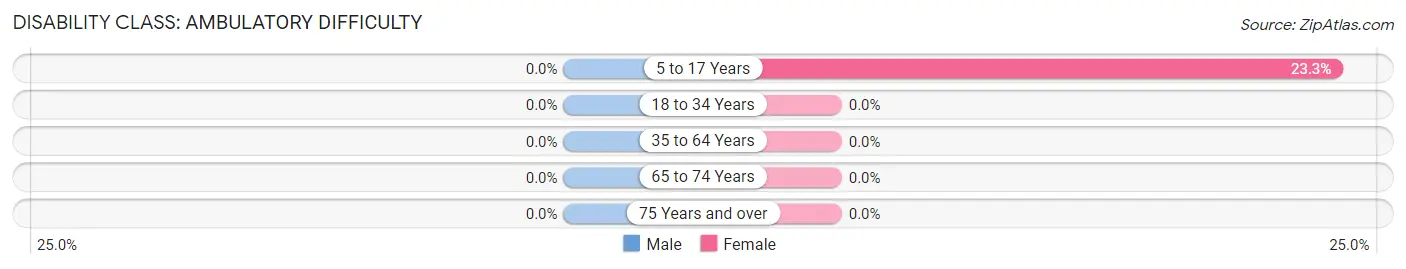
| Age Bracket | Male | Female |
| 5 to 17 Years | 0 (0.0%) | 10 (23.3%) |
| 18 to 34 Years | 0 (0.0%) | 0 (0.0%) |
| 35 to 64 Years | 0 (0.0%) | 0 (0.0%) |
| 65 to 74 Years | 0 (0.0%) | 0 (0.0%) |
| 75 Years and over | 0 (0.0%) | 0 (0.0%) |
Disability Class: Self-Care Difficulty
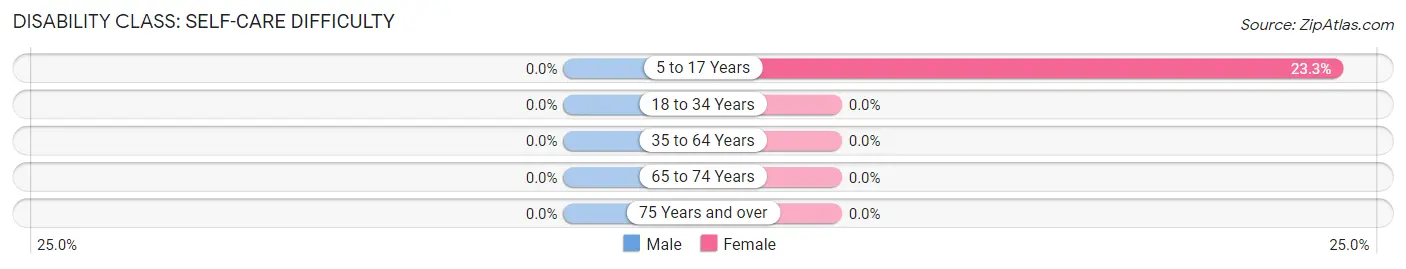
| Age Bracket | Male | Female |
| 5 to 17 Years | 0 (0.0%) | 10 (23.3%) |
| 18 to 34 Years | 0 (0.0%) | 0 (0.0%) |
| 35 to 64 Years | 0 (0.0%) | 0 (0.0%) |
| 65 to 74 Years | 0 (0.0%) | 0 (0.0%) |
| 75 Years and over | 0 (0.0%) | 0 (0.0%) |
Technology Access in Smithville Flats
Computing Device Access in Smithville Flats
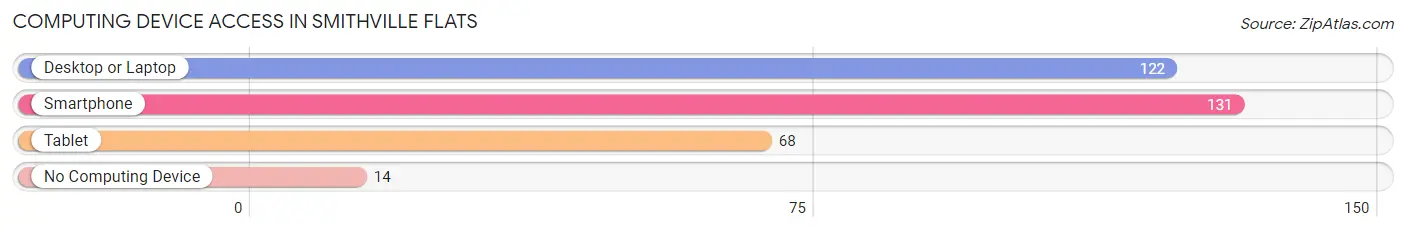
| Device Type | # Households | % Households |
| Desktop or Laptop | 122 | 74.4% |
| Smartphone | 131 | 79.9% |
| Tablet | 68 | 41.5% |
| No Computing Device | 14 | 8.5% |
| Total | 164 | 100.0% |
Internet Access in Smithville Flats
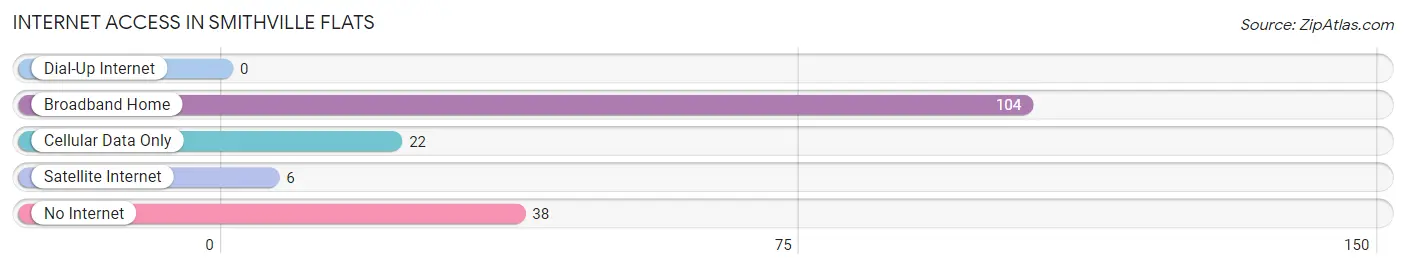
| Internet Type | # Households | % Households |
| Dial-Up Internet | 0 | 0.0% |
| Broadband Home | 104 | 63.4% |
| Cellular Data Only | 22 | 13.4% |
| Satellite Internet | 6 | 3.7% |
| No Internet | 38 | 23.2% |
| Total | 164 | 100.0% |
Smithville Flats Summary
History
The hamlet of Smithville Flats is located in the Town of Smithville in Chenango County, New York. The hamlet was first settled in the early 1800s by a group of settlers from Connecticut. The settlers were attracted to the area due to its fertile soil and abundant natural resources. The hamlet was originally known as “Smith’s Flats” after the first settler, John Smith.
The hamlet was officially incorporated in 1845 and was named after the Smith family. The hamlet was a small farming community and was home to a variety of businesses, including a grist mill, a saw mill, a blacksmith shop, a general store, and a post office.
The hamlet experienced a period of growth in the late 19th century when the railroad was built through the area. The railroad brought new businesses and people to the area, and the hamlet began to grow.
In the early 20th century, the hamlet experienced a period of decline as the railroad was abandoned and the businesses began to close. The hamlet was largely forgotten until the late 20th century when it experienced a resurgence in popularity due to its proximity to the larger cities of Binghamton and Syracuse.
Geography
Smithville Flats is located in the Town of Smithville in Chenango County, New York. The hamlet is situated on the banks of the Chenango River and is surrounded by rolling hills and farmland. The hamlet is located approximately 10 miles south of the City of Binghamton and approximately 30 miles west of the City of Syracuse.
The hamlet is located at an elevation of approximately 1,000 feet above sea level and has a total area of 0.6 square miles. The hamlet is located in a temperate climate zone and experiences four distinct seasons. The average annual temperature is approximately 50 degrees Fahrenheit and the average annual precipitation is approximately 40 inches.
Economy
The economy of Smithville Flats is largely based on agriculture and tourism. The hamlet is home to several small farms that produce a variety of crops, including corn, soybeans, hay, and vegetables. The hamlet is also home to several small businesses, including a general store, a post office, and a few restaurants.
The hamlet is also a popular tourist destination due to its proximity to the larger cities of Binghamton and Syracuse. The hamlet is home to several bed and breakfasts, as well as a few small shops and restaurants. The hamlet is also home to several parks and recreational areas, including the Chenango River State Park and the Smithville Flats Nature Preserve.
Demographics
As of the 2010 census, the population of Smithville Flats was 1,093. The population is largely white (97.2%) and the median age is 43. The median household income is $45,000 and the median home value is $125,000. The hamlet is home to a variety of religious denominations, including Protestant, Catholic, and Jewish.
Conclusion
Smithville Flats is a small hamlet located in Chenango County, New York. The hamlet was first settled in the early 1800s and was officially incorporated in 1845. The hamlet is largely agricultural and is home to several small businesses and tourist attractions. The population of Smithville Flats is largely white and the median age is 43. The hamlet is home to a variety of religious denominations and is a popular tourist destination due to its proximity to the larger cities of Binghamton and Syracuse.
Common Questions
What is Per Capita Income in Smithville Flats?
Per Capita income in Smithville Flats is $38,290.
What is the Median Family Income in Smithville Flats?
Median Family Income in Smithville Flats is $69,063.
What is the Median Household income in Smithville Flats?
Median Household Income in Smithville Flats is $55,938.
What is Income or Wage Gap in Smithville Flats?
Income or Wage Gap in Smithville Flats is 48.7%.
Women in Smithville Flats earn 51.3 cents for every dollar earned by a man.
What is Inequality or Gini Index in Smithville Flats?
Inequality or Gini Index in Smithville Flats is 0.49.
What is the Total Population of Smithville Flats?
Total Population of Smithville Flats is 344.
What is the Total Male Population of Smithville Flats?
Total Male Population of Smithville Flats is 144.
What is the Total Female Population of Smithville Flats?
Total Female Population of Smithville Flats is 200.
What is the Ratio of Males per 100 Females in Smithville Flats?
There are 72.00 Males per 100 Females in Smithville Flats.
What is the Ratio of Females per 100 Males in Smithville Flats?
There are 138.89 Females per 100 Males in Smithville Flats.
What is the Median Population Age in Smithville Flats?
Median Population Age in Smithville Flats is 38.4 Years.
What is the Average Family Size in Smithville Flats
Average Family Size in Smithville Flats is 2.5 People.
What is the Average Household Size in Smithville Flats
Average Household Size in Smithville Flats is 2.1 People.
How Large is the Labor Force in Smithville Flats?
There are 179 People in the Labor Forcein in Smithville Flats.
What is the Percentage of People in the Labor Force in Smithville Flats?
71.0% of People are in the Labor Force in Smithville Flats.
What is the Unemployment Rate in Smithville Flats?
Unemployment Rate in Smithville Flats is 3.9%.