Smyrna, NY Map & Demographics
Smyrna Map
Smyrna Overview
$29,944
PER CAPITA INCOME
$47,500
AVG FAMILY INCOME
$34,464
AVG HOUSEHOLD INCOME
22.3%
WAGE / INCOME GAP [ % ]
77.7¢/ $1
WAGE / INCOME GAP [ $ ]
0.55
INEQUALITY / GINI INDEX
193
TOTAL POPULATION
112
MALE POPULATION
81
FEMALE POPULATION
138.27
MALES / 100 FEMALES
72.32
FEMALES / 100 MALES
40.8
MEDIAN AGE
3.1
AVG FAMILY SIZE
2.2
AVG HOUSEHOLD SIZE
84
LABOR FORCE [ PEOPLE ]
54.5%
PERCENT IN LABOR FORCE
4.8%
UNEMPLOYMENT RATE
Smyrna Zip Codes
Smyrna Area Codes
Income in Smyrna
Income Overview in Smyrna
Per Capita Income in Smyrna is $29,944, while median incomes of families and households are $47,500 and $34,464 respectively.
| Characteristic | Number | Measure |
| Per Capita Income | 193 | $29,944 |
| Median Family Income | 48 | $47,500 |
| Mean Family Income | 48 | $89,527 |
| Median Household Income | 89 | $34,464 |
| Mean Household Income | 89 | $63,175 |
| Income Deficit | 48 | $0 |
| Wage / Income Gap (%) | 193 | 22.32% |
| Wage / Income Gap ($) | 193 | 77.68¢ per $1 |
| Gini / Inequality Index | 193 | 0.55 |
Earnings by Sex in Smyrna
Average Earnings in Smyrna are $32,656, $29,375 for men and $37,813 for women, a difference of 22.3%.
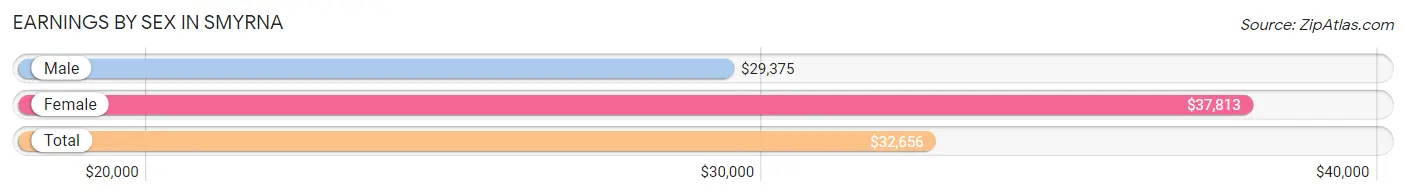
| Sex | Number | Average Earnings |
| Male | 50 (60.2%) | $29,375 |
| Female | 33 (39.8%) | $37,813 |
| Total | 83 (100.0%) | $32,656 |
Earnings by Sex by Income Bracket in Smyrna
The most common earnings brackets in Smyrna are $25,000 to $29,999 for men (17 | 34.0%) and $20,000 to $22,499 for women (9 | 27.3%).
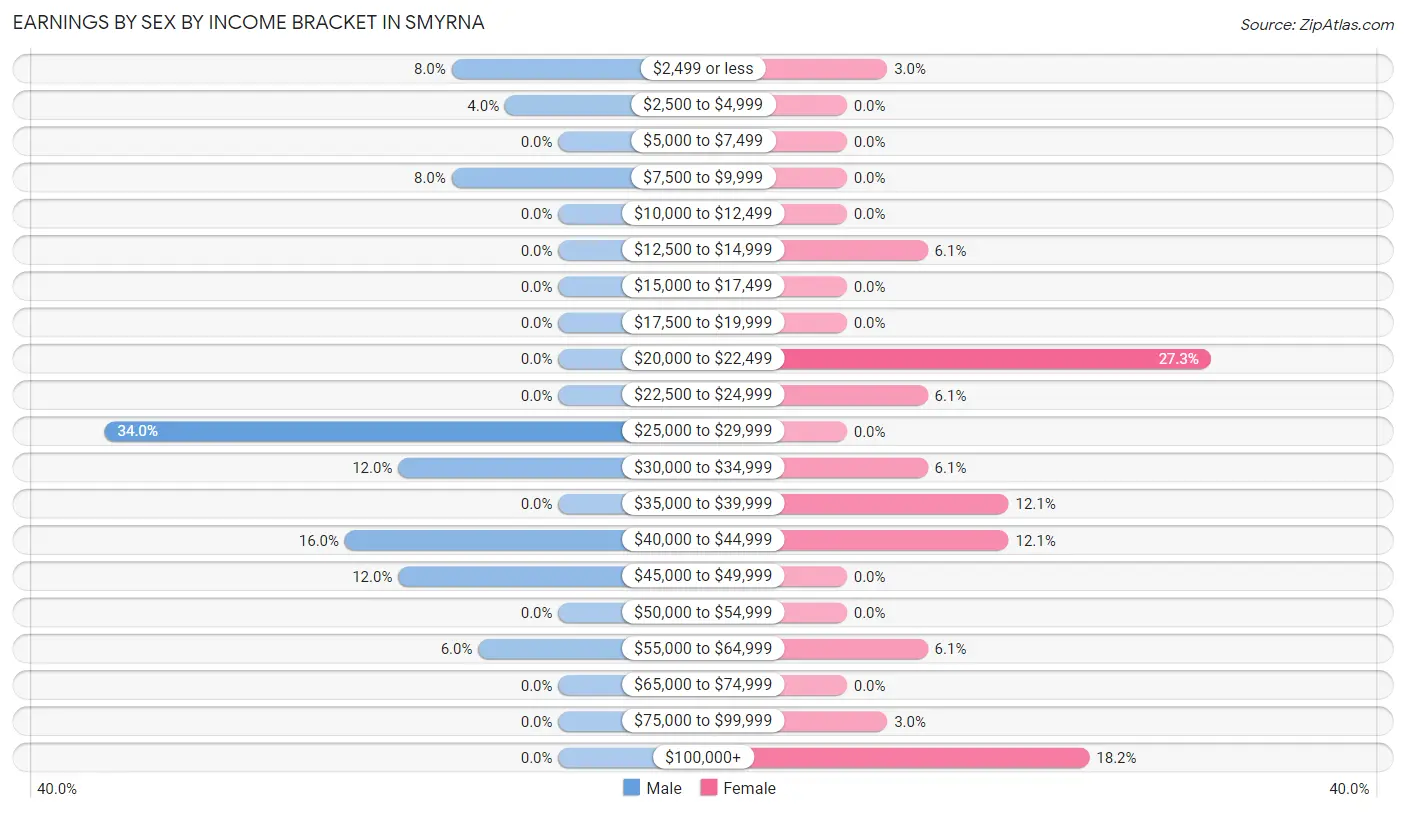
| Income | Male | Female |
| $2,499 or less | 4 (8.0%) | 1 (3.0%) |
| $2,500 to $4,999 | 2 (4.0%) | 0 (0.0%) |
| $5,000 to $7,499 | 0 (0.0%) | 0 (0.0%) |
| $7,500 to $9,999 | 4 (8.0%) | 0 (0.0%) |
| $10,000 to $12,499 | 0 (0.0%) | 0 (0.0%) |
| $12,500 to $14,999 | 0 (0.0%) | 2 (6.1%) |
| $15,000 to $17,499 | 0 (0.0%) | 0 (0.0%) |
| $17,500 to $19,999 | 0 (0.0%) | 0 (0.0%) |
| $20,000 to $22,499 | 0 (0.0%) | 9 (27.3%) |
| $22,500 to $24,999 | 0 (0.0%) | 2 (6.1%) |
| $25,000 to $29,999 | 17 (34.0%) | 0 (0.0%) |
| $30,000 to $34,999 | 6 (12.0%) | 2 (6.1%) |
| $35,000 to $39,999 | 0 (0.0%) | 4 (12.1%) |
| $40,000 to $44,999 | 8 (16.0%) | 4 (12.1%) |
| $45,000 to $49,999 | 6 (12.0%) | 0 (0.0%) |
| $50,000 to $54,999 | 0 (0.0%) | 0 (0.0%) |
| $55,000 to $64,999 | 3 (6.0%) | 2 (6.1%) |
| $65,000 to $74,999 | 0 (0.0%) | 0 (0.0%) |
| $75,000 to $99,999 | 0 (0.0%) | 1 (3.0%) |
| $100,000+ | 0 (0.0%) | 6 (18.2%) |
| Total | 50 (100.0%) | 33 (100.0%) |
Earnings by Sex by Educational Attainment in Smyrna
Average earnings in Smyrna are $29,375 for men and $37,813 for women, a difference of 22.3%. Men with an educational attainment of high school diploma enjoy the highest average annual earnings of $34,167, while those with high school diploma education earn the least with $34,167. Women with an educational attainment of less than high school earn the most with the average annual earnings of $41,250, while those with college or associate's degree education have the smallest earnings of $36,250.
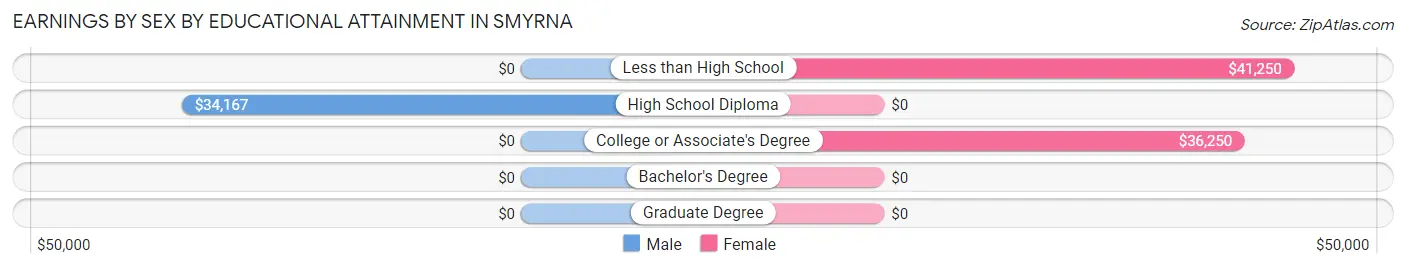
| Educational Attainment | Male Income | Female Income |
| Less than High School | - | - |
| High School Diploma | $34,167 | $0 |
| College or Associate's Degree | - | - |
| Bachelor's Degree | - | - |
| Graduate Degree | - | - |
| Total | $29,375 | $37,813 |
Family Income in Smyrna
Family Income Brackets in Smyrna
According to the Smyrna family income data, there are 17 families falling into the $35,000 to $49,999 income range, which is the most common income bracket and makes up 35.4% of all families.
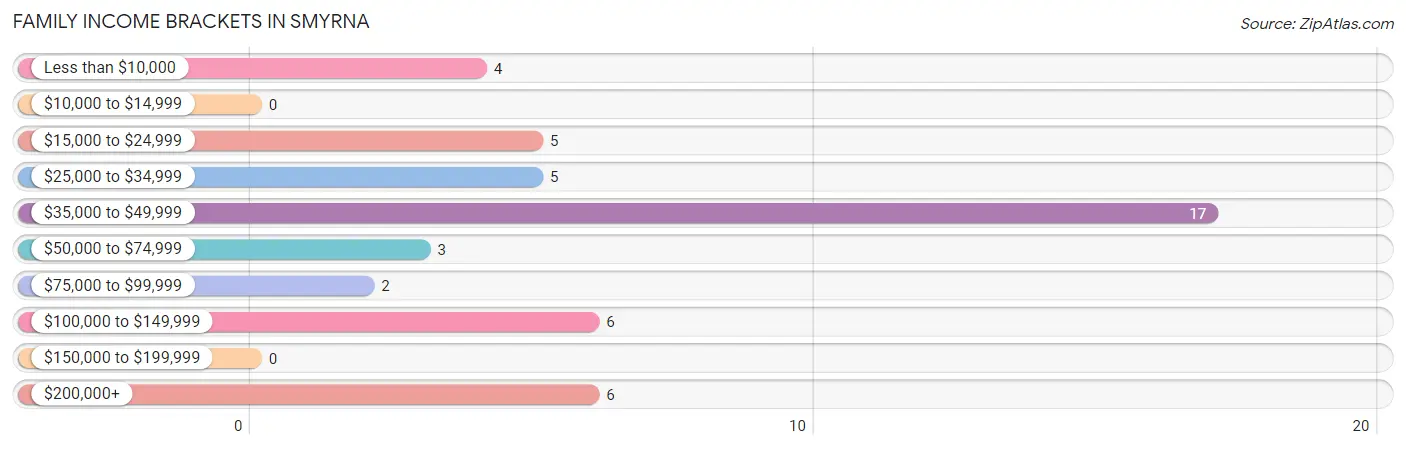
| Income Bracket | # Families | % Families |
| Less than $10,000 | 4 | 8.3% |
| $10,000 to $14,999 | 0 | 0.0% |
| $15,000 to $24,999 | 5 | 10.4% |
| $25,000 to $34,999 | 5 | 10.4% |
| $35,000 to $49,999 | 17 | 35.4% |
| $50,000 to $74,999 | 3 | 6.3% |
| $75,000 to $99,999 | 2 | 4.2% |
| $100,000 to $149,999 | 6 | 12.5% |
| $150,000 to $199,999 | 0 | 0.0% |
| $200,000+ | 6 | 12.5% |
Family Income by Famaliy Size in Smyrna
2-person families (26 | 54.2%) account for the highest median family income in Smyrna with $45,625 per family, while 2-person families (26 | 54.2%) have the highest median income of $22,812 per family member.
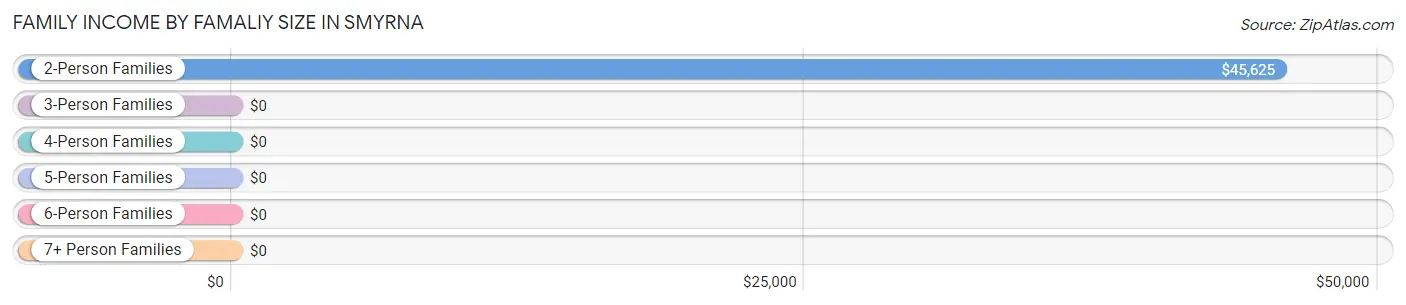
| Income Bracket | # Families | Median Income |
| 2-Person Families | 26 (54.2%) | $45,625 |
| 3-Person Families | 7 (14.6%) | $0 |
| 4-Person Families | 0 (0.0%) | $0 |
| 5-Person Families | 6 (12.5%) | $0 |
| 6-Person Families | 9 (18.8%) | $0 |
| 7+ Person Families | 0 (0.0%) | $0 |
| Total | 48 (100.0%) | $47,500 |
Family Income by Number of Earners in Smyrna
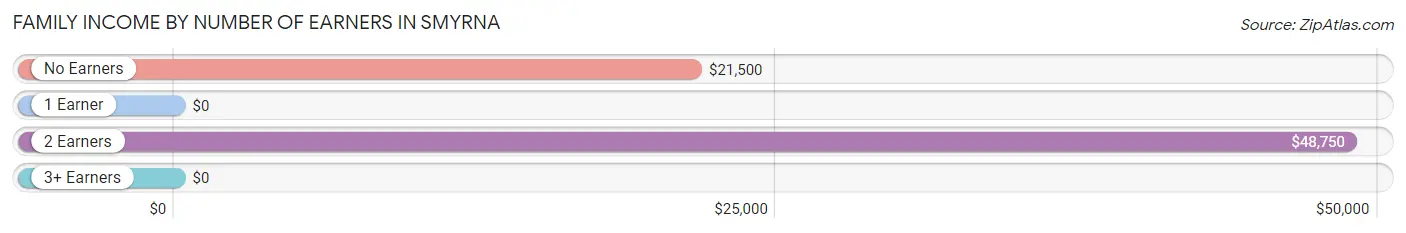
| Number of Earners | # Families | Median Income |
| No Earners | 14 (29.2%) | $21,500 |
| 1 Earner | 14 (29.2%) | $0 |
| 2 Earners | 15 (31.2%) | $48,750 |
| 3+ Earners | 5 (10.4%) | $0 |
| Total | 48 (100.0%) | $47,500 |
Household Income in Smyrna
Household Income Brackets in Smyrna
With 22 households falling in the category, the $35,000 to $49,999 income range is the most frequent in Smyrna, accounting for 24.7% of all households. In contrast, only 2 households (2.2%) fall into the $75,000 to $99,999 income bracket, making it the least populous group.
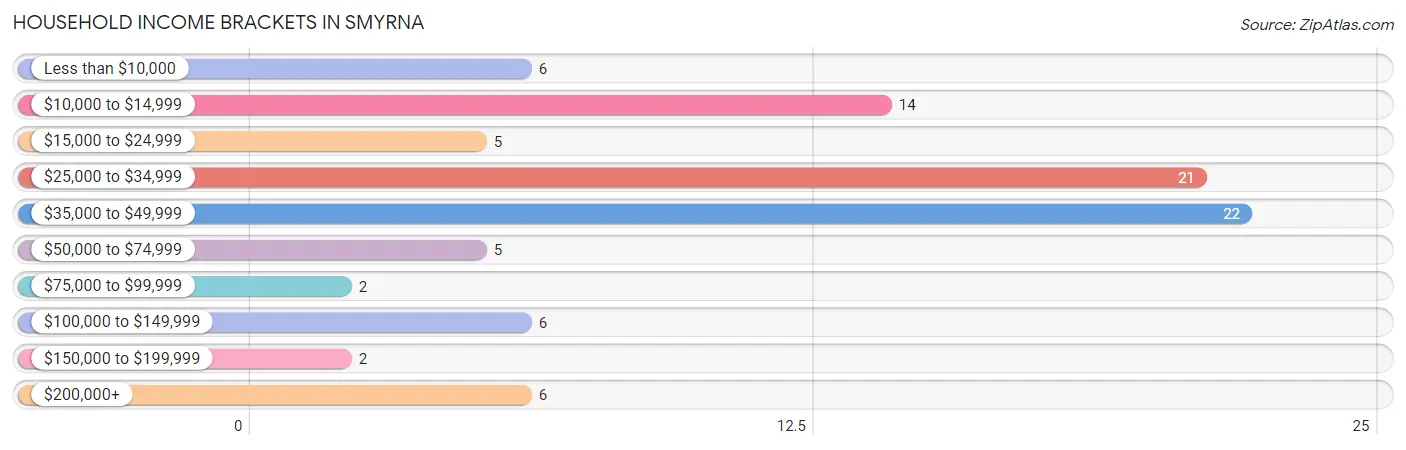
| Income Bracket | # Households | % Households |
| Less than $10,000 | 6 | 6.7% |
| $10,000 to $14,999 | 14 | 15.7% |
| $15,000 to $24,999 | 5 | 5.6% |
| $25,000 to $34,999 | 21 | 23.6% |
| $35,000 to $49,999 | 22 | 24.7% |
| $50,000 to $74,999 | 5 | 5.6% |
| $75,000 to $99,999 | 2 | 2.2% |
| $100,000 to $149,999 | 6 | 6.7% |
| $150,000 to $199,999 | 2 | 2.2% |
| $200,000+ | 6 | 6.7% |
Household Income by Householder Age in Smyrna
The median household income in Smyrna is $34,464, with the highest median household income of $33,958 found in the 45 to 64 years age bracket for the primary householder. A total of 33 households (37.1%) fall into this category. Meanwhile, the 15 to 24 years age bracket for the primary householder has the lowest median household income of $0, with 6 households (6.7%) in this group.
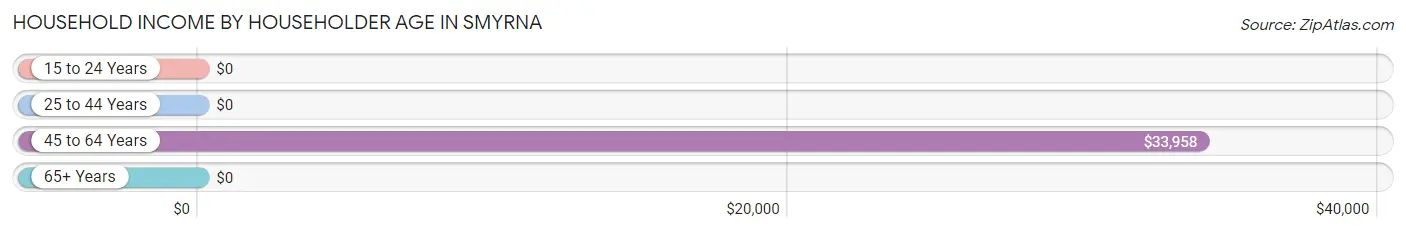
| Income Bracket | # Households | Median Income |
| 15 to 24 Years | 6 (6.7%) | $0 |
| 25 to 44 Years | 24 (27.0%) | $0 |
| 45 to 64 Years | 33 (37.1%) | $33,958 |
| 65+ Years | 26 (29.2%) | $0 |
| Total | 89 (100.0%) | $34,464 |
Poverty in Smyrna
Income Below Poverty by Sex and Age in Smyrna
With 14.3% poverty level for males and 19.8% for females among the residents of Smyrna, 6 to 11 year old males and 75 year old and over females are the most vulnerable to poverty, with 4 males (100.0%) and 8 females (61.5%) in their respective age groups living below the poverty level.
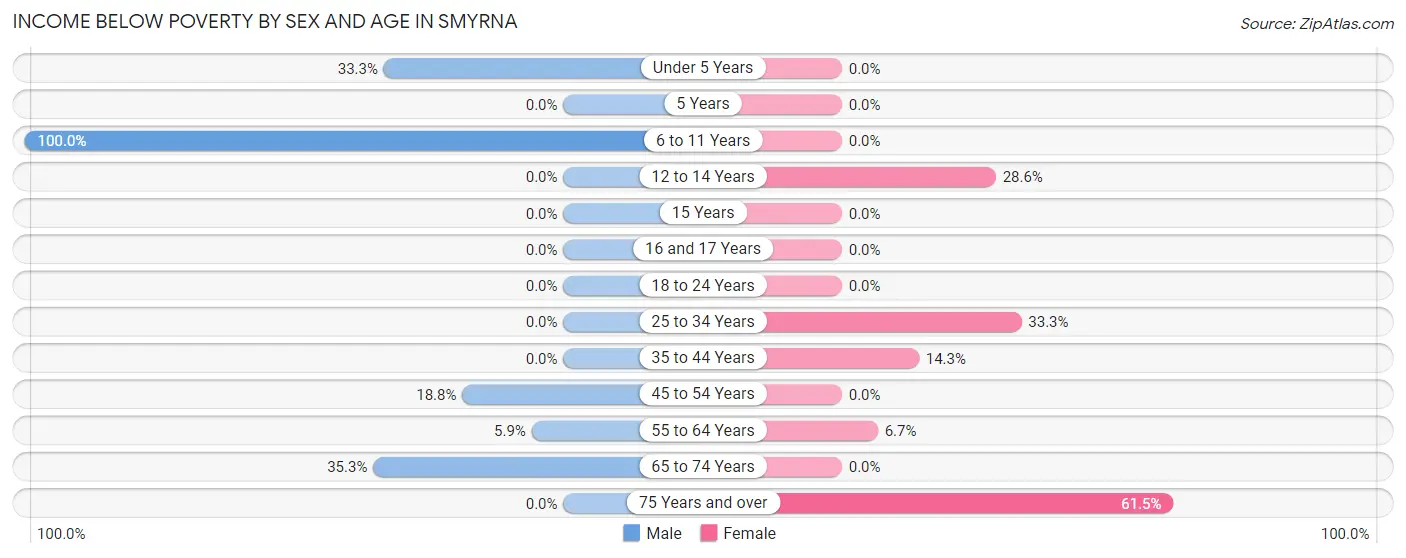
| Age Bracket | Male | Female |
| Under 5 Years | 2 (33.3%) | 0 (0.0%) |
| 5 Years | 0 (0.0%) | 0 (0.0%) |
| 6 to 11 Years | 4 (100.0%) | 0 (0.0%) |
| 12 to 14 Years | 0 (0.0%) | 2 (28.6%) |
| 15 Years | 0 (0.0%) | 0 (0.0%) |
| 16 and 17 Years | 0 (0.0%) | 0 (0.0%) |
| 18 to 24 Years | 0 (0.0%) | 0 (0.0%) |
| 25 to 34 Years | 0 (0.0%) | 3 (33.3%) |
| 35 to 44 Years | 0 (0.0%) | 2 (14.3%) |
| 45 to 54 Years | 3 (18.8%) | 0 (0.0%) |
| 55 to 64 Years | 1 (5.9%) | 1 (6.7%) |
| 65 to 74 Years | 6 (35.3%) | 0 (0.0%) |
| 75 Years and over | 0 (0.0%) | 8 (61.5%) |
| Total | 16 (14.3%) | 16 (19.8%) |
Income Above Poverty by Sex and Age in Smyrna
According to the poverty statistics in Smyrna, males aged 5 years and females aged under 5 years are the age groups that are most secure financially, with 100.0% of males and 100.0% of females in these age groups living above the poverty line.
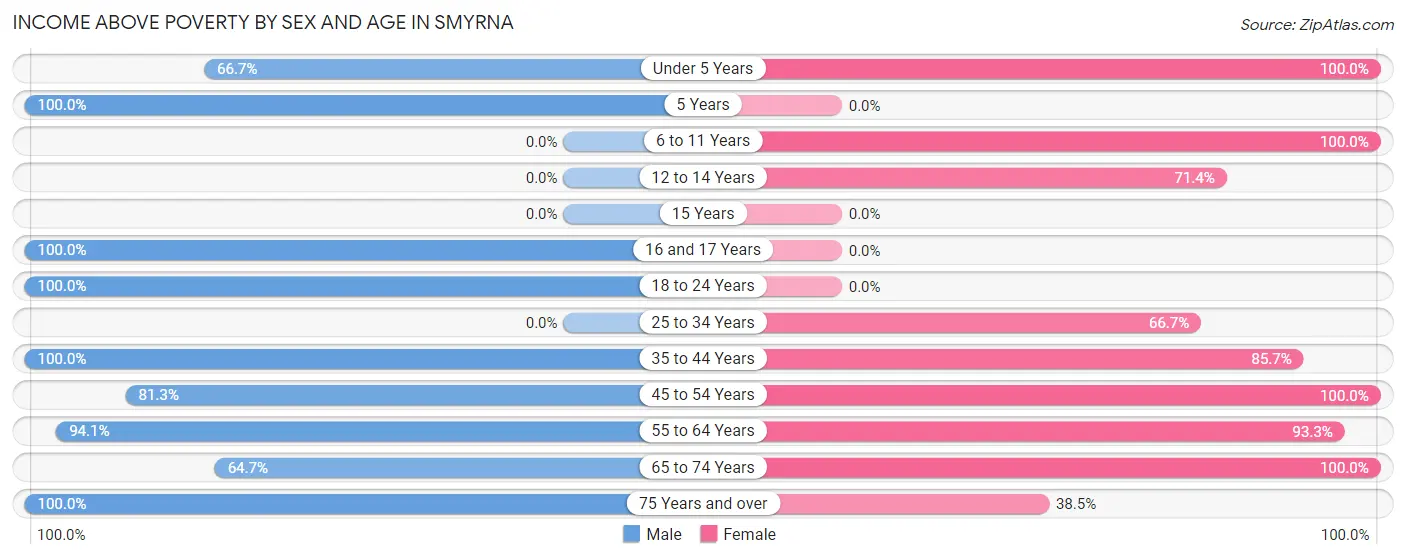
| Age Bracket | Male | Female |
| Under 5 Years | 4 (66.7%) | 8 (100.0%) |
| 5 Years | 5 (100.0%) | 0 (0.0%) |
| 6 to 11 Years | 0 (0.0%) | 9 (100.0%) |
| 12 to 14 Years | 0 (0.0%) | 5 (71.4%) |
| 15 Years | 0 (0.0%) | 0 (0.0%) |
| 16 and 17 Years | 5 (100.0%) | 0 (0.0%) |
| 18 to 24 Years | 21 (100.0%) | 0 (0.0%) |
| 25 to 34 Years | 0 (0.0%) | 6 (66.7%) |
| 35 to 44 Years | 18 (100.0%) | 12 (85.7%) |
| 45 to 54 Years | 13 (81.2%) | 5 (100.0%) |
| 55 to 64 Years | 16 (94.1%) | 14 (93.3%) |
| 65 to 74 Years | 11 (64.7%) | 1 (100.0%) |
| 75 Years and over | 3 (100.0%) | 5 (38.5%) |
| Total | 96 (85.7%) | 65 (80.2%) |
Income Below Poverty Among Married-Couple Families in Smyrna
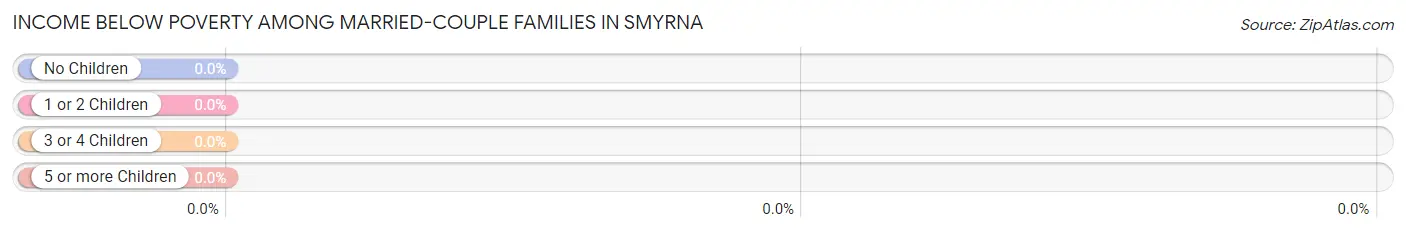
| Children | Above Poverty | Below Poverty |
| No Children | 25 (100.0%) | 0 (0.0%) |
| 1 or 2 Children | 3 (100.0%) | 0 (0.0%) |
| 3 or 4 Children | 2 (100.0%) | 0 (0.0%) |
| 5 or more Children | 0 (0.0%) | 0 (0.0%) |
| Total | 30 (100.0%) | 0 (0.0%) |
Income Below Poverty Among Single-Parent Households in Smyrna
According to the poverty data in Smyrna, 11.1% or 1 single-father households and 33.3% or 3 single-mother households are living below the poverty line. Among single-father households, those with no children have the highest poverty rate, with 1 households (33.3%) experiencing poverty. Likewise, among single-mother households, those with no children have the highest poverty rate, with 1 households (100.0%) falling below the poverty line.
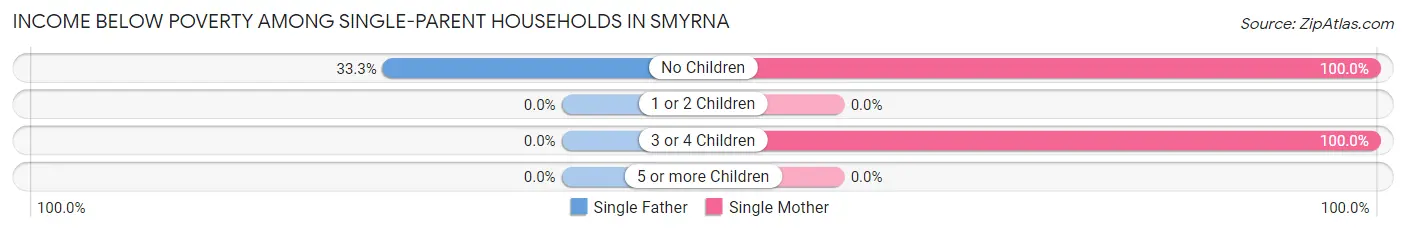
| Children | Single Father | Single Mother |
| No Children | 1 (33.3%) | 1 (100.0%) |
| 1 or 2 Children | 0 (0.0%) | 0 (0.0%) |
| 3 or 4 Children | 0 (0.0%) | 2 (100.0%) |
| 5 or more Children | 0 (0.0%) | 0 (0.0%) |
| Total | 1 (11.1%) | 3 (33.3%) |
Income Below Poverty Among Married-Couple vs Single-Parent Households in Smyrna
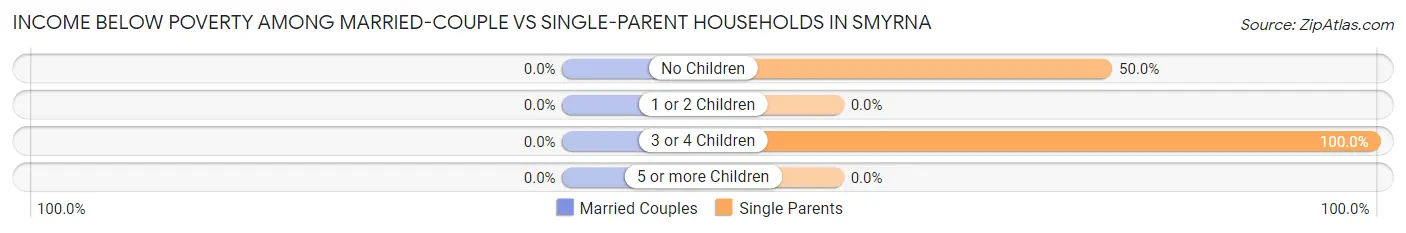
| Children | Married-Couple Families | Single-Parent Households |
| No Children | 0 (0.0%) | 2 (50.0%) |
| 1 or 2 Children | 0 (0.0%) | 0 (0.0%) |
| 3 or 4 Children | 0 (0.0%) | 2 (100.0%) |
| 5 or more Children | 0 (0.0%) | 0 (0.0%) |
| Total | 0 (0.0%) | 4 (22.2%) |
Race in Smyrna
The most populous races in Smyrna are White / Caucasian (188 | 97.4%), and Two or more Races (5 | 2.6%).
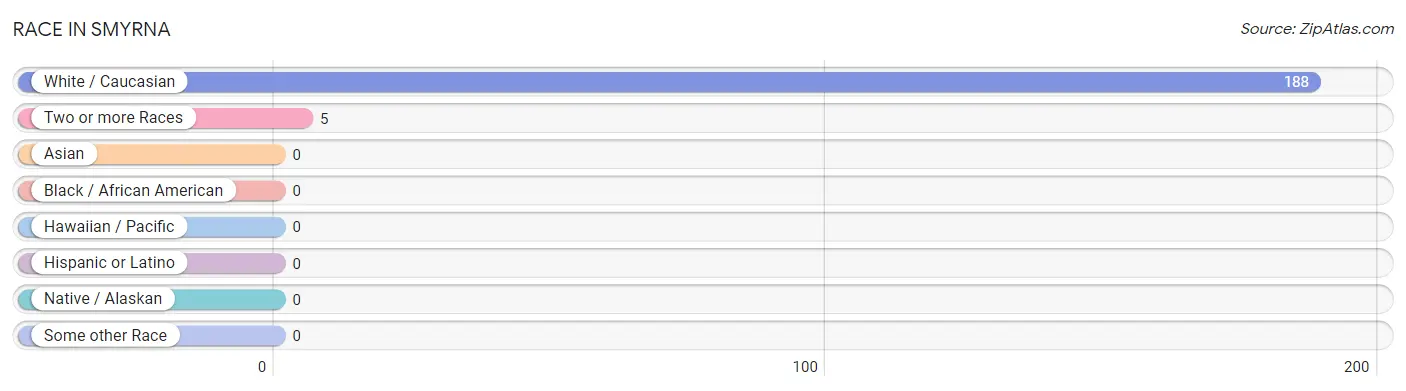
| Race | # Population | % Population |
| Asian | 0 | 0.0% |
| Black / African American | 0 | 0.0% |
| Hawaiian / Pacific | 0 | 0.0% |
| Hispanic or Latino | 0 | 0.0% |
| Native / Alaskan | 0 | 0.0% |
| White / Caucasian | 188 | 97.4% |
| Two or more Races | 5 | 2.6% |
| Some other Race | 0 | 0.0% |
| Total | 193 | 100.0% |
Ancestry in Smyrna
The most populous ancestries reported in Smyrna are English (24 | 12.4%), Scottish (20 | 10.4%), Irish (16 | 8.3%), American (11 | 5.7%), and Welsh (10 | 5.2%), together accounting for 42.0% of all Smyrna residents.
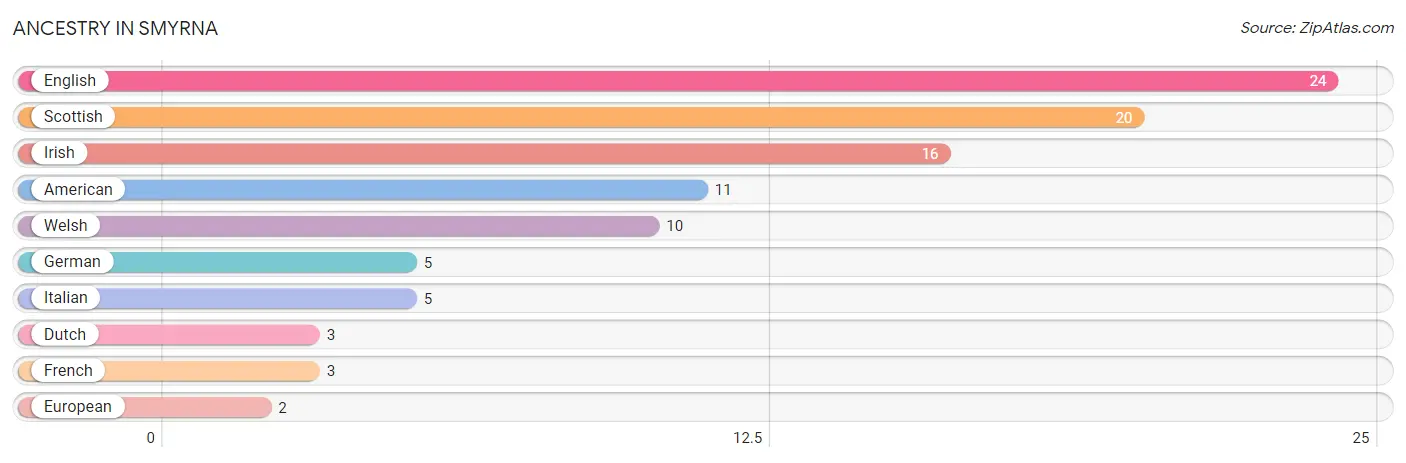
| Ancestry | # Population | % Population |
| American | 11 | 5.7% |
| Dutch | 3 | 1.5% |
| English | 24 | 12.4% |
| European | 2 | 1.0% |
| French | 3 | 1.5% |
| German | 5 | 2.6% |
| Irish | 16 | 8.3% |
| Italian | 5 | 2.6% |
| Scottish | 20 | 10.4% |
| Welsh | 10 | 5.2% | View All 10 Rows |
Immigrants in Smyrna

| Immigration Origin | # Population | % Population | View All 0 Rows |
Sex and Age in Smyrna
Sex and Age in Smyrna
The most populous age groups in Smyrna are 15 to 19 Years (20 | 17.9%) for men and 10 to 14 Years (15 | 18.5%) for women.
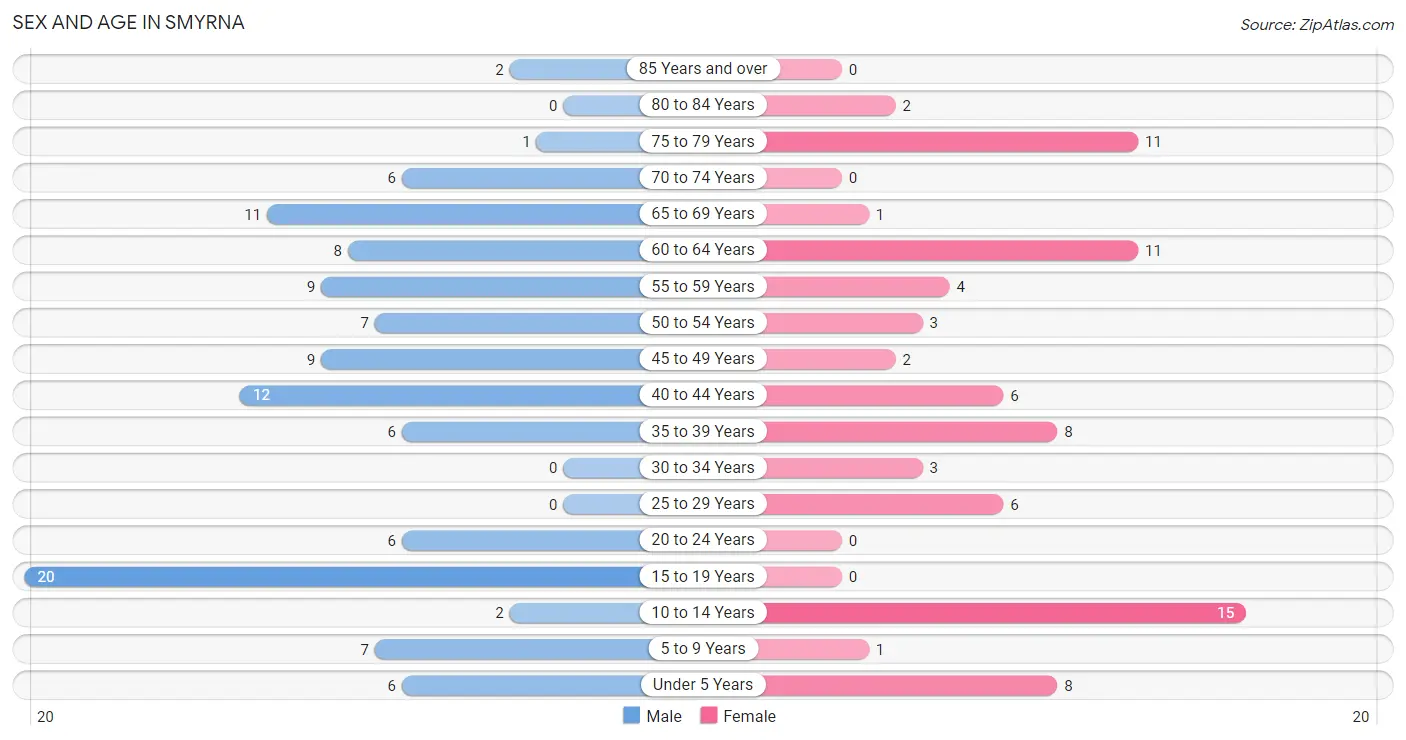
| Age Bracket | Male | Female |
| Under 5 Years | 6 (5.4%) | 8 (9.9%) |
| 5 to 9 Years | 7 (6.2%) | 1 (1.2%) |
| 10 to 14 Years | 2 (1.8%) | 15 (18.5%) |
| 15 to 19 Years | 20 (17.9%) | 0 (0.0%) |
| 20 to 24 Years | 6 (5.4%) | 0 (0.0%) |
| 25 to 29 Years | 0 (0.0%) | 6 (7.4%) |
| 30 to 34 Years | 0 (0.0%) | 3 (3.7%) |
| 35 to 39 Years | 6 (5.4%) | 8 (9.9%) |
| 40 to 44 Years | 12 (10.7%) | 6 (7.4%) |
| 45 to 49 Years | 9 (8.0%) | 2 (2.5%) |
| 50 to 54 Years | 7 (6.2%) | 3 (3.7%) |
| 55 to 59 Years | 9 (8.0%) | 4 (4.9%) |
| 60 to 64 Years | 8 (7.1%) | 11 (13.6%) |
| 65 to 69 Years | 11 (9.8%) | 1 (1.2%) |
| 70 to 74 Years | 6 (5.4%) | 0 (0.0%) |
| 75 to 79 Years | 1 (0.9%) | 11 (13.6%) |
| 80 to 84 Years | 0 (0.0%) | 2 (2.5%) |
| 85 Years and over | 2 (1.8%) | 0 (0.0%) |
| Total | 112 (100.0%) | 81 (100.0%) |
Families and Households in Smyrna
Median Family Size in Smyrna
The median family size in Smyrna is 3.10 persons per family, with single female/mother families (9 | 18.8%) accounting for the largest median family size of 4.56 persons per family. On the other hand, married-couple families (30 | 62.5%) represent the smallest median family size with 2.73 persons per family.
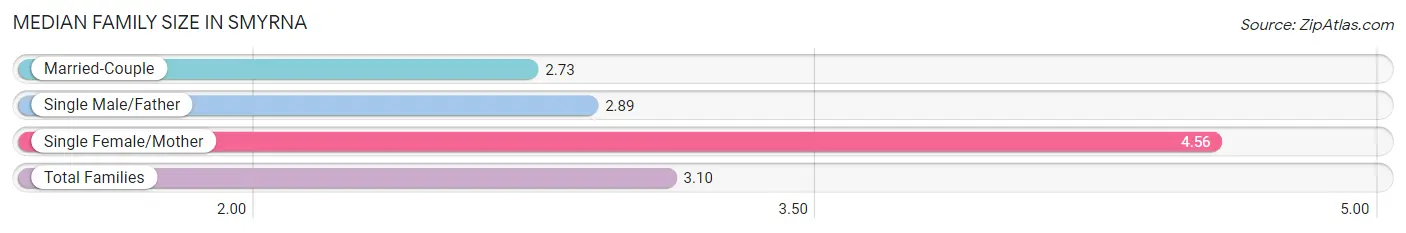
| Family Type | # Families | Family Size |
| Married-Couple | 30 (62.5%) | 2.73 |
| Single Male/Father | 9 (18.8%) | 2.89 |
| Single Female/Mother | 9 (18.8%) | 4.56 |
| Total Families | 48 (100.0%) | 3.10 |
Median Household Size in Smyrna
The median household size in Smyrna is 2.17 persons per household, with single female/mother households (9 | 10.1%) accounting for the largest median household size of 4.56 persons per household. non-family households (41 | 46.1%) represent the smallest median household size with 1.05 persons per household.
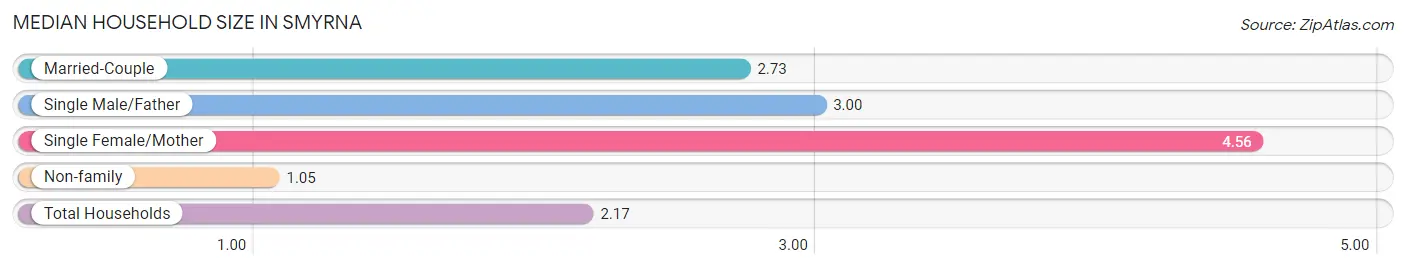
| Household Type | # Households | Household Size |
| Married-Couple | 30 (33.7%) | 2.73 |
| Single Male/Father | 9 (10.1%) | 3.00 |
| Single Female/Mother | 9 (10.1%) | 4.56 |
| Non-family | 41 (46.1%) | 1.05 |
| Total Households | 89 (100.0%) | 2.17 |
Household Size by Marriage Status in Smyrna
Out of a total of 89 households in Smyrna, 48 (53.9%) are family households, while 41 (46.1%) are nonfamily households. The most numerous type of family households are 2-person households, comprising 25, and the most common type of nonfamily households are 1-person households, comprising 39.
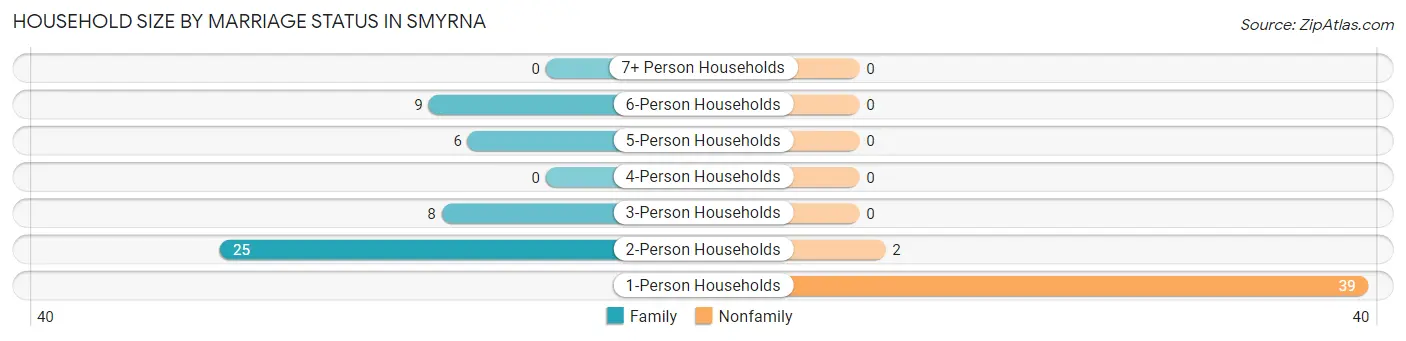
| Household Size | Family Households | Nonfamily Households |
| 1-Person Households | - | 39 (43.8%) |
| 2-Person Households | 25 (28.1%) | 2 (2.2%) |
| 3-Person Households | 8 (9.0%) | 0 (0.0%) |
| 4-Person Households | 0 (0.0%) | 0 (0.0%) |
| 5-Person Households | 6 (6.7%) | 0 (0.0%) |
| 6-Person Households | 9 (10.1%) | 0 (0.0%) |
| 7+ Person Households | 0 (0.0%) | 0 (0.0%) |
| Total | 48 (53.9%) | 41 (46.1%) |
Female Fertility in Smyrna
Fertility by Age in Smyrna
| Age Bracket | Women with Births | Births / 1,000 Women |
| 15 to 19 years | 0 (0.0%) | 0.0 |
| 20 to 34 years | 0 (0.0%) | 0.0 |
| 35 to 50 years | 0 (0.0%) | 0.0 |
| Total | 0 (0.0%) | 0.0 |
Fertility by Age by Marriage Status in Smyrna
| Age Bracket | Married | Unmarried |
| 15 to 19 years | 0 (0.0%) | 0 (0.0%) |
| 20 to 34 years | 0 (0.0%) | 0 (0.0%) |
| 35 to 50 years | 0 (0.0%) | 0 (0.0%) |
| Total | 0 (0.0%) | 0 (0.0%) |
Fertility by Education in Smyrna
| Educational Attainment | Women with Births | Births / 1,000 Women |
| Less than High School | 0 (0.0%) | 0.0 |
| High School Diploma | 0 (0.0%) | 0.0 |
| College or Associate's Degree | 0 (0.0%) | 0.0 |
| Bachelor's Degree | 0 (0.0%) | 0.0 |
| Graduate Degree | 0 (0.0%) | 0.0 |
| Total | 0 (0.0%) | 0.0 |
Fertility by Education by Marriage Status in Smyrna
| Educational Attainment | Married | Unmarried |
| Less than High School | 0 (0.0%) | 0 (0.0%) |
| High School Diploma | 0 (0.0%) | 0 (0.0%) |
| College or Associate's Degree | 0 (0.0%) | 0 (0.0%) |
| Bachelor's Degree | 0 (0.0%) | 0 (0.0%) |
| Graduate Degree | 0 (0.0%) | 0 (0.0%) |
| Total | 0 (0.0%) | 0 (0.0%) |
Employment Characteristics in Smyrna
Employment by Class of Employer in Smyrna
Among the 80 employed individuals in Smyrna, private company employees (64 | 80.0%), not-for-profit organizations (10 | 12.5%), and self-employed (incorporated) (5 | 6.2%) make up the most common classes of employment.
| Employer Class | # Employees | % Employees |
| Private Company Employees | 64 | 80.0% |
| Self-Employed (Incorporated) | 5 | 6.2% |
| Self-Employed (Not Incorporated) | 0 | 0.0% |
| Not-for-profit Organizations | 10 | 12.5% |
| Local Government Employees | 1 | 1.3% |
| State Government Employees | 0 | 0.0% |
| Federal Government Employees | 0 | 0.0% |
| Unpaid Family Workers | 0 | 0.0% |
| Total | 80 | 100.0% |
Employment Status by Age in Smyrna
According to the labor force statistics for Smyrna, out of the total population over 16 years of age (154), 54.5% or 84 individuals are in the labor force, with 4.8% or 4 of them unemployed. The age group with the highest labor force participation rate is 20 to 24 years, with 100.0% or 6 individuals in the labor force. Within the labor force, the 16 to 19 years age range has the highest percentage of unemployed individuals, with 50.0% or 4 of them being unemployed.
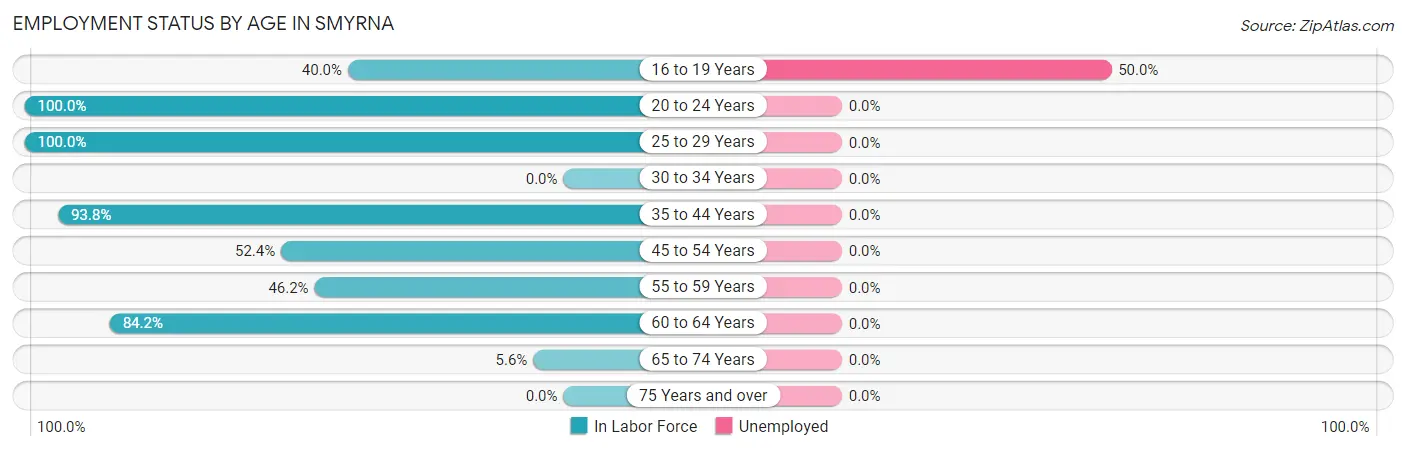
| Age Bracket | In Labor Force | Unemployed |
| 16 to 19 Years | 8 (40.0%) | 4 (50.0%) |
| 20 to 24 Years | 6 (100.0%) | 0 (0.0%) |
| 25 to 29 Years | 6 (100.0%) | 0 (0.0%) |
| 30 to 34 Years | 0 (0.0%) | 0 (0.0%) |
| 35 to 44 Years | 30 (93.8%) | 0 (0.0%) |
| 45 to 54 Years | 11 (52.4%) | 0 (0.0%) |
| 55 to 59 Years | 6 (46.2%) | 0 (0.0%) |
| 60 to 64 Years | 16 (84.2%) | 0 (0.0%) |
| 65 to 74 Years | 1 (5.6%) | 0 (0.0%) |
| 75 Years and over | 0 (0.0%) | 0 (0.0%) |
| Total | 84 (54.5%) | 4 (4.8%) |
Employment Status by Educational Attainment in Smyrna
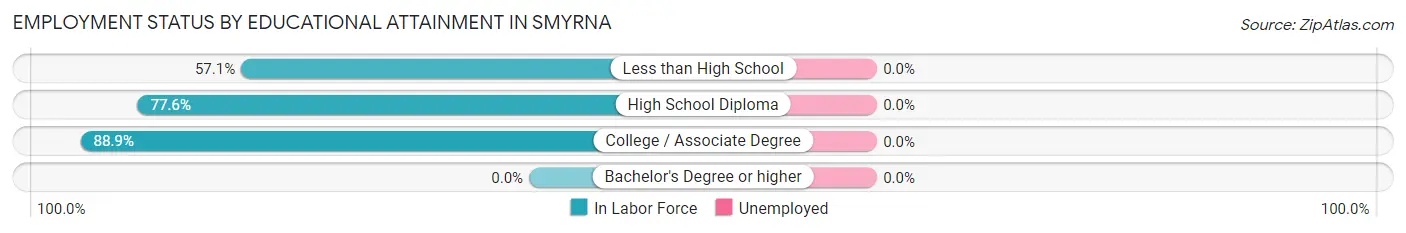
| Educational Attainment | In Labor Force | Unemployed |
| Less than High School | 8 (57.1%) | 0 (0.0%) |
| High School Diploma | 45 (77.6%) | 0 (0.0%) |
| College / Associate Degree | 16 (88.9%) | 0 (0.0%) |
| Bachelor's Degree or higher | 0 (0.0%) | 0 (0.0%) |
| Total | 69 (73.4%) | 0 (0.0%) |
Employment Occupations by Sex in Smyrna
Management, Business, Science and Arts Occupations
The most common Management, Business, Science and Arts occupations in Smyrna are Community & Social Service (7 | 8.7%), Education, Arts & Media (7 | 8.7%), Health Diagnosing & Treating (4 | 5.0%), Health Technologists (4 | 5.0%), and Business & Financial (2 | 2.5%).
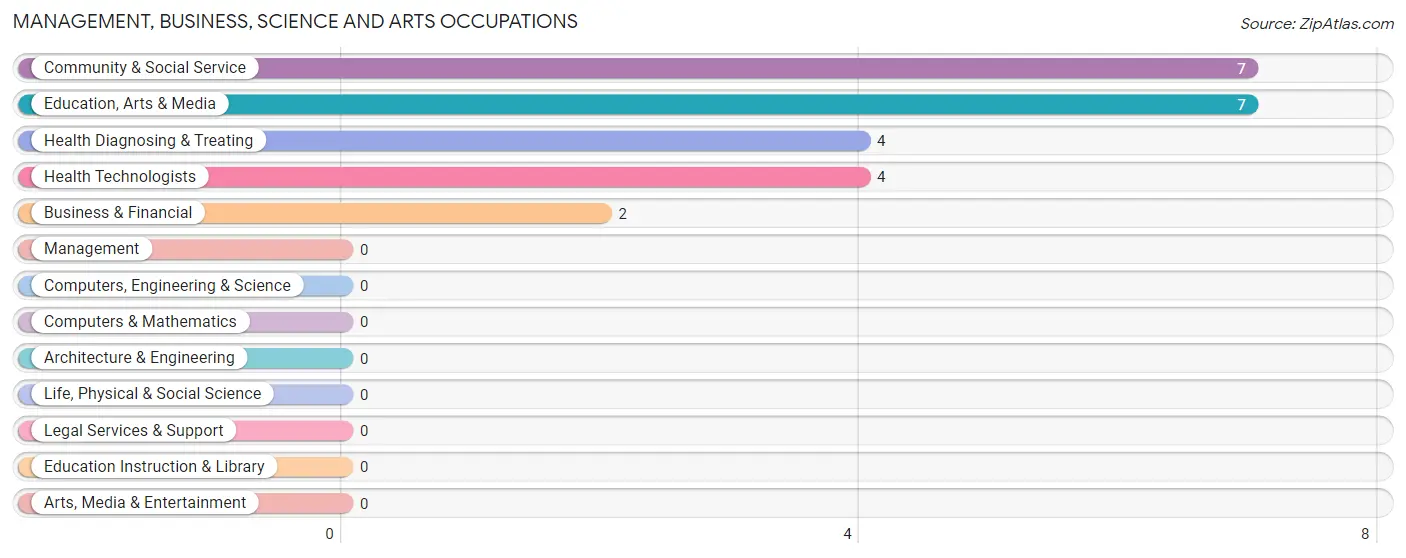
Management, Business, Science and Arts Occupations by Sex
Within the Management, Business, Science and Arts occupations in Smyrna, the most male-oriented occupations are Community & Social Service (100.0%), and Education, Arts & Media (100.0%), while the most female-oriented occupations are Business & Financial (100.0%), Health Diagnosing & Treating (100.0%), and Health Technologists (100.0%).
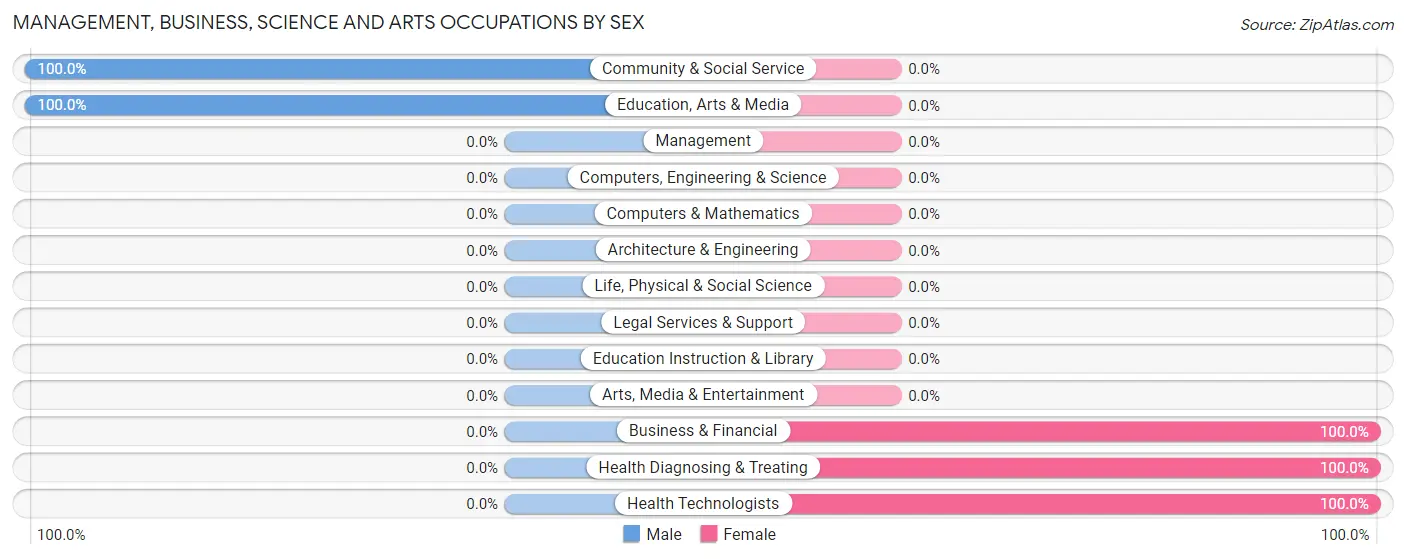
| Occupation | Male | Female |
| Management | 0 (0.0%) | 0 (0.0%) |
| Business & Financial | 0 (0.0%) | 2 (100.0%) |
| Computers, Engineering & Science | 0 (0.0%) | 0 (0.0%) |
| Computers & Mathematics | 0 (0.0%) | 0 (0.0%) |
| Architecture & Engineering | 0 (0.0%) | 0 (0.0%) |
| Life, Physical & Social Science | 0 (0.0%) | 0 (0.0%) |
| Community & Social Service | 7 (100.0%) | 0 (0.0%) |
| Education, Arts & Media | 7 (100.0%) | 0 (0.0%) |
| Legal Services & Support | 0 (0.0%) | 0 (0.0%) |
| Education Instruction & Library | 0 (0.0%) | 0 (0.0%) |
| Arts, Media & Entertainment | 0 (0.0%) | 0 (0.0%) |
| Health Diagnosing & Treating | 0 (0.0%) | 4 (100.0%) |
| Health Technologists | 0 (0.0%) | 4 (100.0%) |
| Total (Category) | 7 (53.8%) | 6 (46.2%) |
| Total (Overall) | 48 (60.0%) | 32 (40.0%) |
Services Occupations
The most common Services occupations in Smyrna are Cleaning & Maintenance (13 | 16.3%), Healthcare Support (7 | 8.7%), and Food Preparation & Serving (2 | 2.5%).
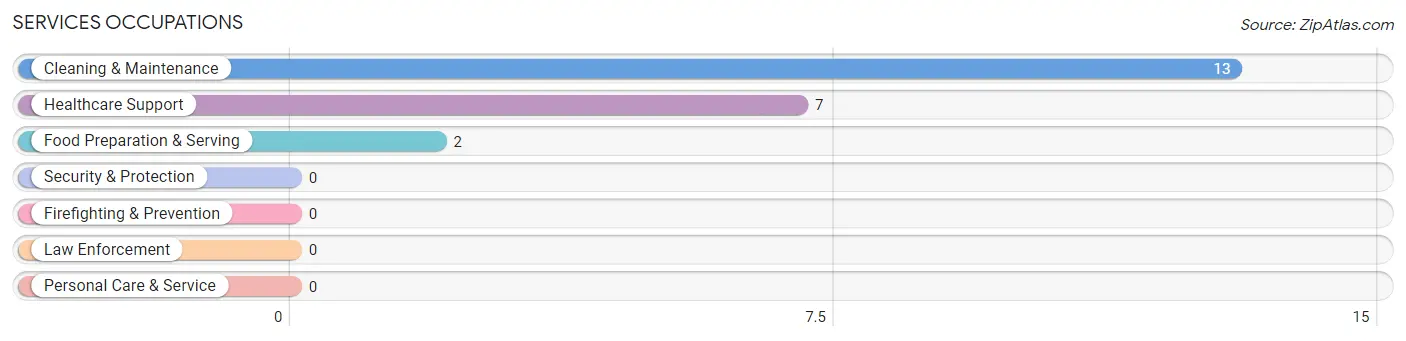
Services Occupations by Sex
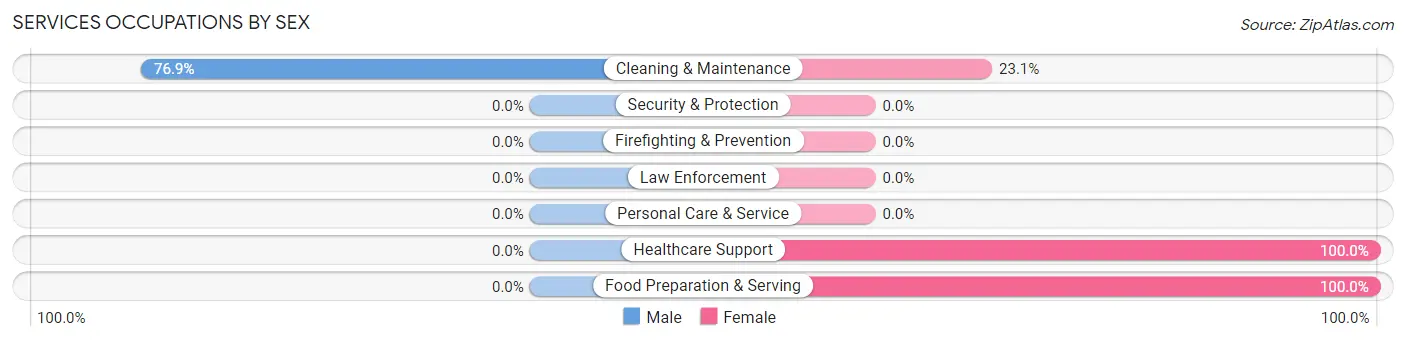
| Occupation | Male | Female |
| Healthcare Support | 0 (0.0%) | 7 (100.0%) |
| Security & Protection | 0 (0.0%) | 0 (0.0%) |
| Firefighting & Prevention | 0 (0.0%) | 0 (0.0%) |
| Law Enforcement | 0 (0.0%) | 0 (0.0%) |
| Food Preparation & Serving | 0 (0.0%) | 2 (100.0%) |
| Cleaning & Maintenance | 10 (76.9%) | 3 (23.1%) |
| Personal Care & Service | 0 (0.0%) | 0 (0.0%) |
| Total (Category) | 10 (45.5%) | 12 (54.5%) |
| Total (Overall) | 48 (60.0%) | 32 (40.0%) |
Sales and Office Occupations
The most common Sales and Office occupations in Smyrna are Sales & Related (14 | 17.5%), and Office & Administration (2 | 2.5%).
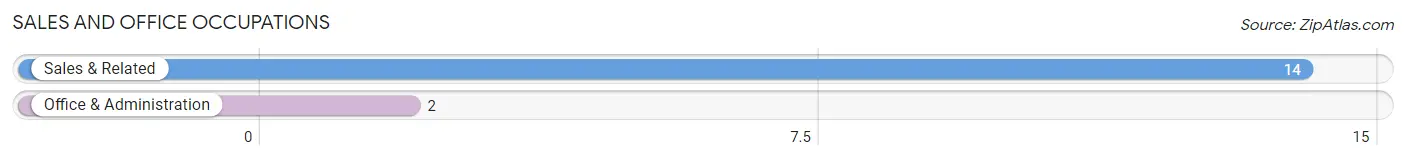
Sales and Office Occupations by Sex
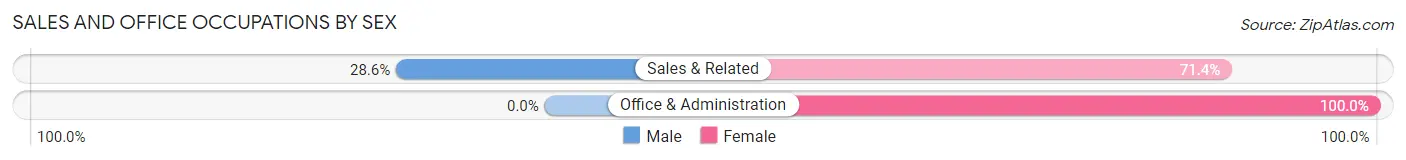
| Occupation | Male | Female |
| Sales & Related | 4 (28.6%) | 10 (71.4%) |
| Office & Administration | 0 (0.0%) | 2 (100.0%) |
| Total (Category) | 4 (25.0%) | 12 (75.0%) |
| Total (Overall) | 48 (60.0%) | 32 (40.0%) |
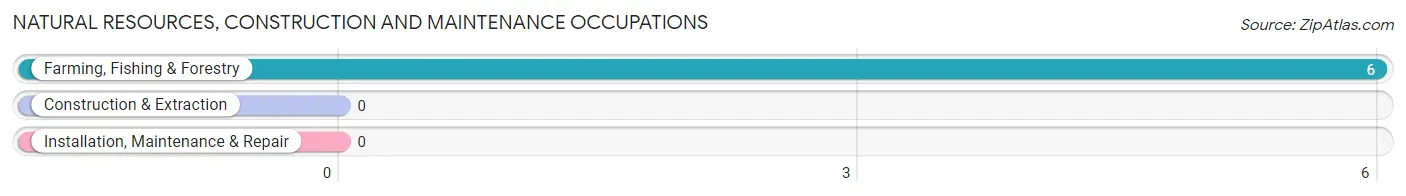
Natural Resources, Construction and Maintenance Occupations
The most common Natural Resources, Construction and Maintenance occupations in Smyrna are , and Farming, Fishing & Forestry (6 | 7.5%).
Natural Resources, Construction and Maintenance Occupations by Sex
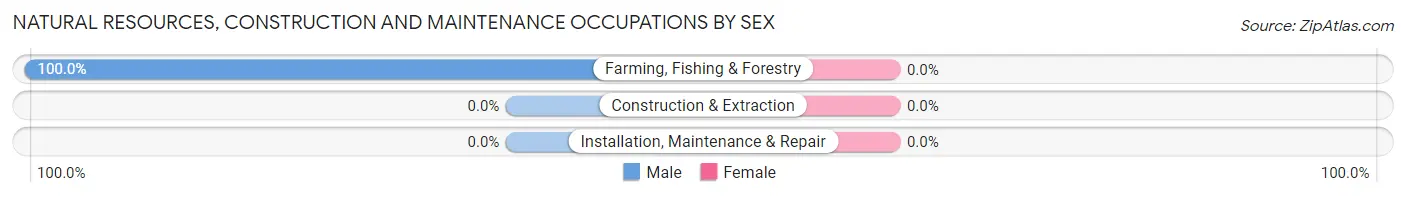
| Occupation | Male | Female |
| Farming, Fishing & Forestry | 6 (100.0%) | 0 (0.0%) |
| Construction & Extraction | 0 (0.0%) | 0 (0.0%) |
| Installation, Maintenance & Repair | 0 (0.0%) | 0 (0.0%) |
| Total (Category) | 6 (100.0%) | 0 (0.0%) |
| Total (Overall) | 48 (60.0%) | 32 (40.0%) |
Production, Transportation and Moving Occupations
The most common Production, Transportation and Moving occupations in Smyrna are Material Moving (11 | 13.8%), Transportation (7 | 8.7%), and Production (5 | 6.2%).
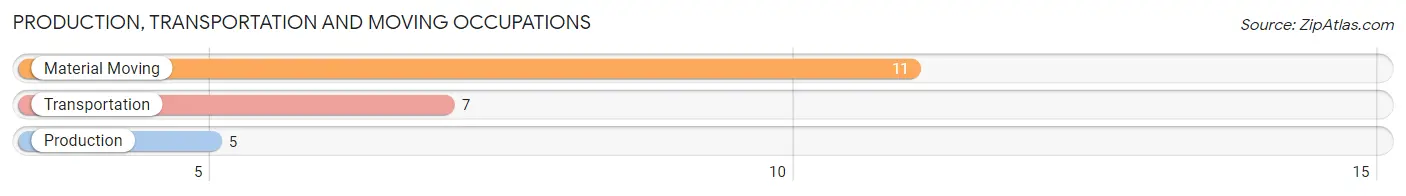
Production, Transportation and Moving Occupations by Sex
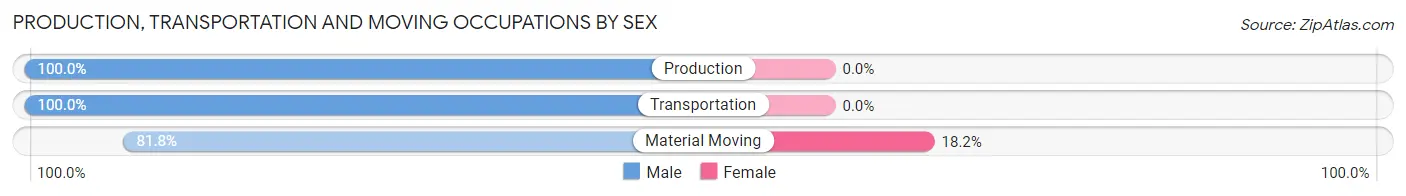
| Occupation | Male | Female |
| Production | 5 (100.0%) | 0 (0.0%) |
| Transportation | 7 (100.0%) | 0 (0.0%) |
| Material Moving | 9 (81.8%) | 2 (18.2%) |
| Total (Category) | 21 (91.3%) | 2 (8.7%) |
| Total (Overall) | 48 (60.0%) | 32 (40.0%) |
Employment Industries by Sex in Smyrna
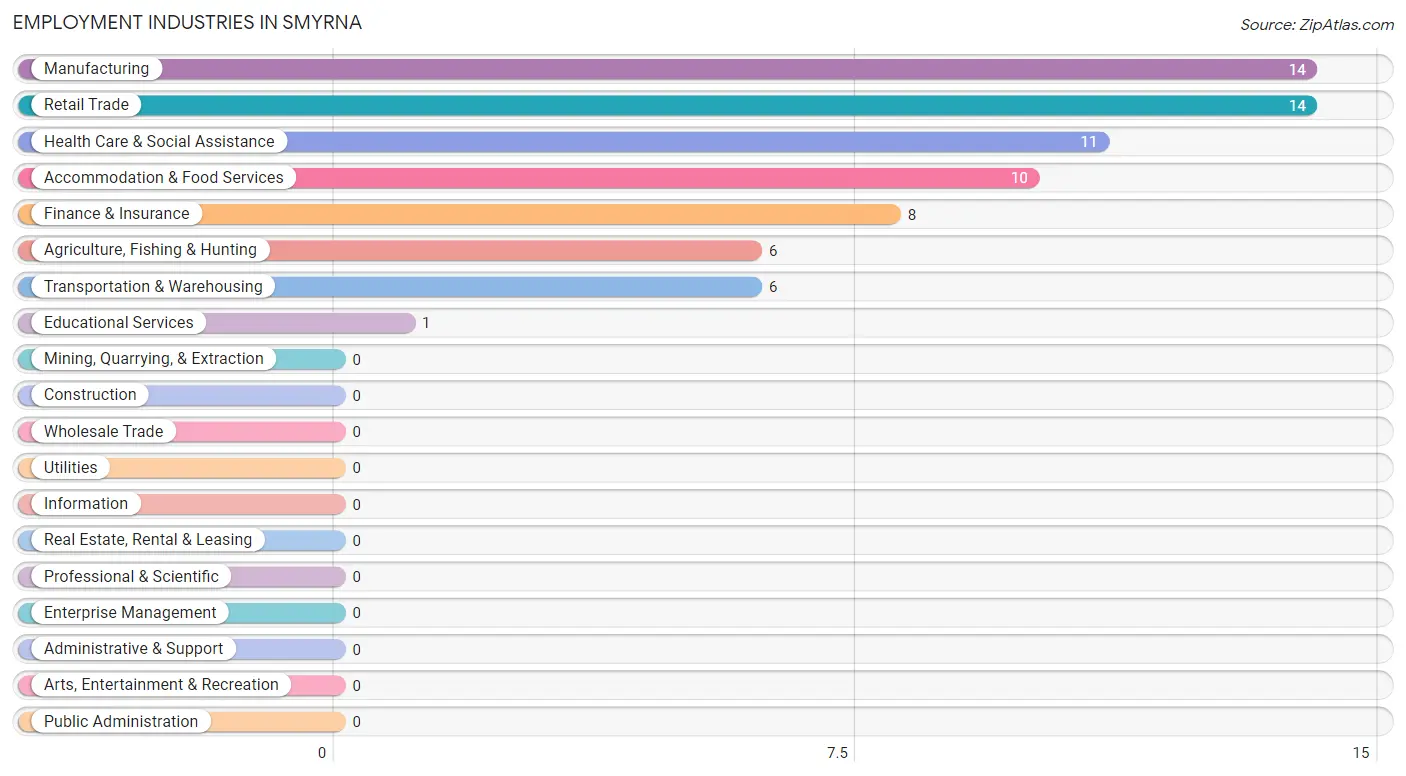
Employment Industries in Smyrna
The major employment industries in Smyrna include Manufacturing (14 | 17.5%), Retail Trade (14 | 17.5%), Health Care & Social Assistance (11 | 13.8%), Accommodation & Food Services (10 | 12.5%), and Finance & Insurance (8 | 10.0%).
Employment Industries by Sex in Smyrna
The Smyrna industries that see more men than women are Agriculture, Fishing & Hunting (100.0%), Manufacturing (100.0%), and Transportation & Warehousing (100.0%), whereas the industries that tend to have a higher number of women are Finance & Insurance (100.0%), Health Care & Social Assistance (100.0%), and Retail Trade (42.9%).
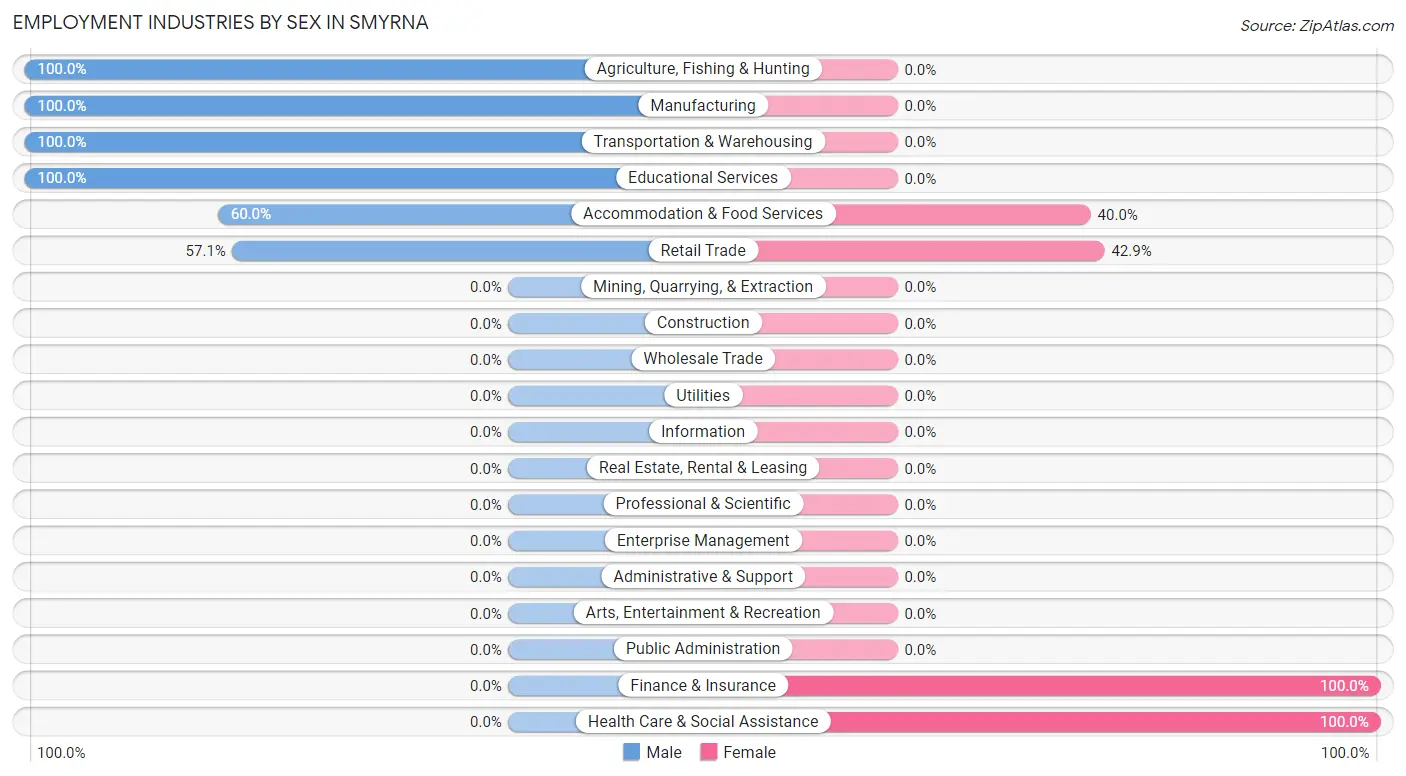
| Industry | Male | Female |
| Agriculture, Fishing & Hunting | 6 (100.0%) | 0 (0.0%) |
| Mining, Quarrying, & Extraction | 0 (0.0%) | 0 (0.0%) |
| Construction | 0 (0.0%) | 0 (0.0%) |
| Manufacturing | 14 (100.0%) | 0 (0.0%) |
| Wholesale Trade | 0 (0.0%) | 0 (0.0%) |
| Retail Trade | 8 (57.1%) | 6 (42.9%) |
| Transportation & Warehousing | 6 (100.0%) | 0 (0.0%) |
| Utilities | 0 (0.0%) | 0 (0.0%) |
| Information | 0 (0.0%) | 0 (0.0%) |
| Finance & Insurance | 0 (0.0%) | 8 (100.0%) |
| Real Estate, Rental & Leasing | 0 (0.0%) | 0 (0.0%) |
| Professional & Scientific | 0 (0.0%) | 0 (0.0%) |
| Enterprise Management | 0 (0.0%) | 0 (0.0%) |
| Administrative & Support | 0 (0.0%) | 0 (0.0%) |
| Educational Services | 1 (100.0%) | 0 (0.0%) |
| Health Care & Social Assistance | 0 (0.0%) | 11 (100.0%) |
| Arts, Entertainment & Recreation | 0 (0.0%) | 0 (0.0%) |
| Accommodation & Food Services | 6 (60.0%) | 4 (40.0%) |
| Public Administration | 0 (0.0%) | 0 (0.0%) |
| Total | 48 (60.0%) | 32 (40.0%) |
Education in Smyrna
School Enrollment in Smyrna
The most common levels of schooling among the 33 students in Smyrna are high school (14 | 42.4%), middle school (12 | 36.4%), and elementary school (7 | 21.2%).
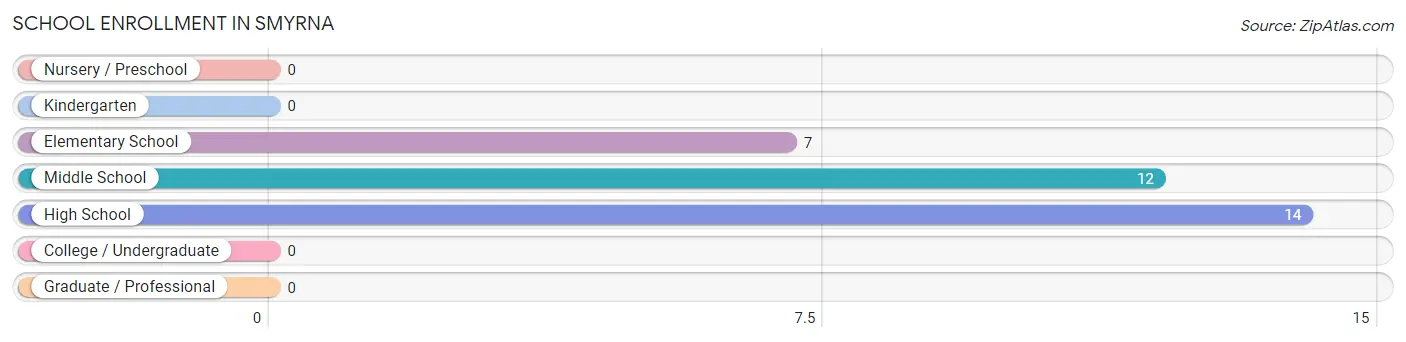
| School Level | # Students | % Students |
| Nursery / Preschool | 0 | 0.0% |
| Kindergarten | 0 | 0.0% |
| Elementary School | 7 | 21.2% |
| Middle School | 12 | 36.4% |
| High School | 14 | 42.4% |
| College / Undergraduate | 0 | 0.0% |
| Graduate / Professional | 0 | 0.0% |
| Total | 33 | 100.0% |
School Enrollment by Age by Funding Source in Smyrna
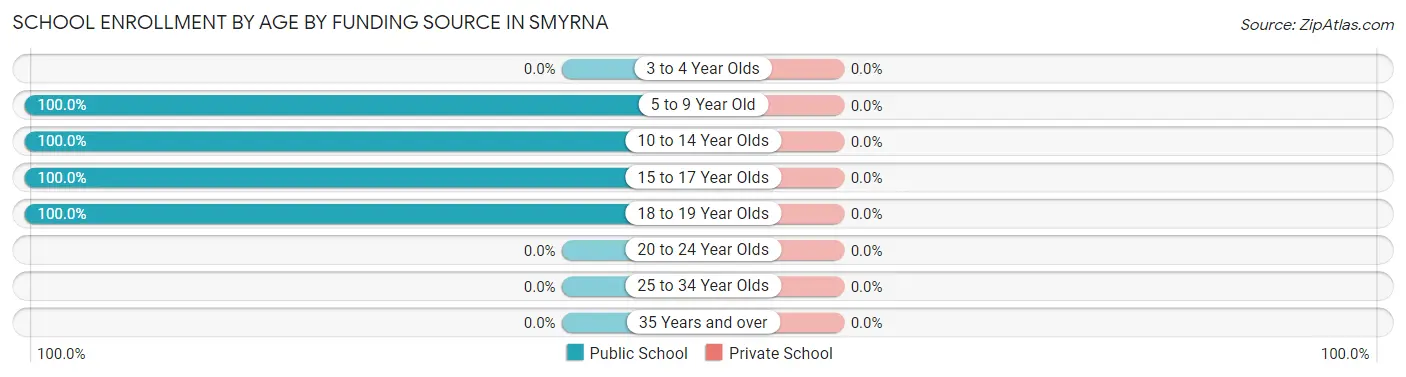
| Age Bracket | Public School | Private School |
| 3 to 4 Year Olds | 0 (0.0%) | 0 (0.0%) |
| 5 to 9 Year Old | 3 (100.0%) | 0 (0.0%) |
| 10 to 14 Year Olds | 16 (100.0%) | 0 (0.0%) |
| 15 to 17 Year Olds | 5 (100.0%) | 0 (0.0%) |
| 18 to 19 Year Olds | 9 (100.0%) | 0 (0.0%) |
| 20 to 24 Year Olds | 0 (0.0%) | 0 (0.0%) |
| 25 to 34 Year Olds | 0 (0.0%) | 0 (0.0%) |
| 35 Years and over | 0 (0.0%) | 0 (0.0%) |
| Total | 33 (100.0%) | 0 (0.0%) |
Educational Attainment by Field of Study in Smyrna
Education (2 | 50.0%), and liberal arts & history (2 | 50.0%) are the most common fields of study among 4 individuals in Smyrna who have obtained a bachelor's degree or higher.
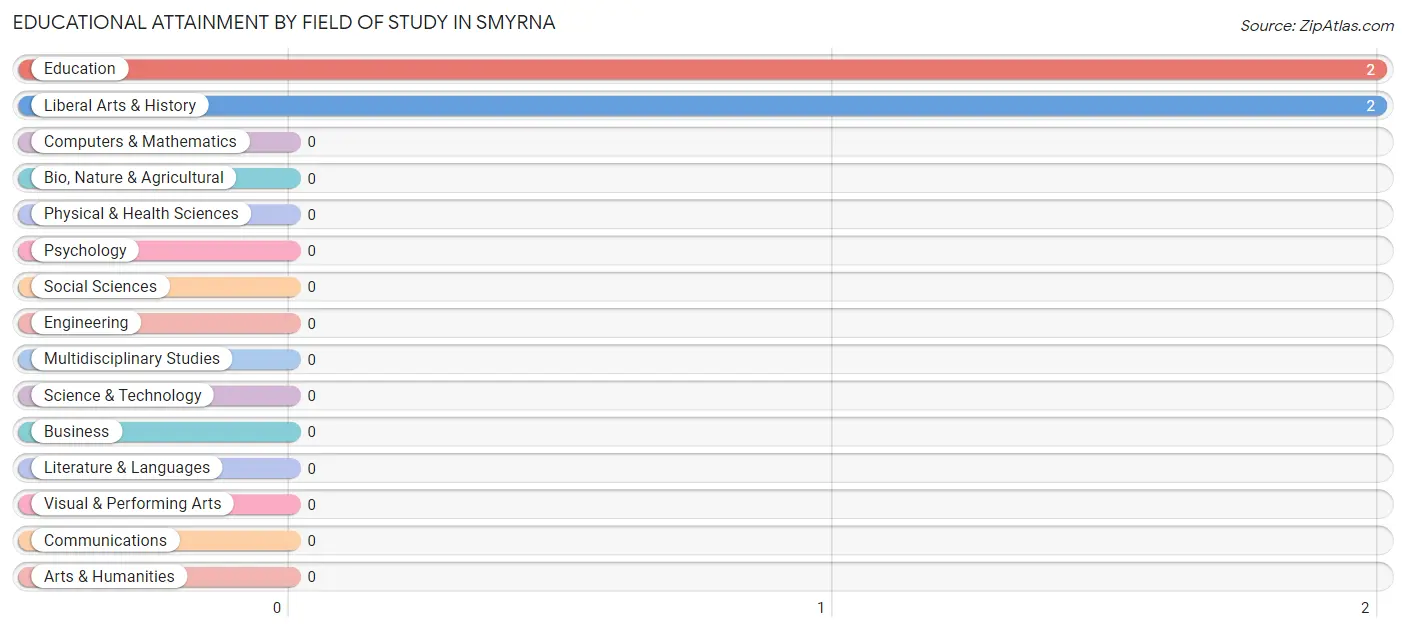
| Field of Study | # Graduates | % Graduates |
| Computers & Mathematics | 0 | 0.0% |
| Bio, Nature & Agricultural | 0 | 0.0% |
| Physical & Health Sciences | 0 | 0.0% |
| Psychology | 0 | 0.0% |
| Social Sciences | 0 | 0.0% |
| Engineering | 0 | 0.0% |
| Multidisciplinary Studies | 0 | 0.0% |
| Science & Technology | 0 | 0.0% |
| Business | 0 | 0.0% |
| Education | 2 | 50.0% |
| Literature & Languages | 0 | 0.0% |
| Liberal Arts & History | 2 | 50.0% |
| Visual & Performing Arts | 0 | 0.0% |
| Communications | 0 | 0.0% |
| Arts & Humanities | 0 | 0.0% |
| Total | 4 | 100.0% |
Transportation & Commute in Smyrna
Vehicle Availability by Sex in Smyrna
The most prevalent vehicle ownership categories in Smyrna are males with 3 vehicles (20, accounting for 41.7%) and females with 3 vehicles (9, making up 62.5%).
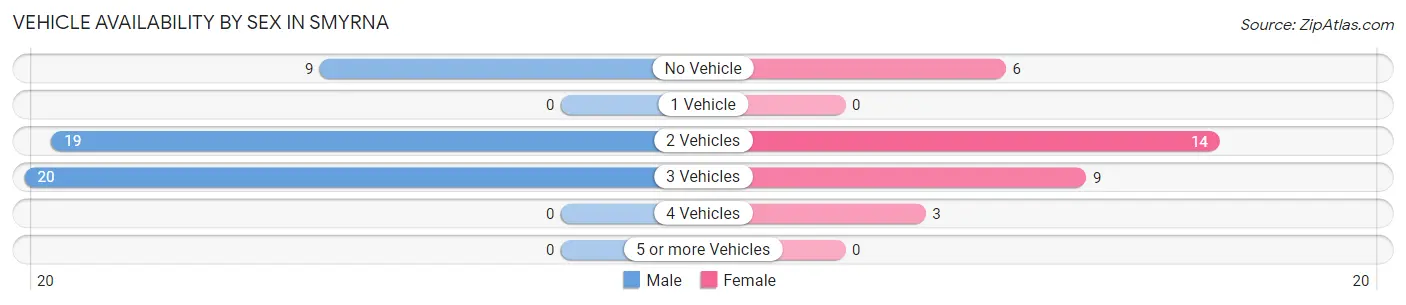
| Vehicles Available | Male | Female |
| No Vehicle | 9 (18.8%) | 6 (18.8%) |
| 1 Vehicle | 0 (0.0%) | 0 (0.0%) |
| 2 Vehicles | 19 (39.6%) | 14 (43.8%) |
| 3 Vehicles | 20 (41.7%) | 9 (28.1%) |
| 4 Vehicles | 0 (0.0%) | 3 (9.4%) |
| 5 or more Vehicles | 0 (0.0%) | 0 (0.0%) |
| Total | 48 (100.0%) | 32 (100.0%) |
Commute Time in Smyrna
The most frequently occuring commute durations in Smyrna are 20 to 24 minutes (32 commuters, 40.0%), 5 to 9 minutes (15 commuters, 18.8%), and less than 5 minutes (11 commuters, 13.8%).
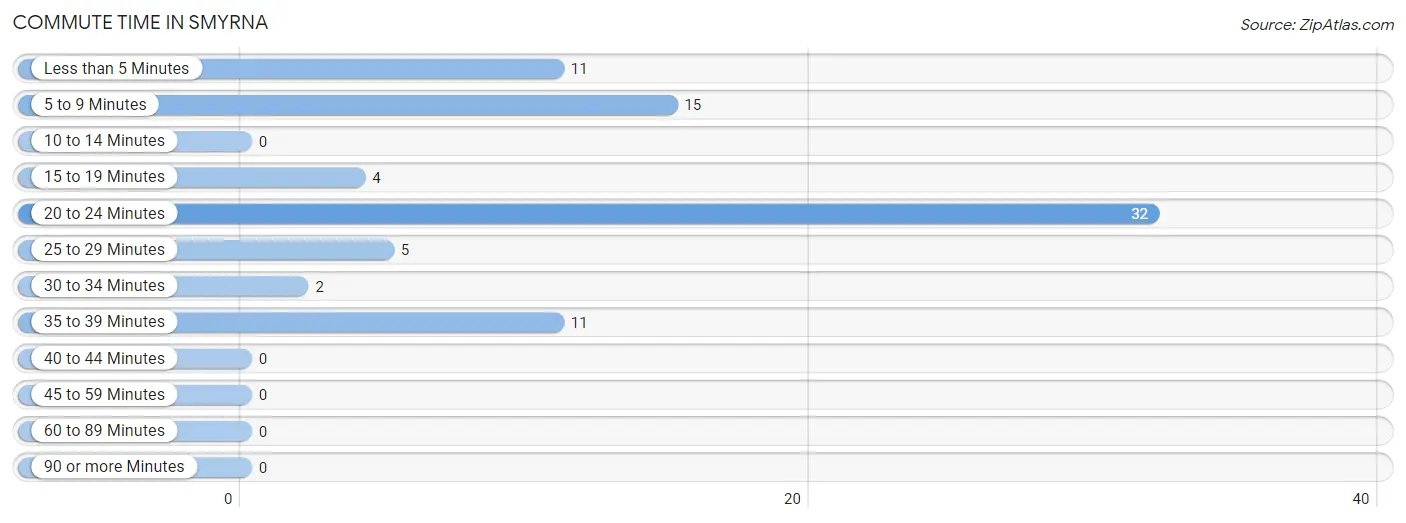
| Commute Time | # Commuters | % Commuters |
| Less than 5 Minutes | 11 | 13.8% |
| 5 to 9 Minutes | 15 | 18.8% |
| 10 to 14 Minutes | 0 | 0.0% |
| 15 to 19 Minutes | 4 | 5.0% |
| 20 to 24 Minutes | 32 | 40.0% |
| 25 to 29 Minutes | 5 | 6.2% |
| 30 to 34 Minutes | 2 | 2.5% |
| 35 to 39 Minutes | 11 | 13.8% |
| 40 to 44 Minutes | 0 | 0.0% |
| 45 to 59 Minutes | 0 | 0.0% |
| 60 to 89 Minutes | 0 | 0.0% |
| 90 or more Minutes | 0 | 0.0% |
Commute Time by Sex in Smyrna
The most common commute times in Smyrna are 20 to 24 minutes (16 commuters, 33.3%) for males and 20 to 24 minutes (16 commuters, 50.0%) for females.
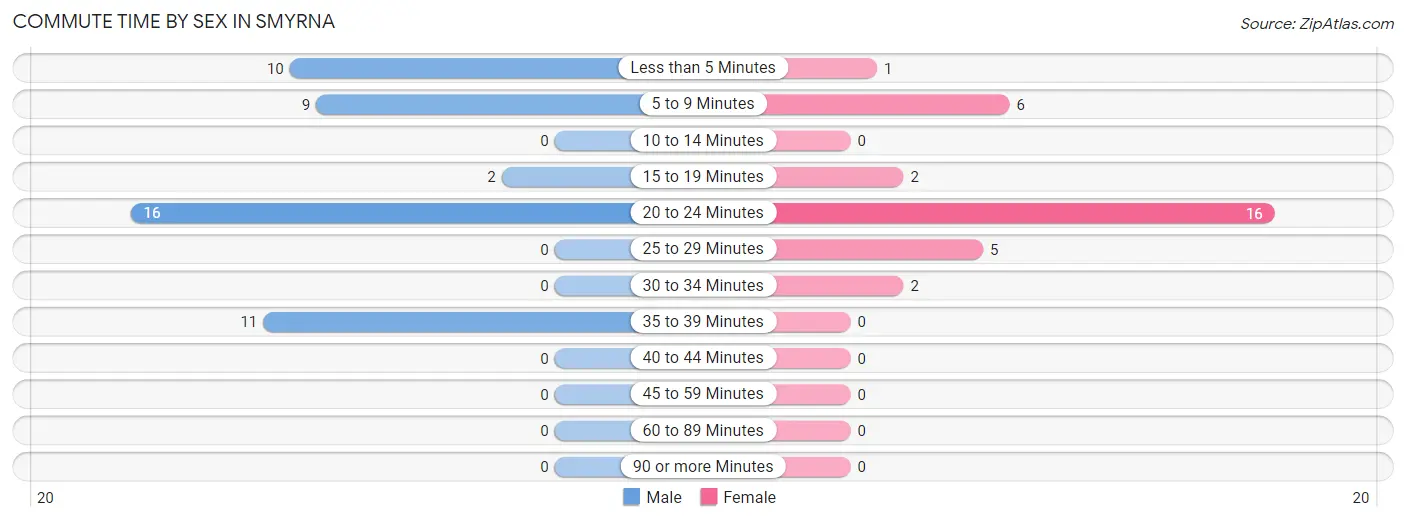
| Commute Time | Male | Female |
| Less than 5 Minutes | 10 (20.8%) | 1 (3.1%) |
| 5 to 9 Minutes | 9 (18.8%) | 6 (18.8%) |
| 10 to 14 Minutes | 0 (0.0%) | 0 (0.0%) |
| 15 to 19 Minutes | 2 (4.2%) | 2 (6.2%) |
| 20 to 24 Minutes | 16 (33.3%) | 16 (50.0%) |
| 25 to 29 Minutes | 0 (0.0%) | 5 (15.6%) |
| 30 to 34 Minutes | 0 (0.0%) | 2 (6.2%) |
| 35 to 39 Minutes | 11 (22.9%) | 0 (0.0%) |
| 40 to 44 Minutes | 0 (0.0%) | 0 (0.0%) |
| 45 to 59 Minutes | 0 (0.0%) | 0 (0.0%) |
| 60 to 89 Minutes | 0 (0.0%) | 0 (0.0%) |
| 90 or more Minutes | 0 (0.0%) | 0 (0.0%) |
Time of Departure to Work by Sex in Smyrna
The most frequent times of departure to work in Smyrna are 6:00 AM to 6:29 AM (22, 45.8%) for males and 9:00 AM to 9:59 AM (9, 28.1%) for females.
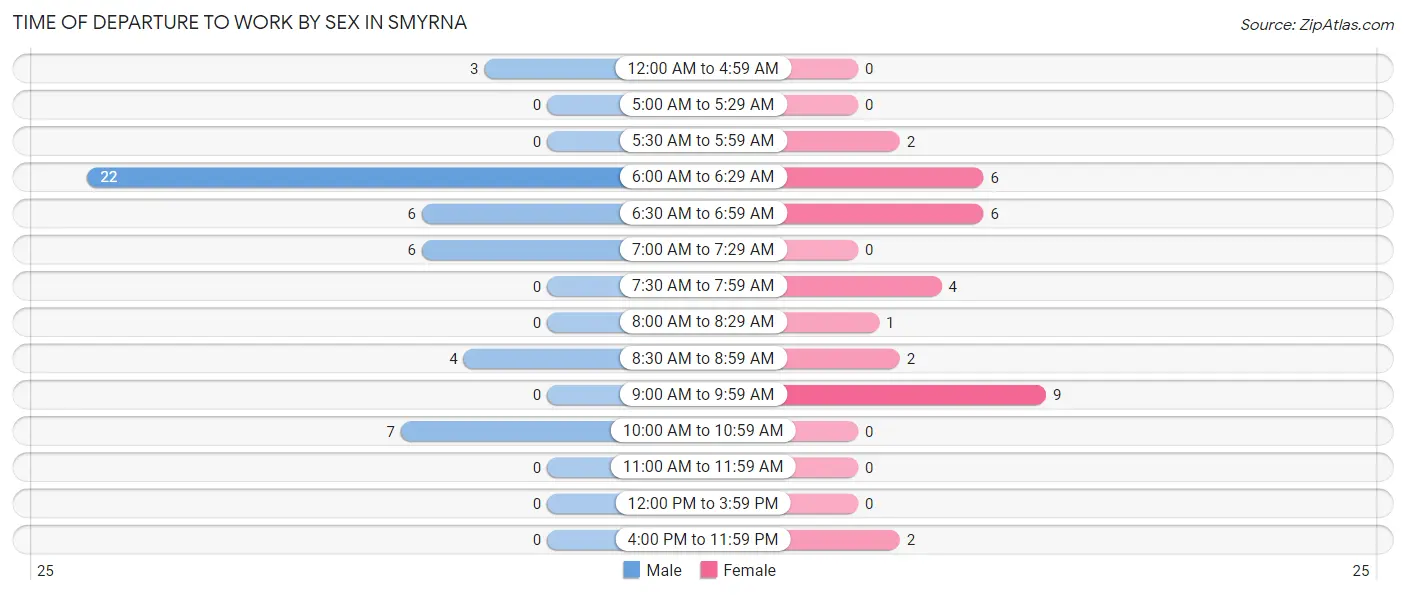
| Time of Departure | Male | Female |
| 12:00 AM to 4:59 AM | 3 (6.2%) | 0 (0.0%) |
| 5:00 AM to 5:29 AM | 0 (0.0%) | 0 (0.0%) |
| 5:30 AM to 5:59 AM | 0 (0.0%) | 2 (6.2%) |
| 6:00 AM to 6:29 AM | 22 (45.8%) | 6 (18.8%) |
| 6:30 AM to 6:59 AM | 6 (12.5%) | 6 (18.8%) |
| 7:00 AM to 7:29 AM | 6 (12.5%) | 0 (0.0%) |
| 7:30 AM to 7:59 AM | 0 (0.0%) | 4 (12.5%) |
| 8:00 AM to 8:29 AM | 0 (0.0%) | 1 (3.1%) |
| 8:30 AM to 8:59 AM | 4 (8.3%) | 2 (6.2%) |
| 9:00 AM to 9:59 AM | 0 (0.0%) | 9 (28.1%) |
| 10:00 AM to 10:59 AM | 7 (14.6%) | 0 (0.0%) |
| 11:00 AM to 11:59 AM | 0 (0.0%) | 0 (0.0%) |
| 12:00 PM to 3:59 PM | 0 (0.0%) | 0 (0.0%) |
| 4:00 PM to 11:59 PM | 0 (0.0%) | 2 (6.2%) |
| Total | 48 (100.0%) | 32 (100.0%) |
Housing Occupancy in Smyrna
Occupancy by Ownership in Smyrna
Of the total 89 dwellings in Smyrna, owner-occupied units account for 49 (55.1%), while renter-occupied units make up 40 (44.9%).
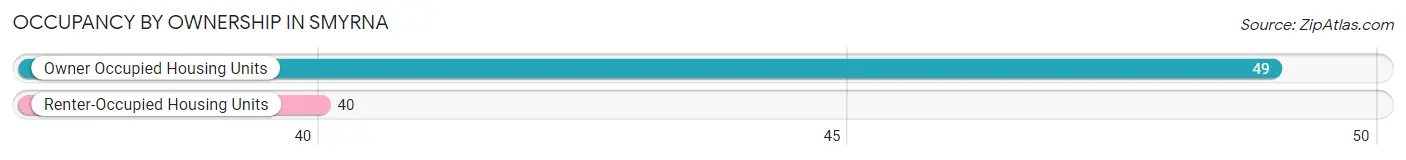
| Occupancy | # Housing Units | % Housing Units |
| Owner Occupied Housing Units | 49 | 55.1% |
| Renter-Occupied Housing Units | 40 | 44.9% |
| Total Occupied Housing Units | 89 | 100.0% |
Occupancy by Household Size in Smyrna
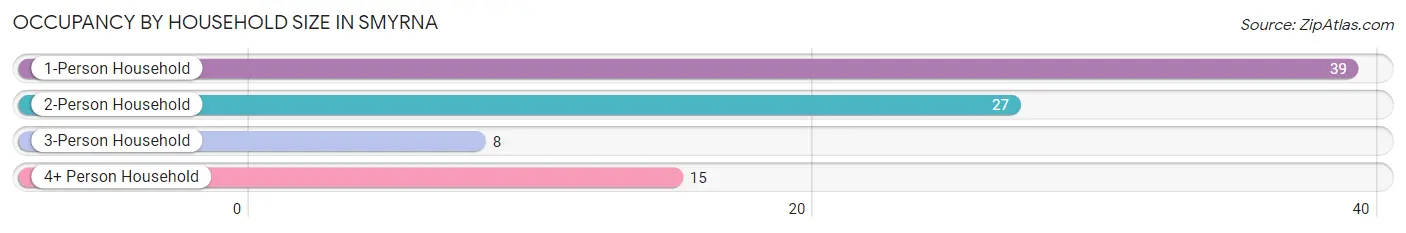
| Household Size | # Housing Units | % Housing Units |
| 1-Person Household | 39 | 43.8% |
| 2-Person Household | 27 | 30.3% |
| 3-Person Household | 8 | 9.0% |
| 4+ Person Household | 15 | 16.9% |
| Total Housing Units | 89 | 100.0% |
Occupancy by Ownership by Household Size in Smyrna
| Household Size | Owner-occupied | Renter-occupied |
| 1-Person Household | 29 (74.4%) | 10 (25.6%) |
| 2-Person Household | 14 (51.8%) | 13 (48.1%) |
| 3-Person Household | 2 (25.0%) | 6 (75.0%) |
| 4+ Person Household | 4 (26.7%) | 11 (73.3%) |
| Total Housing Units | 49 (55.1%) | 40 (44.9%) |
Occupancy by Educational Attainment in Smyrna
| Household Size | Owner-occupied | Renter-occupied |
| Less than High School | 5 (71.4%) | 2 (28.6%) |
| High School Diploma | 29 (64.4%) | 16 (35.6%) |
| College/Associate Degree | 13 (48.1%) | 14 (51.8%) |
| Bachelor's Degree or higher | 2 (20.0%) | 8 (80.0%) |
Occupancy by Age of Householder in Smyrna
| Age Bracket | # Households | % Households |
| Under 35 Years | 10 | 11.2% |
| 35 to 44 Years | 20 | 22.5% |
| 45 to 54 Years | 13 | 14.6% |
| 55 to 64 Years | 20 | 22.5% |
| 65 to 74 Years | 13 | 14.6% |
| 75 to 84 Years | 13 | 14.6% |
| 85 Years and Over | 0 | 0.0% |
| Total | 89 | 100.0% |
Housing Finances in Smyrna
Median Income by Occupancy in Smyrna
| Occupancy Type | # Households | Median Income |
| Owner-Occupied | 49 (55.1%) | $29,375 |
| Renter-Occupied | 40 (44.9%) | $48,214 |
| Average | 89 (100.0%) | $34,464 |
Occupancy by Householder Income Bracket in Smyrna
| Income Bracket | Owner-occupied | Renter-occupied |
| Less than $5,000 | 4 (8.2%) | 0 (0.0%) |
| $5,000 to $9,999 | 2 (4.1%) | 0 (0.0%) |
| $10,000 to $14,999 | 6 (12.2%) | 8 (20.0%) |
| $15,000 to $19,999 | 0 (0.0%) | 0 (0.0%) |
| $20,000 to $24,999 | 5 (10.2%) | 0 (0.0%) |
| $25,000 to $34,999 | 17 (34.7%) | 4 (10.0%) |
| $35,000 to $49,999 | 9 (18.4%) | 13 (32.5%) |
| $50,000 to $74,999 | 1 (2.0%) | 4 (10.0%) |
| $75,000 to $99,999 | 2 (4.1%) | 0 (0.0%) |
| $100,000 to $149,999 | 3 (6.1%) | 3 (7.5%) |
| $150,000 or more | 0 (0.0%) | 8 (20.0%) |
| Total | 49 (100.0%) | 40 (100.0%) |
Monthly Housing Cost Tiers in Smyrna
| Monthly Cost | Owner-occupied | Renter-occupied |
| Less than $300 | 8 (16.3%) | 3 (7.5%) |
| $300 to $499 | 26 (53.1%) | 2 (5.0%) |
| $500 to $799 | 9 (18.4%) | 2 (5.0%) |
| $800 to $999 | 3 (6.1%) | 2 (5.0%) |
| $1,000 to $1,499 | 3 (6.1%) | 13 (32.5%) |
| $1,500 to $1,999 | 0 (0.0%) | 0 (0.0%) |
| $2,000 to $2,499 | 0 (0.0%) | 0 (0.0%) |
| $2,500 to $2,999 | 0 (0.0%) | 0 (0.0%) |
| $3,000 or more | 0 (0.0%) | 0 (0.0%) |
| Total | 49 (100.0%) | 40 (100.0%) |
Physical Housing Characteristics in Smyrna
Housing Structures in Smyrna
| Structure Type | # Housing Units | % Housing Units |
| Single Unit, Detached | 56 | 62.9% |
| Single Unit, Attached | 2 | 2.2% |
| 2 Unit Apartments | 8 | 9.0% |
| 3 or 4 Unit Apartments | 0 | 0.0% |
| 5 to 9 Unit Apartments | 0 | 0.0% |
| 10 or more Apartments | 7 | 7.9% |
| Mobile Home / Other | 16 | 18.0% |
| Total | 89 | 100.0% |
Housing Structures by Occupancy in Smyrna
| Structure Type | Owner-occupied | Renter-occupied |
| Single Unit, Detached | 38 (67.9%) | 18 (32.1%) |
| Single Unit, Attached | 0 (0.0%) | 2 (100.0%) |
| 2 Unit Apartments | 0 (0.0%) | 8 (100.0%) |
| 3 or 4 Unit Apartments | 0 (0.0%) | 0 (0.0%) |
| 5 to 9 Unit Apartments | 0 (0.0%) | 0 (0.0%) |
| 10 or more Apartments | 0 (0.0%) | 7 (100.0%) |
| Mobile Home / Other | 11 (68.8%) | 5 (31.2%) |
| Total | 49 (55.1%) | 40 (44.9%) |
Housing Structures by Number of Rooms in Smyrna
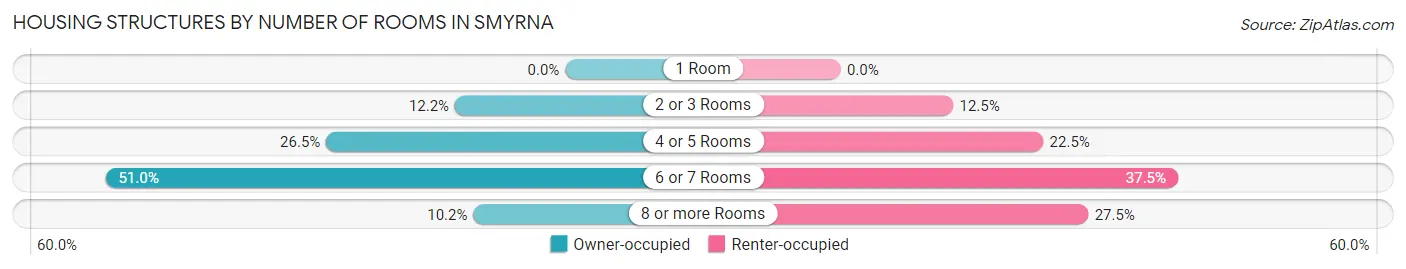
| Number of Rooms | Owner-occupied | Renter-occupied |
| 1 Room | 0 (0.0%) | 0 (0.0%) |
| 2 or 3 Rooms | 6 (12.2%) | 5 (12.5%) |
| 4 or 5 Rooms | 13 (26.5%) | 9 (22.5%) |
| 6 or 7 Rooms | 25 (51.0%) | 15 (37.5%) |
| 8 or more Rooms | 5 (10.2%) | 11 (27.5%) |
| Total | 49 (100.0%) | 40 (100.0%) |
Housing Structure by Heating Type in Smyrna
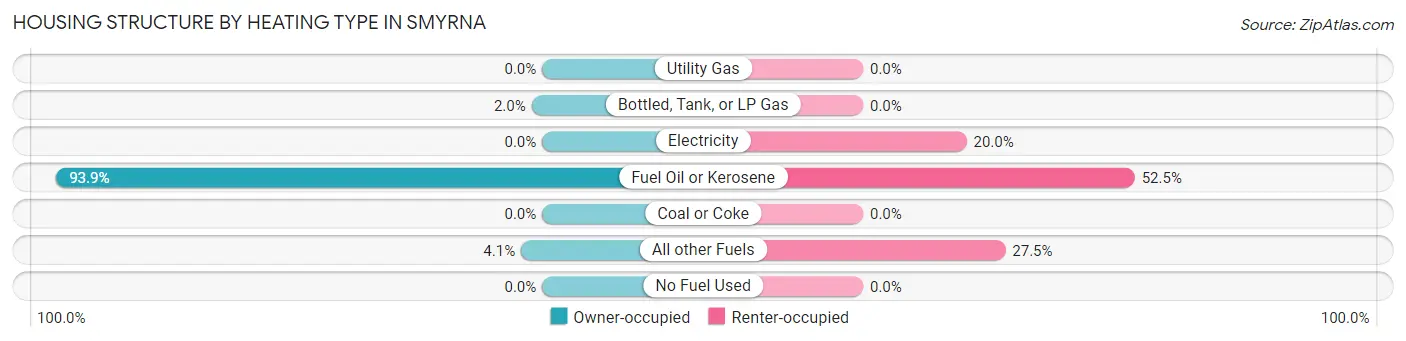
| Heating Type | Owner-occupied | Renter-occupied |
| Utility Gas | 0 (0.0%) | 0 (0.0%) |
| Bottled, Tank, or LP Gas | 1 (2.0%) | 0 (0.0%) |
| Electricity | 0 (0.0%) | 8 (20.0%) |
| Fuel Oil or Kerosene | 46 (93.9%) | 21 (52.5%) |
| Coal or Coke | 0 (0.0%) | 0 (0.0%) |
| All other Fuels | 2 (4.1%) | 11 (27.5%) |
| No Fuel Used | 0 (0.0%) | 0 (0.0%) |
| Total | 49 (100.0%) | 40 (100.0%) |
Household Vehicle Usage in Smyrna
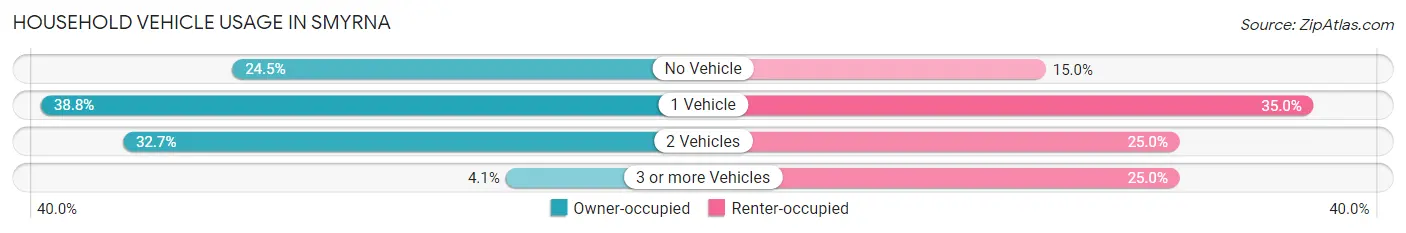
| Vehicles per Household | Owner-occupied | Renter-occupied |
| No Vehicle | 12 (24.5%) | 6 (15.0%) |
| 1 Vehicle | 19 (38.8%) | 14 (35.0%) |
| 2 Vehicles | 16 (32.7%) | 10 (25.0%) |
| 3 or more Vehicles | 2 (4.1%) | 10 (25.0%) |
| Total | 49 (100.0%) | 40 (100.0%) |
Real Estate & Mortgages in Smyrna
Real Estate and Mortgage Overview in Smyrna
| Characteristic | Without Mortgage | With Mortgage |
| Housing Units | 35 | 14 |
| Median Property Value | $59,000 | $85,000 |
| Median Household Income | $29,583 | $0 |
| Monthly Housing Costs | $398 | $0 |
| Real Estate Taxes | $2,205 | $0 |
Property Value by Mortgage Status in Smyrna
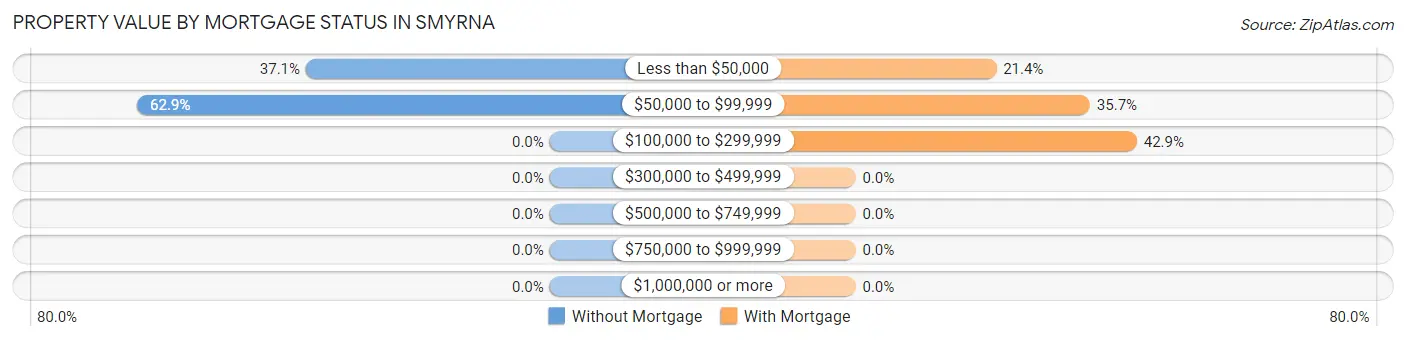
| Property Value | Without Mortgage | With Mortgage |
| Less than $50,000 | 13 (37.1%) | 3 (21.4%) |
| $50,000 to $99,999 | 22 (62.9%) | 5 (35.7%) |
| $100,000 to $299,999 | 0 (0.0%) | 6 (42.9%) |
| $300,000 to $499,999 | 0 (0.0%) | 0 (0.0%) |
| $500,000 to $749,999 | 0 (0.0%) | 0 (0.0%) |
| $750,000 to $999,999 | 0 (0.0%) | 0 (0.0%) |
| $1,000,000 or more | 0 (0.0%) | 0 (0.0%) |
| Total | 35 (100.0%) | 14 (100.0%) |
Household Income by Mortgage Status in Smyrna
| Household Income | Without Mortgage | With Mortgage |
| Less than $10,000 | 5 (14.3%) | 0 (0.0%) |
| $10,000 to $24,999 | 5 (14.3%) | 1 (7.1%) |
| $25,000 to $34,999 | 15 (42.9%) | 6 (42.9%) |
| $35,000 to $49,999 | 9 (25.7%) | 2 (14.3%) |
| $50,000 to $74,999 | 0 (0.0%) | 0 (0.0%) |
| $75,000 to $99,999 | 0 (0.0%) | 1 (7.1%) |
| $100,000 to $149,999 | 1 (2.9%) | 2 (14.3%) |
| $150,000 or more | 0 (0.0%) | 2 (14.3%) |
| Total | 35 (100.0%) | 14 (100.0%) |
Property Value to Household Income Ratio in Smyrna
| Value-to-Income Ratio | Without Mortgage | With Mortgage |
| Less than 2.0x | 16 (45.7%) | 0 (0.0%) |
| 2.0x to 2.9x | 1 (2.9%) | 6 (42.9%) |
| 3.0x to 3.9x | 14 (40.0%) | 1 (7.1%) |
| 4.0x or more | 2 (5.7%) | 0 (0.0%) |
| Total | 35 (100.0%) | 14 (100.0%) |
Real Estate Taxes by Mortgage Status in Smyrna
| Property Taxes | Without Mortgage | With Mortgage |
| Less than $800 | 2 (5.7%) | 0 (0.0%) |
| $800 to $1,499 | 6 (17.1%) | 0 (0.0%) |
| $800 to $1,499 | 27 (77.1%) | 5 (35.7%) |
| Total | 35 (100.0%) | 14 (100.0%) |
Health & Disability in Smyrna
Health Insurance Coverage by Age in Smyrna
| Age Bracket | With Coverage | Without Coverage |
| Under 6 Years | 19 (100.0%) | 0 (0.0%) |
| 6 to 18 Years | 31 (100.0%) | 0 (0.0%) |
| 19 to 25 Years | 19 (100.0%) | 0 (0.0%) |
| 26 to 34 Years | 5 (100.0%) | 0 (0.0%) |
| 35 to 44 Years | 26 (81.2%) | 6 (18.8%) |
| 45 to 54 Years | 21 (100.0%) | 0 (0.0%) |
| 55 to 64 Years | 15 (46.9%) | 17 (53.1%) |
| 65 to 74 Years | 18 (100.0%) | 0 (0.0%) |
| 75 Years and older | 16 (100.0%) | 0 (0.0%) |
| Total | 170 (88.1%) | 23 (11.9%) |
Health Insurance Coverage by Citizenship Status in Smyrna
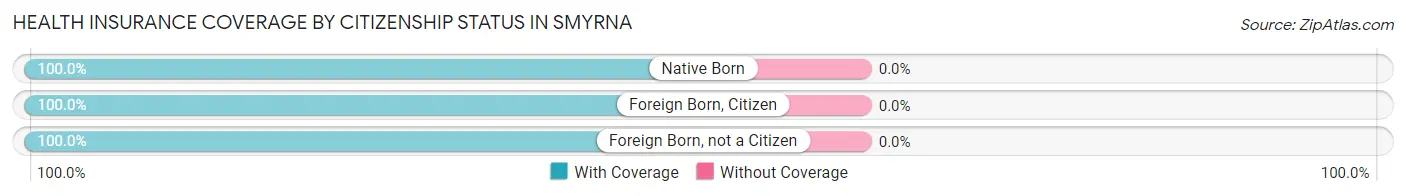
| Citizenship Status | With Coverage | Without Coverage |
| Native Born | 19 (100.0%) | 0 (0.0%) |
| Foreign Born, Citizen | 31 (100.0%) | 0 (0.0%) |
| Foreign Born, not a Citizen | 19 (100.0%) | 0 (0.0%) |
Health Insurance Coverage by Household Income in Smyrna
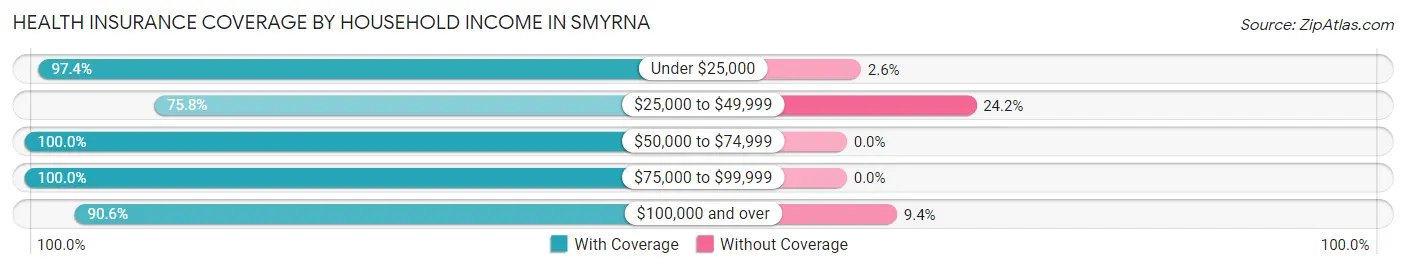
| Household Income | With Coverage | Without Coverage |
| Under $25,000 | 37 (97.4%) | 1 (2.6%) |
| $25,000 to $49,999 | 50 (75.8%) | 16 (24.2%) |
| $50,000 to $74,999 | 16 (100.0%) | 0 (0.0%) |
| $75,000 to $99,999 | 9 (100.0%) | 0 (0.0%) |
| $100,000 and over | 58 (90.6%) | 6 (9.4%) |
Public vs Private Health Insurance Coverage by Age in Smyrna
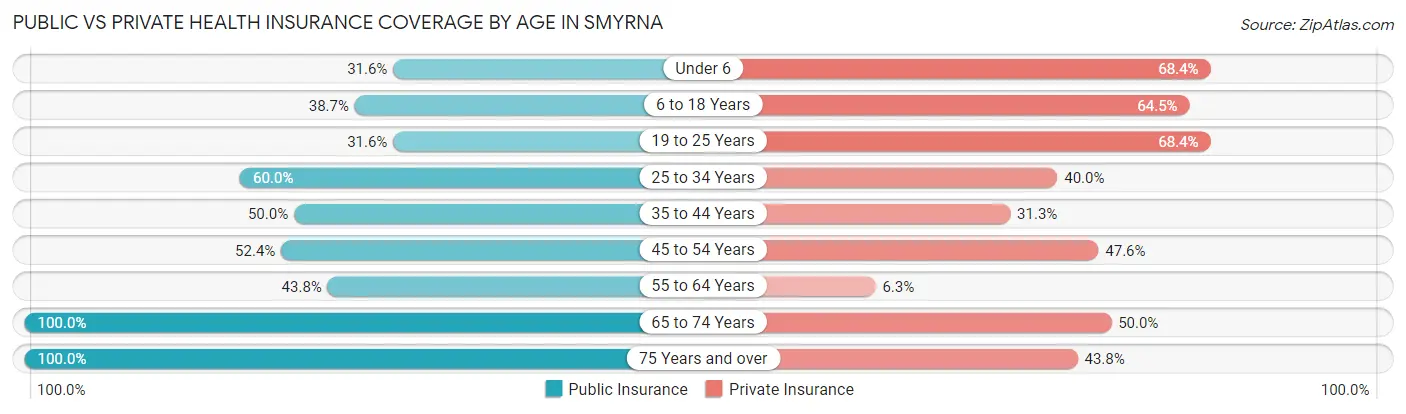
| Age Bracket | Public Insurance | Private Insurance |
| Under 6 | 6 (31.6%) | 13 (68.4%) |
| 6 to 18 Years | 12 (38.7%) | 20 (64.5%) |
| 19 to 25 Years | 6 (31.6%) | 13 (68.4%) |
| 25 to 34 Years | 3 (60.0%) | 2 (40.0%) |
| 35 to 44 Years | 16 (50.0%) | 10 (31.2%) |
| 45 to 54 Years | 11 (52.4%) | 10 (47.6%) |
| 55 to 64 Years | 14 (43.8%) | 2 (6.2%) |
| 65 to 74 Years | 18 (100.0%) | 9 (50.0%) |
| 75 Years and over | 16 (100.0%) | 7 (43.8%) |
| Total | 102 (52.8%) | 86 (44.6%) |
Disability Status by Sex by Age in Smyrna
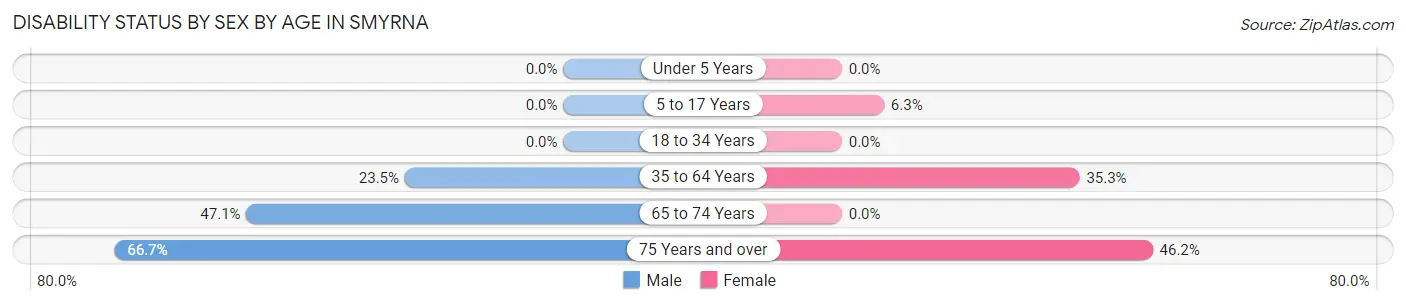
| Age Bracket | Male | Female |
| Under 5 Years | 0 (0.0%) | 0 (0.0%) |
| 5 to 17 Years | 0 (0.0%) | 1 (6.2%) |
| 18 to 34 Years | 0 (0.0%) | 0 (0.0%) |
| 35 to 64 Years | 12 (23.5%) | 12 (35.3%) |
| 65 to 74 Years | 8 (47.1%) | 0 (0.0%) |
| 75 Years and over | 2 (66.7%) | 6 (46.2%) |
Disability Class by Sex by Age in Smyrna
Disability Class: Hearing Difficulty
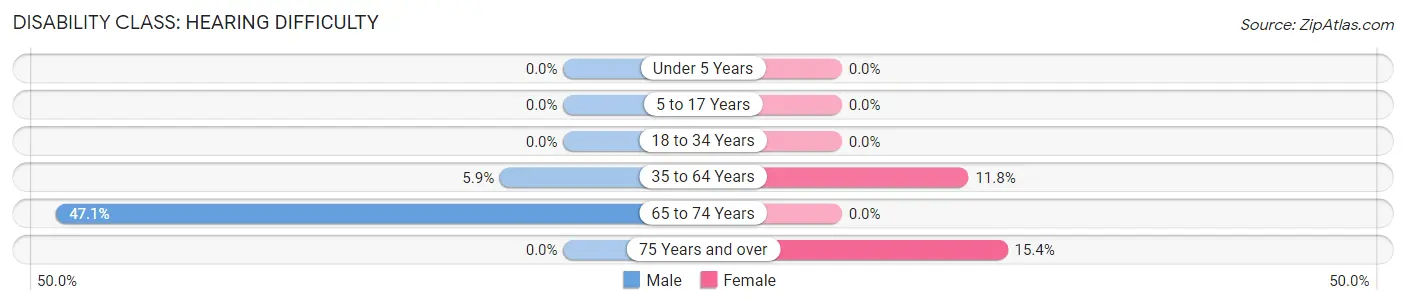
| Age Bracket | Male | Female |
| Under 5 Years | 0 (0.0%) | 0 (0.0%) |
| 5 to 17 Years | 0 (0.0%) | 0 (0.0%) |
| 18 to 34 Years | 0 (0.0%) | 0 (0.0%) |
| 35 to 64 Years | 3 (5.9%) | 4 (11.8%) |
| 65 to 74 Years | 8 (47.1%) | 0 (0.0%) |
| 75 Years and over | 0 (0.0%) | 2 (15.4%) |
Disability Class: Vision Difficulty
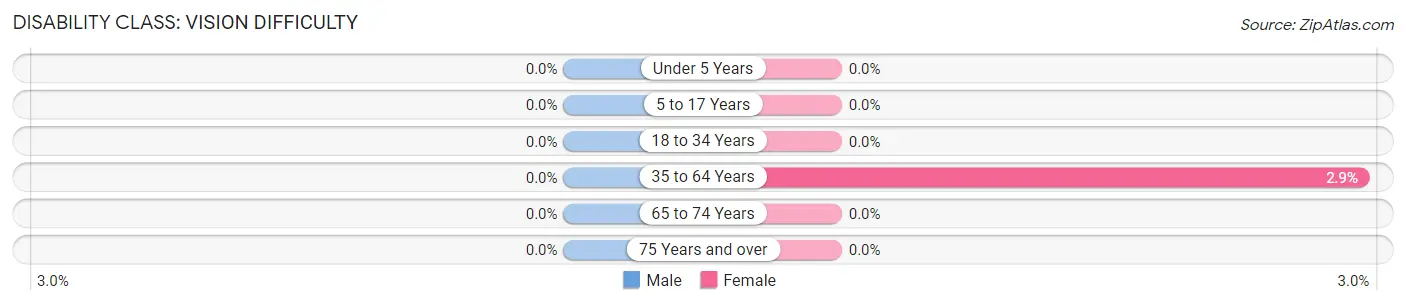
| Age Bracket | Male | Female |
| Under 5 Years | 0 (0.0%) | 0 (0.0%) |
| 5 to 17 Years | 0 (0.0%) | 0 (0.0%) |
| 18 to 34 Years | 0 (0.0%) | 0 (0.0%) |
| 35 to 64 Years | 0 (0.0%) | 1 (2.9%) |
| 65 to 74 Years | 0 (0.0%) | 0 (0.0%) |
| 75 Years and over | 0 (0.0%) | 0 (0.0%) |
Disability Class: Cognitive Difficulty
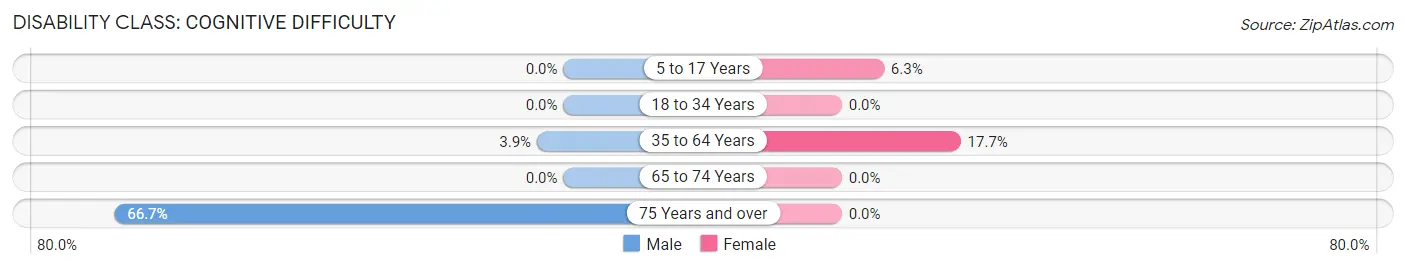
| Age Bracket | Male | Female |
| 5 to 17 Years | 0 (0.0%) | 1 (6.2%) |
| 18 to 34 Years | 0 (0.0%) | 0 (0.0%) |
| 35 to 64 Years | 2 (3.9%) | 6 (17.6%) |
| 65 to 74 Years | 0 (0.0%) | 0 (0.0%) |
| 75 Years and over | 2 (66.7%) | 0 (0.0%) |
Disability Class: Ambulatory Difficulty
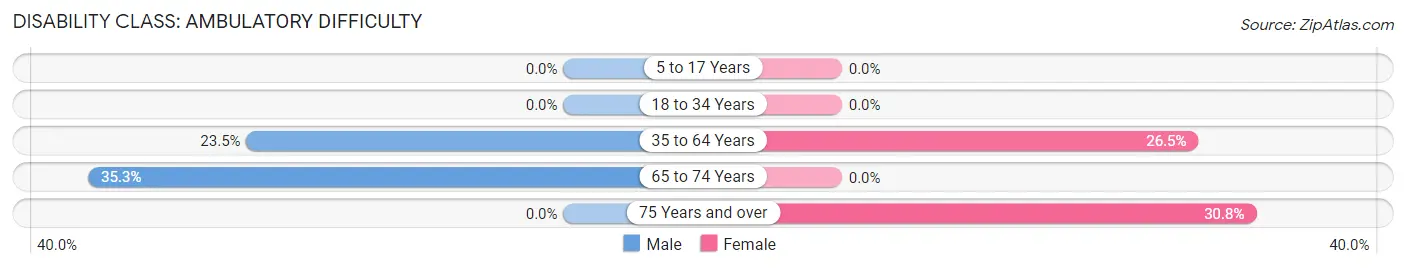
| Age Bracket | Male | Female |
| 5 to 17 Years | 0 (0.0%) | 0 (0.0%) |
| 18 to 34 Years | 0 (0.0%) | 0 (0.0%) |
| 35 to 64 Years | 12 (23.5%) | 9 (26.5%) |
| 65 to 74 Years | 6 (35.3%) | 0 (0.0%) |
| 75 Years and over | 0 (0.0%) | 4 (30.8%) |
Disability Class: Self-Care Difficulty
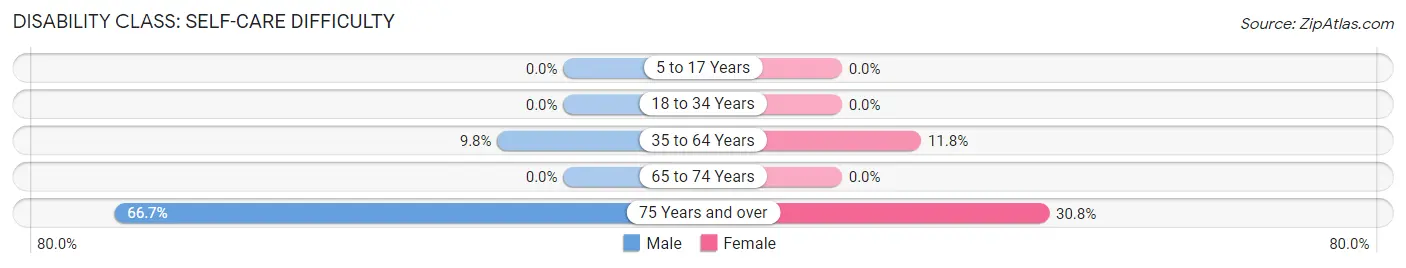
| Age Bracket | Male | Female |
| 5 to 17 Years | 0 (0.0%) | 0 (0.0%) |
| 18 to 34 Years | 0 (0.0%) | 0 (0.0%) |
| 35 to 64 Years | 5 (9.8%) | 4 (11.8%) |
| 65 to 74 Years | 0 (0.0%) | 0 (0.0%) |
| 75 Years and over | 2 (66.7%) | 4 (30.8%) |
Technology Access in Smyrna
Computing Device Access in Smyrna
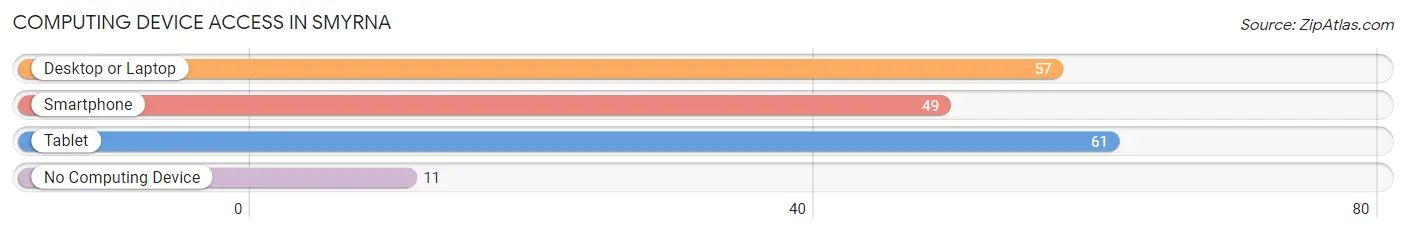
| Device Type | # Households | % Households |
| Desktop or Laptop | 57 | 64.0% |
| Smartphone | 49 | 55.1% |
| Tablet | 61 | 68.5% |
| No Computing Device | 11 | 12.4% |
| Total | 89 | 100.0% |
Internet Access in Smyrna
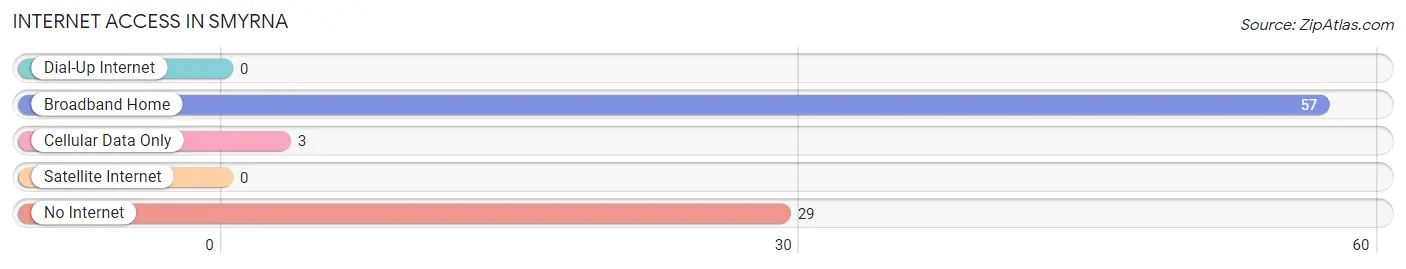
| Internet Type | # Households | % Households |
| Dial-Up Internet | 0 | 0.0% |
| Broadband Home | 57 | 64.0% |
| Cellular Data Only | 3 | 3.4% |
| Satellite Internet | 0 | 0.0% |
| No Internet | 29 | 32.6% |
| Total | 89 | 100.0% |
Smyrna Summary
Smyrna is a small town located in Chenango County, New York, United States. The town is situated in the south-central part of the county, and is bordered by the towns of Norwich, North Norwich, and Sherburne. The population of Smyrna was 1,845 at the 2010 census.
History
Smyrna was first settled in 1793 by a group of settlers from Connecticut. The town was originally part of the town of Norwich, but was separated in 1807 and incorporated as the town of Smyrna. The town was named after the ancient city of Smyrna in Asia Minor.
The town of Smyrna was an agricultural community for much of its history. The town was home to several gristmills, sawmills, and a tannery. The Chenango Canal, which opened in 1837, ran through the town and provided a transportation route for goods and people.
Geography
Smyrna is located in the south-central part of Chenango County, and is bordered by the towns of Norwich, North Norwich, and Sherburne. The town is located in the Finger Lakes region of New York, and is situated on the western edge of the Chenango Valley.
The town of Smyrna is located in the Chenango Valley, which is a flat, fertile valley surrounded by hills. The valley is drained by the Chenango River, which flows through the town. The highest point in the town is an unnamed hill in the northwest corner of the town, which has an elevation of 1,400 feet (427 m).
Economy
The economy of Smyrna is largely based on agriculture. The town is home to several dairy farms, as well as a number of fruit and vegetable farms. The town is also home to several small businesses, including a sawmill, a gristmill, and a tannery.
Demographics
As of the 2010 census, there were 1,845 people, 717 households, and 486 families residing in the town. The population density was 57.2 people per square mile (22.1/km2). There were 790 housing units at an average density of 24.3 per square mile (9.4/km2). The racial makeup of the town was 97.3% White, 0.7% African American, 0.2% Native American, 0.2% Asian, 0.1% Pacific Islander, 0.2% from other races, and 1.3% from two or more races. Hispanic or Latino of any race were 1.3% of the population.
There were 717 households, out of which 30.2% had children under the age of 18 living with them, 51.2% were married couples living together, 9.7% had a female householder with no husband present, and 33.7% were non-families. 28.2% of all households were made up of individuals, and 13.2% had someone living alone who was 65 years of age or older. The average household size was 2.45 and the average family size was 2.97.
In the town, the population was spread out, with 24.7% under the age of 18, 6.2% from 18 to 24, 25.2% from 25 to 44, 27.2% from 45 to 64, and 16.7% who were 65 years of age or older. The median age was 40 years. For every 100 females, there were 97.2 males. For every 100 females age 18 and over, there were 94.2 males.
The median income for a household in the town was $37,500, and the median income for a family was $45,000. Males had a median income of $31,250 versus $25,000 for females. The per capita income for the town was $17,945. About 8.2% of families and 11.2% of the population were below the poverty line, including 14.2% of those under age 18 and 8.2% of those age 65 or over.
Common Questions
What is Per Capita Income in Smyrna?
Per Capita income in Smyrna is $29,944.
What is the Median Family Income in Smyrna?
Median Family Income in Smyrna is $47,500.
What is the Median Household income in Smyrna?
Median Household Income in Smyrna is $34,464.
What is Income or Wage Gap in Smyrna?
Income or Wage Gap in Smyrna is 22.3%.
Women in Smyrna earn 77.7 cents for every dollar earned by a man.
What is Inequality or Gini Index in Smyrna?
Inequality or Gini Index in Smyrna is 0.55.
What is the Total Population of Smyrna?
Total Population of Smyrna is 193.
What is the Total Male Population of Smyrna?
Total Male Population of Smyrna is 112.
What is the Total Female Population of Smyrna?
Total Female Population of Smyrna is 81.
What is the Ratio of Males per 100 Females in Smyrna?
There are 138.27 Males per 100 Females in Smyrna.
What is the Ratio of Females per 100 Males in Smyrna?
There are 72.32 Females per 100 Males in Smyrna.
What is the Median Population Age in Smyrna?
Median Population Age in Smyrna is 40.8 Years.
What is the Average Family Size in Smyrna
Average Family Size in Smyrna is 3.1 People.
What is the Average Household Size in Smyrna
Average Household Size in Smyrna is 2.2 People.
How Large is the Labor Force in Smyrna?
There are 84 People in the Labor Forcein in Smyrna.
What is the Percentage of People in the Labor Force in Smyrna?
54.5% of People are in the Labor Force in Smyrna.
What is the Unemployment Rate in Smyrna?
Unemployment Rate in Smyrna is 4.8%.