Savannah, NY Map & Demographics
Savannah Map
Savannah Overview
$26,527
PER CAPITA INCOME
$74,000
AVG FAMILY INCOME
$46,029
AVG HOUSEHOLD INCOME
22.3%
WAGE / INCOME GAP [ % ]
77.7¢/ $1
WAGE / INCOME GAP [ $ ]
0.33
INEQUALITY / GINI INDEX
401
TOTAL POPULATION
187
MALE POPULATION
214
FEMALE POPULATION
87.38
MALES / 100 FEMALES
114.44
FEMALES / 100 MALES
44.0
MEDIAN AGE
3.5
AVG FAMILY SIZE
2.2
AVG HOUSEHOLD SIZE
158
LABOR FORCE [ PEOPLE ]
47.9%
PERCENT IN LABOR FORCE
14.6%
UNEMPLOYMENT RATE
Savannah Zip Codes
Savannah Area Codes
Income in Savannah
Income Overview in Savannah
Per Capita Income in Savannah is $26,527, while median incomes of families and households are $74,000 and $46,029 respectively.
| Characteristic | Number | Measure |
| Per Capita Income | 401 | $26,527 |
| Median Family Income | 84 | $74,000 |
| Mean Family Income | 84 | $79,081 |
| Median Household Income | 176 | $46,029 |
| Mean Household Income | 176 | $58,359 |
| Income Deficit | 84 | $0 |
| Wage / Income Gap (%) | 401 | 22.33% |
| Wage / Income Gap ($) | 401 | 77.67¢ per $1 |
| Gini / Inequality Index | 401 | 0.33 |
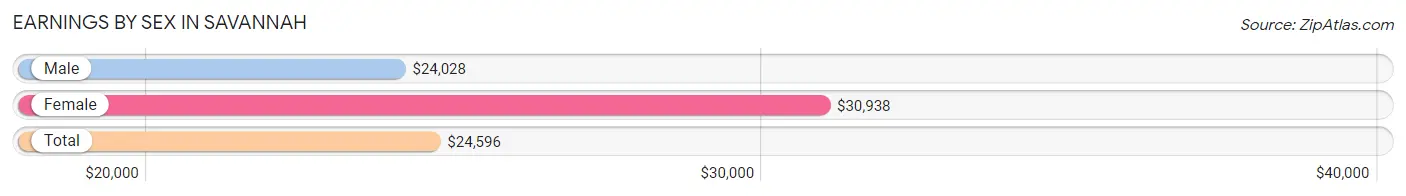
Earnings by Sex in Savannah
Average Earnings in Savannah are $24,596, $24,028 for men and $30,938 for women, a difference of 22.3%.
| Sex | Number | Average Earnings |
| Male | 94 (53.7%) | $24,028 |
| Female | 81 (46.3%) | $30,938 |
| Total | 175 (100.0%) | $24,596 |
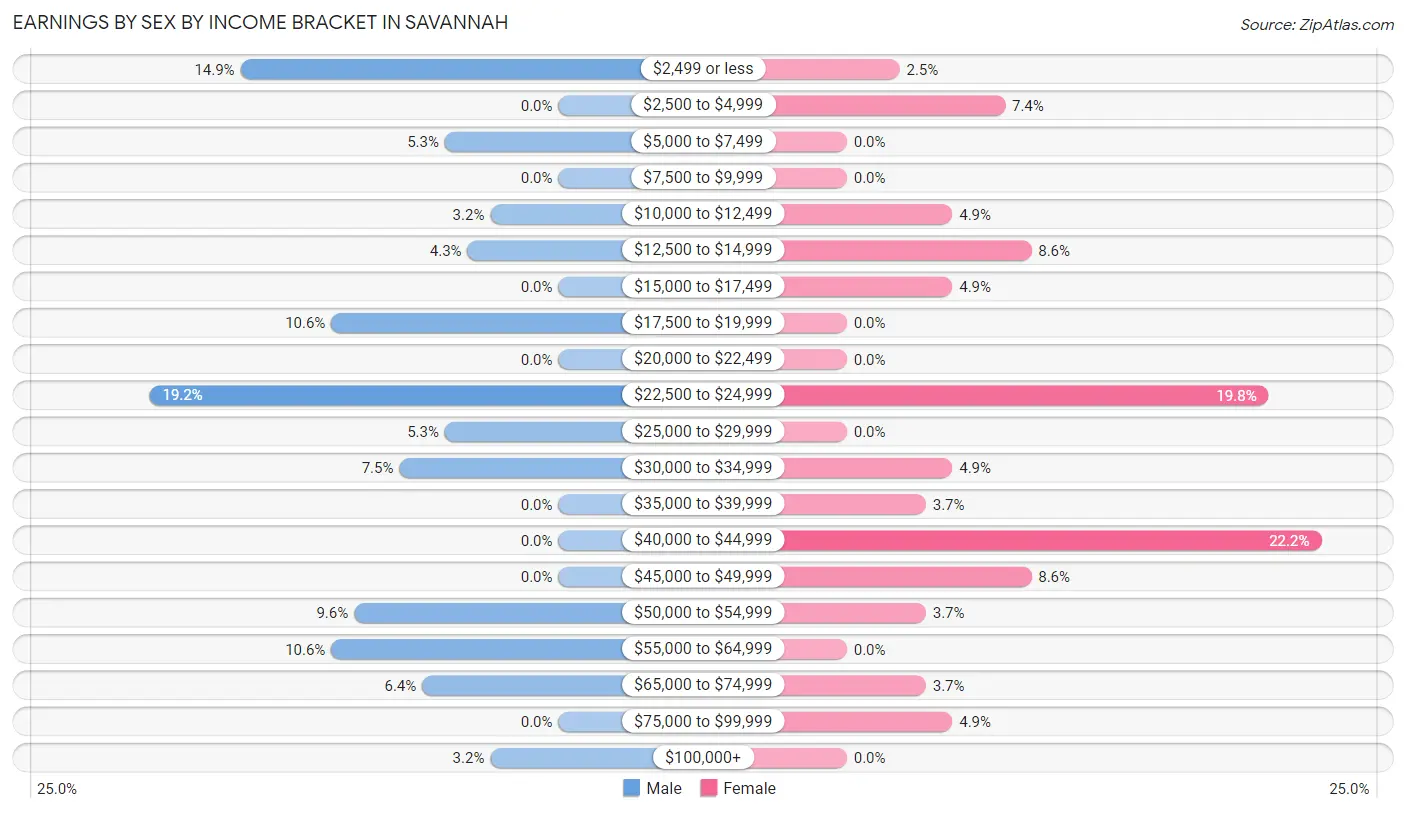
Earnings by Sex by Income Bracket in Savannah
The most common earnings brackets in Savannah are $22,500 to $24,999 for men (18 | 19.2%) and $40,000 to $44,999 for women (18 | 22.2%).
| Income | Male | Female |
| $2,499 or less | 14 (14.9%) | 2 (2.5%) |
| $2,500 to $4,999 | 0 (0.0%) | 6 (7.4%) |
| $5,000 to $7,499 | 5 (5.3%) | 0 (0.0%) |
| $7,500 to $9,999 | 0 (0.0%) | 0 (0.0%) |
| $10,000 to $12,499 | 3 (3.2%) | 4 (4.9%) |
| $12,500 to $14,999 | 4 (4.3%) | 7 (8.6%) |
| $15,000 to $17,499 | 0 (0.0%) | 4 (4.9%) |
| $17,500 to $19,999 | 10 (10.6%) | 0 (0.0%) |
| $20,000 to $22,499 | 0 (0.0%) | 0 (0.0%) |
| $22,500 to $24,999 | 18 (19.2%) | 16 (19.8%) |
| $25,000 to $29,999 | 5 (5.3%) | 0 (0.0%) |
| $30,000 to $34,999 | 7 (7.4%) | 4 (4.9%) |
| $35,000 to $39,999 | 0 (0.0%) | 3 (3.7%) |
| $40,000 to $44,999 | 0 (0.0%) | 18 (22.2%) |
| $45,000 to $49,999 | 0 (0.0%) | 7 (8.6%) |
| $50,000 to $54,999 | 9 (9.6%) | 3 (3.7%) |
| $55,000 to $64,999 | 10 (10.6%) | 0 (0.0%) |
| $65,000 to $74,999 | 6 (6.4%) | 3 (3.7%) |
| $75,000 to $99,999 | 0 (0.0%) | 4 (4.9%) |
| $100,000+ | 3 (3.2%) | 0 (0.0%) |
| Total | 94 (100.0%) | 81 (100.0%) |
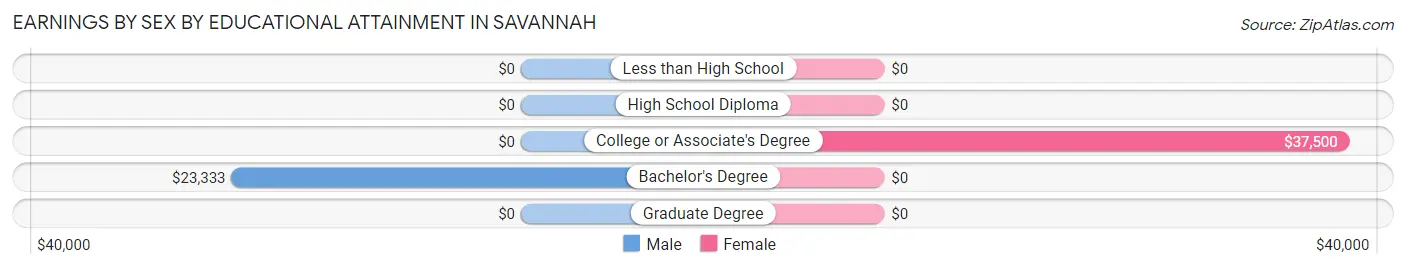
Earnings by Sex by Educational Attainment in Savannah
Average earnings in Savannah are $24,931 for men and $38,333 for women, a difference of 35.0%. Men with an educational attainment of bachelor's degree enjoy the highest average annual earnings of $23,333, while those with bachelor's degree education earn the least with $23,333. Women with an educational attainment of college or associate's degree earn the most with the average annual earnings of $37,500, while those with college or associate's degree education have the smallest earnings of $37,500.
| Educational Attainment | Male Income | Female Income |
| Less than High School | - | - |
| High School Diploma | - | - |
| College or Associate's Degree | - | - |
| Bachelor's Degree | $23,333 | $0 |
| Graduate Degree | - | - |
| Total | $24,931 | $38,333 |
Family Income in Savannah
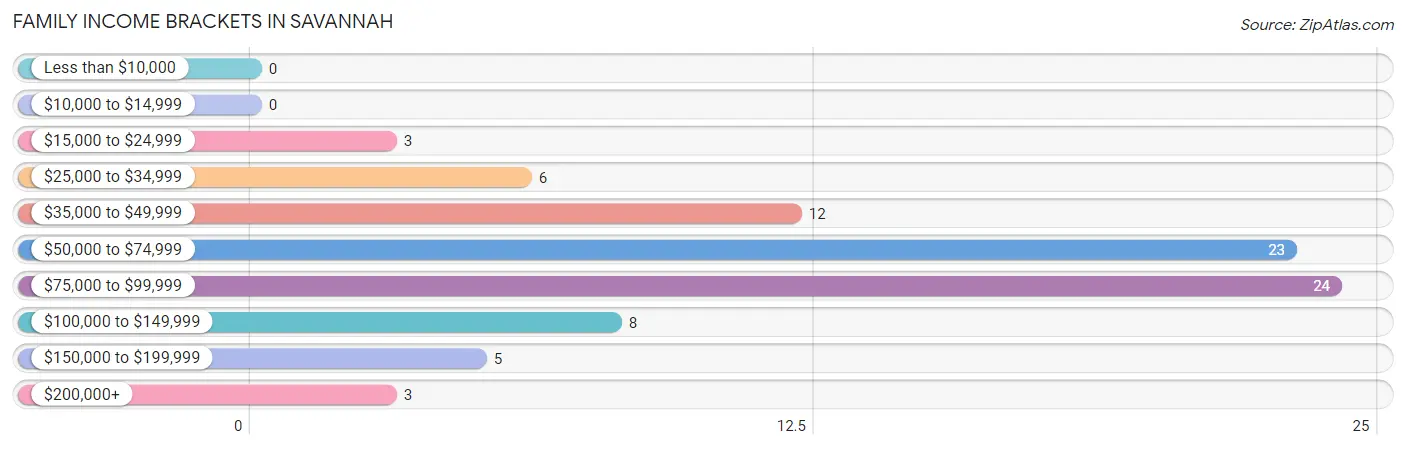
Family Income Brackets in Savannah
According to the Savannah family income data, there are 24 families falling into the $75,000 to $99,999 income range, which is the most common income bracket and makes up 28.6% of all families.
| Income Bracket | # Families | % Families |
| Less than $10,000 | 0 | 0.0% |
| $10,000 to $14,999 | 0 | 0.0% |
| $15,000 to $24,999 | 3 | 3.6% |
| $25,000 to $34,999 | 6 | 7.1% |
| $35,000 to $49,999 | 12 | 14.3% |
| $50,000 to $74,999 | 23 | 27.4% |
| $75,000 to $99,999 | 24 | 28.6% |
| $100,000 to $149,999 | 8 | 9.5% |
| $150,000 to $199,999 | 5 | 6.0% |
| $200,000+ | 3 | 3.6% |
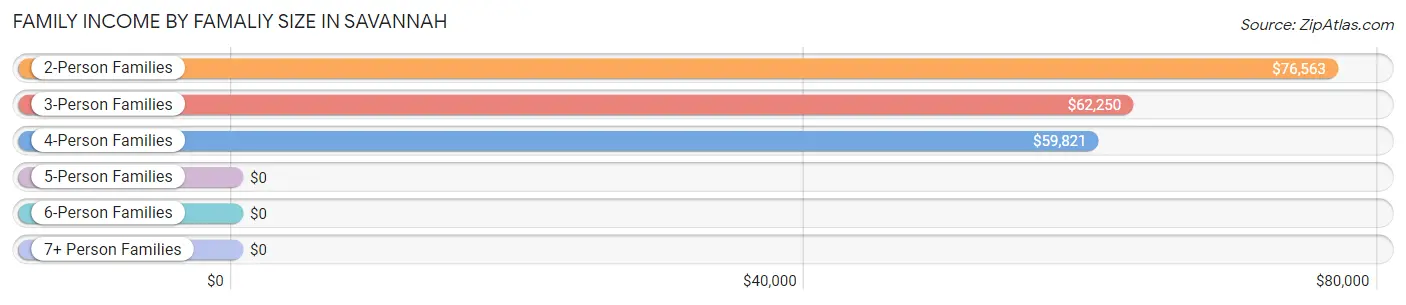
Family Income by Famaliy Size in Savannah
2-person families (41 | 48.8%) account for the highest median family income in Savannah with $76,563 per family, while 2-person families (41 | 48.8%) have the highest median income of $38,282 per family member.
| Income Bracket | # Families | Median Income |
| 2-Person Families | 41 (48.8%) | $76,563 |
| 3-Person Families | 17 (20.2%) | $62,250 |
| 4-Person Families | 13 (15.5%) | $59,821 |
| 5-Person Families | 3 (3.6%) | $0 |
| 6-Person Families | 3 (3.6%) | $0 |
| 7+ Person Families | 7 (8.3%) | $0 |
| Total | 84 (100.0%) | $74,000 |
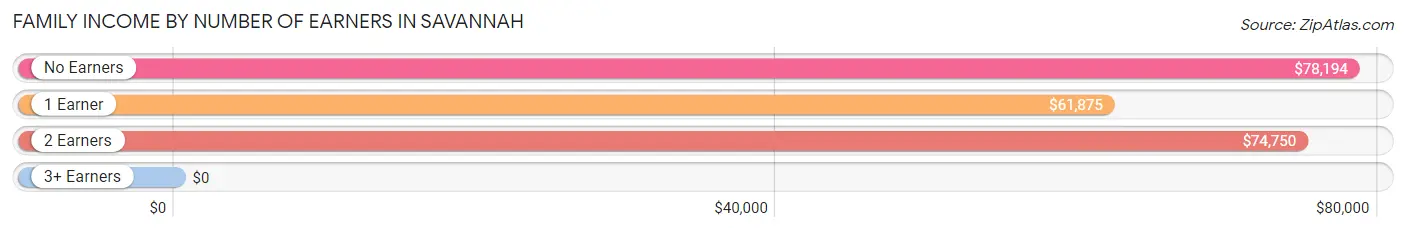
Family Income by Number of Earners in Savannah
| Number of Earners | # Families | Median Income |
| No Earners | 21 (25.0%) | $78,194 |
| 1 Earner | 27 (32.1%) | $61,875 |
| 2 Earners | 23 (27.4%) | $74,750 |
| 3+ Earners | 13 (15.5%) | $0 |
| Total | 84 (100.0%) | $74,000 |
Household Income in Savannah
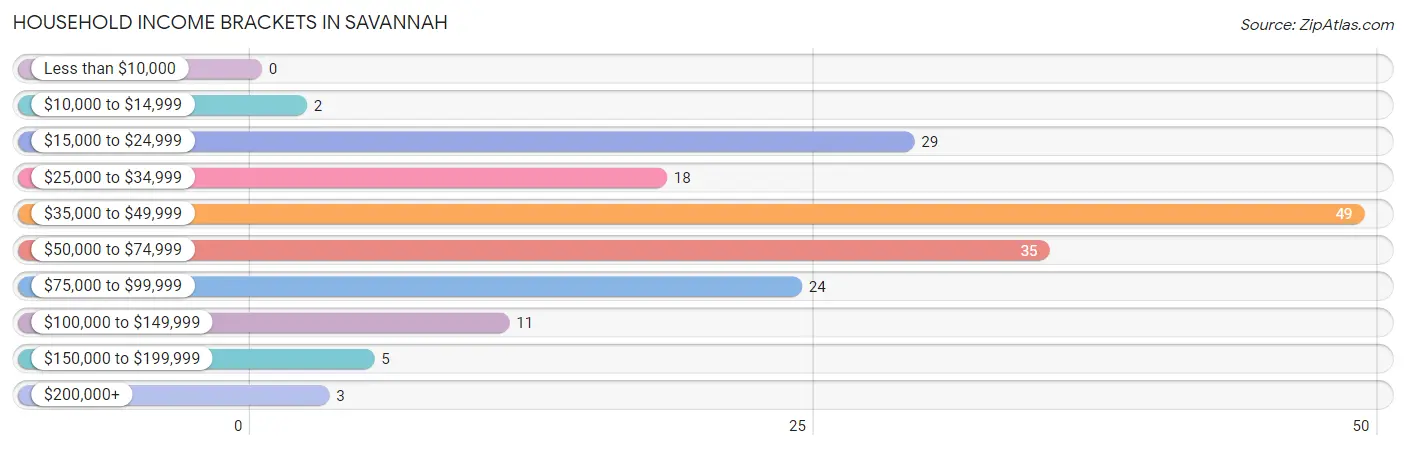
Household Income Brackets in Savannah
With 49 households falling in the category, the $35,000 to $49,999 income range is the most frequent in Savannah, accounting for 27.8% of all households.
| Income Bracket | # Households | % Households |
| Less than $10,000 | 0 | 0.0% |
| $10,000 to $14,999 | 2 | 1.1% |
| $15,000 to $24,999 | 29 | 16.5% |
| $25,000 to $34,999 | 18 | 10.2% |
| $35,000 to $49,999 | 49 | 27.8% |
| $50,000 to $74,999 | 35 | 19.9% |
| $75,000 to $99,999 | 24 | 13.6% |
| $100,000 to $149,999 | 11 | 6.3% |
| $150,000 to $199,999 | 5 | 2.8% |
| $200,000+ | 3 | 1.7% |
Household Income by Householder Age in Savannah
The median household income in Savannah is $46,029, with the highest median household income of $46,964 found in the 45 to 64 years age bracket for the primary householder. A total of 37 households (21.0%) fall into this category.
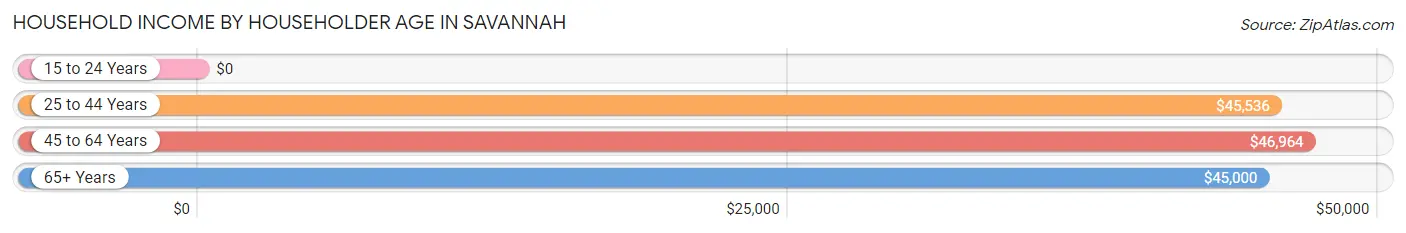
| Income Bracket | # Households | Median Income |
| 15 to 24 Years | 0 (0.0%) | $0 |
| 25 to 44 Years | 61 (34.7%) | $45,536 |
| 45 to 64 Years | 37 (21.0%) | $46,964 |
| 65+ Years | 78 (44.3%) | $45,000 |
| Total | 176 (100.0%) | $46,029 |
Poverty in Savannah
Income Below Poverty by Sex and Age in Savannah
With 23.0% poverty level for males and 18.2% for females among the residents of Savannah, under 5 year old males and 16 and 17 year old females are the most vulnerable to poverty, with 14 males (100.0%) and 4 females (100.0%) in their respective age groups living below the poverty level.
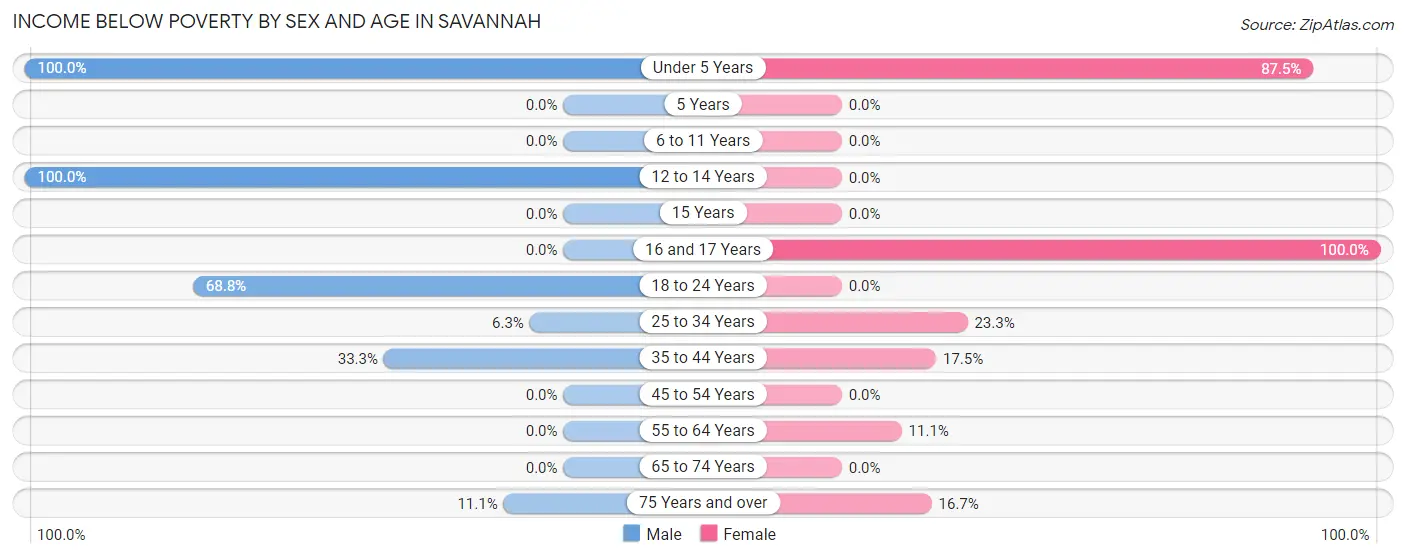
| Age Bracket | Male | Female |
| Under 5 Years | 14 (100.0%) | 14 (87.5%) |
| 5 Years | 0 (0.0%) | 0 (0.0%) |
| 6 to 11 Years | 0 (0.0%) | 0 (0.0%) |
| 12 to 14 Years | 5 (100.0%) | 0 (0.0%) |
| 15 Years | 0 (0.0%) | 0 (0.0%) |
| 16 and 17 Years | 0 (0.0%) | 4 (100.0%) |
| 18 to 24 Years | 11 (68.8%) | 0 (0.0%) |
| 25 to 34 Years | 1 (6.2%) | 7 (23.3%) |
| 35 to 44 Years | 10 (33.3%) | 7 (17.5%) |
| 45 to 54 Years | 0 (0.0%) | 0 (0.0%) |
| 55 to 64 Years | 0 (0.0%) | 2 (11.1%) |
| 65 to 74 Years | 0 (0.0%) | 0 (0.0%) |
| 75 Years and over | 2 (11.1%) | 5 (16.7%) |
| Total | 43 (23.0%) | 39 (18.2%) |
Income Above Poverty by Sex and Age in Savannah
According to the poverty statistics in Savannah, males aged 6 to 11 years and females aged 5 years are the age groups that are most secure financially, with 100.0% of males and 100.0% of females in these age groups living above the poverty line.
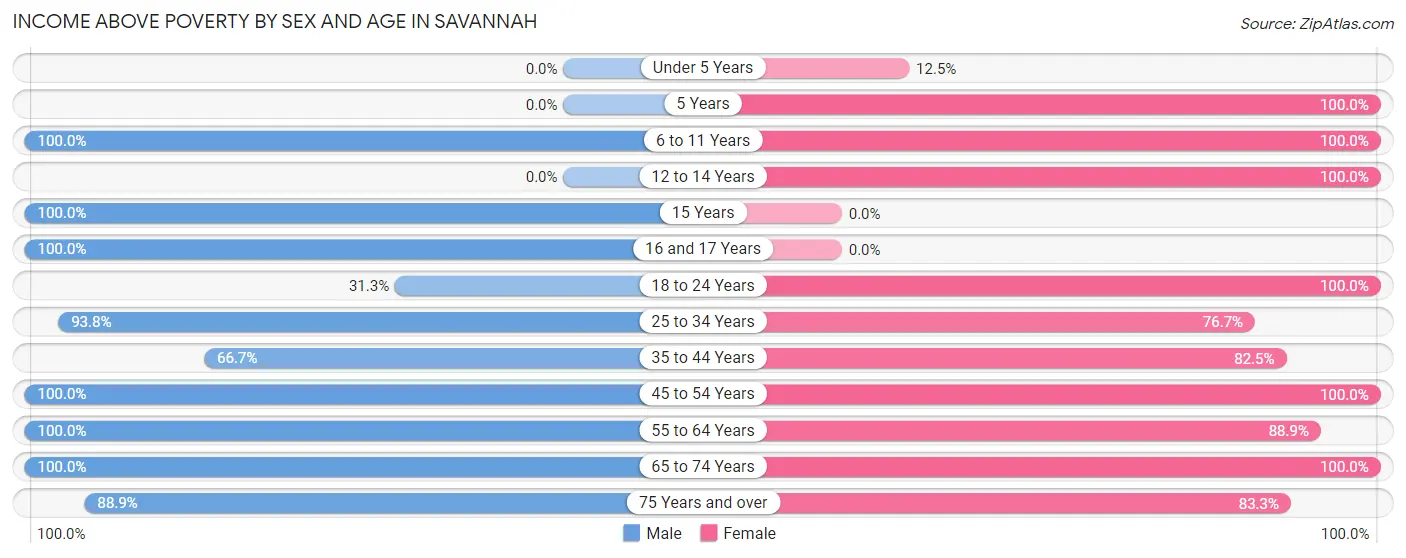
| Age Bracket | Male | Female |
| Under 5 Years | 0 (0.0%) | 2 (12.5%) |
| 5 Years | 0 (0.0%) | 3 (100.0%) |
| 6 to 11 Years | 7 (100.0%) | 9 (100.0%) |
| 12 to 14 Years | 0 (0.0%) | 9 (100.0%) |
| 15 Years | 8 (100.0%) | 0 (0.0%) |
| 16 and 17 Years | 4 (100.0%) | 0 (0.0%) |
| 18 to 24 Years | 5 (31.2%) | 3 (100.0%) |
| 25 to 34 Years | 15 (93.8%) | 23 (76.7%) |
| 35 to 44 Years | 20 (66.7%) | 33 (82.5%) |
| 45 to 54 Years | 8 (100.0%) | 23 (100.0%) |
| 55 to 64 Years | 19 (100.0%) | 16 (88.9%) |
| 65 to 74 Years | 42 (100.0%) | 29 (100.0%) |
| 75 Years and over | 16 (88.9%) | 25 (83.3%) |
| Total | 144 (77.0%) | 175 (81.8%) |
Income Below Poverty Among Married-Couple Families in Savannah
The poverty statistics for married-couple families in Savannah show that 8.9% or 7 of the total 79 families live below the poverty line. Families with 3 or 4 children have the highest poverty rate of 70.0%, comprising of 7 families. On the other hand, families with no children have the lowest poverty rate of 0.0%, which includes 0 families.
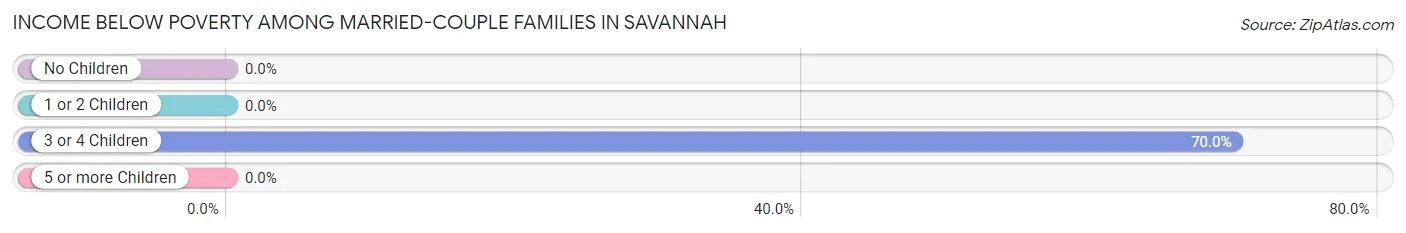
| Children | Above Poverty | Below Poverty |
| No Children | 48 (100.0%) | 0 (0.0%) |
| 1 or 2 Children | 21 (100.0%) | 0 (0.0%) |
| 3 or 4 Children | 3 (30.0%) | 7 (70.0%) |
| 5 or more Children | 0 (0.0%) | 0 (0.0%) |
| Total | 72 (91.1%) | 7 (8.9%) |
Income Below Poverty Among Single-Parent Households in Savannah
| Children | Single Father | Single Mother |
| No Children | 0 (0.0%) | 0 (0.0%) |
| 1 or 2 Children | 0 (0.0%) | 0 (0.0%) |
| 3 or 4 Children | 0 (0.0%) | 0 (0.0%) |
| 5 or more Children | 0 (0.0%) | 0 (0.0%) |
| Total | 0 (0.0%) | 0 (0.0%) |
Income Below Poverty Among Married-Couple vs Single-Parent Households in Savannah
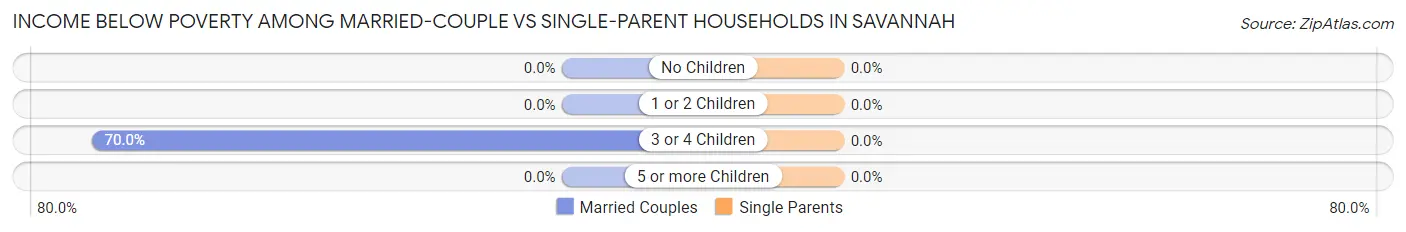
| Children | Married-Couple Families | Single-Parent Households |
| No Children | 0 (0.0%) | 0 (0.0%) |
| 1 or 2 Children | 0 (0.0%) | 0 (0.0%) |
| 3 or 4 Children | 7 (70.0%) | 0 (0.0%) |
| 5 or more Children | 0 (0.0%) | 0 (0.0%) |
| Total | 7 (8.9%) | 0 (0.0%) |
Race in Savannah
The most populous races in Savannah are White / Caucasian (332 | 82.8%), Two or more Races (67 | 16.7%), and Hispanic or Latino (24 | 6.0%).
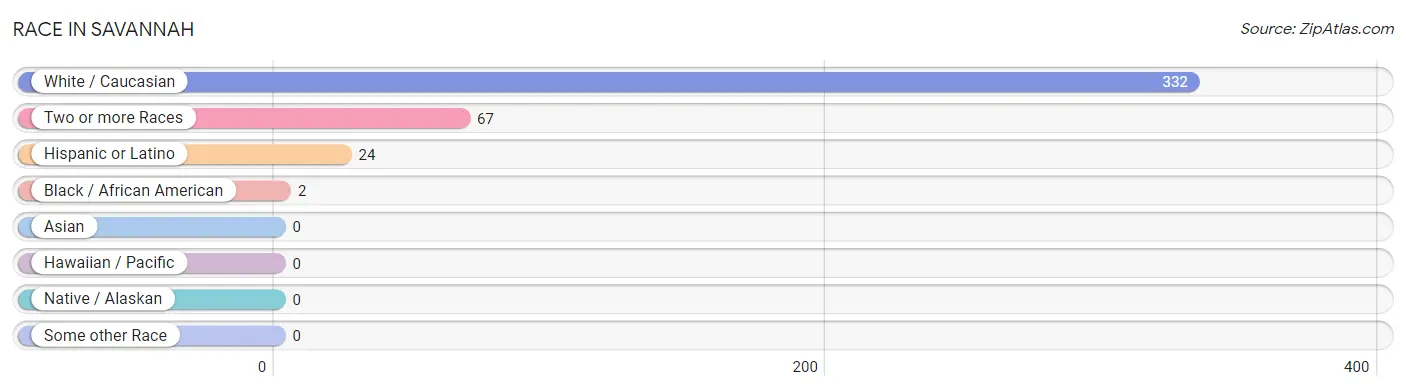
| Race | # Population | % Population |
| Asian | 0 | 0.0% |
| Black / African American | 2 | 0.5% |
| Hawaiian / Pacific | 0 | 0.0% |
| Hispanic or Latino | 24 | 6.0% |
| Native / Alaskan | 0 | 0.0% |
| White / Caucasian | 332 | 82.8% |
| Two or more Races | 67 | 16.7% |
| Some other Race | 0 | 0.0% |
| Total | 401 | 100.0% |
Ancestry in Savannah
The most populous ancestries reported in Savannah are Irish (90 | 22.4%), English (78 | 19.5%), Italian (74 | 18.4%), German (67 | 16.7%), and American (25 | 6.2%), together accounting for 83.3% of all Savannah residents.
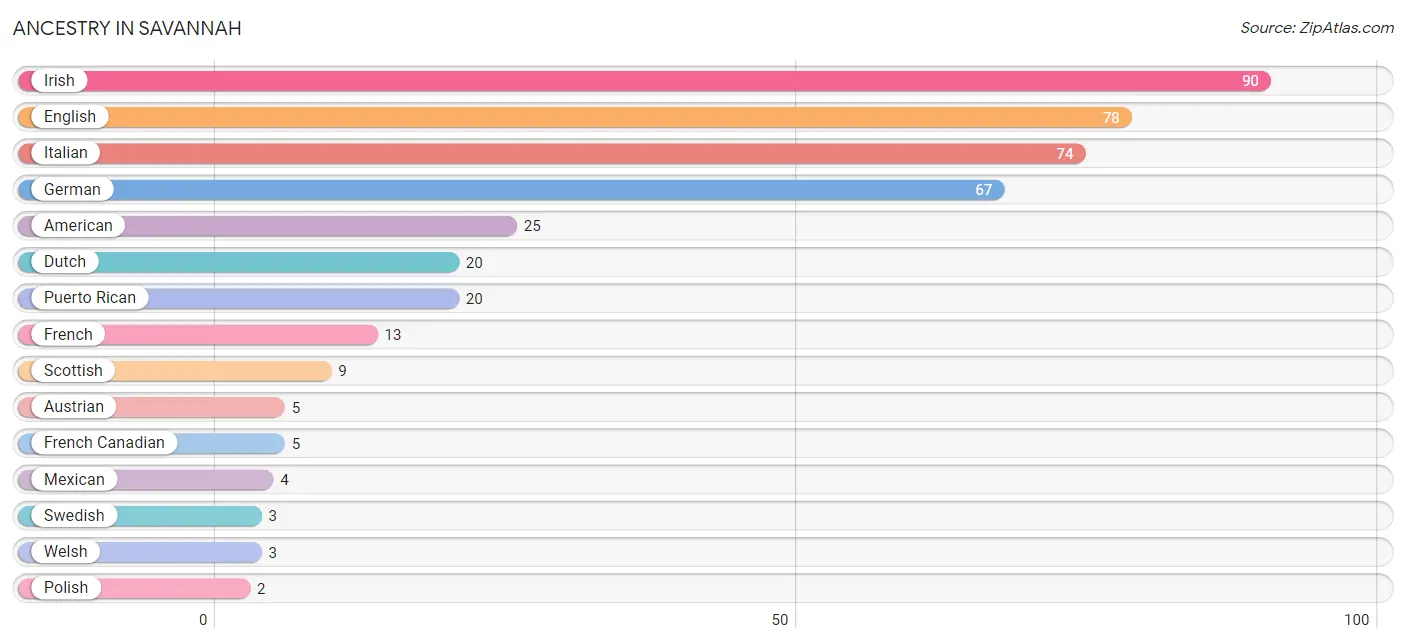
| Ancestry | # Population | % Population |
| American | 25 | 6.2% |
| Austrian | 5 | 1.3% |
| Dutch | 20 | 5.0% |
| English | 78 | 19.5% |
| French | 13 | 3.2% |
| French Canadian | 5 | 1.3% |
| German | 67 | 16.7% |
| Irish | 90 | 22.4% |
| Italian | 74 | 18.4% |
| Mexican | 4 | 1.0% |
| Polish | 2 | 0.5% |
| Puerto Rican | 20 | 5.0% |
| Scottish | 9 | 2.2% |
| Swedish | 3 | 0.7% |
| Welsh | 3 | 0.7% | View All 15 Rows |
Immigrants in Savannah

| Immigration Origin | # Population | % Population | View All 0 Rows |
Sex and Age in Savannah
Sex and Age in Savannah
The most populous age groups in Savannah are 65 to 69 Years (27 | 14.4%) for men and 40 to 44 Years (28 | 13.1%) for women.
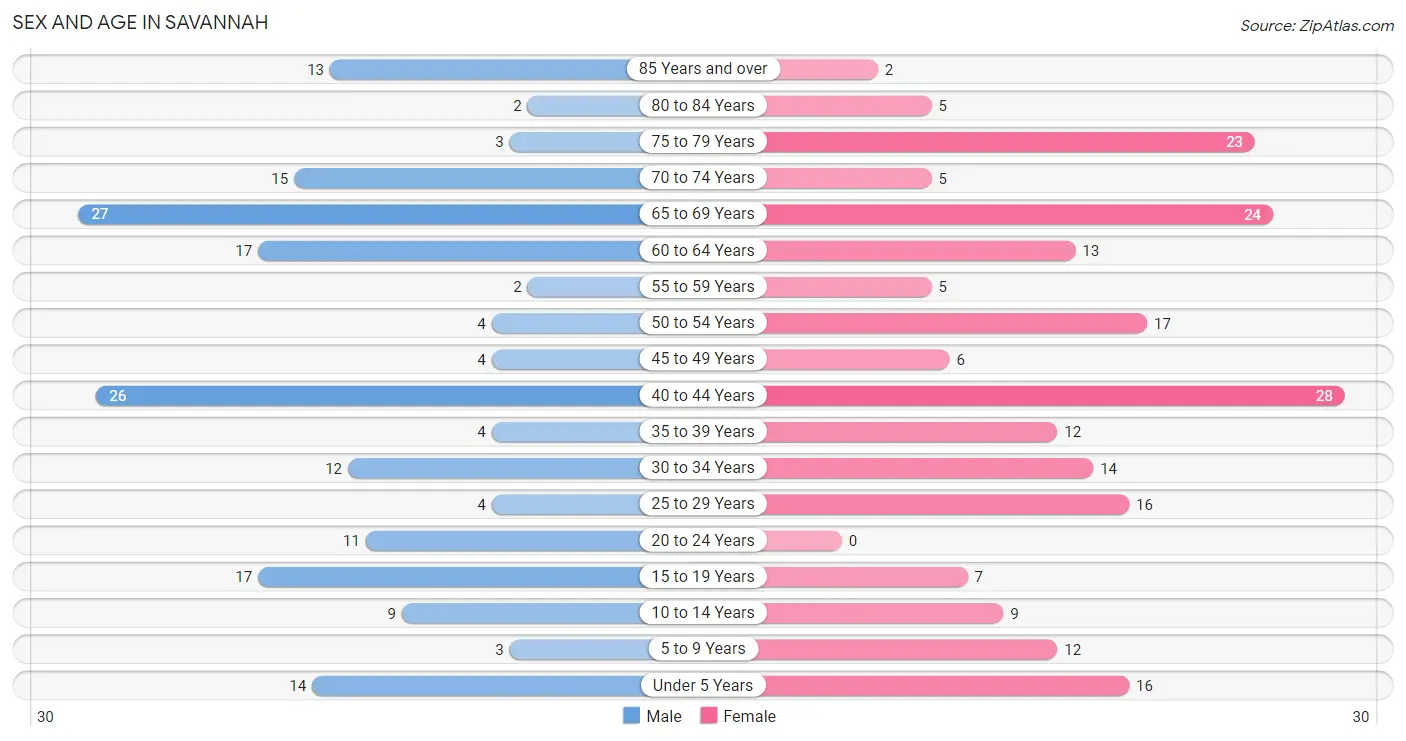
| Age Bracket | Male | Female |
| Under 5 Years | 14 (7.5%) | 16 (7.5%) |
| 5 to 9 Years | 3 (1.6%) | 12 (5.6%) |
| 10 to 14 Years | 9 (4.8%) | 9 (4.2%) |
| 15 to 19 Years | 17 (9.1%) | 7 (3.3%) |
| 20 to 24 Years | 11 (5.9%) | 0 (0.0%) |
| 25 to 29 Years | 4 (2.1%) | 16 (7.5%) |
| 30 to 34 Years | 12 (6.4%) | 14 (6.5%) |
| 35 to 39 Years | 4 (2.1%) | 12 (5.6%) |
| 40 to 44 Years | 26 (13.9%) | 28 (13.1%) |
| 45 to 49 Years | 4 (2.1%) | 6 (2.8%) |
| 50 to 54 Years | 4 (2.1%) | 17 (7.9%) |
| 55 to 59 Years | 2 (1.1%) | 5 (2.3%) |
| 60 to 64 Years | 17 (9.1%) | 13 (6.1%) |
| 65 to 69 Years | 27 (14.4%) | 24 (11.2%) |
| 70 to 74 Years | 15 (8.0%) | 5 (2.3%) |
| 75 to 79 Years | 3 (1.6%) | 23 (10.7%) |
| 80 to 84 Years | 2 (1.1%) | 5 (2.3%) |
| 85 Years and over | 13 (7.0%) | 2 (0.9%) |
| Total | 187 (100.0%) | 214 (100.0%) |
Families and Households in Savannah
Median Family Size in Savannah
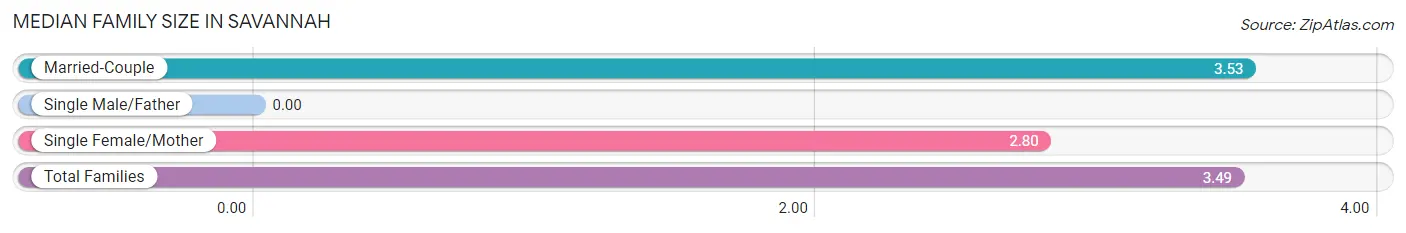
| Family Type | # Families | Family Size |
| Married-Couple | 79 (94.1%) | 3.53 |
| Single Male/Father | 0 (0.0%) | - |
| Single Female/Mother | 5 (5.9%) | 2.80 |
| Total Families | 84 (100.0%) | 3.49 |
Median Household Size in Savannah
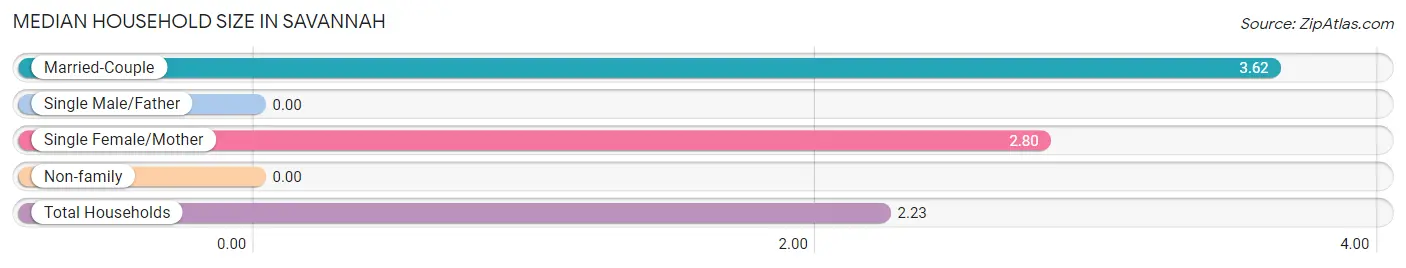
| Household Type | # Households | Household Size |
| Married-Couple | 79 (44.9%) | 3.62 |
| Single Male/Father | 0 (0.0%) | - |
| Single Female/Mother | 5 (2.8%) | 2.80 |
| Non-family | 92 (52.3%) | - |
| Total Households | 176 (100.0%) | 2.23 |
Household Size by Marriage Status in Savannah
Out of a total of 176 households in Savannah, 84 (47.7%) are family households, while 92 (52.3%) are nonfamily households. The most numerous type of family households are 2-person households, comprising 39, and the most common type of nonfamily households are 1-person households, comprising 92.
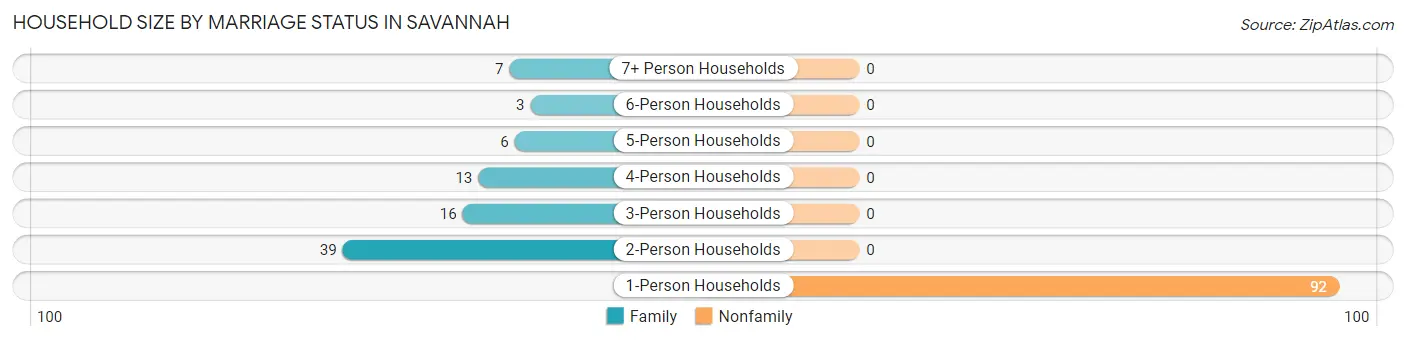
| Household Size | Family Households | Nonfamily Households |
| 1-Person Households | - | 92 (52.3%) |
| 2-Person Households | 39 (22.2%) | 0 (0.0%) |
| 3-Person Households | 16 (9.1%) | 0 (0.0%) |
| 4-Person Households | 13 (7.4%) | 0 (0.0%) |
| 5-Person Households | 6 (3.4%) | 0 (0.0%) |
| 6-Person Households | 3 (1.7%) | 0 (0.0%) |
| 7+ Person Households | 7 (4.0%) | 0 (0.0%) |
| Total | 84 (47.7%) | 92 (52.3%) |
Female Fertility in Savannah
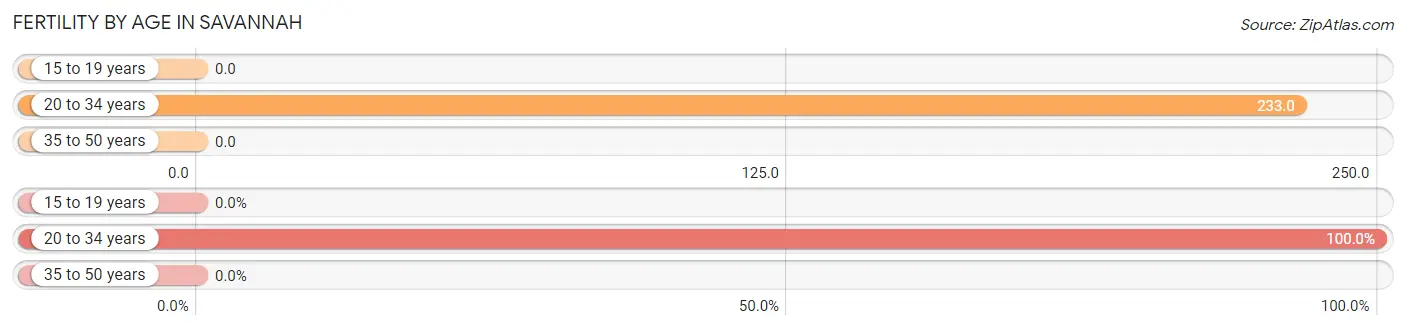
Fertility by Age in Savannah
Average fertility rate in Savannah is 78.0 births per 1,000 women. Women in the age bracket of 20 to 34 years have the highest fertility rate with 233.0 births per 1,000 women. Women in the age bracket of 20 to 34 years acount for 100.0% of all women with births.
| Age Bracket | Women with Births | Births / 1,000 Women |
| 15 to 19 years | 0 (0.0%) | 0.0 |
| 20 to 34 years | 7 (100.0%) | 233.0 |
| 35 to 50 years | 0 (0.0%) | 0.0 |
| Total | 7 (100.0%) | 78.0 |
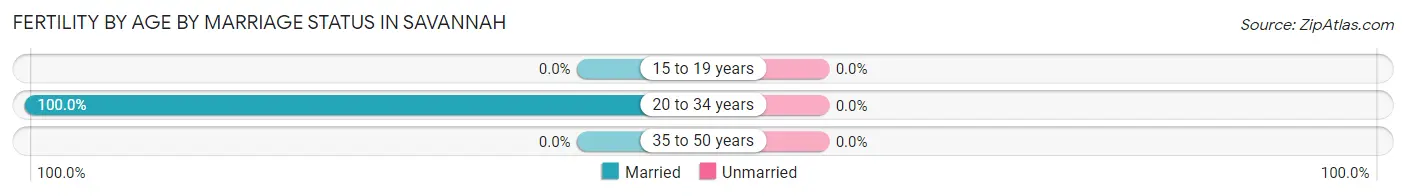
Fertility by Age by Marriage Status in Savannah
| Age Bracket | Married | Unmarried |
| 15 to 19 years | 0 (0.0%) | 0 (0.0%) |
| 20 to 34 years | 7 (100.0%) | 0 (0.0%) |
| 35 to 50 years | 0 (0.0%) | 0 (0.0%) |
| Total | 7 (100.0%) | 0 (0.0%) |
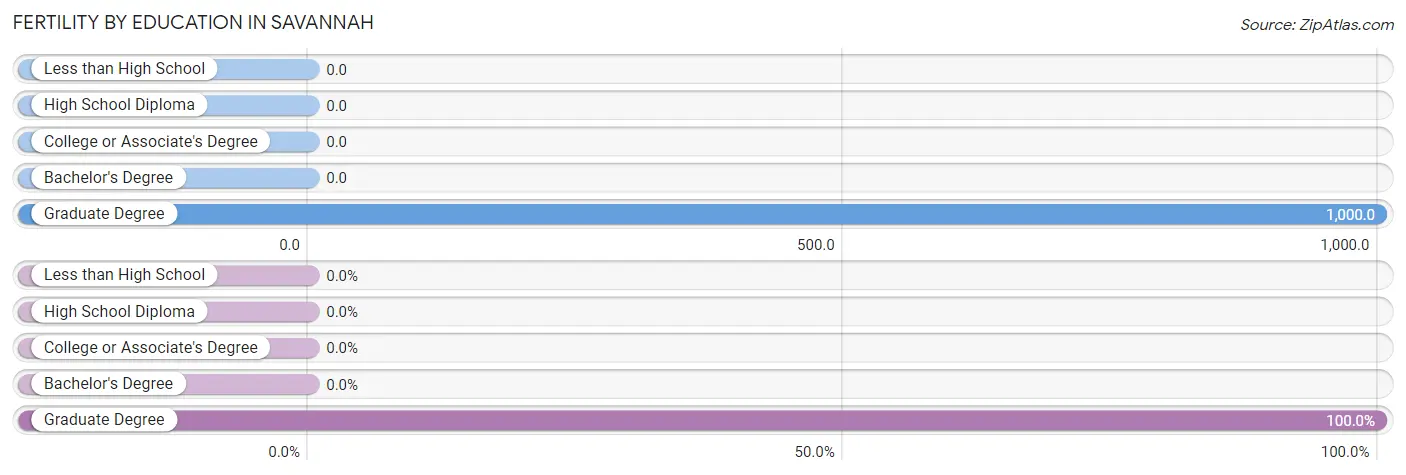
Fertility by Education in Savannah
| Educational Attainment | Women with Births | Births / 1,000 Women |
| Less than High School | 0 (0.0%) | 0.0 |
| High School Diploma | 0 (0.0%) | 0.0 |
| College or Associate's Degree | 0 (0.0%) | 0.0 |
| Bachelor's Degree | 0 (0.0%) | 0.0 |
| Graduate Degree | 7 (100.0%) | 1,000.0 |
| Total | 7 (100.0%) | 78.0 |
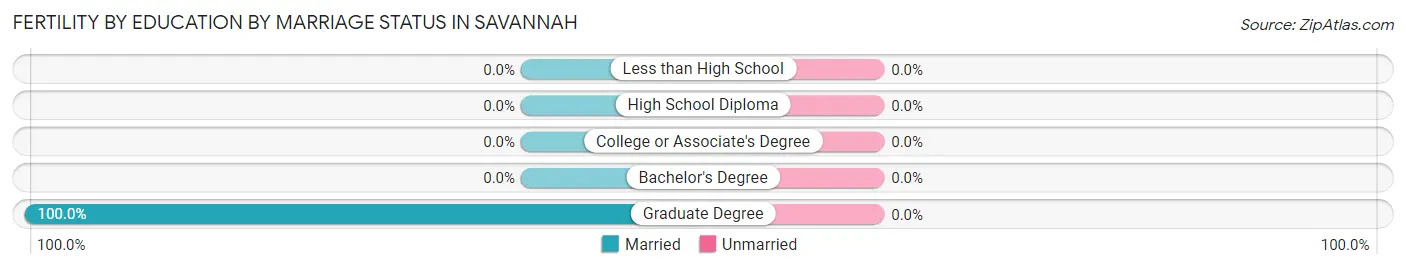
Fertility by Education by Marriage Status in Savannah
| Educational Attainment | Married | Unmarried |
| Less than High School | 0 (0.0%) | 0 (0.0%) |
| High School Diploma | 0 (0.0%) | 0 (0.0%) |
| College or Associate's Degree | 0 (0.0%) | 0 (0.0%) |
| Bachelor's Degree | 0 (0.0%) | 0 (0.0%) |
| Graduate Degree | 7 (100.0%) | 0 (0.0%) |
| Total | 7 (100.0%) | 0 (0.0%) |
Employment Characteristics in Savannah
Employment by Class of Employer in Savannah
Among the 135 employed individuals in Savannah, private company employees (112 | 83.0%), local government employees (14 | 10.4%), and self-employed (incorporated) (3 | 2.2%) make up the most common classes of employment.
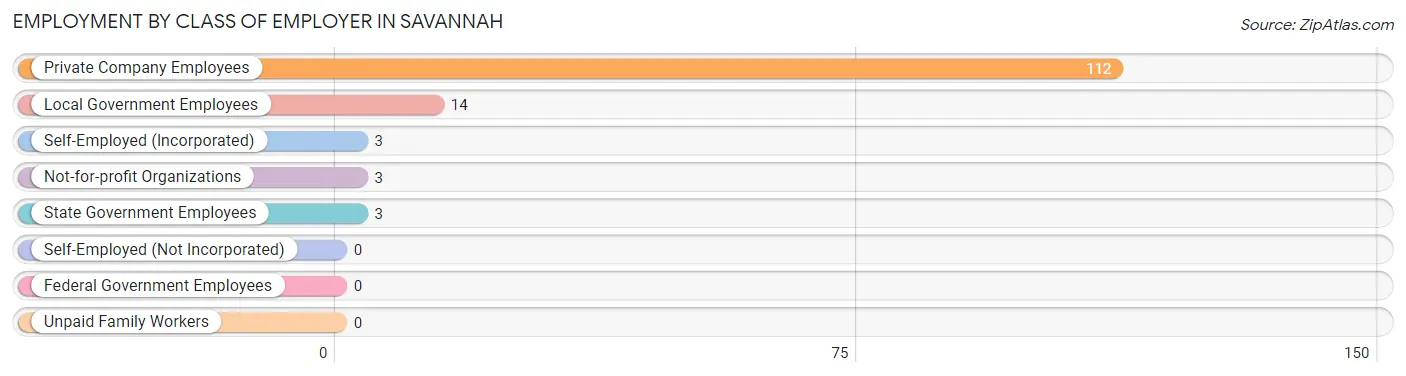
| Employer Class | # Employees | % Employees |
| Private Company Employees | 112 | 83.0% |
| Self-Employed (Incorporated) | 3 | 2.2% |
| Self-Employed (Not Incorporated) | 0 | 0.0% |
| Not-for-profit Organizations | 3 | 2.2% |
| Local Government Employees | 14 | 10.4% |
| State Government Employees | 3 | 2.2% |
| Federal Government Employees | 0 | 0.0% |
| Unpaid Family Workers | 0 | 0.0% |
| Total | 135 | 100.0% |
Employment Status by Age in Savannah
According to the labor force statistics for Savannah, out of the total population over 16 years of age (330), 47.9% or 158 individuals are in the labor force, with 14.6% or 23 of them unemployed. The age group with the highest labor force participation rate is 20 to 24 years, with 100.0% or 11 individuals in the labor force. Within the labor force, the 20 to 24 years age range has the highest percentage of unemployed individuals, with 100.0% or 11 of them being unemployed.
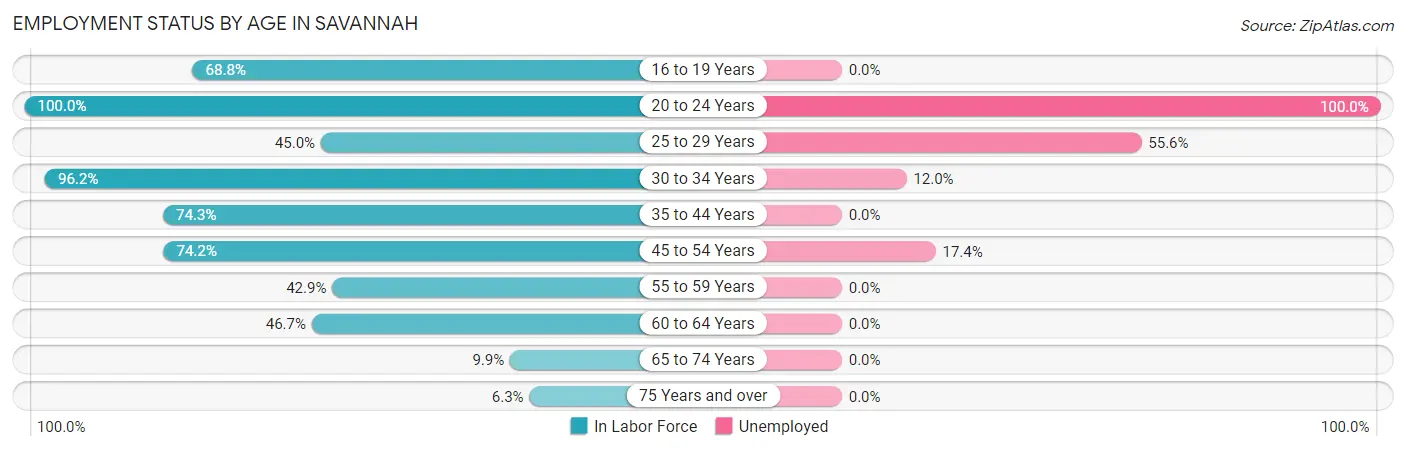
| Age Bracket | In Labor Force | Unemployed |
| 16 to 19 Years | 11 (68.8%) | 0 (0.0%) |
| 20 to 24 Years | 11 (100.0%) | 11 (100.0%) |
| 25 to 29 Years | 9 (45.0%) | 5 (55.6%) |
| 30 to 34 Years | 25 (96.2%) | 3 (12.0%) |
| 35 to 44 Years | 52 (74.3%) | 0 (0.0%) |
| 45 to 54 Years | 23 (74.2%) | 4 (17.4%) |
| 55 to 59 Years | 3 (42.9%) | 0 (0.0%) |
| 60 to 64 Years | 14 (46.7%) | 0 (0.0%) |
| 65 to 74 Years | 7 (9.9%) | 0 (0.0%) |
| 75 Years and over | 3 (6.3%) | 0 (0.0%) |
| Total | 158 (47.9%) | 23 (14.6%) |
Employment Status by Educational Attainment in Savannah
According to labor force statistics for Savannah, 68.5% of individuals (126) out of the total population between 25 and 64 years of age (184) are in the labor force, with 9.5% or 12 of them being unemployed. The group with the highest labor force participation rate are those with the educational attainment of high school diploma, with 80.5% or 70 individuals in the labor force. Within the labor force, individuals with college / associate degree education have the highest percentage of unemployment, with 21.1% or 8 of them being unemployed.
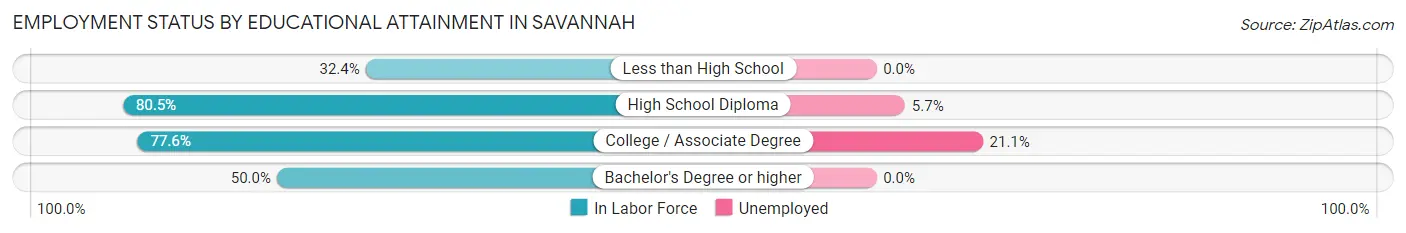
| Educational Attainment | In Labor Force | Unemployed |
| Less than High School | 11 (32.4%) | 0 (0.0%) |
| High School Diploma | 70 (80.5%) | 5 (5.7%) |
| College / Associate Degree | 38 (77.6%) | 10 (21.1%) |
| Bachelor's Degree or higher | 7 (50.0%) | 0 (0.0%) |
| Total | 126 (68.5%) | 17 (9.5%) |
Employment Occupations by Sex in Savannah
Management, Business, Science and Arts Occupations
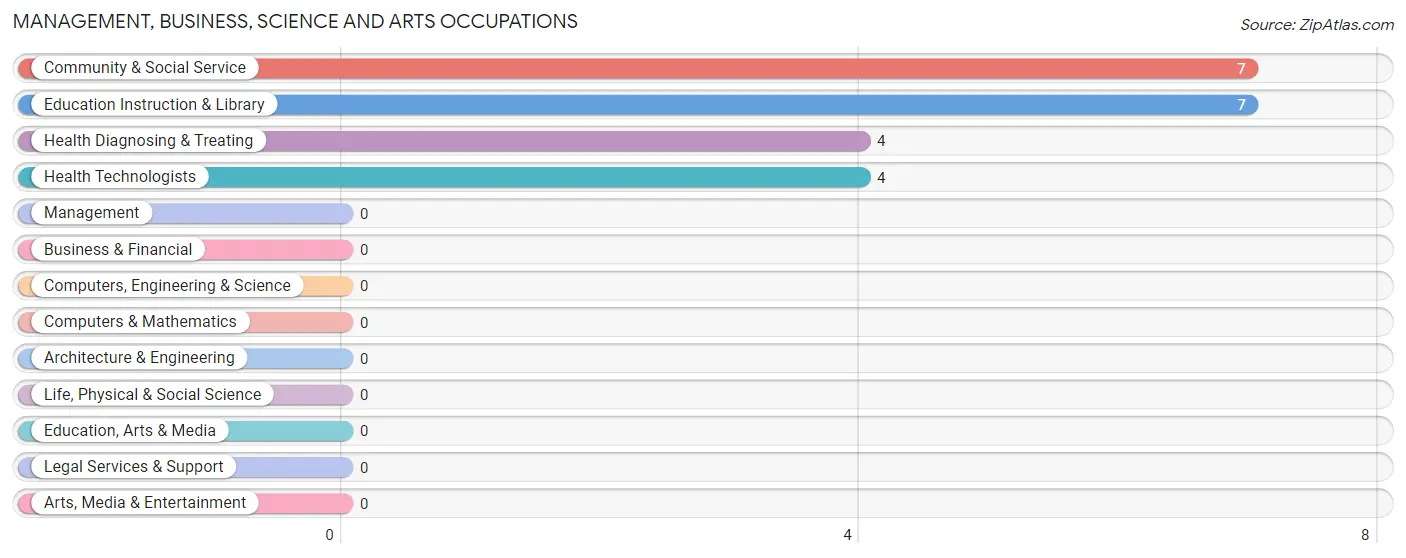
The most common Management, Business, Science and Arts occupations in Savannah are Community & Social Service (7 | 5.2%), Education Instruction & Library (7 | 5.2%), Health Diagnosing & Treating (4 | 3.0%), and Health Technologists (4 | 3.0%).
Management, Business, Science and Arts Occupations by Sex
Within the Management, Business, Science and Arts occupations in Savannah, the most male-oriented occupations are Community & Social Service (42.9%), and Education Instruction & Library (42.9%), while the most female-oriented occupations are Health Diagnosing & Treating (100.0%), Health Technologists (100.0%), and Community & Social Service (57.1%).
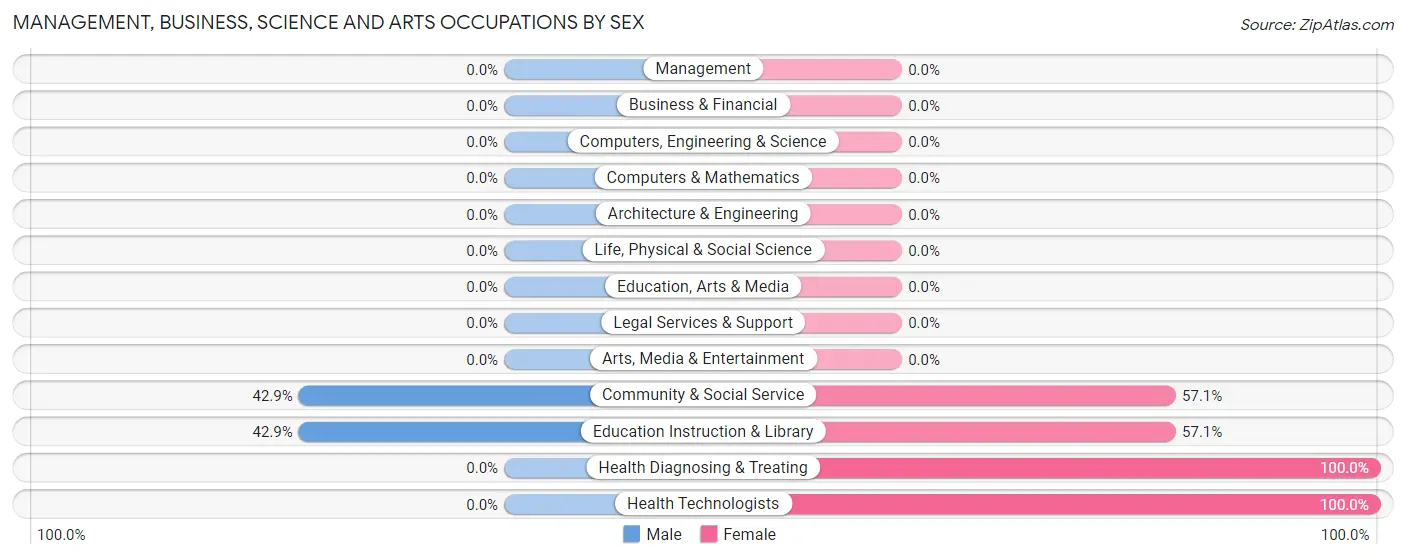
| Occupation | Male | Female |
| Management | 0 (0.0%) | 0 (0.0%) |
| Business & Financial | 0 (0.0%) | 0 (0.0%) |
| Computers, Engineering & Science | 0 (0.0%) | 0 (0.0%) |
| Computers & Mathematics | 0 (0.0%) | 0 (0.0%) |
| Architecture & Engineering | 0 (0.0%) | 0 (0.0%) |
| Life, Physical & Social Science | 0 (0.0%) | 0 (0.0%) |
| Community & Social Service | 3 (42.9%) | 4 (57.1%) |
| Education, Arts & Media | 0 (0.0%) | 0 (0.0%) |
| Legal Services & Support | 0 (0.0%) | 0 (0.0%) |
| Education Instruction & Library | 3 (42.9%) | 4 (57.1%) |
| Arts, Media & Entertainment | 0 (0.0%) | 0 (0.0%) |
| Health Diagnosing & Treating | 0 (0.0%) | 4 (100.0%) |
| Health Technologists | 0 (0.0%) | 4 (100.0%) |
| Total (Category) | 3 (27.3%) | 8 (72.7%) |
| Total (Overall) | 71 (52.6%) | 64 (47.4%) |
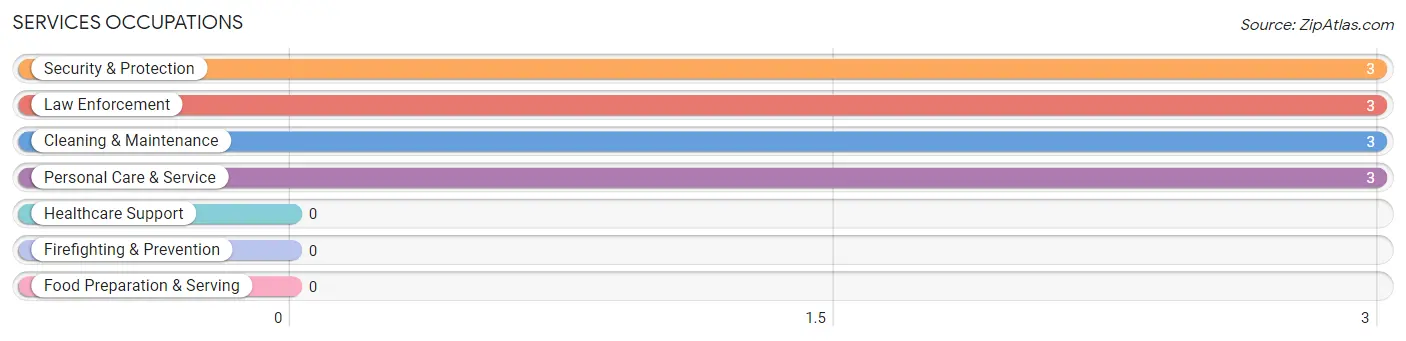
Services Occupations
The most common Services occupations in Savannah are Security & Protection (3 | 2.2%), Law Enforcement (3 | 2.2%), Cleaning & Maintenance (3 | 2.2%), and Personal Care & Service (3 | 2.2%).
Services Occupations by Sex
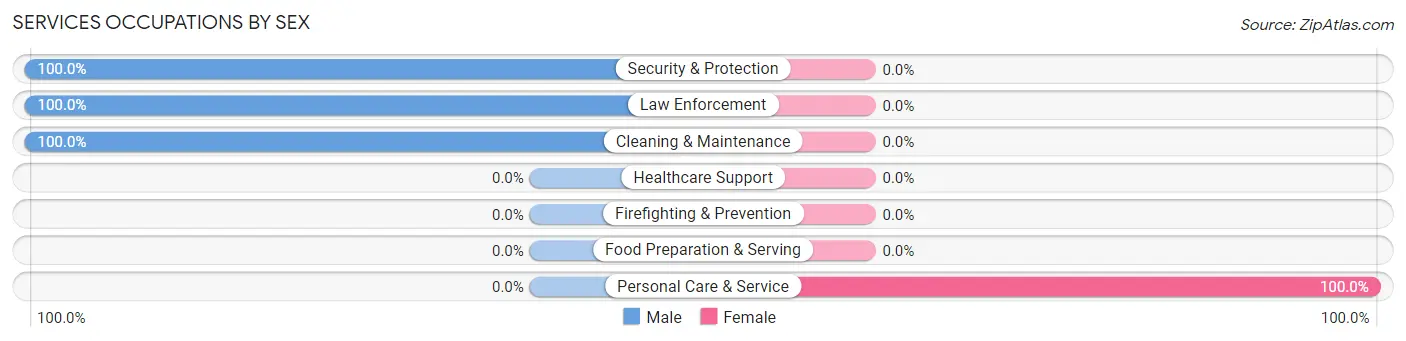
| Occupation | Male | Female |
| Healthcare Support | 0 (0.0%) | 0 (0.0%) |
| Security & Protection | 3 (100.0%) | 0 (0.0%) |
| Firefighting & Prevention | 0 (0.0%) | 0 (0.0%) |
| Law Enforcement | 3 (100.0%) | 0 (0.0%) |
| Food Preparation & Serving | 0 (0.0%) | 0 (0.0%) |
| Cleaning & Maintenance | 3 (100.0%) | 0 (0.0%) |
| Personal Care & Service | 0 (0.0%) | 3 (100.0%) |
| Total (Category) | 6 (66.7%) | 3 (33.3%) |
| Total (Overall) | 71 (52.6%) | 64 (47.4%) |
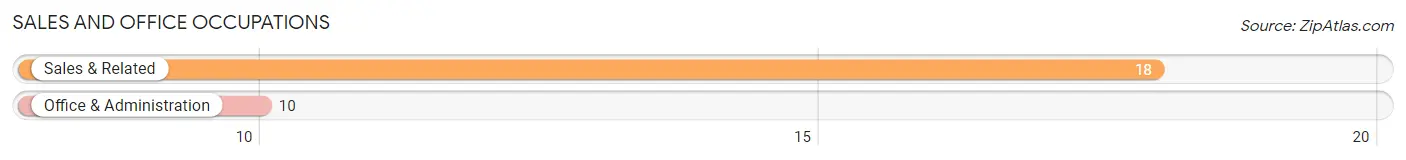
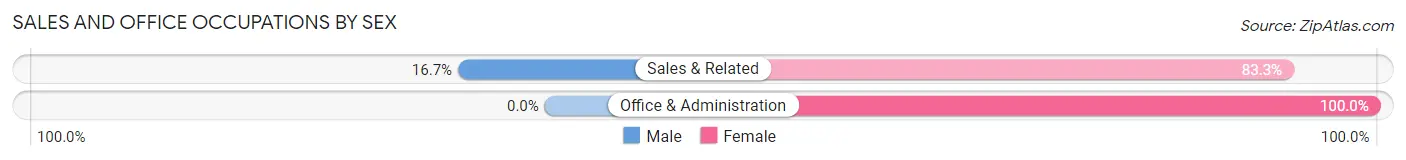
Sales and Office Occupations
The most common Sales and Office occupations in Savannah are Sales & Related (18 | 13.3%), and Office & Administration (10 | 7.4%).
Sales and Office Occupations by Sex
| Occupation | Male | Female |
| Sales & Related | 3 (16.7%) | 15 (83.3%) |
| Office & Administration | 0 (0.0%) | 10 (100.0%) |
| Total (Category) | 3 (10.7%) | 25 (89.3%) |
| Total (Overall) | 71 (52.6%) | 64 (47.4%) |
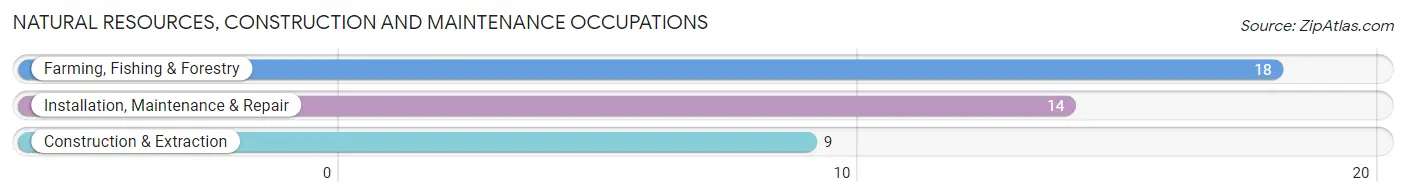
Natural Resources, Construction and Maintenance Occupations
The most common Natural Resources, Construction and Maintenance occupations in Savannah are Farming, Fishing & Forestry (18 | 13.3%), Installation, Maintenance & Repair (14 | 10.4%), and Construction & Extraction (9 | 6.7%).
Natural Resources, Construction and Maintenance Occupations by Sex
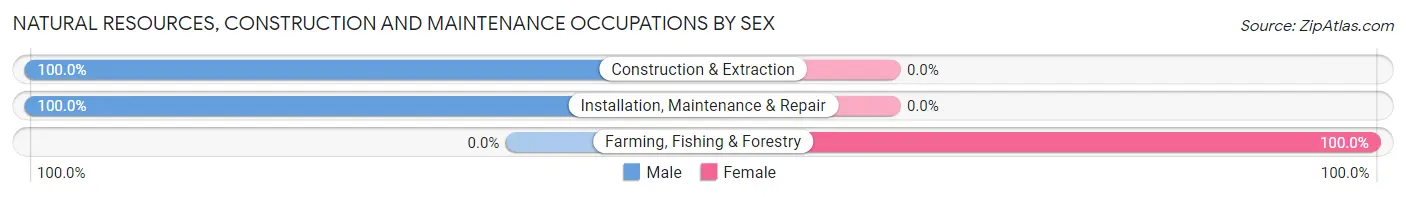
| Occupation | Male | Female |
| Farming, Fishing & Forestry | 0 (0.0%) | 18 (100.0%) |
| Construction & Extraction | 9 (100.0%) | 0 (0.0%) |
| Installation, Maintenance & Repair | 14 (100.0%) | 0 (0.0%) |
| Total (Category) | 23 (56.1%) | 18 (43.9%) |
| Total (Overall) | 71 (52.6%) | 64 (47.4%) |
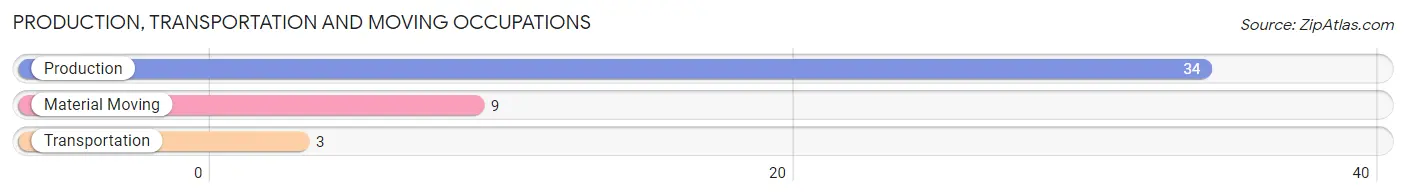
Production, Transportation and Moving Occupations
The most common Production, Transportation and Moving occupations in Savannah are Production (34 | 25.2%), Material Moving (9 | 6.7%), and Transportation (3 | 2.2%).
Production, Transportation and Moving Occupations by Sex
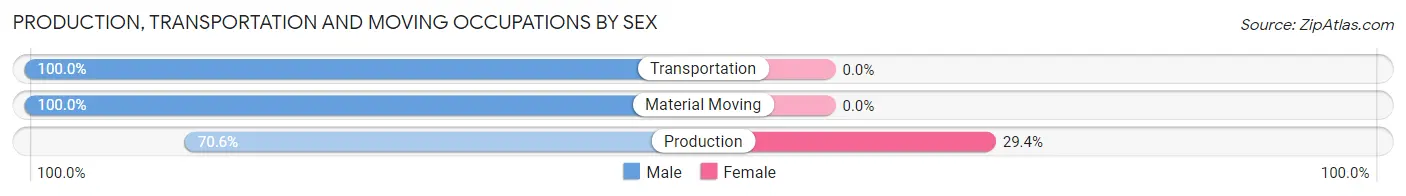
| Occupation | Male | Female |
| Production | 24 (70.6%) | 10 (29.4%) |
| Transportation | 3 (100.0%) | 0 (0.0%) |
| Material Moving | 9 (100.0%) | 0 (0.0%) |
| Total (Category) | 36 (78.3%) | 10 (21.7%) |
| Total (Overall) | 71 (52.6%) | 64 (47.4%) |
Employment Industries by Sex in Savannah
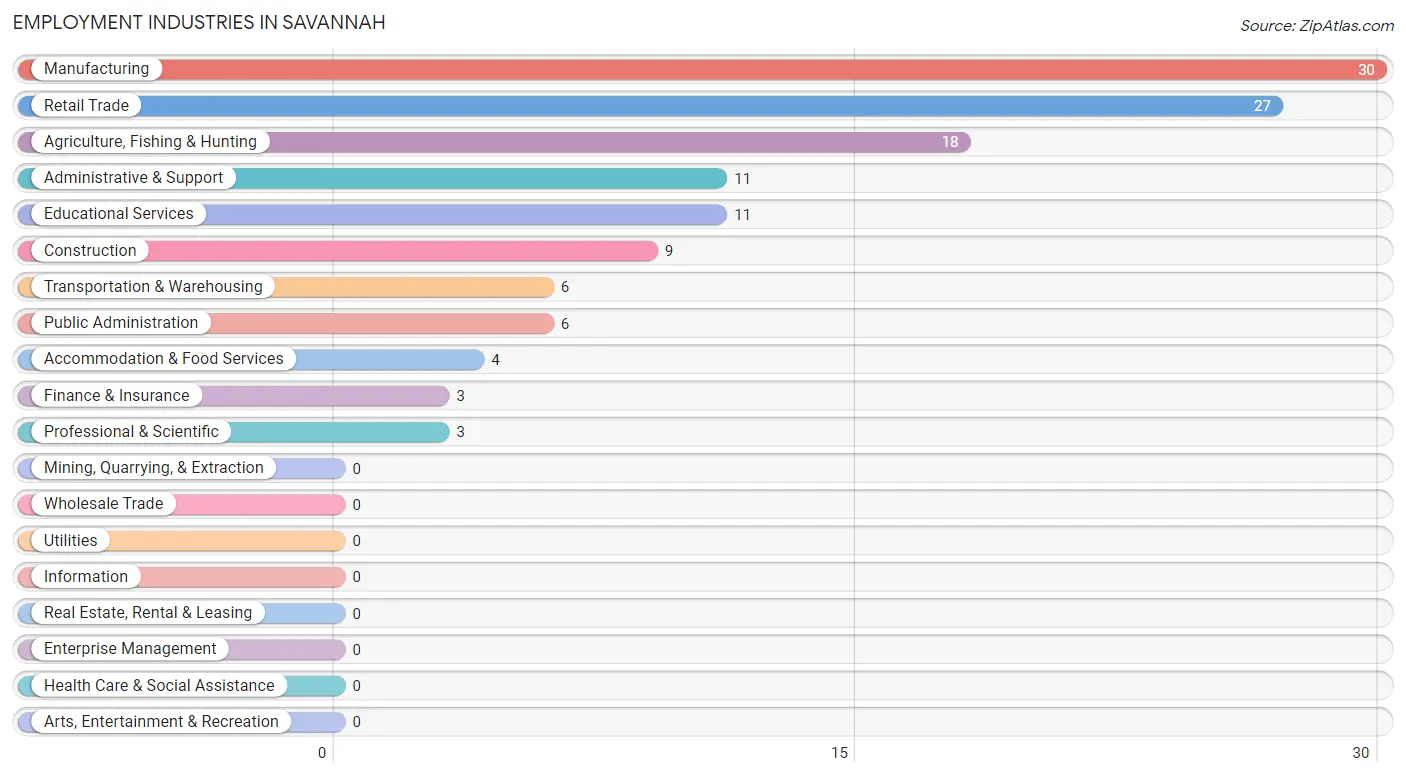
Employment Industries in Savannah
The major employment industries in Savannah include Manufacturing (30 | 22.2%), Retail Trade (27 | 20.0%), Agriculture, Fishing & Hunting (18 | 13.3%), Administrative & Support (11 | 8.2%), and Educational Services (11 | 8.2%).
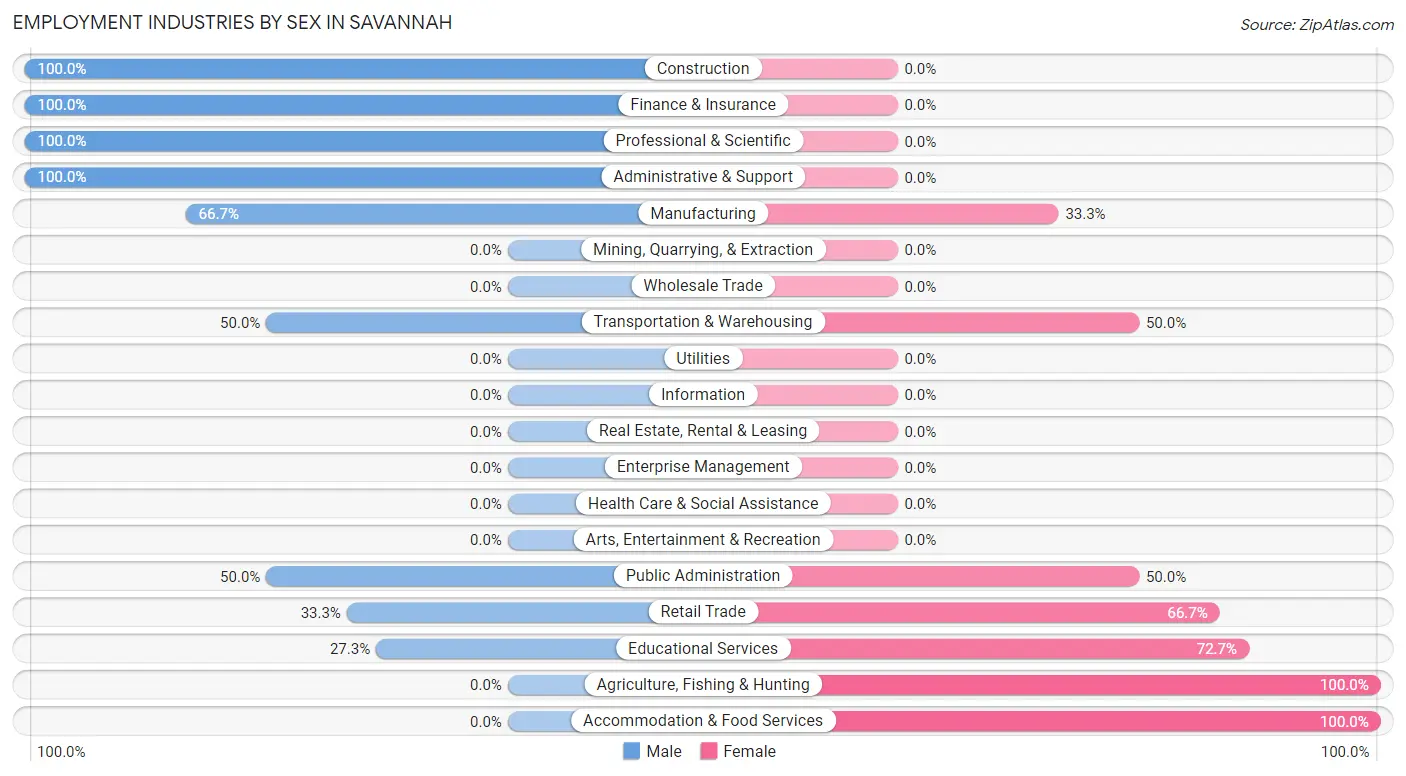
Employment Industries by Sex in Savannah
The Savannah industries that see more men than women are Construction (100.0%), Finance & Insurance (100.0%), and Professional & Scientific (100.0%), whereas the industries that tend to have a higher number of women are Agriculture, Fishing & Hunting (100.0%), Accommodation & Food Services (100.0%), and Educational Services (72.7%).
| Industry | Male | Female |
| Agriculture, Fishing & Hunting | 0 (0.0%) | 18 (100.0%) |
| Mining, Quarrying, & Extraction | 0 (0.0%) | 0 (0.0%) |
| Construction | 9 (100.0%) | 0 (0.0%) |
| Manufacturing | 20 (66.7%) | 10 (33.3%) |
| Wholesale Trade | 0 (0.0%) | 0 (0.0%) |
| Retail Trade | 9 (33.3%) | 18 (66.7%) |
| Transportation & Warehousing | 3 (50.0%) | 3 (50.0%) |
| Utilities | 0 (0.0%) | 0 (0.0%) |
| Information | 0 (0.0%) | 0 (0.0%) |
| Finance & Insurance | 3 (100.0%) | 0 (0.0%) |
| Real Estate, Rental & Leasing | 0 (0.0%) | 0 (0.0%) |
| Professional & Scientific | 3 (100.0%) | 0 (0.0%) |
| Enterprise Management | 0 (0.0%) | 0 (0.0%) |
| Administrative & Support | 11 (100.0%) | 0 (0.0%) |
| Educational Services | 3 (27.3%) | 8 (72.7%) |
| Health Care & Social Assistance | 0 (0.0%) | 0 (0.0%) |
| Arts, Entertainment & Recreation | 0 (0.0%) | 0 (0.0%) |
| Accommodation & Food Services | 0 (0.0%) | 4 (100.0%) |
| Public Administration | 3 (50.0%) | 3 (50.0%) |
| Total | 71 (52.6%) | 64 (47.4%) |
Education in Savannah
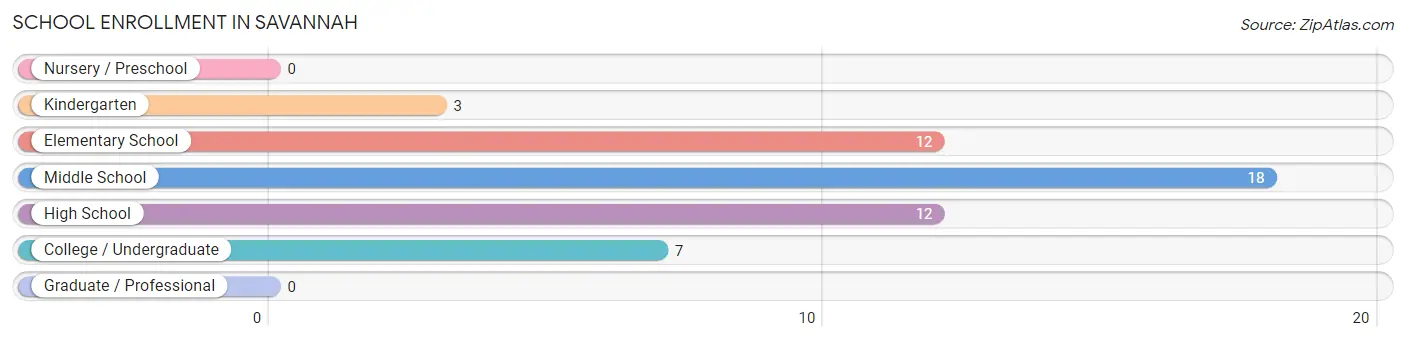
School Enrollment in Savannah
The most common levels of schooling among the 52 students in Savannah are middle school (18 | 34.6%), elementary school (12 | 23.1%), and high school (12 | 23.1%).
| School Level | # Students | % Students |
| Nursery / Preschool | 0 | 0.0% |
| Kindergarten | 3 | 5.8% |
| Elementary School | 12 | 23.1% |
| Middle School | 18 | 34.6% |
| High School | 12 | 23.1% |
| College / Undergraduate | 7 | 13.5% |
| Graduate / Professional | 0 | 0.0% |
| Total | 52 | 100.0% |
School Enrollment by Age by Funding Source in Savannah
Out of a total of 52 students who are enrolled in schools in Savannah, 10 (19.2%) attend a private institution, while the remaining 42 (80.8%) are enrolled in public schools. The age group of 35 years and over has the highest likelihood of being enrolled in private schools, with 4 (100.0% in the age bracket) enrolled. Conversely, the age group of 15 to 17 year olds has the lowest likelihood of being enrolled in a private school, with 12 (100.0% in the age bracket) attending a public institution.
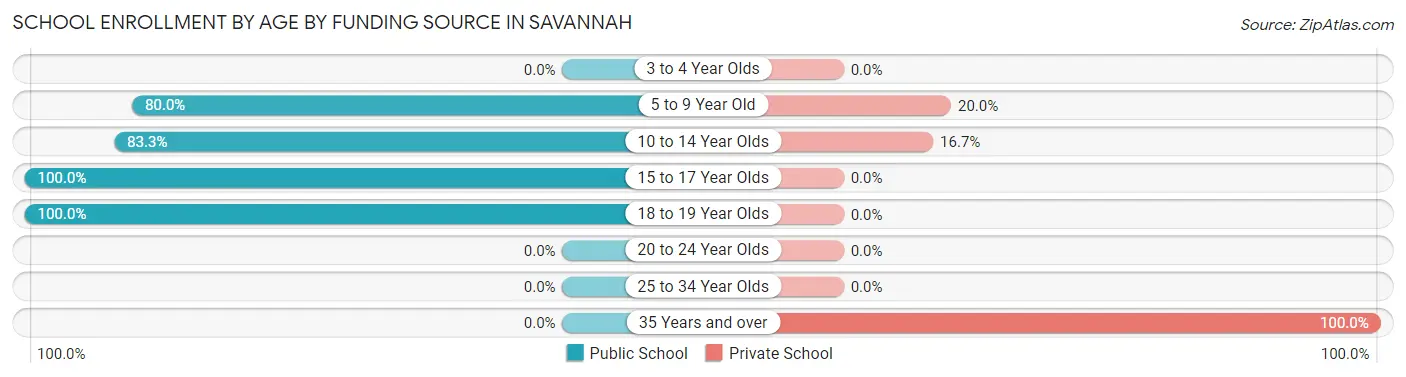
| Age Bracket | Public School | Private School |
| 3 to 4 Year Olds | 0 (0.0%) | 0 (0.0%) |
| 5 to 9 Year Old | 12 (80.0%) | 3 (20.0%) |
| 10 to 14 Year Olds | 15 (83.3%) | 3 (16.7%) |
| 15 to 17 Year Olds | 12 (100.0%) | 0 (0.0%) |
| 18 to 19 Year Olds | 3 (100.0%) | 0 (0.0%) |
| 20 to 24 Year Olds | 0 (0.0%) | 0 (0.0%) |
| 25 to 34 Year Olds | 0 (0.0%) | 0 (0.0%) |
| 35 Years and over | 0 (0.0%) | 4 (100.0%) |
| Total | 42 (80.8%) | 10 (19.2%) |
Educational Attainment by Field of Study in Savannah
Science & technology (7 | 24.1%), arts & humanities (7 | 24.1%), engineering (3 | 10.3%), business (3 | 10.3%), and education (3 | 10.3%) are the most common fields of study among 29 individuals in Savannah who have obtained a bachelor's degree or higher.
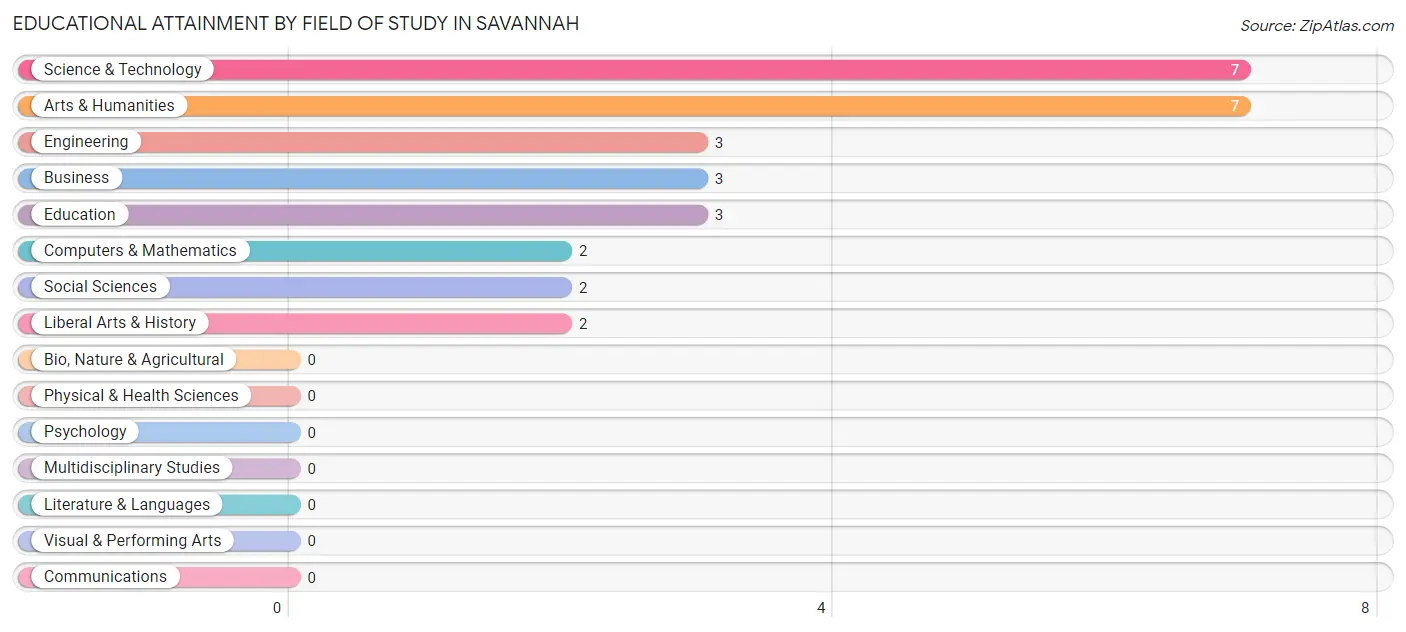
| Field of Study | # Graduates | % Graduates |
| Computers & Mathematics | 2 | 6.9% |
| Bio, Nature & Agricultural | 0 | 0.0% |
| Physical & Health Sciences | 0 | 0.0% |
| Psychology | 0 | 0.0% |
| Social Sciences | 2 | 6.9% |
| Engineering | 3 | 10.3% |
| Multidisciplinary Studies | 0 | 0.0% |
| Science & Technology | 7 | 24.1% |
| Business | 3 | 10.3% |
| Education | 3 | 10.3% |
| Literature & Languages | 0 | 0.0% |
| Liberal Arts & History | 2 | 6.9% |
| Visual & Performing Arts | 0 | 0.0% |
| Communications | 0 | 0.0% |
| Arts & Humanities | 7 | 24.1% |
| Total | 29 | 100.0% |
Transportation & Commute in Savannah
Vehicle Availability by Sex in Savannah
The most prevalent vehicle ownership categories in Savannah are males with 3 vehicles (26, accounting for 36.6%) and females with 3 vehicles (8, making up 40.6%).
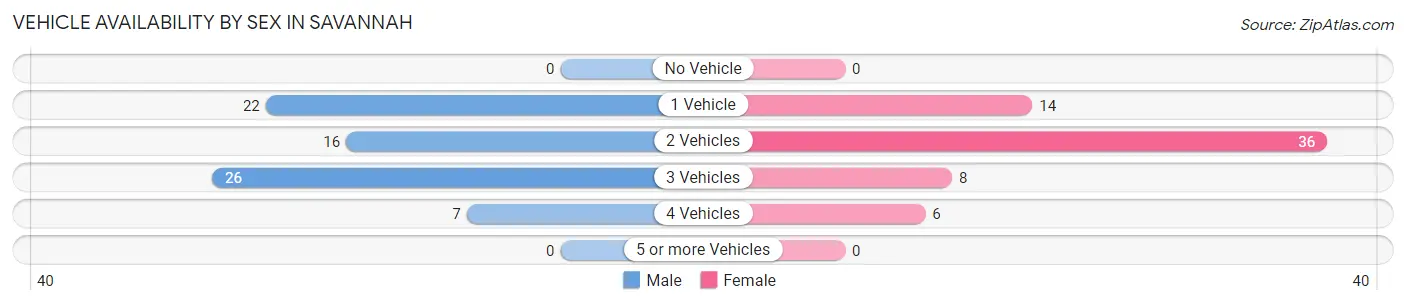
| Vehicles Available | Male | Female |
| No Vehicle | 0 (0.0%) | 0 (0.0%) |
| 1 Vehicle | 22 (31.0%) | 14 (21.9%) |
| 2 Vehicles | 16 (22.5%) | 36 (56.2%) |
| 3 Vehicles | 26 (36.6%) | 8 (12.5%) |
| 4 Vehicles | 7 (9.9%) | 6 (9.4%) |
| 5 or more Vehicles | 0 (0.0%) | 0 (0.0%) |
| Total | 71 (100.0%) | 64 (100.0%) |
Commute Time in Savannah
The most frequently occuring commute durations in Savannah are 20 to 24 minutes (45 commuters, 33.3%), 15 to 19 minutes (24 commuters, 17.8%), and 30 to 34 minutes (16 commuters, 11.8%).
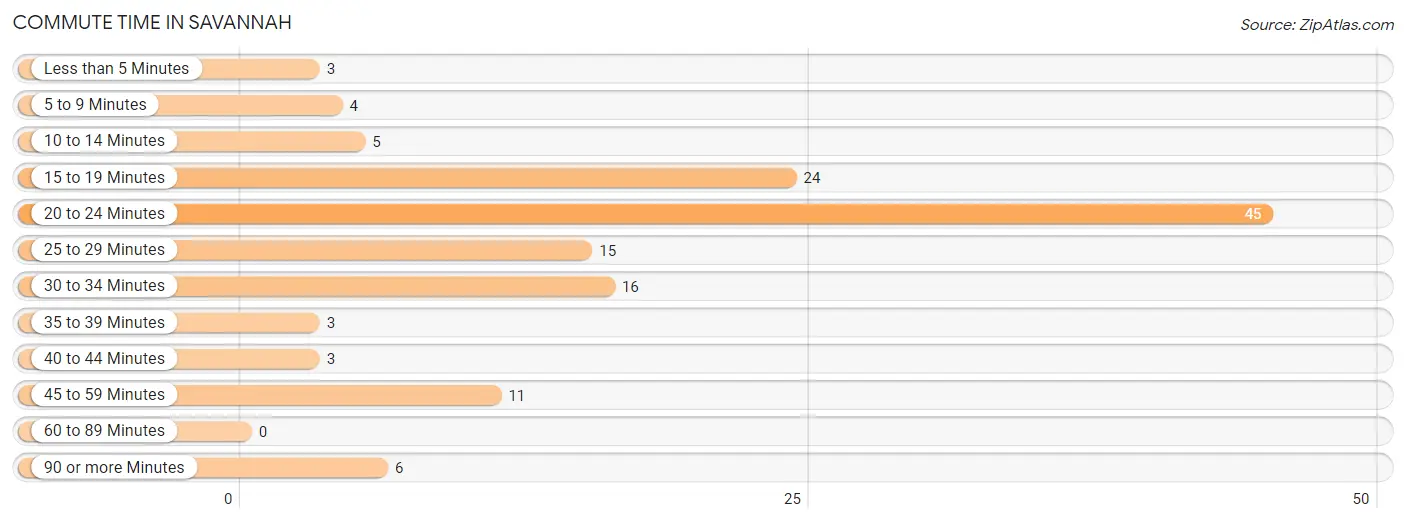
| Commute Time | # Commuters | % Commuters |
| Less than 5 Minutes | 3 | 2.2% |
| 5 to 9 Minutes | 4 | 3.0% |
| 10 to 14 Minutes | 5 | 3.7% |
| 15 to 19 Minutes | 24 | 17.8% |
| 20 to 24 Minutes | 45 | 33.3% |
| 25 to 29 Minutes | 15 | 11.1% |
| 30 to 34 Minutes | 16 | 11.8% |
| 35 to 39 Minutes | 3 | 2.2% |
| 40 to 44 Minutes | 3 | 2.2% |
| 45 to 59 Minutes | 11 | 8.2% |
| 60 to 89 Minutes | 0 | 0.0% |
| 90 or more Minutes | 6 | 4.4% |
Commute Time by Sex in Savannah
The most common commute times in Savannah are 20 to 24 minutes (16 commuters, 22.5%) for males and 20 to 24 minutes (29 commuters, 45.3%) for females.
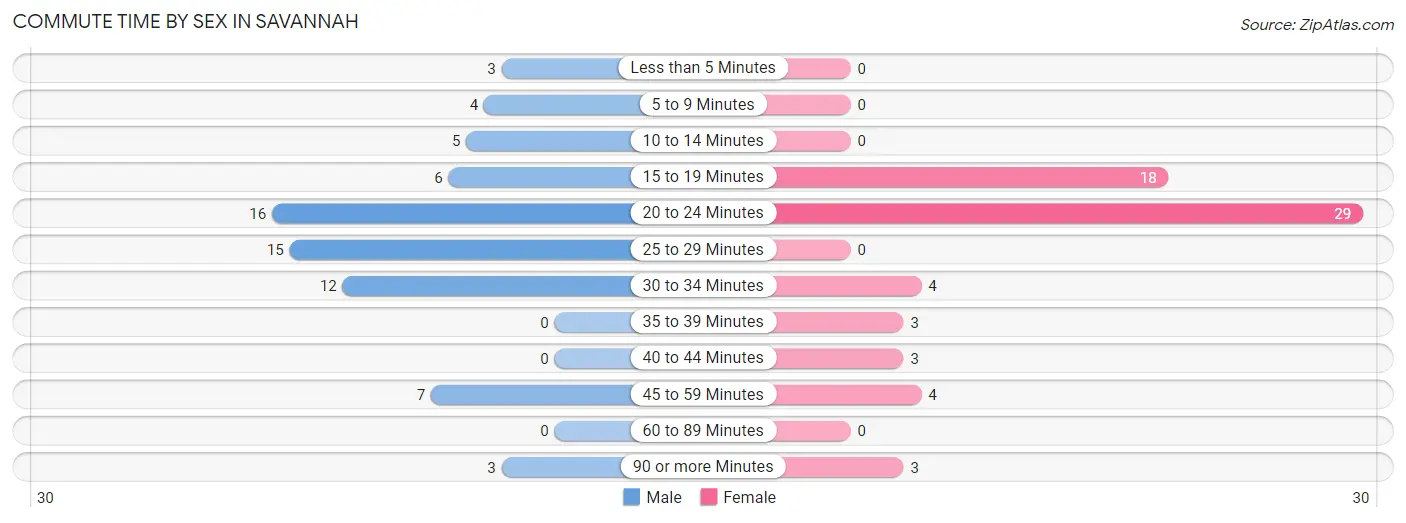
| Commute Time | Male | Female |
| Less than 5 Minutes | 3 (4.2%) | 0 (0.0%) |
| 5 to 9 Minutes | 4 (5.6%) | 0 (0.0%) |
| 10 to 14 Minutes | 5 (7.0%) | 0 (0.0%) |
| 15 to 19 Minutes | 6 (8.5%) | 18 (28.1%) |
| 20 to 24 Minutes | 16 (22.5%) | 29 (45.3%) |
| 25 to 29 Minutes | 15 (21.1%) | 0 (0.0%) |
| 30 to 34 Minutes | 12 (16.9%) | 4 (6.2%) |
| 35 to 39 Minutes | 0 (0.0%) | 3 (4.7%) |
| 40 to 44 Minutes | 0 (0.0%) | 3 (4.7%) |
| 45 to 59 Minutes | 7 (9.9%) | 4 (6.2%) |
| 60 to 89 Minutes | 0 (0.0%) | 0 (0.0%) |
| 90 or more Minutes | 3 (4.2%) | 3 (4.7%) |
Time of Departure to Work by Sex in Savannah
The most frequent times of departure to work in Savannah are 6:30 AM to 6:59 AM (25, 35.2%) for males and 7:00 AM to 7:29 AM (18, 28.1%) for females.
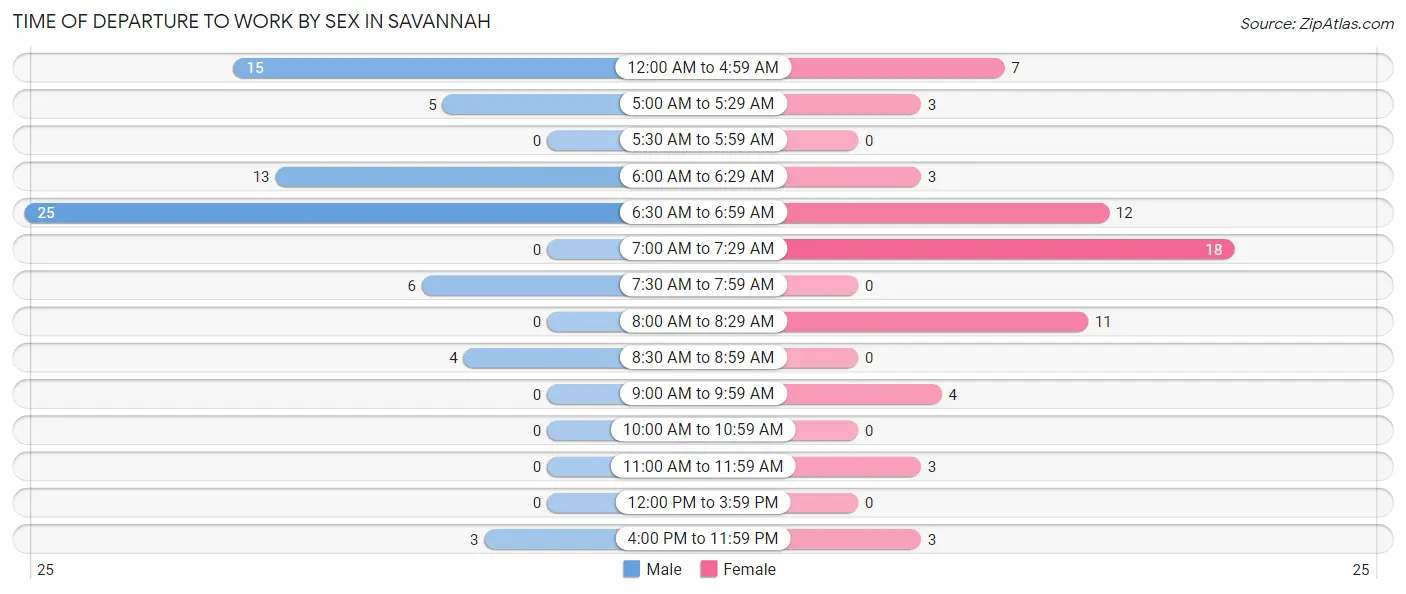
| Time of Departure | Male | Female |
| 12:00 AM to 4:59 AM | 15 (21.1%) | 7 (10.9%) |
| 5:00 AM to 5:29 AM | 5 (7.0%) | 3 (4.7%) |
| 5:30 AM to 5:59 AM | 0 (0.0%) | 0 (0.0%) |
| 6:00 AM to 6:29 AM | 13 (18.3%) | 3 (4.7%) |
| 6:30 AM to 6:59 AM | 25 (35.2%) | 12 (18.8%) |
| 7:00 AM to 7:29 AM | 0 (0.0%) | 18 (28.1%) |
| 7:30 AM to 7:59 AM | 6 (8.5%) | 0 (0.0%) |
| 8:00 AM to 8:29 AM | 0 (0.0%) | 11 (17.2%) |
| 8:30 AM to 8:59 AM | 4 (5.6%) | 0 (0.0%) |
| 9:00 AM to 9:59 AM | 0 (0.0%) | 4 (6.2%) |
| 10:00 AM to 10:59 AM | 0 (0.0%) | 0 (0.0%) |
| 11:00 AM to 11:59 AM | 0 (0.0%) | 3 (4.7%) |
| 12:00 PM to 3:59 PM | 0 (0.0%) | 0 (0.0%) |
| 4:00 PM to 11:59 PM | 3 (4.2%) | 3 (4.7%) |
| Total | 71 (100.0%) | 64 (100.0%) |
Housing Occupancy in Savannah
Occupancy by Ownership in Savannah
Of the total 176 dwellings in Savannah, owner-occupied units account for 118 (67.0%), while renter-occupied units make up 58 (33.0%).
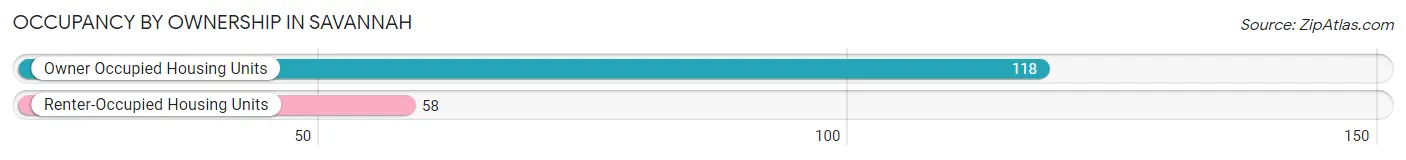
| Occupancy | # Housing Units | % Housing Units |
| Owner Occupied Housing Units | 118 | 67.0% |
| Renter-Occupied Housing Units | 58 | 33.0% |
| Total Occupied Housing Units | 176 | 100.0% |
Occupancy by Household Size in Savannah
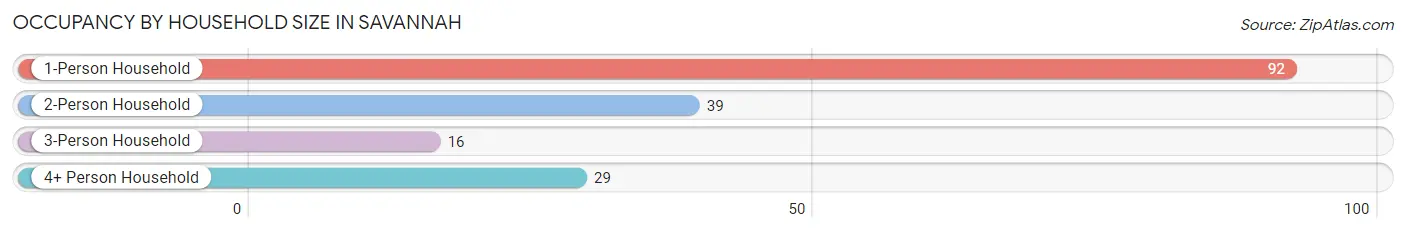
| Household Size | # Housing Units | % Housing Units |
| 1-Person Household | 92 | 52.3% |
| 2-Person Household | 39 | 22.2% |
| 3-Person Household | 16 | 9.1% |
| 4+ Person Household | 29 | 16.5% |
| Total Housing Units | 176 | 100.0% |
Occupancy by Ownership by Household Size in Savannah
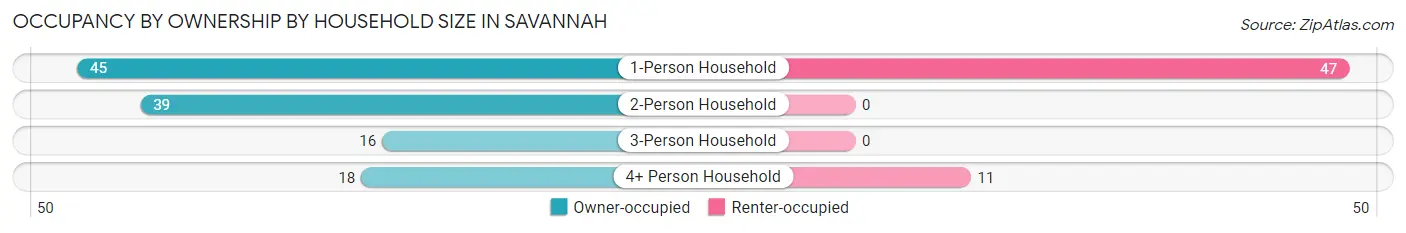
| Household Size | Owner-occupied | Renter-occupied |
| 1-Person Household | 45 (48.9%) | 47 (51.1%) |
| 2-Person Household | 39 (100.0%) | 0 (0.0%) |
| 3-Person Household | 16 (100.0%) | 0 (0.0%) |
| 4+ Person Household | 18 (62.1%) | 11 (37.9%) |
| Total Housing Units | 118 (67.0%) | 58 (33.0%) |
Occupancy by Educational Attainment in Savannah
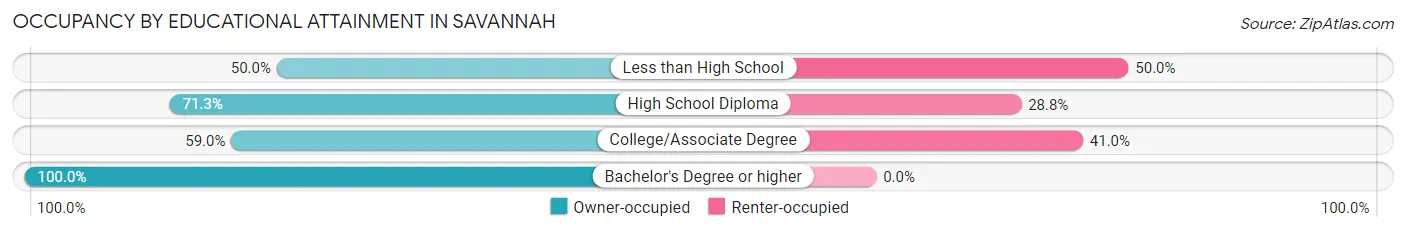
| Household Size | Owner-occupied | Renter-occupied |
| Less than High School | 10 (50.0%) | 10 (50.0%) |
| High School Diploma | 57 (71.3%) | 23 (28.7%) |
| College/Associate Degree | 36 (59.0%) | 25 (41.0%) |
| Bachelor's Degree or higher | 15 (100.0%) | 0 (0.0%) |
Occupancy by Age of Householder in Savannah
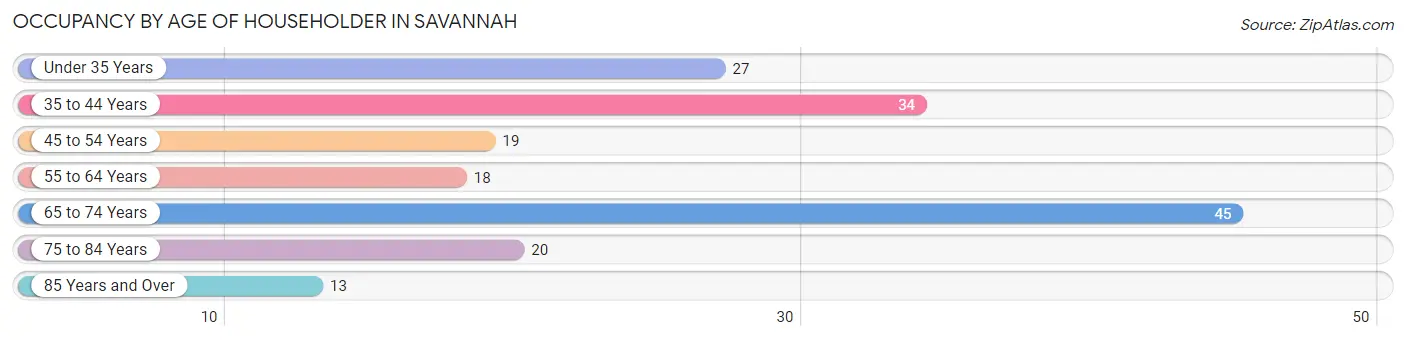
| Age Bracket | # Households | % Households |
| Under 35 Years | 27 | 15.3% |
| 35 to 44 Years | 34 | 19.3% |
| 45 to 54 Years | 19 | 10.8% |
| 55 to 64 Years | 18 | 10.2% |
| 65 to 74 Years | 45 | 25.6% |
| 75 to 84 Years | 20 | 11.4% |
| 85 Years and Over | 13 | 7.4% |
| Total | 176 | 100.0% |
Housing Finances in Savannah
Median Income by Occupancy in Savannah
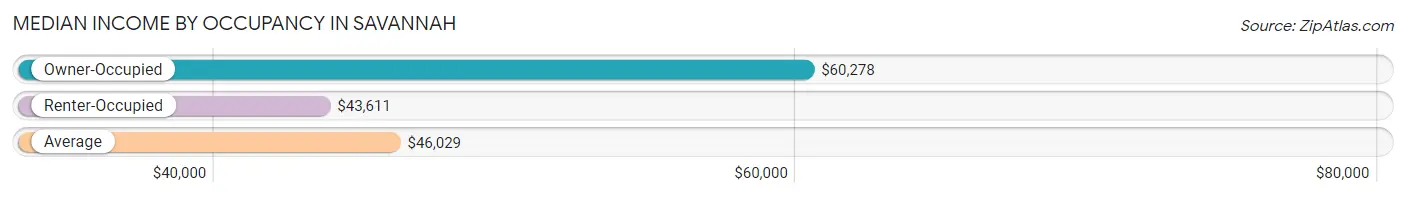
| Occupancy Type | # Households | Median Income |
| Owner-Occupied | 118 (67.0%) | $60,278 |
| Renter-Occupied | 58 (33.0%) | $43,611 |
| Average | 176 (100.0%) | $46,029 |
Occupancy by Householder Income Bracket in Savannah
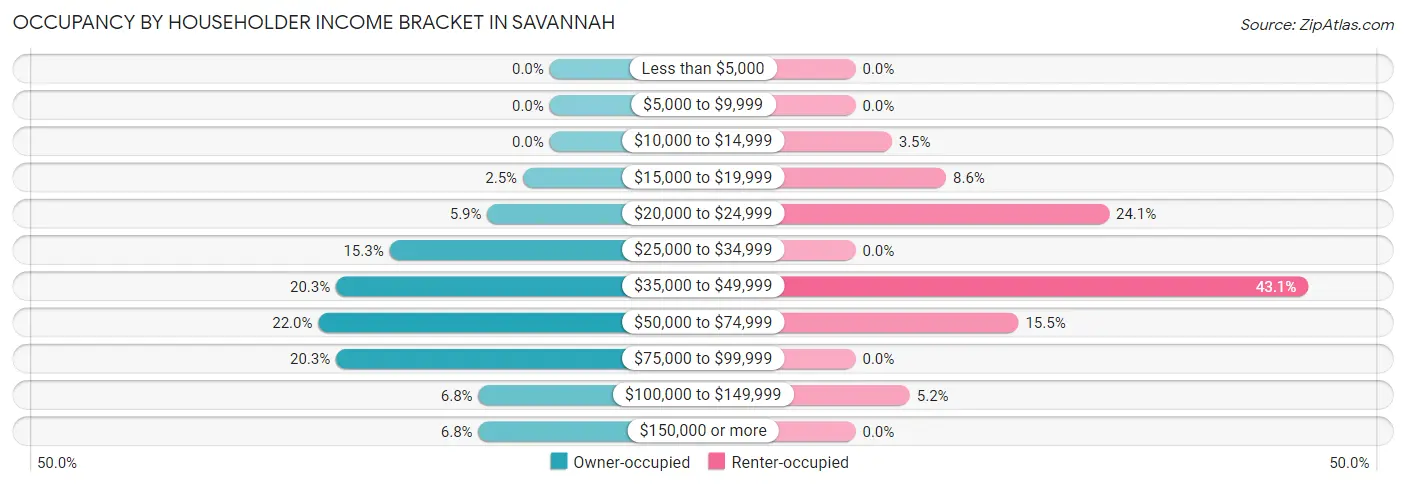
| Income Bracket | Owner-occupied | Renter-occupied |
| Less than $5,000 | 0 (0.0%) | 0 (0.0%) |
| $5,000 to $9,999 | 0 (0.0%) | 0 (0.0%) |
| $10,000 to $14,999 | 0 (0.0%) | 2 (3.5%) |
| $15,000 to $19,999 | 3 (2.5%) | 5 (8.6%) |
| $20,000 to $24,999 | 7 (5.9%) | 14 (24.1%) |
| $25,000 to $34,999 | 18 (15.2%) | 0 (0.0%) |
| $35,000 to $49,999 | 24 (20.3%) | 25 (43.1%) |
| $50,000 to $74,999 | 26 (22.0%) | 9 (15.5%) |
| $75,000 to $99,999 | 24 (20.3%) | 0 (0.0%) |
| $100,000 to $149,999 | 8 (6.8%) | 3 (5.2%) |
| $150,000 or more | 8 (6.8%) | 0 (0.0%) |
| Total | 118 (100.0%) | 58 (100.0%) |
Monthly Housing Cost Tiers in Savannah
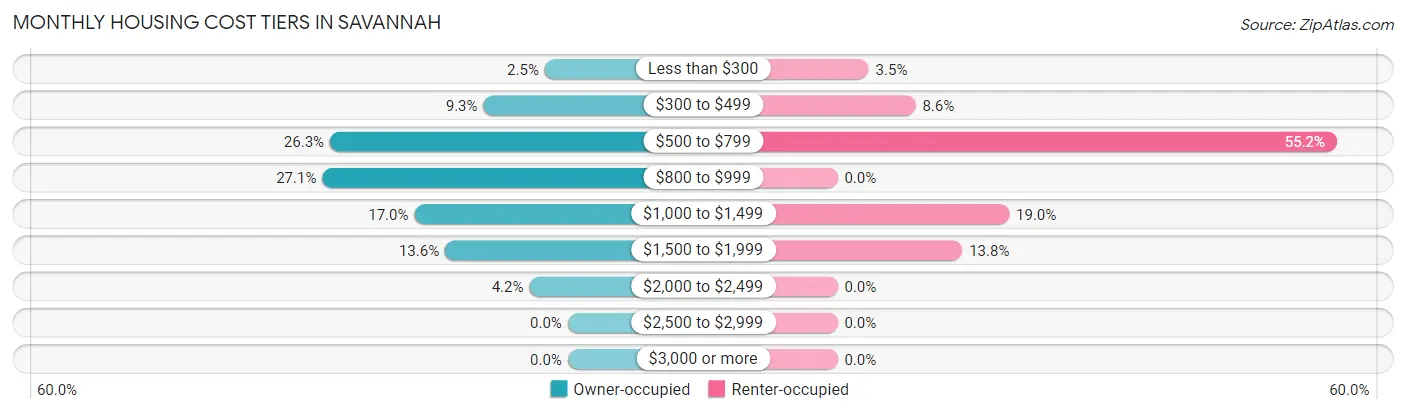
| Monthly Cost | Owner-occupied | Renter-occupied |
| Less than $300 | 3 (2.5%) | 2 (3.5%) |
| $300 to $499 | 11 (9.3%) | 5 (8.6%) |
| $500 to $799 | 31 (26.3%) | 32 (55.2%) |
| $800 to $999 | 32 (27.1%) | 0 (0.0%) |
| $1,000 to $1,499 | 20 (17.0%) | 11 (19.0%) |
| $1,500 to $1,999 | 16 (13.6%) | 8 (13.8%) |
| $2,000 to $2,499 | 5 (4.2%) | 0 (0.0%) |
| $2,500 to $2,999 | 0 (0.0%) | 0 (0.0%) |
| $3,000 or more | 0 (0.0%) | 0 (0.0%) |
| Total | 118 (100.0%) | 58 (100.0%) |
Physical Housing Characteristics in Savannah
Housing Structures in Savannah
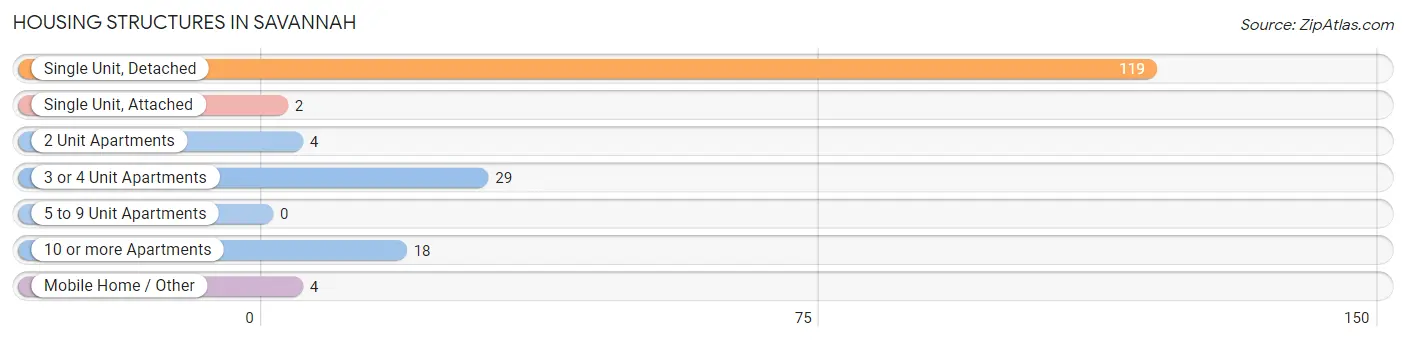
| Structure Type | # Housing Units | % Housing Units |
| Single Unit, Detached | 119 | 67.6% |
| Single Unit, Attached | 2 | 1.1% |
| 2 Unit Apartments | 4 | 2.3% |
| 3 or 4 Unit Apartments | 29 | 16.5% |
| 5 to 9 Unit Apartments | 0 | 0.0% |
| 10 or more Apartments | 18 | 10.2% |
| Mobile Home / Other | 4 | 2.3% |
| Total | 176 | 100.0% |
Housing Structures by Occupancy in Savannah
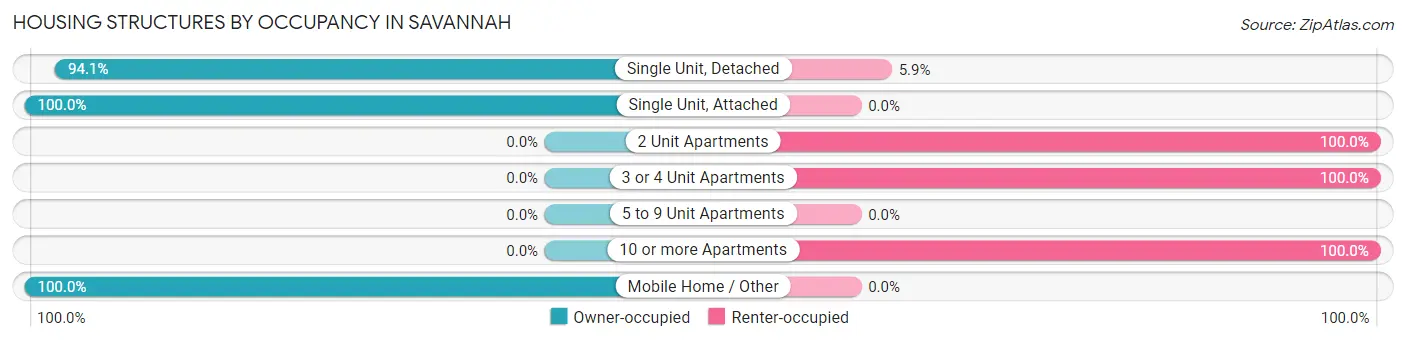
| Structure Type | Owner-occupied | Renter-occupied |
| Single Unit, Detached | 112 (94.1%) | 7 (5.9%) |
| Single Unit, Attached | 2 (100.0%) | 0 (0.0%) |
| 2 Unit Apartments | 0 (0.0%) | 4 (100.0%) |
| 3 or 4 Unit Apartments | 0 (0.0%) | 29 (100.0%) |
| 5 to 9 Unit Apartments | 0 (0.0%) | 0 (0.0%) |
| 10 or more Apartments | 0 (0.0%) | 18 (100.0%) |
| Mobile Home / Other | 4 (100.0%) | 0 (0.0%) |
| Total | 118 (67.0%) | 58 (33.0%) |
Housing Structures by Number of Rooms in Savannah
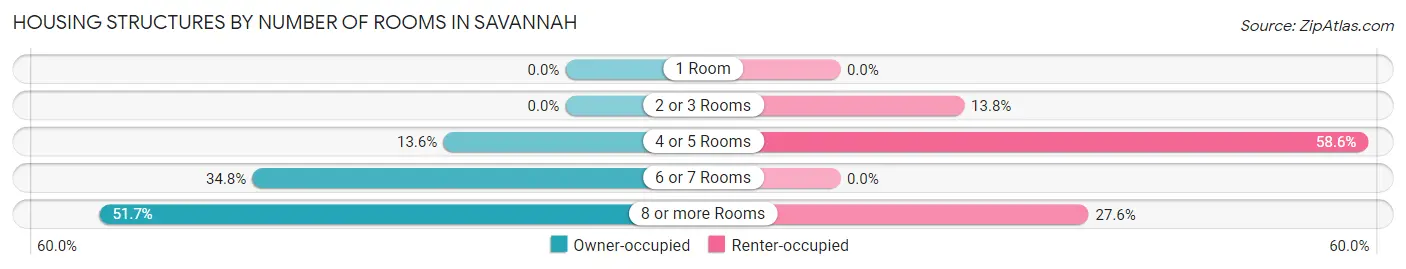
| Number of Rooms | Owner-occupied | Renter-occupied |
| 1 Room | 0 (0.0%) | 0 (0.0%) |
| 2 or 3 Rooms | 0 (0.0%) | 8 (13.8%) |
| 4 or 5 Rooms | 16 (13.6%) | 34 (58.6%) |
| 6 or 7 Rooms | 41 (34.7%) | 0 (0.0%) |
| 8 or more Rooms | 61 (51.7%) | 16 (27.6%) |
| Total | 118 (100.0%) | 58 (100.0%) |
Housing Structure by Heating Type in Savannah
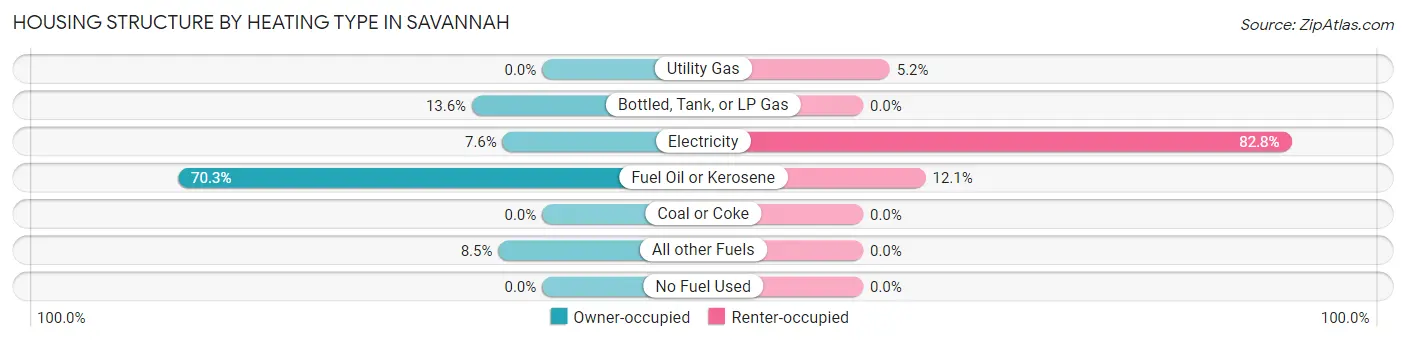
| Heating Type | Owner-occupied | Renter-occupied |
| Utility Gas | 0 (0.0%) | 3 (5.2%) |
| Bottled, Tank, or LP Gas | 16 (13.6%) | 0 (0.0%) |
| Electricity | 9 (7.6%) | 48 (82.8%) |
| Fuel Oil or Kerosene | 83 (70.3%) | 7 (12.1%) |
| Coal or Coke | 0 (0.0%) | 0 (0.0%) |
| All other Fuels | 10 (8.5%) | 0 (0.0%) |
| No Fuel Used | 0 (0.0%) | 0 (0.0%) |
| Total | 118 (100.0%) | 58 (100.0%) |
Household Vehicle Usage in Savannah
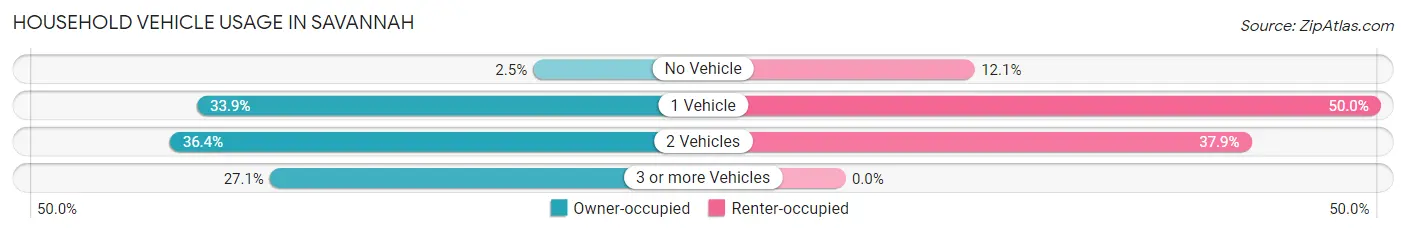
| Vehicles per Household | Owner-occupied | Renter-occupied |
| No Vehicle | 3 (2.5%) | 7 (12.1%) |
| 1 Vehicle | 40 (33.9%) | 29 (50.0%) |
| 2 Vehicles | 43 (36.4%) | 22 (37.9%) |
| 3 or more Vehicles | 32 (27.1%) | 0 (0.0%) |
| Total | 118 (100.0%) | 58 (100.0%) |
Real Estate & Mortgages in Savannah
Real Estate and Mortgage Overview in Savannah
| Characteristic | Without Mortgage | With Mortgage |
| Housing Units | 50 | 68 |
| Median Property Value | $72,200 | $104,200 |
| Median Household Income | $45,250 | $6 |
| Monthly Housing Costs | $567 | $0 |
| Real Estate Taxes | $1,625 | $0 |
Property Value by Mortgage Status in Savannah
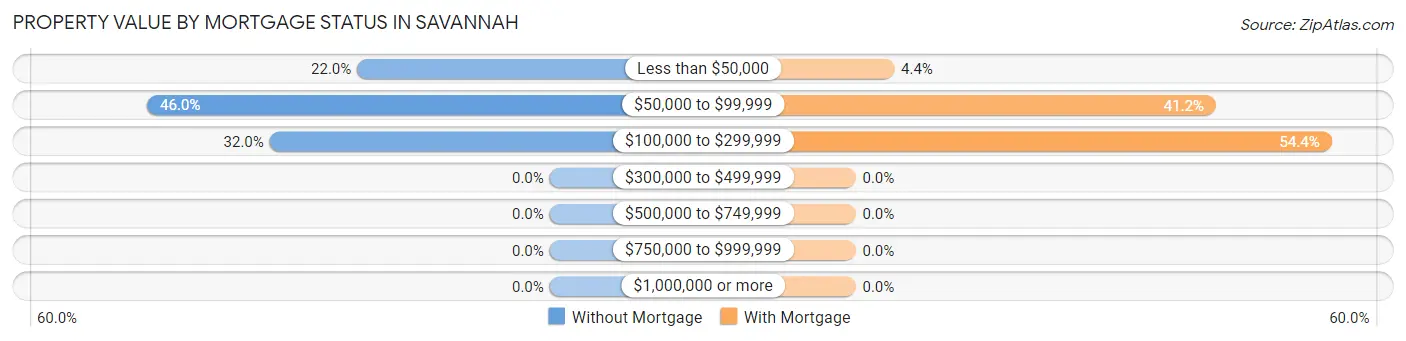
| Property Value | Without Mortgage | With Mortgage |
| Less than $50,000 | 11 (22.0%) | 3 (4.4%) |
| $50,000 to $99,999 | 23 (46.0%) | 28 (41.2%) |
| $100,000 to $299,999 | 16 (32.0%) | 37 (54.4%) |
| $300,000 to $499,999 | 0 (0.0%) | 0 (0.0%) |
| $500,000 to $749,999 | 0 (0.0%) | 0 (0.0%) |
| $750,000 to $999,999 | 0 (0.0%) | 0 (0.0%) |
| $1,000,000 or more | 0 (0.0%) | 0 (0.0%) |
| Total | 50 (100.0%) | 68 (100.0%) |
Household Income by Mortgage Status in Savannah
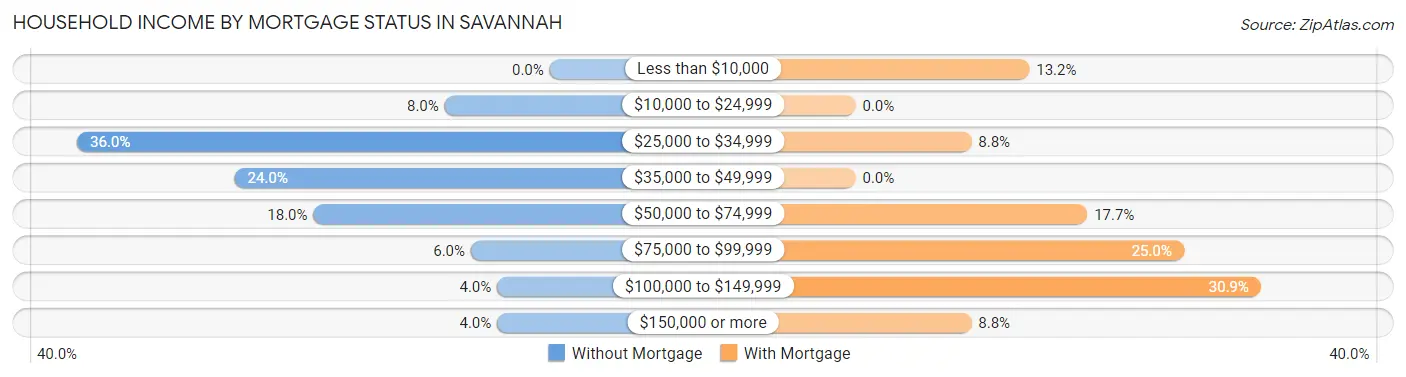
| Household Income | Without Mortgage | With Mortgage |
| Less than $10,000 | 0 (0.0%) | 9 (13.2%) |
| $10,000 to $24,999 | 4 (8.0%) | 0 (0.0%) |
| $25,000 to $34,999 | 18 (36.0%) | 6 (8.8%) |
| $35,000 to $49,999 | 12 (24.0%) | 0 (0.0%) |
| $50,000 to $74,999 | 9 (18.0%) | 12 (17.6%) |
| $75,000 to $99,999 | 3 (6.0%) | 17 (25.0%) |
| $100,000 to $149,999 | 2 (4.0%) | 21 (30.9%) |
| $150,000 or more | 2 (4.0%) | 6 (8.8%) |
| Total | 50 (100.0%) | 68 (100.0%) |
Property Value to Household Income Ratio in Savannah
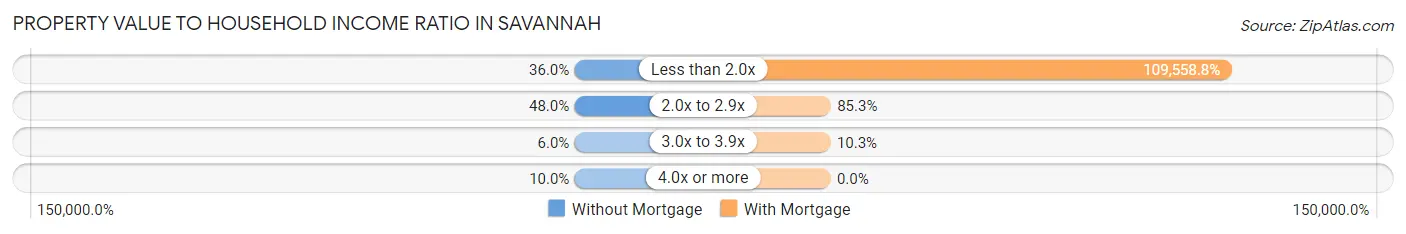
| Value-to-Income Ratio | Without Mortgage | With Mortgage |
| Less than 2.0x | 18 (36.0%) | 74,500 (109,558.8%) |
| 2.0x to 2.9x | 24 (48.0%) | 58 (85.3%) |
| 3.0x to 3.9x | 3 (6.0%) | 7 (10.3%) |
| 4.0x or more | 5 (10.0%) | 0 (0.0%) |
| Total | 50 (100.0%) | 68 (100.0%) |
Real Estate Taxes by Mortgage Status in Savannah
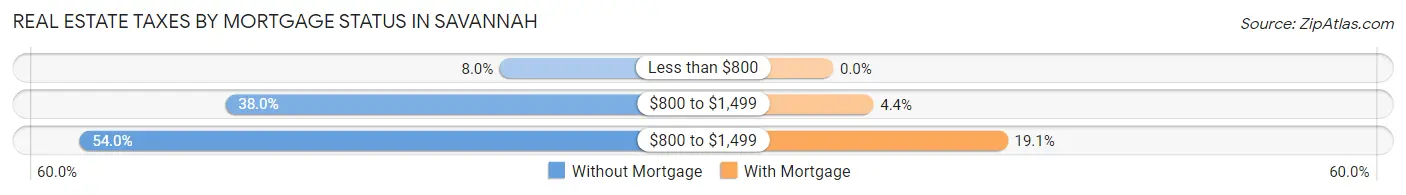
| Property Taxes | Without Mortgage | With Mortgage |
| Less than $800 | 4 (8.0%) | 0 (0.0%) |
| $800 to $1,499 | 19 (38.0%) | 3 (4.4%) |
| $800 to $1,499 | 27 (54.0%) | 13 (19.1%) |
| Total | 50 (100.0%) | 68 (100.0%) |
Health & Disability in Savannah
Health Insurance Coverage by Age in Savannah
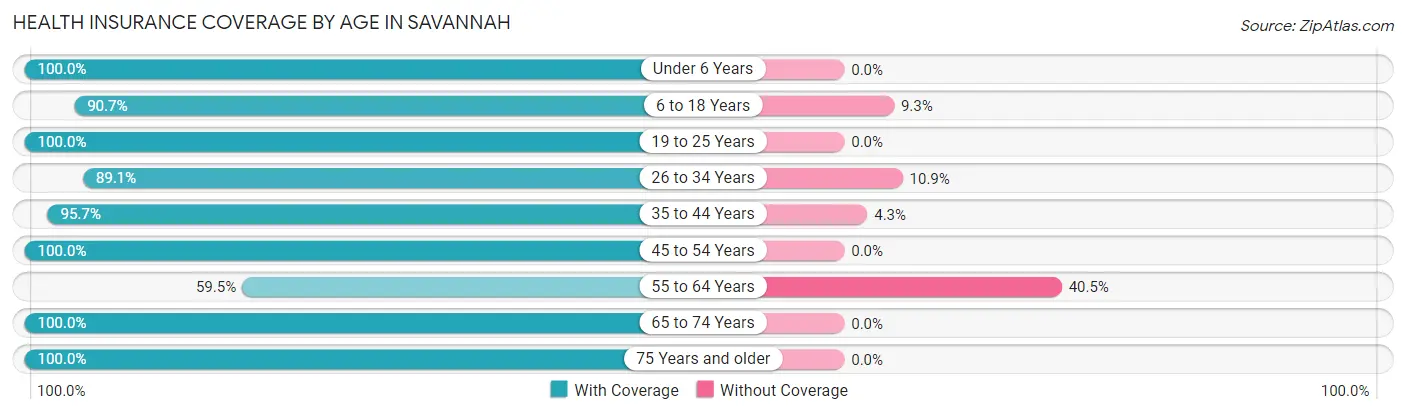
| Age Bracket | With Coverage | Without Coverage |
| Under 6 Years | 33 (100.0%) | 0 (0.0%) |
| 6 to 18 Years | 49 (90.7%) | 5 (9.3%) |
| 19 to 25 Years | 11 (100.0%) | 0 (0.0%) |
| 26 to 34 Years | 41 (89.1%) | 5 (10.9%) |
| 35 to 44 Years | 67 (95.7%) | 3 (4.3%) |
| 45 to 54 Years | 31 (100.0%) | 0 (0.0%) |
| 55 to 64 Years | 22 (59.5%) | 15 (40.5%) |
| 65 to 74 Years | 71 (100.0%) | 0 (0.0%) |
| 75 Years and older | 48 (100.0%) | 0 (0.0%) |
| Total | 373 (93.0%) | 28 (7.0%) |
Health Insurance Coverage by Citizenship Status in Savannah
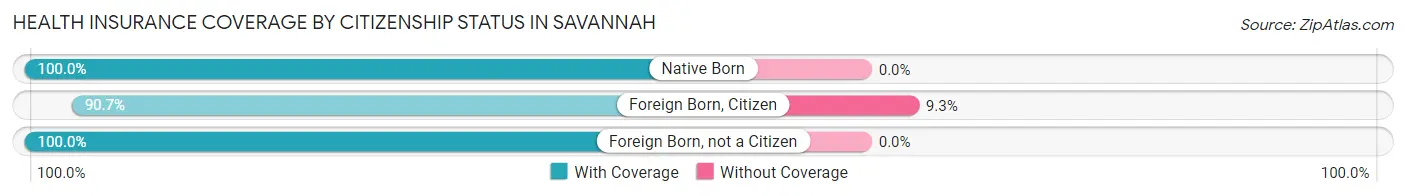
| Citizenship Status | With Coverage | Without Coverage |
| Native Born | 33 (100.0%) | 0 (0.0%) |
| Foreign Born, Citizen | 49 (90.7%) | 5 (9.3%) |
| Foreign Born, not a Citizen | 11 (100.0%) | 0 (0.0%) |
Health Insurance Coverage by Household Income in Savannah
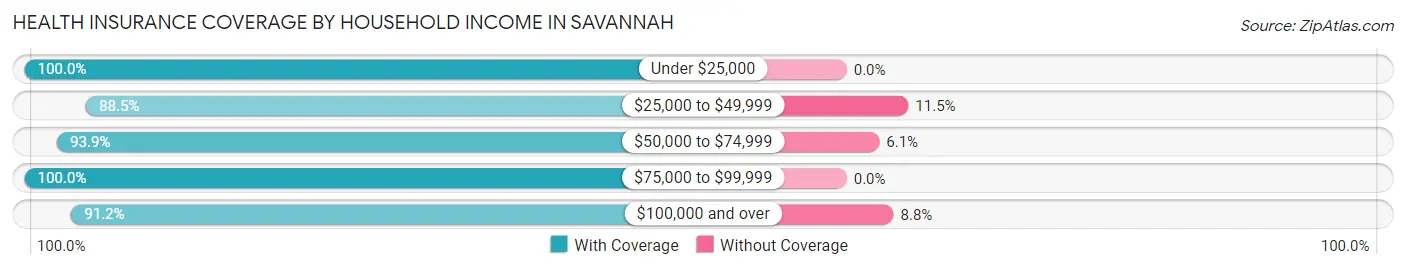
| Household Income | With Coverage | Without Coverage |
| Under $25,000 | 35 (100.0%) | 0 (0.0%) |
| $25,000 to $49,999 | 138 (88.5%) | 18 (11.5%) |
| $50,000 to $74,999 | 77 (93.9%) | 5 (6.1%) |
| $75,000 to $99,999 | 62 (100.0%) | 0 (0.0%) |
| $100,000 and over | 52 (91.2%) | 5 (8.8%) |
Public vs Private Health Insurance Coverage by Age in Savannah
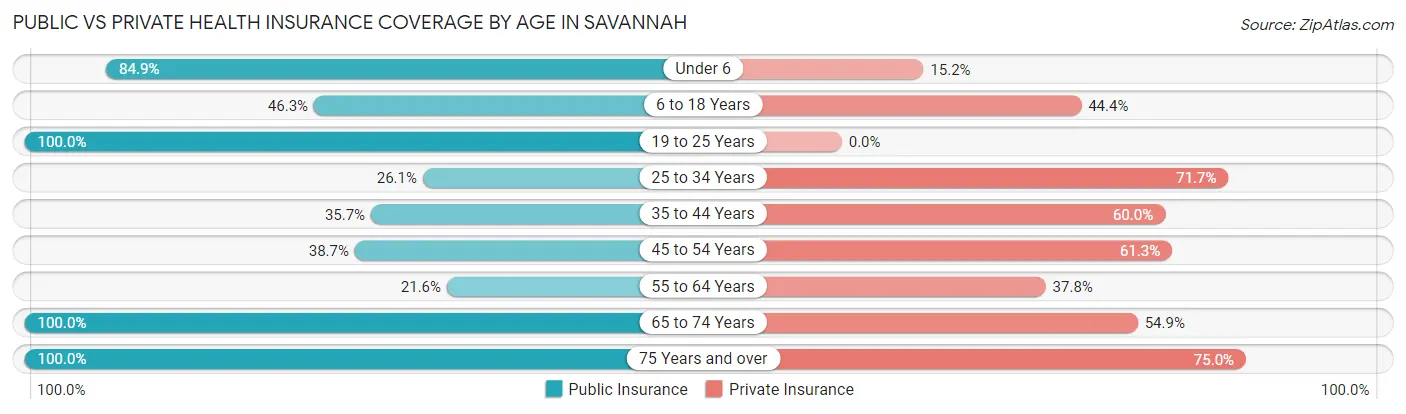
| Age Bracket | Public Insurance | Private Insurance |
| Under 6 | 28 (84.9%) | 5 (15.1%) |
| 6 to 18 Years | 25 (46.3%) | 24 (44.4%) |
| 19 to 25 Years | 11 (100.0%) | 0 (0.0%) |
| 25 to 34 Years | 12 (26.1%) | 33 (71.7%) |
| 35 to 44 Years | 25 (35.7%) | 42 (60.0%) |
| 45 to 54 Years | 12 (38.7%) | 19 (61.3%) |
| 55 to 64 Years | 8 (21.6%) | 14 (37.8%) |
| 65 to 74 Years | 71 (100.0%) | 39 (54.9%) |
| 75 Years and over | 48 (100.0%) | 36 (75.0%) |
| Total | 240 (59.9%) | 212 (52.9%) |
Disability Status by Sex by Age in Savannah
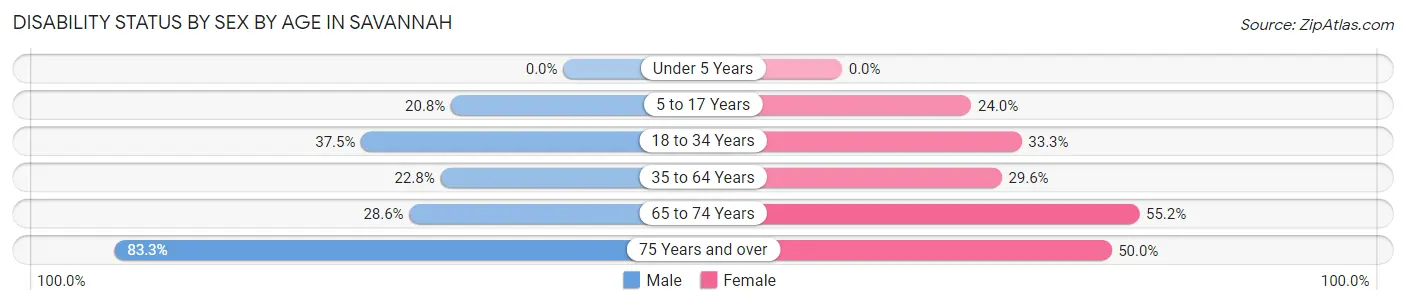
| Age Bracket | Male | Female |
| Under 5 Years | 0 (0.0%) | 0 (0.0%) |
| 5 to 17 Years | 5 (20.8%) | 6 (24.0%) |
| 18 to 34 Years | 12 (37.5%) | 11 (33.3%) |
| 35 to 64 Years | 13 (22.8%) | 24 (29.6%) |
| 65 to 74 Years | 12 (28.6%) | 16 (55.2%) |
| 75 Years and over | 15 (83.3%) | 15 (50.0%) |
Disability Class by Sex by Age in Savannah
Disability Class: Hearing Difficulty
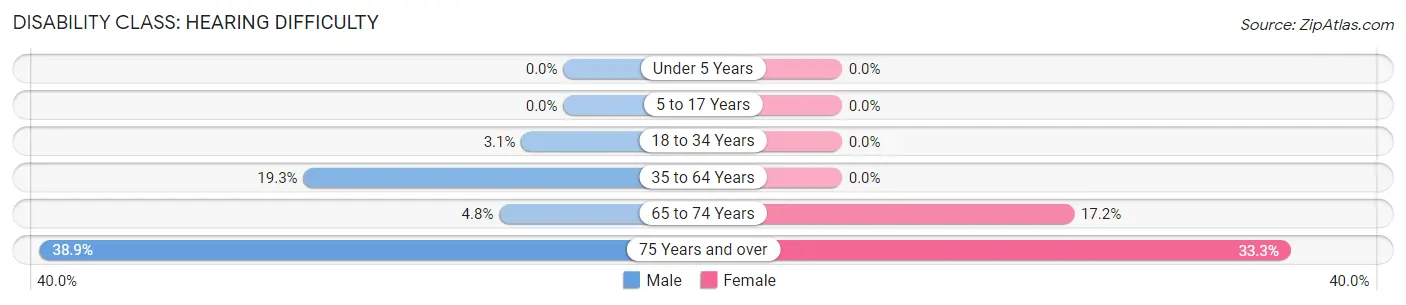
| Age Bracket | Male | Female |
| Under 5 Years | 0 (0.0%) | 0 (0.0%) |
| 5 to 17 Years | 0 (0.0%) | 0 (0.0%) |
| 18 to 34 Years | 1 (3.1%) | 0 (0.0%) |
| 35 to 64 Years | 11 (19.3%) | 0 (0.0%) |
| 65 to 74 Years | 2 (4.8%) | 5 (17.2%) |
| 75 Years and over | 7 (38.9%) | 10 (33.3%) |
Disability Class: Vision Difficulty
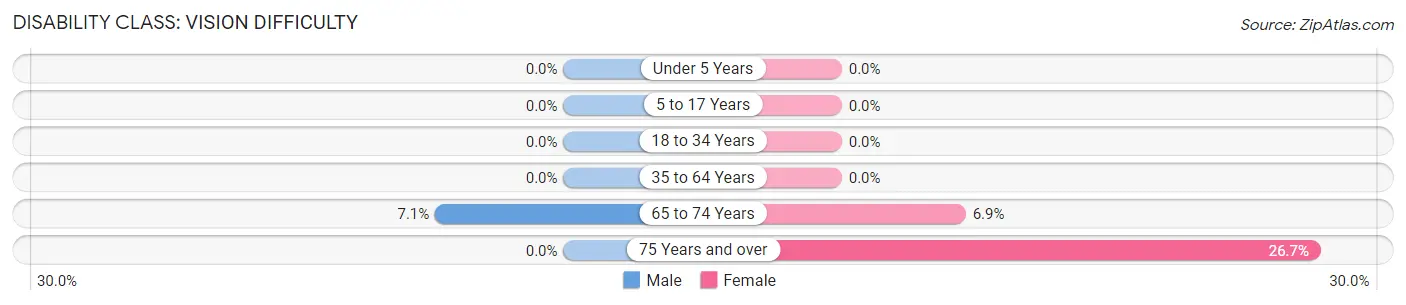
| Age Bracket | Male | Female |
| Under 5 Years | 0 (0.0%) | 0 (0.0%) |
| 5 to 17 Years | 0 (0.0%) | 0 (0.0%) |
| 18 to 34 Years | 0 (0.0%) | 0 (0.0%) |
| 35 to 64 Years | 0 (0.0%) | 0 (0.0%) |
| 65 to 74 Years | 3 (7.1%) | 2 (6.9%) |
| 75 Years and over | 0 (0.0%) | 8 (26.7%) |
Disability Class: Cognitive Difficulty
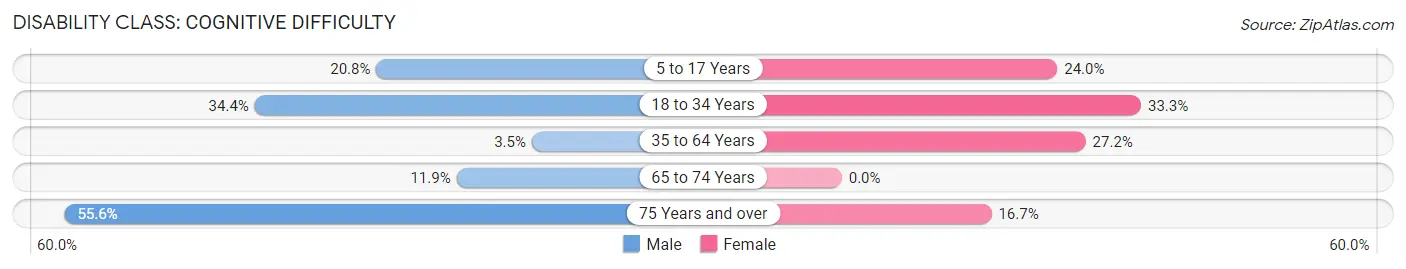
| Age Bracket | Male | Female |
| 5 to 17 Years | 5 (20.8%) | 6 (24.0%) |
| 18 to 34 Years | 11 (34.4%) | 11 (33.3%) |
| 35 to 64 Years | 2 (3.5%) | 22 (27.2%) |
| 65 to 74 Years | 5 (11.9%) | 0 (0.0%) |
| 75 Years and over | 10 (55.6%) | 5 (16.7%) |
Disability Class: Ambulatory Difficulty
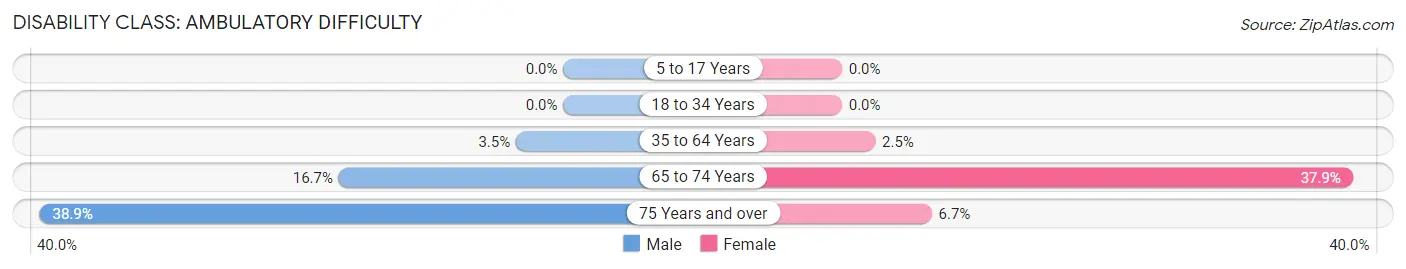
| Age Bracket | Male | Female |
| 5 to 17 Years | 0 (0.0%) | 0 (0.0%) |
| 18 to 34 Years | 0 (0.0%) | 0 (0.0%) |
| 35 to 64 Years | 2 (3.5%) | 2 (2.5%) |
| 65 to 74 Years | 7 (16.7%) | 11 (37.9%) |
| 75 Years and over | 7 (38.9%) | 2 (6.7%) |
Disability Class: Self-Care Difficulty
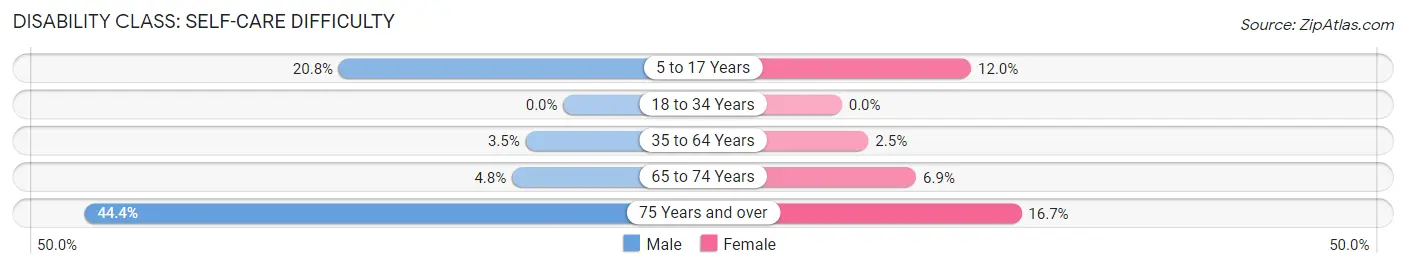
| Age Bracket | Male | Female |
| 5 to 17 Years | 5 (20.8%) | 3 (12.0%) |
| 18 to 34 Years | 0 (0.0%) | 0 (0.0%) |
| 35 to 64 Years | 2 (3.5%) | 2 (2.5%) |
| 65 to 74 Years | 2 (4.8%) | 2 (6.9%) |
| 75 Years and over | 8 (44.4%) | 5 (16.7%) |
Technology Access in Savannah
Computing Device Access in Savannah
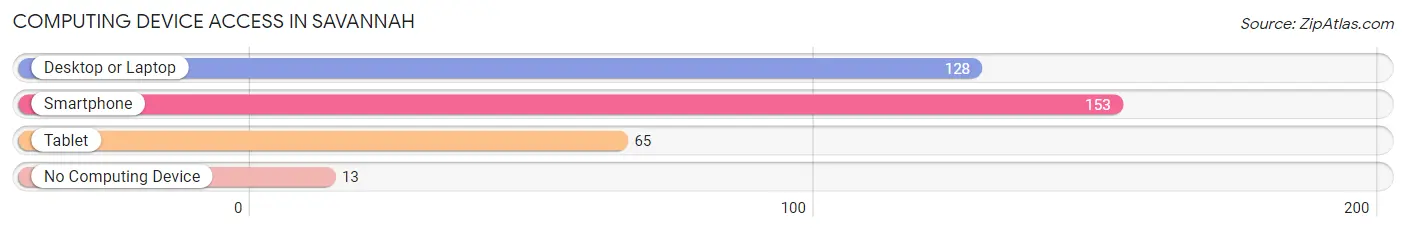
| Device Type | # Households | % Households |
| Desktop or Laptop | 128 | 72.7% |
| Smartphone | 153 | 86.9% |
| Tablet | 65 | 36.9% |
| No Computing Device | 13 | 7.4% |
| Total | 176 | 100.0% |
Internet Access in Savannah
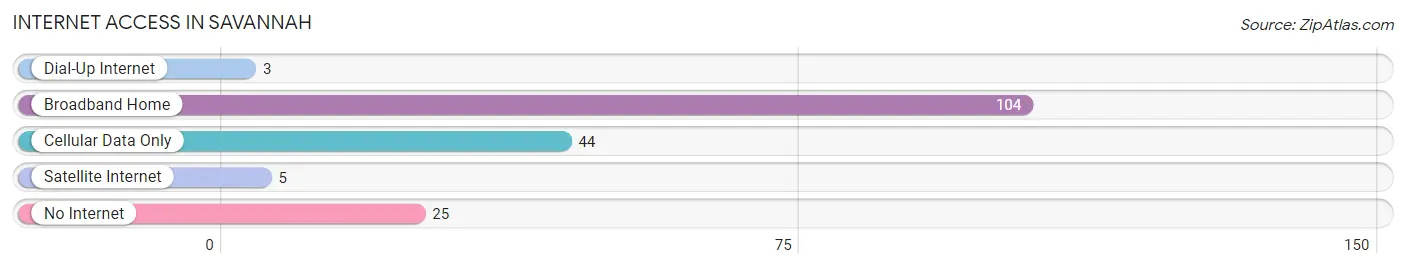
| Internet Type | # Households | % Households |
| Dial-Up Internet | 3 | 1.7% |
| Broadband Home | 104 | 59.1% |
| Cellular Data Only | 44 | 25.0% |
| Satellite Internet | 5 | 2.8% |
| No Internet | 25 | 14.2% |
| Total | 176 | 100.0% |
Savannah Summary
Savannah is a town located in Wayne County, New York, United States. The population was 2,845 at the 2010 census. The town is named after Savannah, Georgia.
Geography
Savannah is located in the northwest corner of Wayne County, bordered by Cayuga County to the north, Seneca County to the east, and Ontario County to the west. The town of Galen is to the south.
According to the United States Census Bureau, the town has a total area of 36.2sqmi, of which 36.1sqmi is land and 0.1sqmi, or 0.22%, is water.
History
The area was first settled around 1790. The town of Savannah was formed in 1806 from the town of Galen.
Demographics
As of the census of 2000, there were 2,845 people, 1,093 households, and 809 families residing in the town. The population density was 78.7 people per square mile (30.4/km^2). There were 1,179 housing units at an average density of 32.6 per square mile (12.6/km^2). The racial makeup of the town was 98.45% White, 0.21% African American, 0.14% Native American, 0.14% Asian, 0.14% from other races, and 0.93% from two or more races. Hispanic or Latino of any race were 0.53% of the population.
There were 1,093 households, out of which 33.2% had children under the age of 18 living with them, 61.2% were married couples living together, 8.2% had a female householder with no husband present, and 26.2% were non-families. 21.2% of all households were made up of individuals, and 9.2% had someone living alone who was 65 years of age or older. The average household size was 2.60 and the average family size was 3.02.
In the town, the population was spread out, with 25.7% under the age of 18, 6.2% from 18 to 24, 28.2% from 25 to 44, 25.2% from 45 to 64, and 14.7% who were 65 years of age or older. The median age was 39 years. For every 100 females, there were 97.2 males. For every 100 females age 18 and over, there were 95.2 males.
The median income for a household in the town was $41,944, and the median income for a family was $47,917. Males had a median income of $35,938 versus $25,000 for females. The per capita income for the town was $18,945. About 5.2% of families and 7.2% of the population were below the poverty line, including 8.2% of those under age 18 and 8.2% of those age 65 or over.
Economy
The economy of Savannah is largely based on agriculture. The town is home to several farms, including dairy farms, vegetable farms, and fruit farms. The town is also home to several wineries, including the Long Cliff Winery and the Heron Hill Winery.
The town is also home to several small businesses, including a hardware store, a grocery store, and a few restaurants. The town is also home to a few small manufacturing companies, including a furniture manufacturer and a metal fabrication company.
The town is also home to a few tourist attractions, including the Long Cliff Winery, the Heron Hill Winery, and the Savannah Historical Society Museum. The town is also home to a few parks, including the Savannah State Park and the Savannah Wildlife Management Area.
Common Questions
What is Per Capita Income in Savannah?
Per Capita income in Savannah is $26,527.
What is the Median Family Income in Savannah?
Median Family Income in Savannah is $74,000.
What is the Median Household income in Savannah?
Median Household Income in Savannah is $46,029.
What is Income or Wage Gap in Savannah?
Income or Wage Gap in Savannah is 22.3%.
Women in Savannah earn 77.7 cents for every dollar earned by a man.
What is Inequality or Gini Index in Savannah?
Inequality or Gini Index in Savannah is 0.33.
What is the Total Population of Savannah?
Total Population of Savannah is 401.
What is the Total Male Population of Savannah?
Total Male Population of Savannah is 187.
What is the Total Female Population of Savannah?
Total Female Population of Savannah is 214.
What is the Ratio of Males per 100 Females in Savannah?
There are 87.38 Males per 100 Females in Savannah.
What is the Ratio of Females per 100 Males in Savannah?
There are 114.44 Females per 100 Males in Savannah.
What is the Median Population Age in Savannah?
Median Population Age in Savannah is 44.0 Years.
What is the Average Family Size in Savannah
Average Family Size in Savannah is 3.5 People.
What is the Average Household Size in Savannah
Average Household Size in Savannah is 2.2 People.
How Large is the Labor Force in Savannah?
There are 158 People in the Labor Forcein in Savannah.
What is the Percentage of People in the Labor Force in Savannah?
47.9% of People are in the Labor Force in Savannah.
What is the Unemployment Rate in Savannah?
Unemployment Rate in Savannah is 14.6%.