Willsboro, NY Map & Demographics
Willsboro Map
Willsboro Overview
$22,426
PER CAPITA INCOME
$59,583
AVG FAMILY INCOME
$53,523
AVG HOUSEHOLD INCOME
20.8%
WAGE / INCOME GAP [ % ]
79.2¢/ $1
WAGE / INCOME GAP [ $ ]
0.35
INEQUALITY / GINI INDEX
753
TOTAL POPULATION
397
MALE POPULATION
356
FEMALE POPULATION
111.52
MALES / 100 FEMALES
89.67
FEMALES / 100 MALES
45.3
MEDIAN AGE
3.4
AVG FAMILY SIZE
3.0
AVG HOUSEHOLD SIZE
328
LABOR FORCE [ PEOPLE ]
53.9%
PERCENT IN LABOR FORCE
Willsboro Zip Codes
Willsboro Area Codes
Income in Willsboro
Income Overview in Willsboro
Per Capita Income in Willsboro is $22,426, while median incomes of families and households are $59,583 and $53,523 respectively.
| Characteristic | Number | Measure |
| Per Capita Income | 753 | $22,426 |
| Median Family Income | 195 | $59,583 |
| Mean Family Income | 195 | $65,153 |
| Median Household Income | 254 | $53,523 |
| Mean Household Income | 254 | $59,404 |
| Income Deficit | 195 | $0 |
| Wage / Income Gap (%) | 753 | 20.81% |
| Wage / Income Gap ($) | 753 | 79.19¢ per $1 |
| Gini / Inequality Index | 753 | 0.35 |
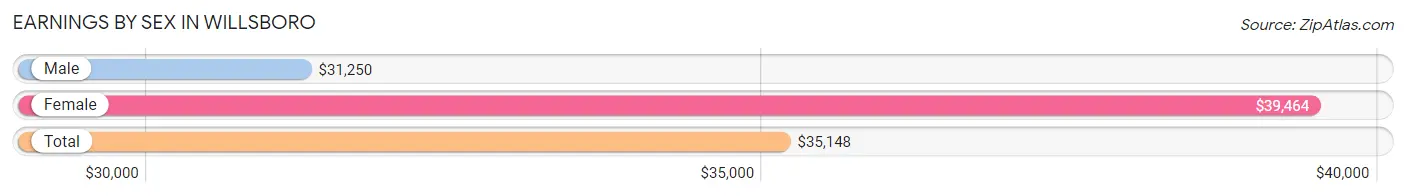
Earnings by Sex in Willsboro
Average Earnings in Willsboro are $35,148, $31,250 for men and $39,464 for women, a difference of 20.8%.
| Sex | Number | Average Earnings |
| Male | 186 (50.1%) | $31,250 |
| Female | 185 (49.9%) | $39,464 |
| Total | 371 (100.0%) | $35,148 |
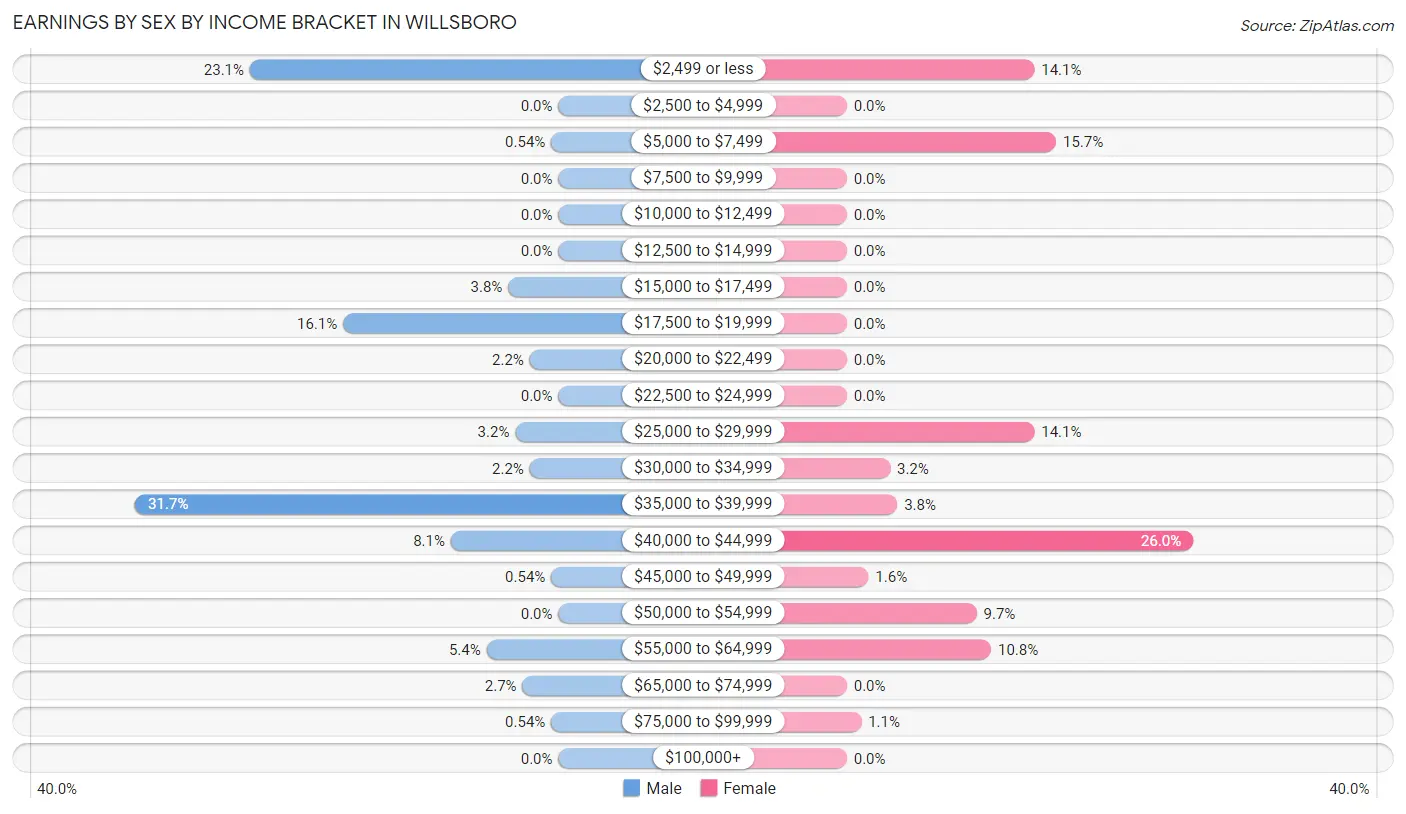
Earnings by Sex by Income Bracket in Willsboro
The most common earnings brackets in Willsboro are $35,000 to $39,999 for men (59 | 31.7%) and $40,000 to $44,999 for women (48 | 26.0%).
| Income | Male | Female |
| $2,499 or less | 43 (23.1%) | 26 (14.1%) |
| $2,500 to $4,999 | 0 (0.0%) | 0 (0.0%) |
| $5,000 to $7,499 | 1 (0.5%) | 29 (15.7%) |
| $7,500 to $9,999 | 0 (0.0%) | 0 (0.0%) |
| $10,000 to $12,499 | 0 (0.0%) | 0 (0.0%) |
| $12,500 to $14,999 | 0 (0.0%) | 0 (0.0%) |
| $15,000 to $17,499 | 7 (3.8%) | 0 (0.0%) |
| $17,500 to $19,999 | 30 (16.1%) | 0 (0.0%) |
| $20,000 to $22,499 | 4 (2.1%) | 0 (0.0%) |
| $22,500 to $24,999 | 0 (0.0%) | 0 (0.0%) |
| $25,000 to $29,999 | 6 (3.2%) | 26 (14.1%) |
| $30,000 to $34,999 | 4 (2.1%) | 6 (3.2%) |
| $35,000 to $39,999 | 59 (31.7%) | 7 (3.8%) |
| $40,000 to $44,999 | 15 (8.1%) | 48 (26.0%) |
| $45,000 to $49,999 | 1 (0.5%) | 3 (1.6%) |
| $50,000 to $54,999 | 0 (0.0%) | 18 (9.7%) |
| $55,000 to $64,999 | 10 (5.4%) | 20 (10.8%) |
| $65,000 to $74,999 | 5 (2.7%) | 0 (0.0%) |
| $75,000 to $99,999 | 1 (0.5%) | 2 (1.1%) |
| $100,000+ | 0 (0.0%) | 0 (0.0%) |
| Total | 186 (100.0%) | 185 (100.0%) |
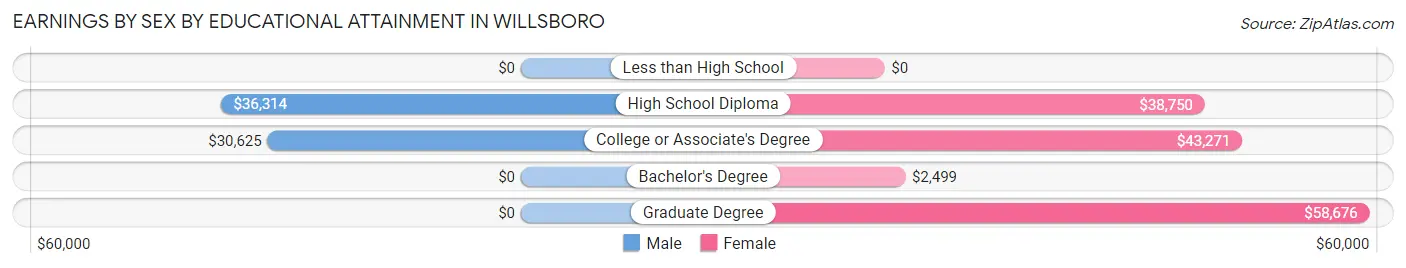
Earnings by Sex by Educational Attainment in Willsboro
Average earnings in Willsboro are $35,847 for men and $39,464 for women, a difference of 9.2%. Men with an educational attainment of high school diploma enjoy the highest average annual earnings of $36,314, while those with college or associate's degree education earn the least with $30,625. Women with an educational attainment of graduate degree earn the most with the average annual earnings of $58,676, while those with bachelor's degree education have the smallest earnings of $2,499.
| Educational Attainment | Male Income | Female Income |
| Less than High School | - | - |
| High School Diploma | $36,314 | $38,750 |
| College or Associate's Degree | $30,625 | $43,271 |
| Bachelor's Degree | - | - |
| Graduate Degree | - | - |
| Total | $35,847 | $39,464 |
Family Income in Willsboro
Family Income Brackets in Willsboro
According to the Willsboro family income data, there are 50 families falling into the $50,000 to $74,999 income range, which is the most common income bracket and makes up 25.6% of all families.
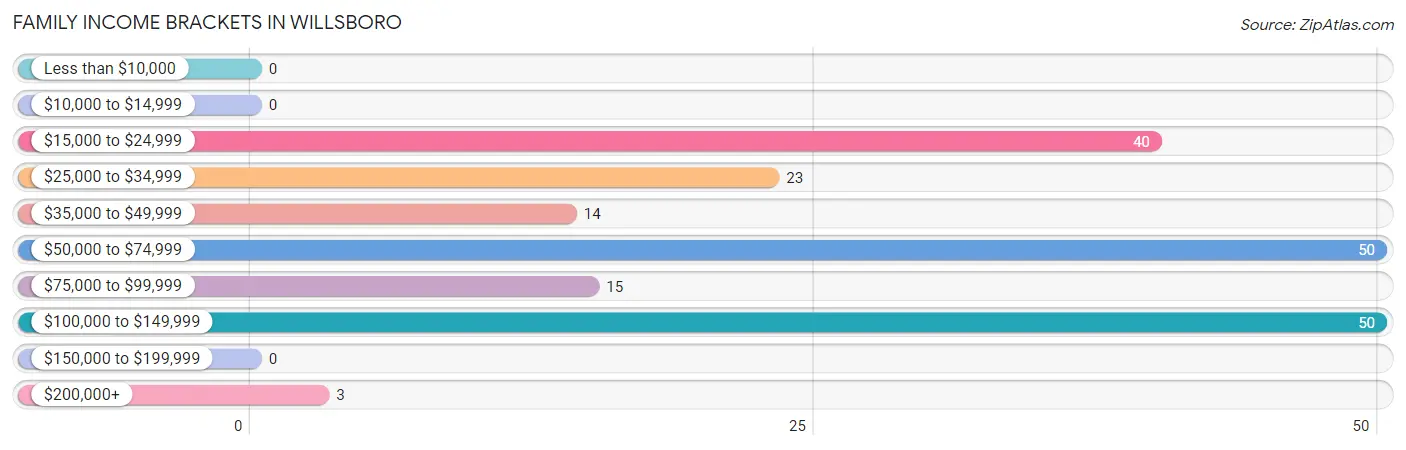
| Income Bracket | # Families | % Families |
| Less than $10,000 | 0 | 0.0% |
| $10,000 to $14,999 | 0 | 0.0% |
| $15,000 to $24,999 | 40 | 20.5% |
| $25,000 to $34,999 | 23 | 11.8% |
| $35,000 to $49,999 | 14 | 7.2% |
| $50,000 to $74,999 | 50 | 25.6% |
| $75,000 to $99,999 | 15 | 7.7% |
| $100,000 to $149,999 | 50 | 25.6% |
| $150,000 to $199,999 | 0 | 0.0% |
| $200,000+ | 3 | 1.5% |
Family Income by Famaliy Size in Willsboro
5-person families (62 | 31.8%) account for the highest median family income in Willsboro with $108,676 per family, while 2-person families (87 | 44.6%) have the highest median income of $26,654 per family member.
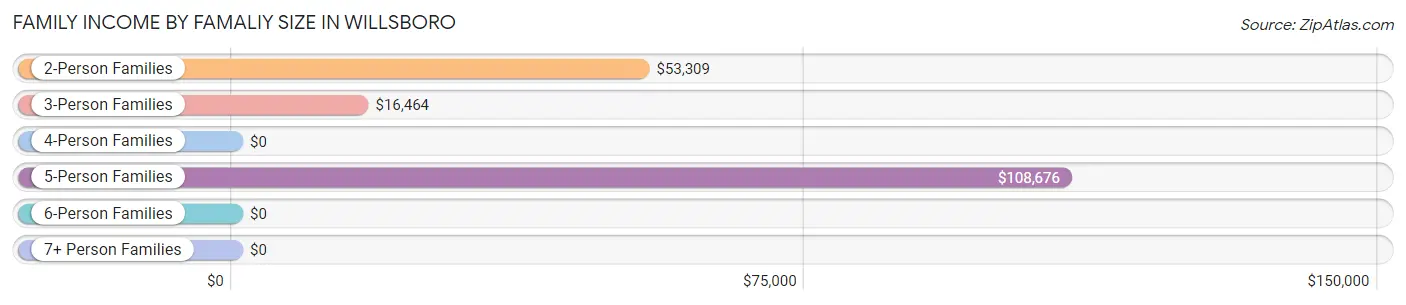
| Income Bracket | # Families | Median Income |
| 2-Person Families | 87 (44.6%) | $53,309 |
| 3-Person Families | 41 (21.0%) | $16,464 |
| 4-Person Families | 0 (0.0%) | $0 |
| 5-Person Families | 62 (31.8%) | $108,676 |
| 6-Person Families | 5 (2.6%) | $0 |
| 7+ Person Families | 0 (0.0%) | $0 |
| Total | 195 (100.0%) | $59,583 |
Family Income by Number of Earners in Willsboro
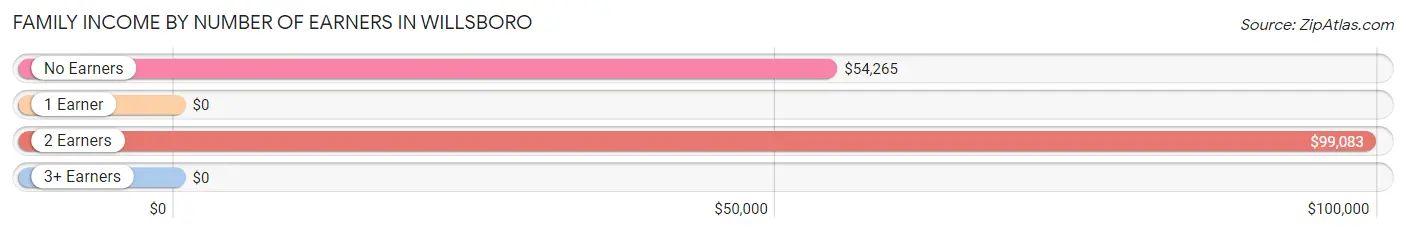
| Number of Earners | # Families | Median Income |
| No Earners | 44 (22.6%) | $54,265 |
| 1 Earner | 69 (35.4%) | $0 |
| 2 Earners | 47 (24.1%) | $99,083 |
| 3+ Earners | 35 (17.9%) | $0 |
| Total | 195 (100.0%) | $59,583 |
Household Income in Willsboro
Household Income Brackets in Willsboro
With 74 households falling in the category, the $50,000 to $74,999 income range is the most frequent in Willsboro, accounting for 29.1% of all households.
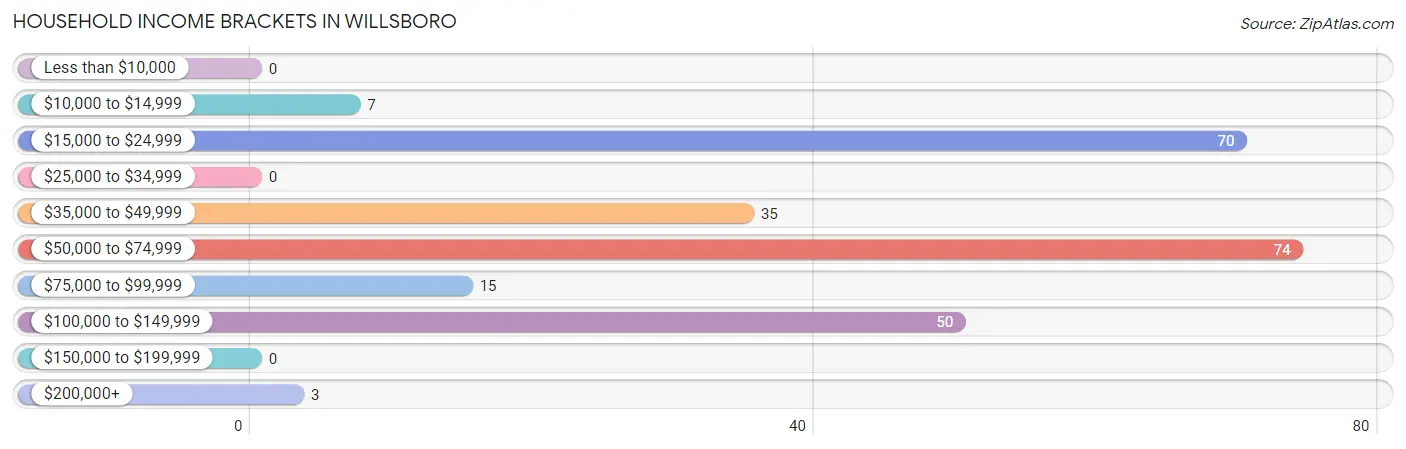
| Income Bracket | # Households | % Households |
| Less than $10,000 | 0 | 0.0% |
| $10,000 to $14,999 | 7 | 2.8% |
| $15,000 to $24,999 | 70 | 27.6% |
| $25,000 to $34,999 | 0 | 0.0% |
| $35,000 to $49,999 | 35 | 13.8% |
| $50,000 to $74,999 | 74 | 29.1% |
| $75,000 to $99,999 | 15 | 5.9% |
| $100,000 to $149,999 | 50 | 19.7% |
| $150,000 to $199,999 | 0 | 0.0% |
| $200,000+ | 3 | 1.2% |
Household Income by Householder Age in Willsboro
The median household income in Willsboro is $53,523, with the highest median household income of $97,583 found in the 25 to 44 years age bracket for the primary householder. A total of 57 households (22.4%) fall into this category.
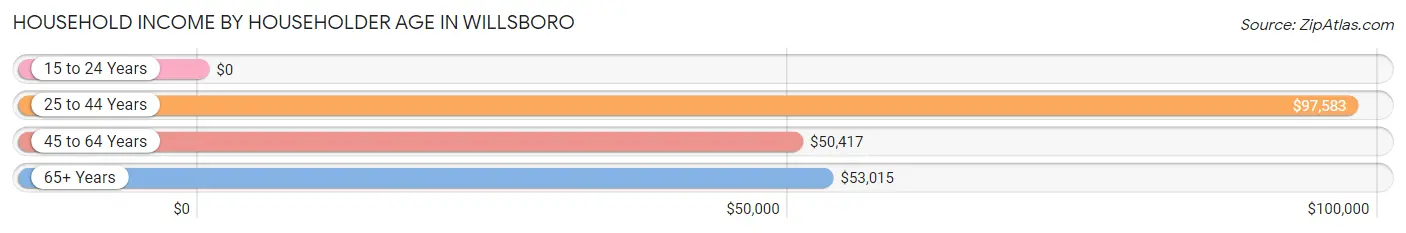
| Income Bracket | # Households | Median Income |
| 15 to 24 Years | 0 (0.0%) | $0 |
| 25 to 44 Years | 57 (22.4%) | $97,583 |
| 45 to 64 Years | 44 (17.3%) | $50,417 |
| 65+ Years | 153 (60.2%) | $53,015 |
| Total | 254 (100.0%) | $53,523 |
Poverty in Willsboro
Income Below Poverty by Sex and Age in Willsboro
With 14.4% poverty level for males and 11.5% for females among the residents of Willsboro, 12 to 14 year old males and 35 to 44 year old females are the most vulnerable to poverty, with 22 males (81.5%) and 26 females (31.7%) in their respective age groups living below the poverty level.
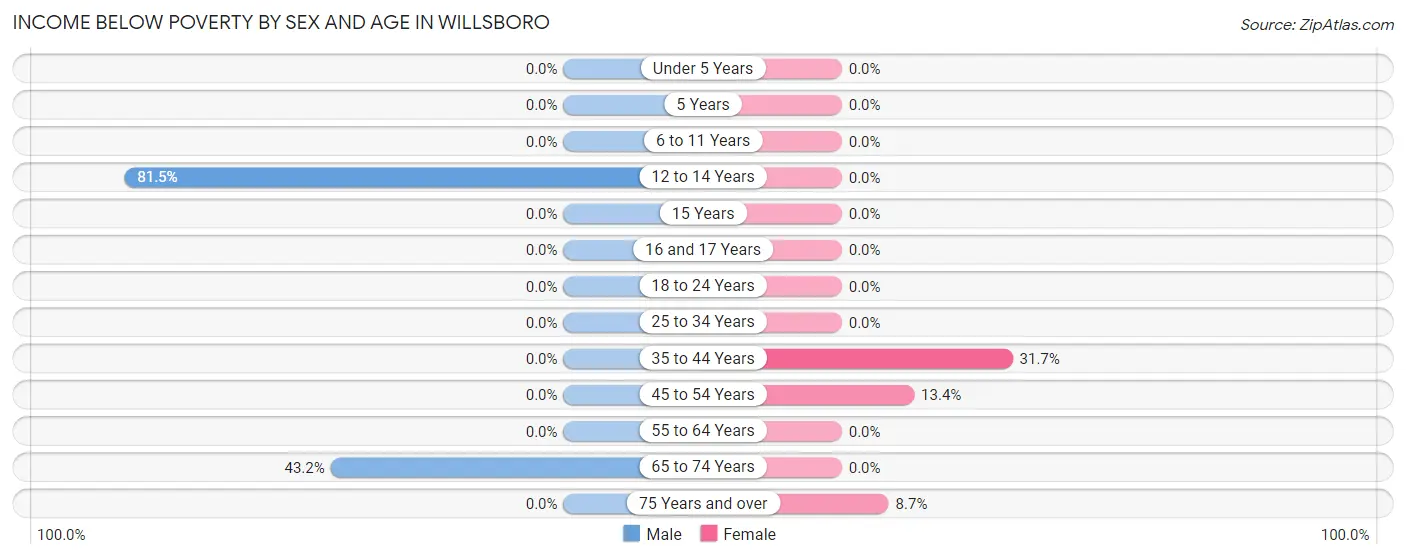
| Age Bracket | Male | Female |
| Under 5 Years | 0 (0.0%) | 0 (0.0%) |
| 5 Years | 0 (0.0%) | 0 (0.0%) |
| 6 to 11 Years | 0 (0.0%) | 0 (0.0%) |
| 12 to 14 Years | 22 (81.5%) | 0 (0.0%) |
| 15 Years | 0 (0.0%) | 0 (0.0%) |
| 16 and 17 Years | 0 (0.0%) | 0 (0.0%) |
| 18 to 24 Years | 0 (0.0%) | 0 (0.0%) |
| 25 to 34 Years | 0 (0.0%) | 0 (0.0%) |
| 35 to 44 Years | 0 (0.0%) | 26 (31.7%) |
| 45 to 54 Years | 0 (0.0%) | 9 (13.4%) |
| 55 to 64 Years | 0 (0.0%) | 0 (0.0%) |
| 65 to 74 Years | 35 (43.2%) | 0 (0.0%) |
| 75 Years and over | 0 (0.0%) | 6 (8.7%) |
| Total | 57 (14.4%) | 41 (11.5%) |
Income Above Poverty by Sex and Age in Willsboro
According to the poverty statistics in Willsboro, males aged under 5 years and females aged under 5 years are the age groups that are most secure financially, with 100.0% of males and 100.0% of females in these age groups living above the poverty line.
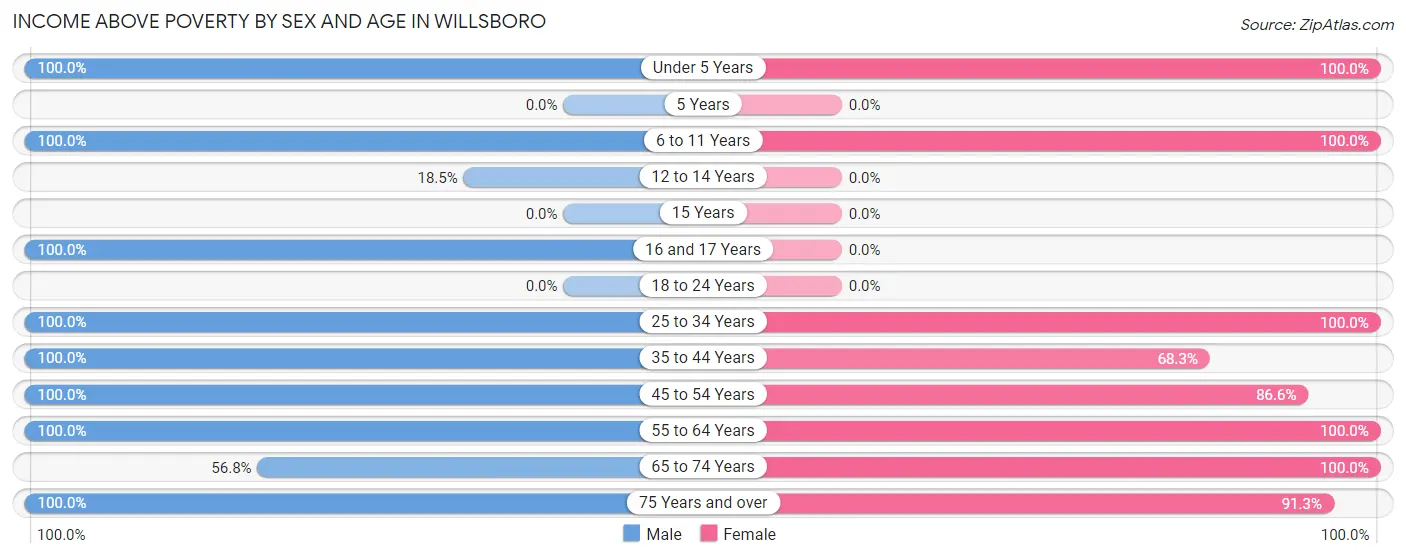
| Age Bracket | Male | Female |
| Under 5 Years | 16 (100.0%) | 28 (100.0%) |
| 5 Years | 0 (0.0%) | 0 (0.0%) |
| 6 to 11 Years | 46 (100.0%) | 28 (100.0%) |
| 12 to 14 Years | 5 (18.5%) | 0 (0.0%) |
| 15 Years | 0 (0.0%) | 0 (0.0%) |
| 16 and 17 Years | 44 (100.0%) | 0 (0.0%) |
| 18 to 24 Years | 0 (0.0%) | 0 (0.0%) |
| 25 to 34 Years | 34 (100.0%) | 31 (100.0%) |
| 35 to 44 Years | 27 (100.0%) | 56 (68.3%) |
| 45 to 54 Years | 66 (100.0%) | 58 (86.6%) |
| 55 to 64 Years | 20 (100.0%) | 34 (100.0%) |
| 65 to 74 Years | 46 (56.8%) | 17 (100.0%) |
| 75 Years and over | 36 (100.0%) | 63 (91.3%) |
| Total | 340 (85.6%) | 315 (88.5%) |
Income Below Poverty Among Married-Couple Families in Willsboro
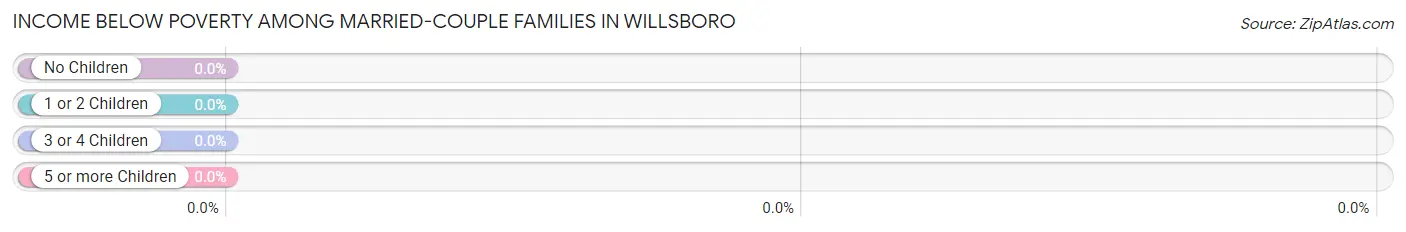
| Children | Above Poverty | Below Poverty |
| No Children | 55 (100.0%) | 0 (0.0%) |
| 1 or 2 Children | 1 (100.0%) | 0 (0.0%) |
| 3 or 4 Children | 33 (100.0%) | 0 (0.0%) |
| 5 or more Children | 0 (0.0%) | 0 (0.0%) |
| Total | 89 (100.0%) | 0 (0.0%) |
Income Below Poverty Among Single-Parent Households in Willsboro
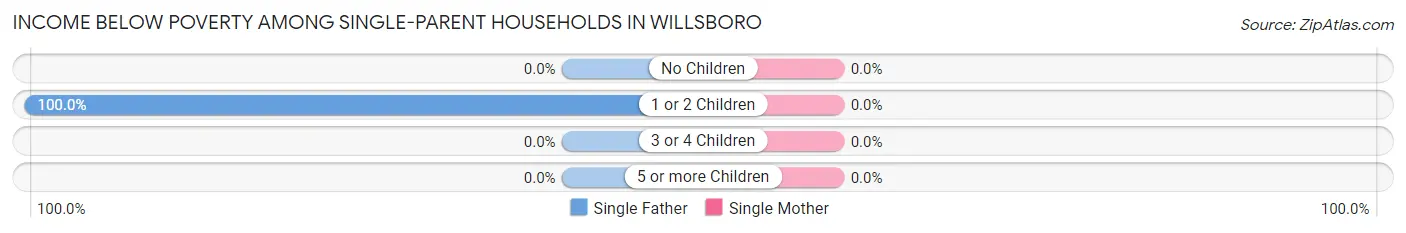
| Children | Single Father | Single Mother |
| No Children | 0 (0.0%) | 0 (0.0%) |
| 1 or 2 Children | 35 (100.0%) | 0 (0.0%) |
| 3 or 4 Children | 0 (0.0%) | 0 (0.0%) |
| 5 or more Children | 0 (0.0%) | 0 (0.0%) |
| Total | 35 (100.0%) | 0 (0.0%) |
Income Below Poverty Among Married-Couple vs Single-Parent Households in Willsboro
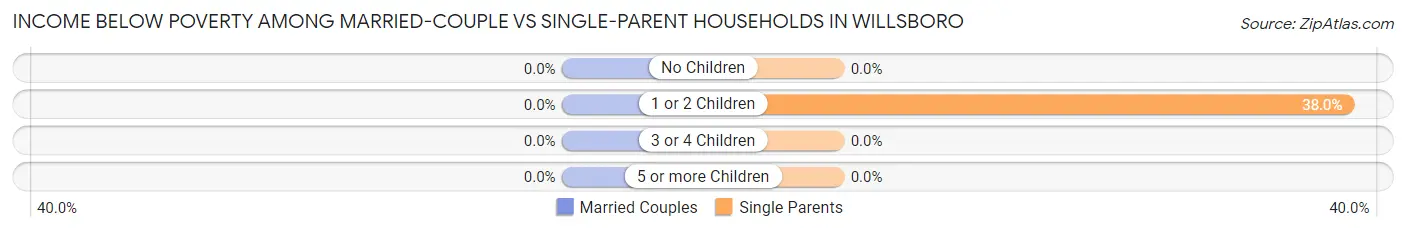
| Children | Married-Couple Families | Single-Parent Households |
| No Children | 0 (0.0%) | 0 (0.0%) |
| 1 or 2 Children | 0 (0.0%) | 35 (38.0%) |
| 3 or 4 Children | 0 (0.0%) | 0 (0.0%) |
| 5 or more Children | 0 (0.0%) | 0 (0.0%) |
| Total | 0 (0.0%) | 35 (33.0%) |
Race in Willsboro
The most populous races in Willsboro are White / Caucasian (609 | 80.9%), Some other Race (83 | 11.0%), and Two or more Races (44 | 5.8%).
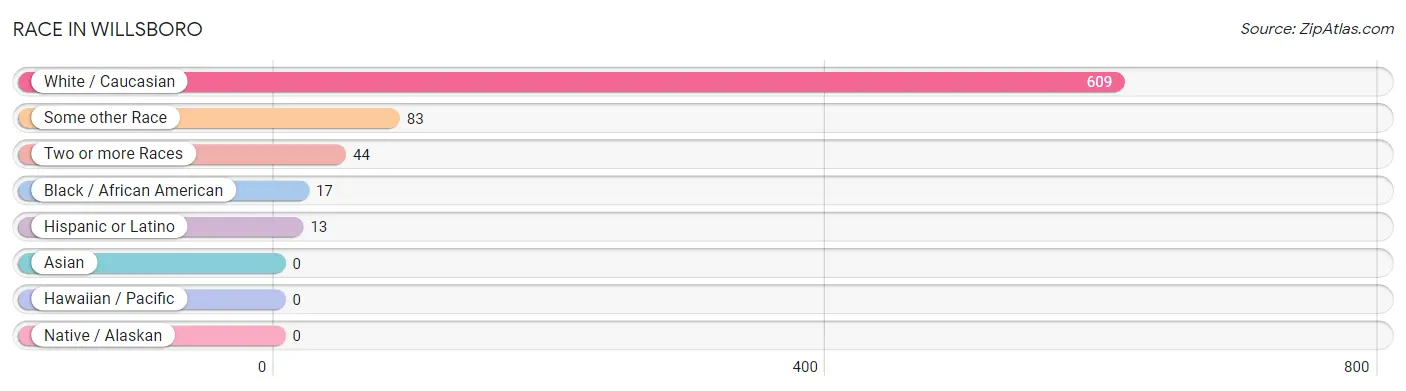
| Race | # Population | % Population |
| Asian | 0 | 0.0% |
| Black / African American | 17 | 2.3% |
| Hawaiian / Pacific | 0 | 0.0% |
| Hispanic or Latino | 13 | 1.7% |
| Native / Alaskan | 0 | 0.0% |
| White / Caucasian | 609 | 80.9% |
| Two or more Races | 44 | 5.8% |
| Some other Race | 83 | 11.0% |
| Total | 753 | 100.0% |
Ancestry in Willsboro
The most populous ancestries reported in Willsboro are English (102 | 13.6%), Irish (78 | 10.4%), American (60 | 8.0%), Polish (52 | 6.9%), and Ethiopian (42 | 5.6%), together accounting for 44.4% of all Willsboro residents.
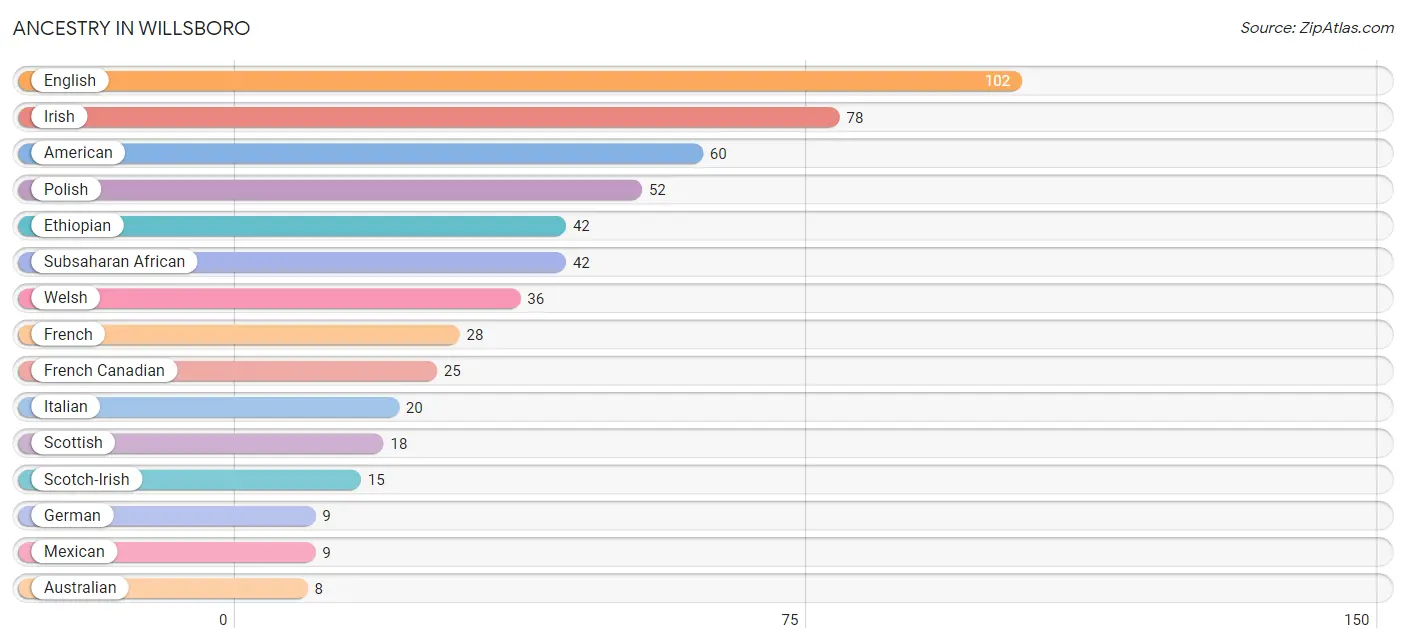
| Ancestry | # Population | % Population |
| American | 60 | 8.0% |
| Australian | 8 | 1.1% |
| Dutch | 6 | 0.8% |
| English | 102 | 13.6% |
| Ethiopian | 42 | 5.6% |
| French | 28 | 3.7% |
| French Canadian | 25 | 3.3% |
| German | 9 | 1.2% |
| Irish | 78 | 10.4% |
| Italian | 20 | 2.7% |
| Mexican | 9 | 1.2% |
| Norwegian | 7 | 0.9% |
| Polish | 52 | 6.9% |
| Puerto Rican | 4 | 0.5% |
| Scotch-Irish | 15 | 2.0% |
| Scottish | 18 | 2.4% |
| Subsaharan African | 42 | 5.6% |
| Welsh | 36 | 4.8% | View All 18 Rows |
Immigrants in Willsboro
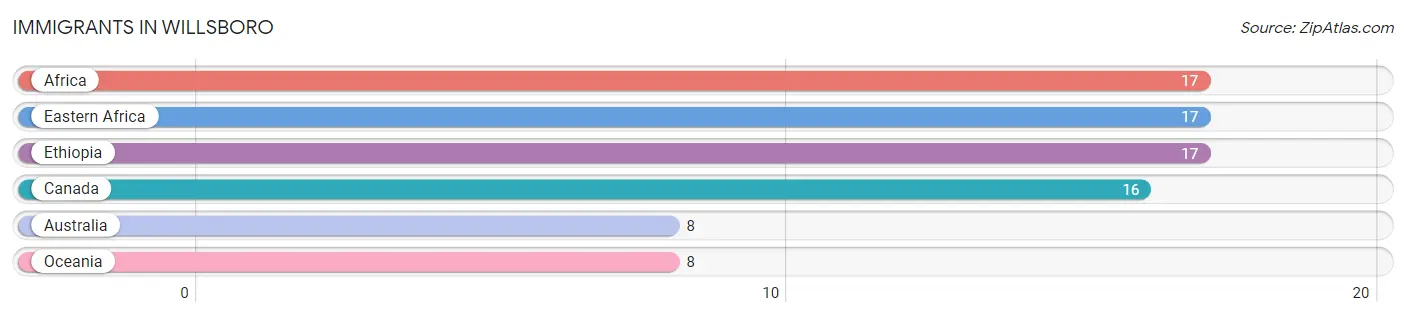
The most numerous immigrant groups reported in Willsboro came from Africa (17 | 2.3%), Eastern Africa (17 | 2.3%), Ethiopia (17 | 2.3%), Canada (16 | 2.1%), and Australia (8 | 1.1%), together accounting for 10.0% of all Willsboro residents.
| Immigration Origin | # Population | % Population |
| Africa | 17 | 2.3% |
| Australia | 8 | 1.1% |
| Canada | 16 | 2.1% |
| Eastern Africa | 17 | 2.3% |
| Ethiopia | 17 | 2.3% |
| Oceania | 8 | 1.1% | View All 6 Rows |
Sex and Age in Willsboro
Sex and Age in Willsboro
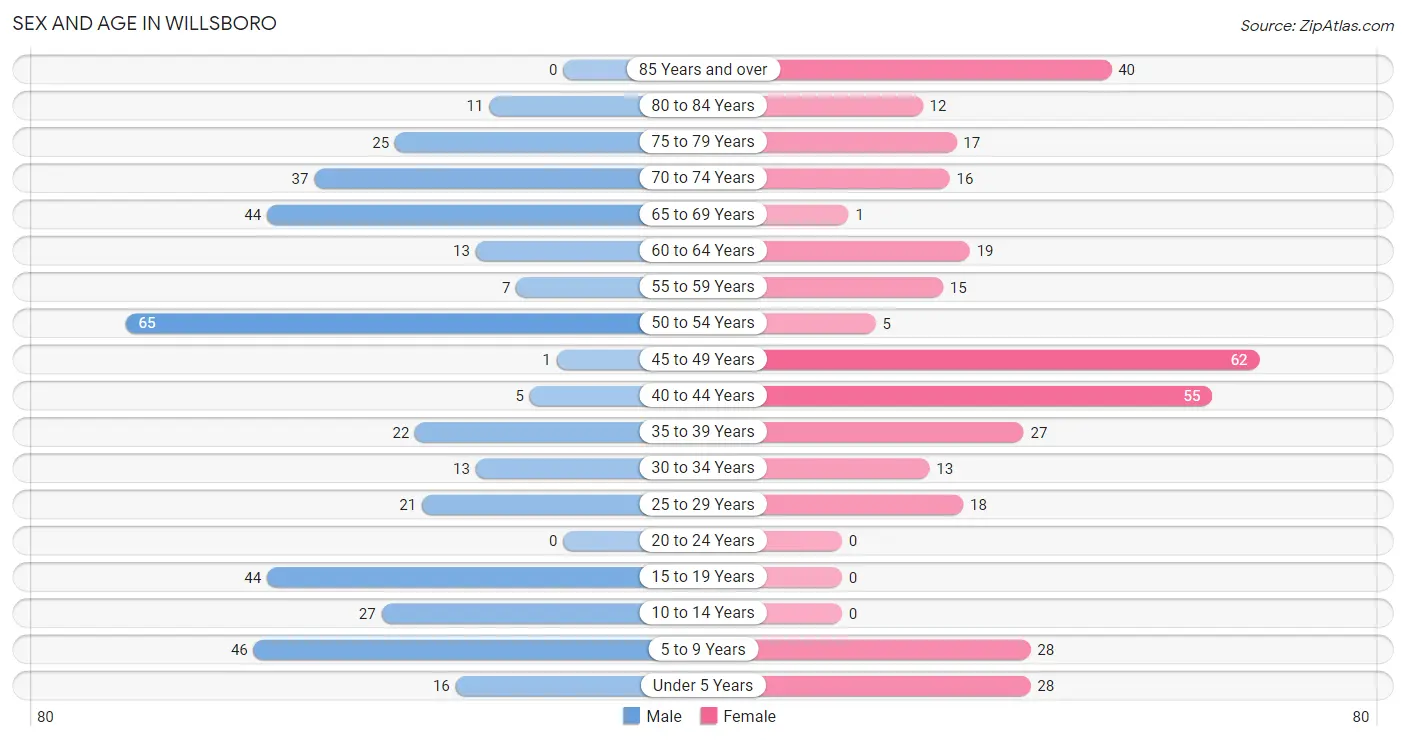
The most populous age groups in Willsboro are 50 to 54 Years (65 | 16.4%) for men and 45 to 49 Years (62 | 17.4%) for women.
| Age Bracket | Male | Female |
| Under 5 Years | 16 (4.0%) | 28 (7.9%) |
| 5 to 9 Years | 46 (11.6%) | 28 (7.9%) |
| 10 to 14 Years | 27 (6.8%) | 0 (0.0%) |
| 15 to 19 Years | 44 (11.1%) | 0 (0.0%) |
| 20 to 24 Years | 0 (0.0%) | 0 (0.0%) |
| 25 to 29 Years | 21 (5.3%) | 18 (5.1%) |
| 30 to 34 Years | 13 (3.3%) | 13 (3.6%) |
| 35 to 39 Years | 22 (5.5%) | 27 (7.6%) |
| 40 to 44 Years | 5 (1.3%) | 55 (15.4%) |
| 45 to 49 Years | 1 (0.3%) | 62 (17.4%) |
| 50 to 54 Years | 65 (16.4%) | 5 (1.4%) |
| 55 to 59 Years | 7 (1.8%) | 15 (4.2%) |
| 60 to 64 Years | 13 (3.3%) | 19 (5.3%) |
| 65 to 69 Years | 44 (11.1%) | 1 (0.3%) |
| 70 to 74 Years | 37 (9.3%) | 16 (4.5%) |
| 75 to 79 Years | 25 (6.3%) | 17 (4.8%) |
| 80 to 84 Years | 11 (2.8%) | 12 (3.4%) |
| 85 Years and over | 0 (0.0%) | 40 (11.2%) |
| Total | 397 (100.0%) | 356 (100.0%) |
Families and Households in Willsboro
Median Family Size in Willsboro
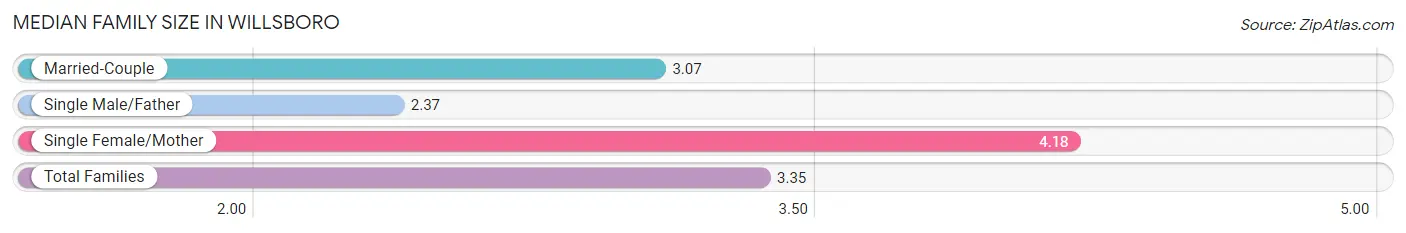
The median family size in Willsboro is 3.35 persons per family, with single female/mother families (71 | 36.4%) accounting for the largest median family size of 4.18 persons per family. On the other hand, single male/father families (35 | 17.9%) represent the smallest median family size with 2.37 persons per family.
| Family Type | # Families | Family Size |
| Married-Couple | 89 (45.6%) | 3.07 |
| Single Male/Father | 35 (17.9%) | 2.37 |
| Single Female/Mother | 71 (36.4%) | 4.18 |
| Total Families | 195 (100.0%) | 3.35 |
Median Household Size in Willsboro
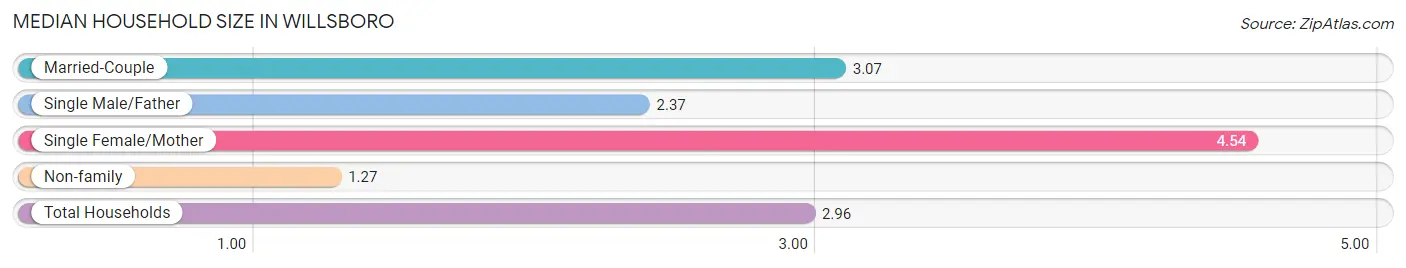
The median household size in Willsboro is 2.96 persons per household, with single female/mother households (71 | 28.0%) accounting for the largest median household size of 4.54 persons per household. non-family households (59 | 23.2%) represent the smallest median household size with 1.27 persons per household.
| Household Type | # Households | Household Size |
| Married-Couple | 89 (35.0%) | 3.07 |
| Single Male/Father | 35 (13.8%) | 2.37 |
| Single Female/Mother | 71 (28.0%) | 4.54 |
| Non-family | 59 (23.2%) | 1.27 |
| Total Households | 254 (100.0%) | 2.96 |
Household Size by Marriage Status in Willsboro
Out of a total of 254 households in Willsboro, 195 (76.8%) are family households, while 59 (23.2%) are nonfamily households. The most numerous type of family households are 2-person households, comprising 69, and the most common type of nonfamily households are 1-person households, comprising 46.
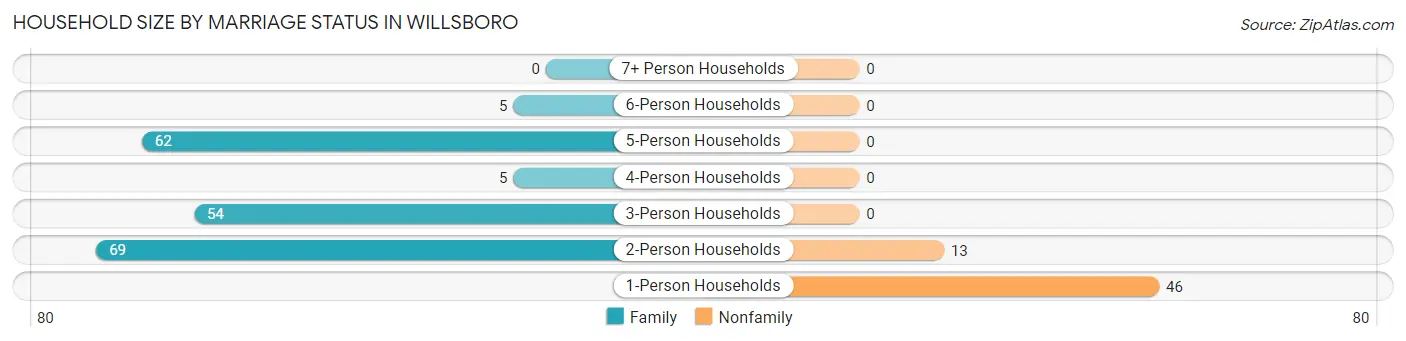
| Household Size | Family Households | Nonfamily Households |
| 1-Person Households | - | 46 (18.1%) |
| 2-Person Households | 69 (27.2%) | 13 (5.1%) |
| 3-Person Households | 54 (21.3%) | 0 (0.0%) |
| 4-Person Households | 5 (2.0%) | 0 (0.0%) |
| 5-Person Households | 62 (24.4%) | 0 (0.0%) |
| 6-Person Households | 5 (2.0%) | 0 (0.0%) |
| 7+ Person Households | 0 (0.0%) | 0 (0.0%) |
| Total | 195 (76.8%) | 59 (23.2%) |
Female Fertility in Willsboro
Fertility by Age in Willsboro
| Age Bracket | Women with Births | Births / 1,000 Women |
| 15 to 19 years | 0 (0.0%) | 0.0 |
| 20 to 34 years | 0 (0.0%) | 0.0 |
| 35 to 50 years | 0 (0.0%) | 0.0 |
| Total | 0 (0.0%) | 0.0 |
Fertility by Age by Marriage Status in Willsboro
| Age Bracket | Married | Unmarried |
| 15 to 19 years | 0 (0.0%) | 0 (0.0%) |
| 20 to 34 years | 0 (0.0%) | 0 (0.0%) |
| 35 to 50 years | 0 (0.0%) | 0 (0.0%) |
| Total | 0 (0.0%) | 0 (0.0%) |
Fertility by Education in Willsboro
| Educational Attainment | Women with Births | Births / 1,000 Women |
| Less than High School | 0 (0.0%) | 0.0 |
| High School Diploma | 0 (0.0%) | 0.0 |
| College or Associate's Degree | 0 (0.0%) | 0.0 |
| Bachelor's Degree | 0 (0.0%) | 0.0 |
| Graduate Degree | 0 (0.0%) | 0.0 |
| Total | 0 (0.0%) | 0.0 |
Fertility by Education by Marriage Status in Willsboro
| Educational Attainment | Married | Unmarried |
| Less than High School | 0 (0.0%) | 0 (0.0%) |
| High School Diploma | 0 (0.0%) | 0 (0.0%) |
| College or Associate's Degree | 0 (0.0%) | 0 (0.0%) |
| Bachelor's Degree | 0 (0.0%) | 0 (0.0%) |
| Graduate Degree | 0 (0.0%) | 0 (0.0%) |
| Total | 0 (0.0%) | 0 (0.0%) |
Employment Characteristics in Willsboro
Employment by Class of Employer in Willsboro
Among the 328 employed individuals in Willsboro, private company employees (153 | 46.7%), not-for-profit organizations (97 | 29.6%), and local government employees (36 | 11.0%) make up the most common classes of employment.
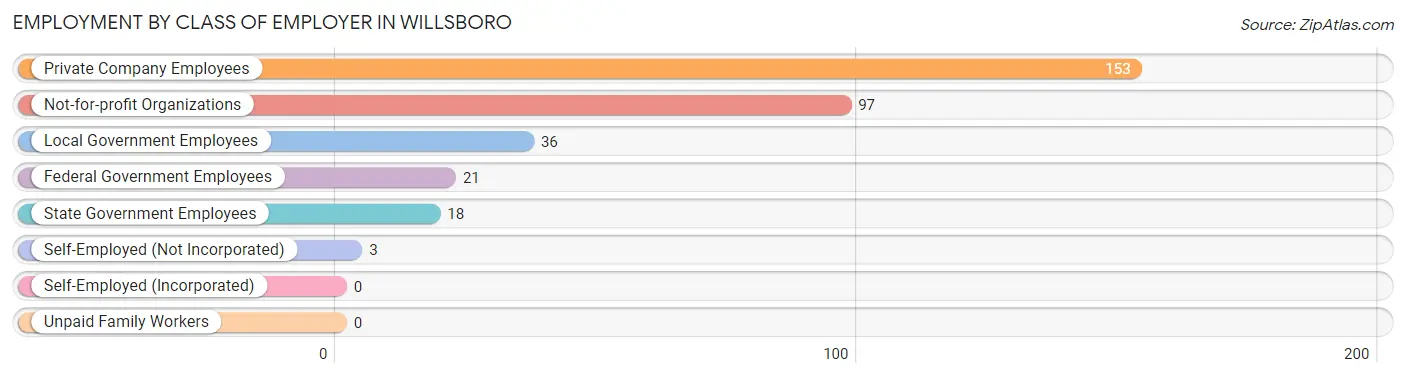
| Employer Class | # Employees | % Employees |
| Private Company Employees | 153 | 46.7% |
| Self-Employed (Incorporated) | 0 | 0.0% |
| Self-Employed (Not Incorporated) | 3 | 0.9% |
| Not-for-profit Organizations | 97 | 29.6% |
| Local Government Employees | 36 | 11.0% |
| State Government Employees | 18 | 5.5% |
| Federal Government Employees | 21 | 6.4% |
| Unpaid Family Workers | 0 | 0.0% |
| Total | 328 | 100.0% |
Employment Status by Age in Willsboro
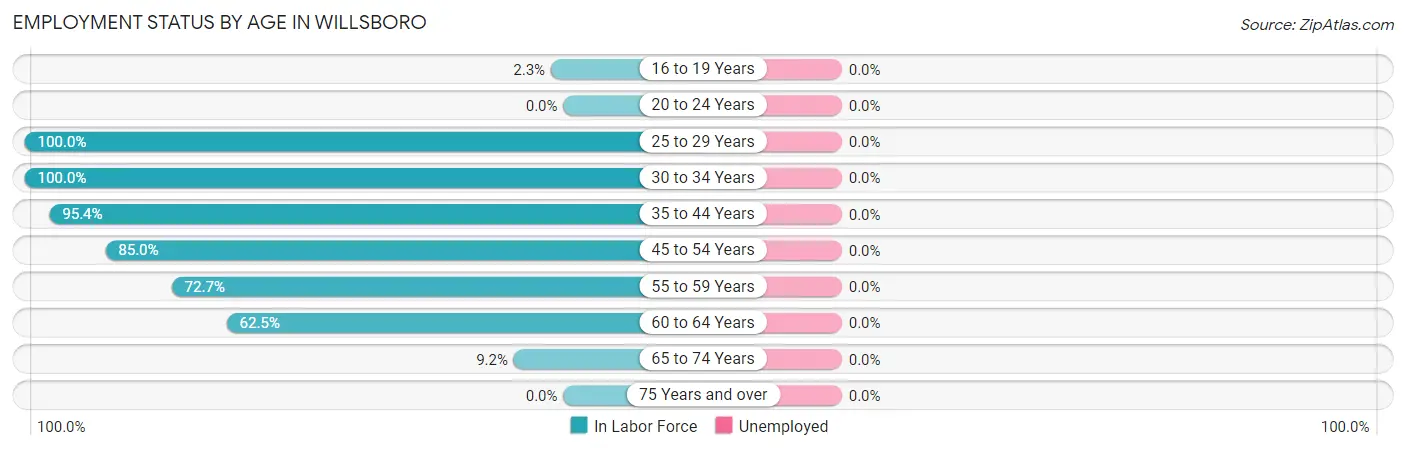
| Age Bracket | In Labor Force | Unemployed |
| 16 to 19 Years | 1 (2.3%) | 0 (0.0%) |
| 20 to 24 Years | 0 (0.0%) | 0 (0.0%) |
| 25 to 29 Years | 39 (100.0%) | 0 (0.0%) |
| 30 to 34 Years | 26 (100.0%) | 0 (0.0%) |
| 35 to 44 Years | 104 (95.4%) | 0 (0.0%) |
| 45 to 54 Years | 113 (85.0%) | 0 (0.0%) |
| 55 to 59 Years | 16 (72.7%) | 0 (0.0%) |
| 60 to 64 Years | 20 (62.5%) | 0 (0.0%) |
| 65 to 74 Years | 9 (9.2%) | 0 (0.0%) |
| 75 Years and over | 0 (0.0%) | 0 (0.0%) |
| Total | 328 (53.9%) | 0 (0.0%) |
Employment Status by Educational Attainment in Willsboro
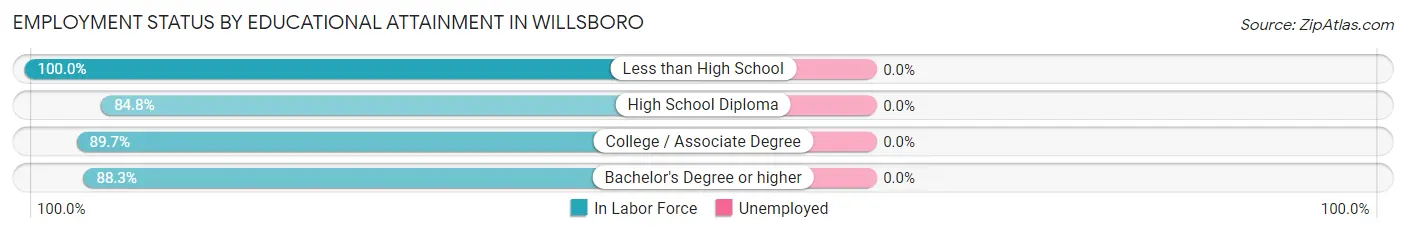
| Educational Attainment | In Labor Force | Unemployed |
| Less than High School | 12 (100.0%) | 0 (0.0%) |
| High School Diploma | 95 (84.8%) | 0 (0.0%) |
| College / Associate Degree | 105 (89.7%) | 0 (0.0%) |
| Bachelor's Degree or higher | 106 (88.3%) | 0 (0.0%) |
| Total | 318 (88.1%) | 0 (0.0%) |
Employment Occupations by Sex in Willsboro
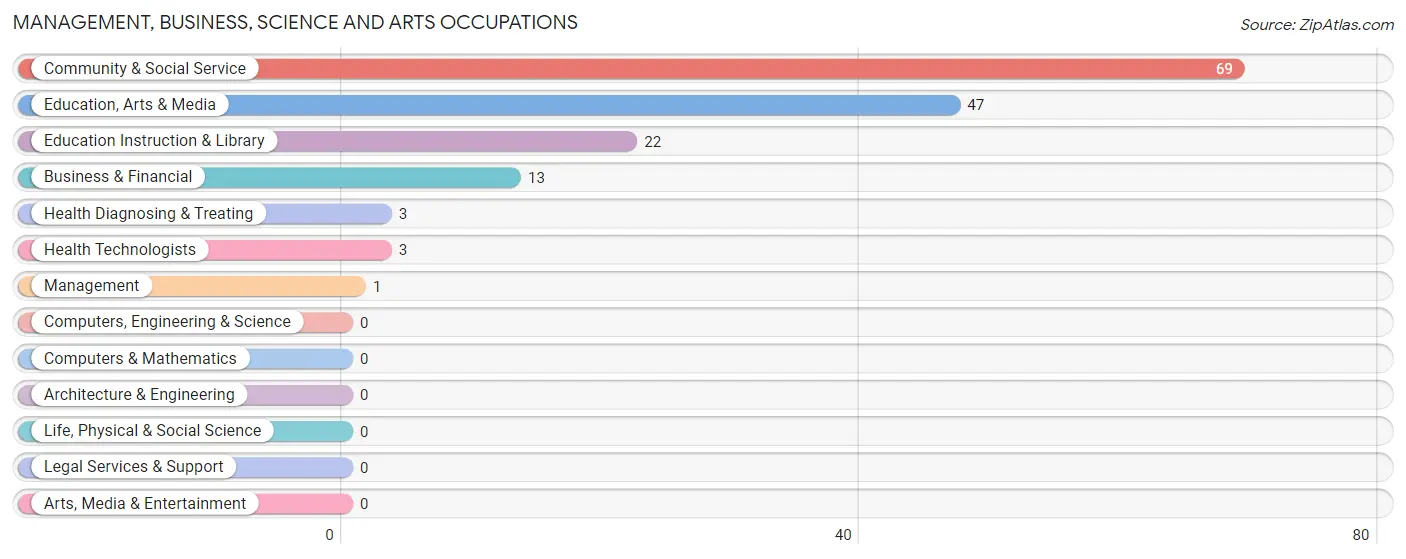
Management, Business, Science and Arts Occupations
The most common Management, Business, Science and Arts occupations in Willsboro are Community & Social Service (69 | 21.0%), Education, Arts & Media (47 | 14.3%), Education Instruction & Library (22 | 6.7%), Business & Financial (13 | 4.0%), and Health Diagnosing & Treating (3 | 0.9%).
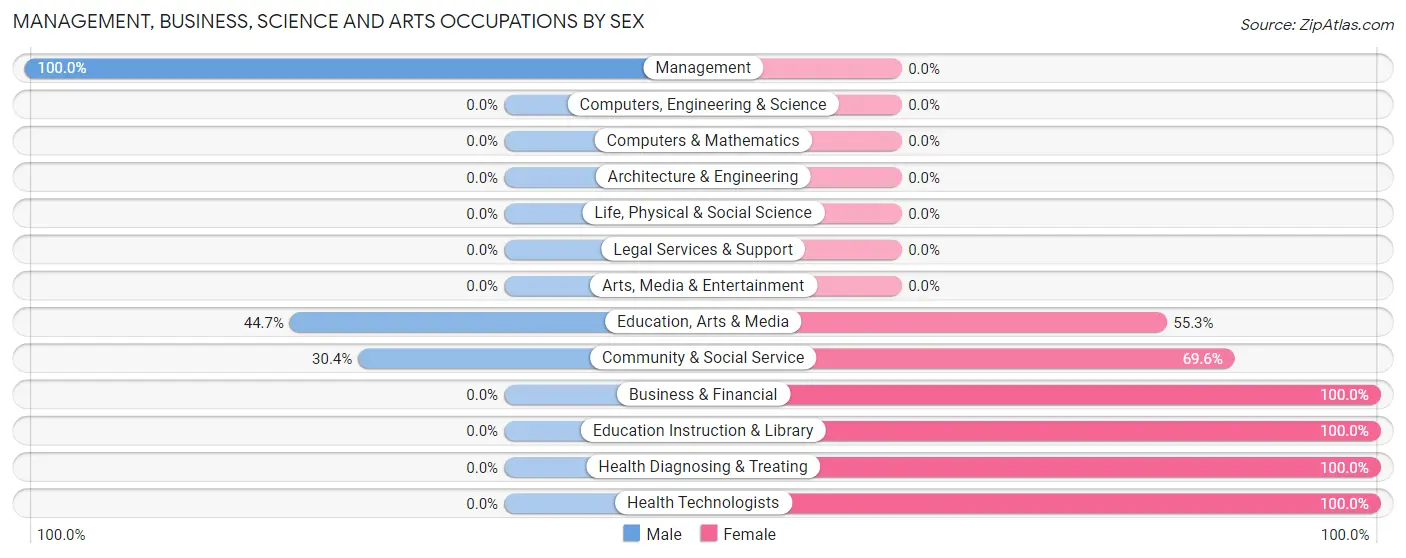
Management, Business, Science and Arts Occupations by Sex
Within the Management, Business, Science and Arts occupations in Willsboro, the most male-oriented occupations are Management (100.0%), Education, Arts & Media (44.7%), and Community & Social Service (30.4%), while the most female-oriented occupations are Business & Financial (100.0%), Education Instruction & Library (100.0%), and Health Diagnosing & Treating (100.0%).
| Occupation | Male | Female |
| Management | 1 (100.0%) | 0 (0.0%) |
| Business & Financial | 0 (0.0%) | 13 (100.0%) |
| Computers, Engineering & Science | 0 (0.0%) | 0 (0.0%) |
| Computers & Mathematics | 0 (0.0%) | 0 (0.0%) |
| Architecture & Engineering | 0 (0.0%) | 0 (0.0%) |
| Life, Physical & Social Science | 0 (0.0%) | 0 (0.0%) |
| Community & Social Service | 21 (30.4%) | 48 (69.6%) |
| Education, Arts & Media | 21 (44.7%) | 26 (55.3%) |
| Legal Services & Support | 0 (0.0%) | 0 (0.0%) |
| Education Instruction & Library | 0 (0.0%) | 22 (100.0%) |
| Arts, Media & Entertainment | 0 (0.0%) | 0 (0.0%) |
| Health Diagnosing & Treating | 0 (0.0%) | 3 (100.0%) |
| Health Technologists | 0 (0.0%) | 3 (100.0%) |
| Total (Category) | 22 (25.6%) | 64 (74.4%) |
| Total (Overall) | 143 (43.6%) | 185 (56.4%) |
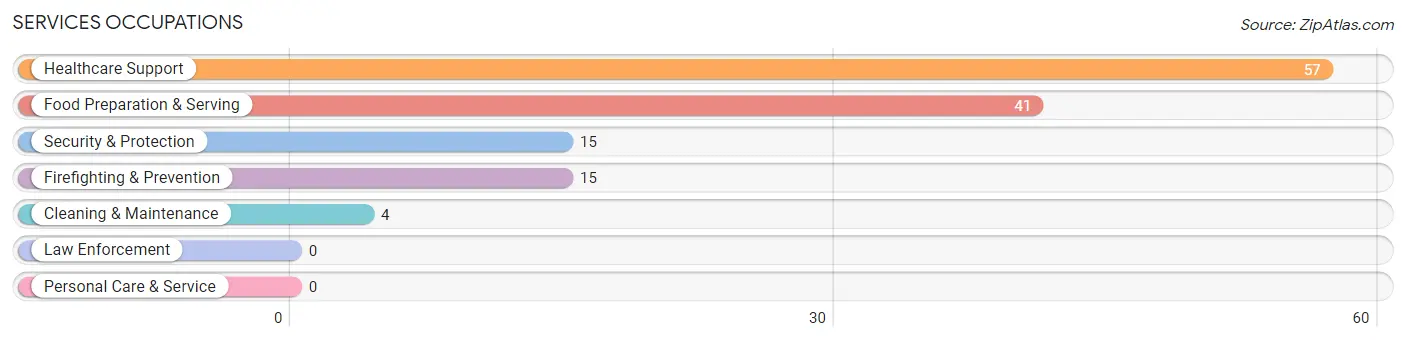
Services Occupations
The most common Services occupations in Willsboro are Healthcare Support (57 | 17.4%), Food Preparation & Serving (41 | 12.5%), Security & Protection (15 | 4.6%), Firefighting & Prevention (15 | 4.6%), and Cleaning & Maintenance (4 | 1.2%).
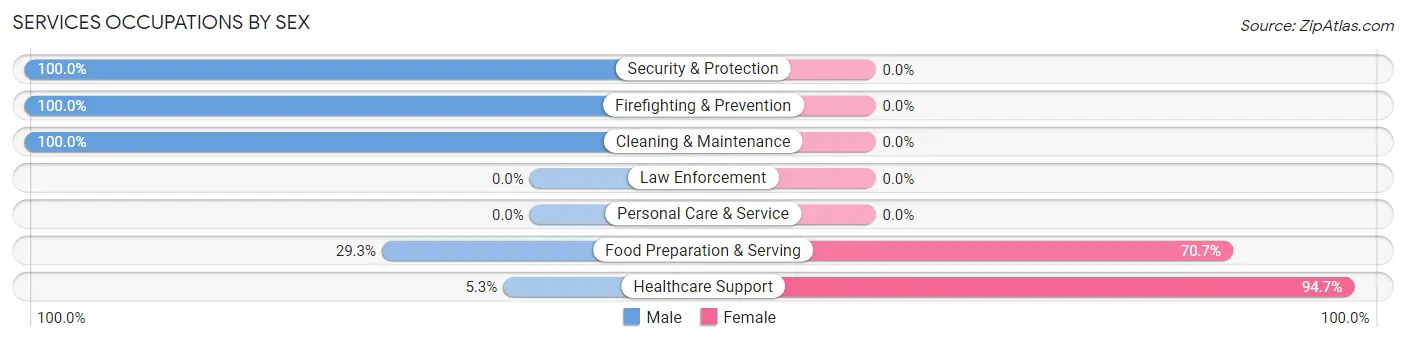
Services Occupations by Sex
Within the Services occupations in Willsboro, the most male-oriented occupations are Security & Protection (100.0%), Firefighting & Prevention (100.0%), and Cleaning & Maintenance (100.0%), while the most female-oriented occupations are Healthcare Support (94.7%), and Food Preparation & Serving (70.7%).
| Occupation | Male | Female |
| Healthcare Support | 3 (5.3%) | 54 (94.7%) |
| Security & Protection | 15 (100.0%) | 0 (0.0%) |
| Firefighting & Prevention | 15 (100.0%) | 0 (0.0%) |
| Law Enforcement | 0 (0.0%) | 0 (0.0%) |
| Food Preparation & Serving | 12 (29.3%) | 29 (70.7%) |
| Cleaning & Maintenance | 4 (100.0%) | 0 (0.0%) |
| Personal Care & Service | 0 (0.0%) | 0 (0.0%) |
| Total (Category) | 34 (29.1%) | 83 (70.9%) |
| Total (Overall) | 143 (43.6%) | 185 (56.4%) |
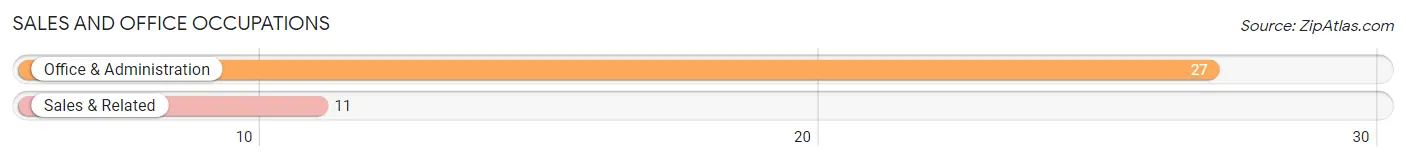
Sales and Office Occupations
The most common Sales and Office occupations in Willsboro are Office & Administration (27 | 8.2%), and Sales & Related (11 | 3.4%).
Sales and Office Occupations by Sex
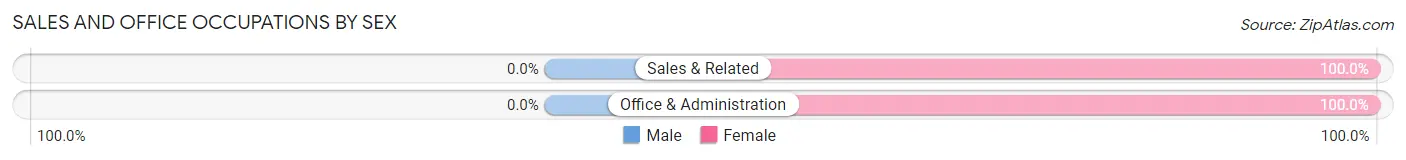
| Occupation | Male | Female |
| Sales & Related | 0 (0.0%) | 11 (100.0%) |
| Office & Administration | 0 (0.0%) | 27 (100.0%) |
| Total (Category) | 0 (0.0%) | 38 (100.0%) |
| Total (Overall) | 143 (43.6%) | 185 (56.4%) |
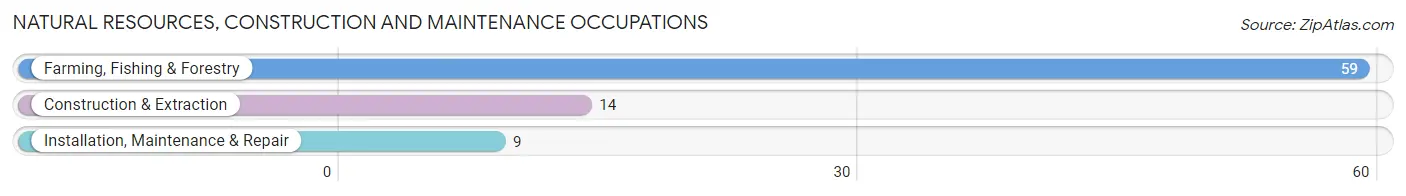
Natural Resources, Construction and Maintenance Occupations
The most common Natural Resources, Construction and Maintenance occupations in Willsboro are Farming, Fishing & Forestry (59 | 18.0%), Construction & Extraction (14 | 4.3%), and Installation, Maintenance & Repair (9 | 2.7%).
Natural Resources, Construction and Maintenance Occupations by Sex
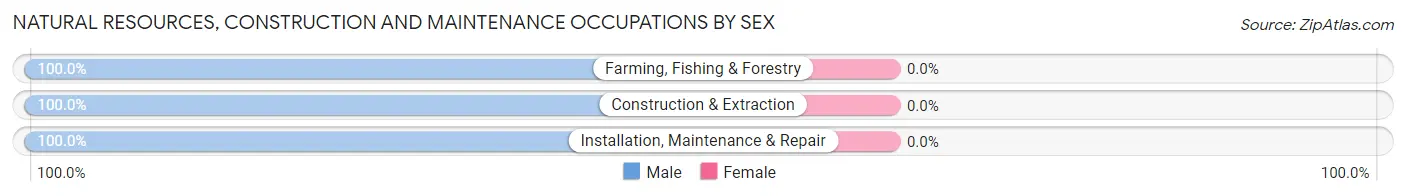
| Occupation | Male | Female |
| Farming, Fishing & Forestry | 59 (100.0%) | 0 (0.0%) |
| Construction & Extraction | 14 (100.0%) | 0 (0.0%) |
| Installation, Maintenance & Repair | 9 (100.0%) | 0 (0.0%) |
| Total (Category) | 82 (100.0%) | 0 (0.0%) |
| Total (Overall) | 143 (43.6%) | 185 (56.4%) |
Production, Transportation and Moving Occupations
The most common Production, Transportation and Moving occupations in Willsboro are , and Production (5 | 1.5%).
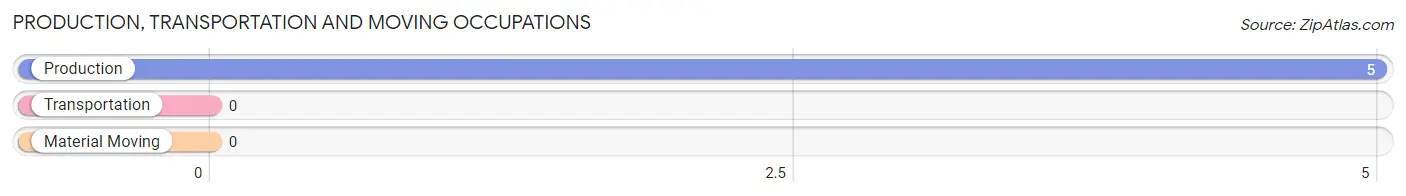
Production, Transportation and Moving Occupations by Sex
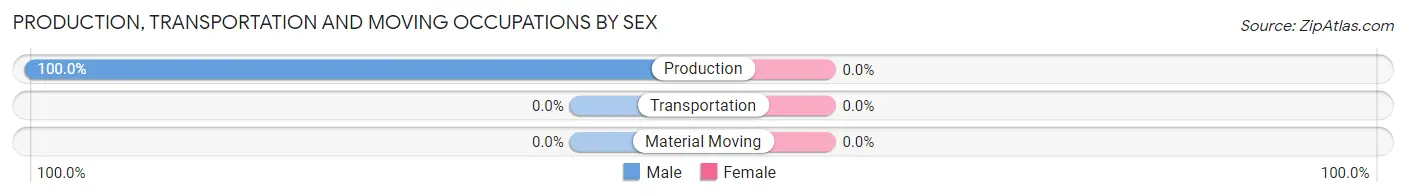
| Occupation | Male | Female |
| Production | 5 (100.0%) | 0 (0.0%) |
| Transportation | 0 (0.0%) | 0 (0.0%) |
| Material Moving | 0 (0.0%) | 0 (0.0%) |
| Total (Category) | 5 (100.0%) | 0 (0.0%) |
| Total (Overall) | 143 (43.6%) | 185 (56.4%) |
Employment Industries by Sex in Willsboro
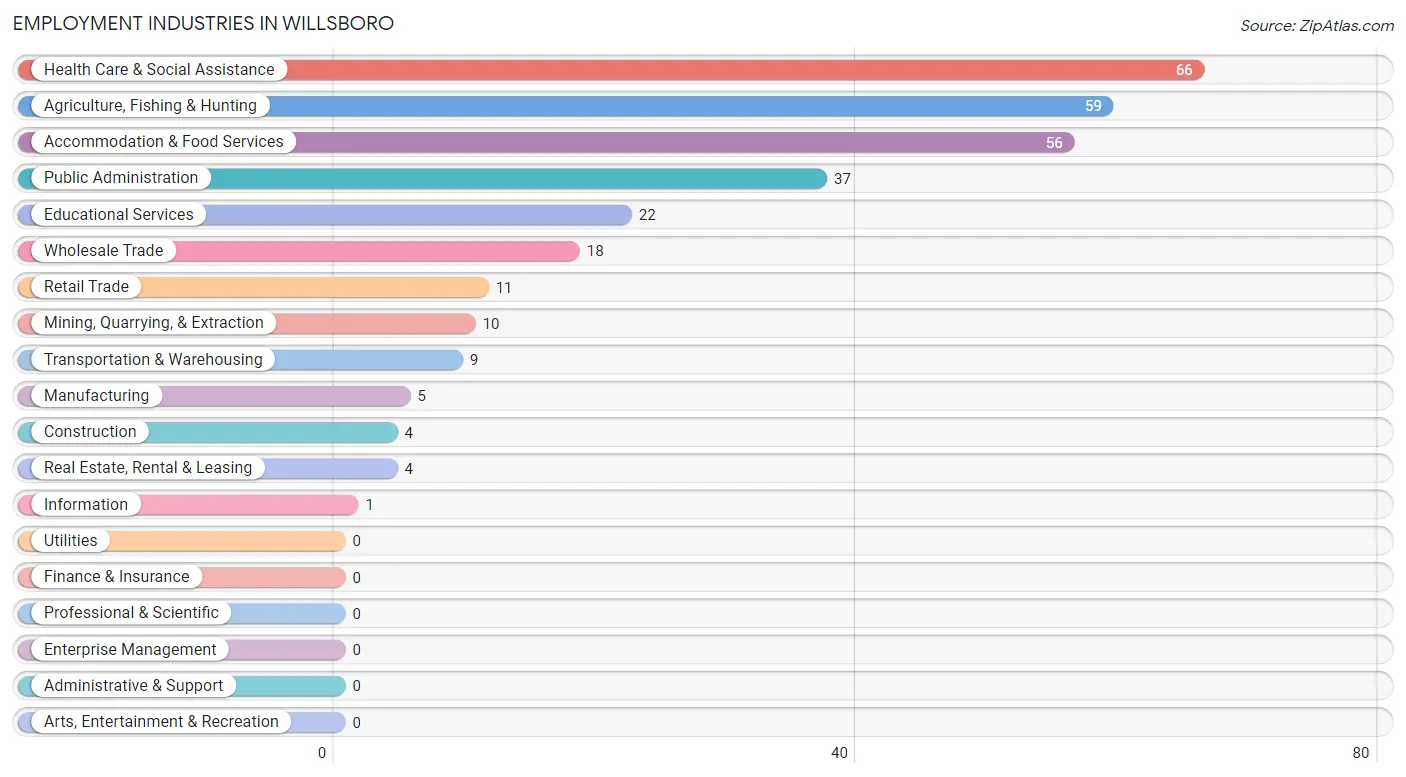
Employment Industries in Willsboro
The major employment industries in Willsboro include Health Care & Social Assistance (66 | 20.1%), Agriculture, Fishing & Hunting (59 | 18.0%), Accommodation & Food Services (56 | 17.1%), Public Administration (37 | 11.3%), and Educational Services (22 | 6.7%).
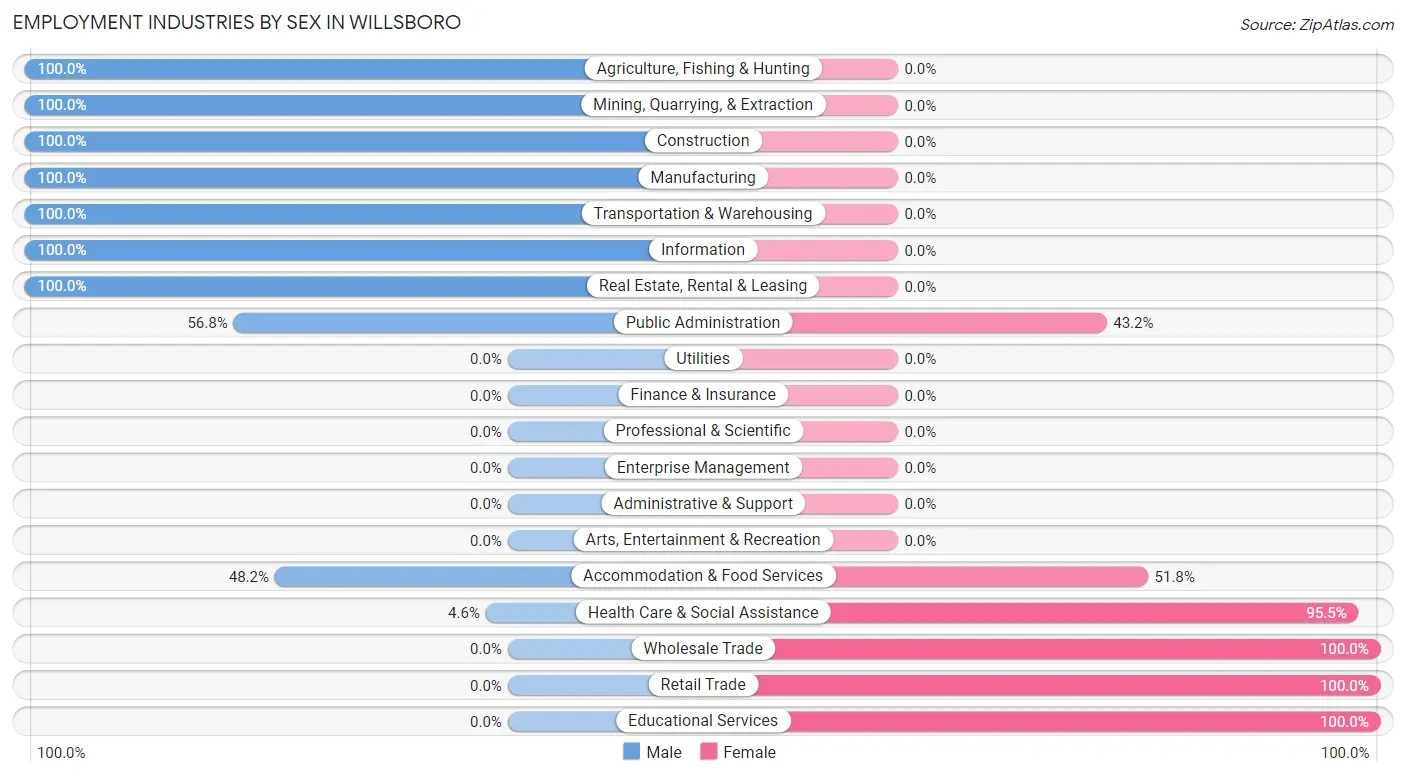
Employment Industries by Sex in Willsboro
The Willsboro industries that see more men than women are Agriculture, Fishing & Hunting (100.0%), Mining, Quarrying, & Extraction (100.0%), and Construction (100.0%), whereas the industries that tend to have a higher number of women are Wholesale Trade (100.0%), Retail Trade (100.0%), and Educational Services (100.0%).
| Industry | Male | Female |
| Agriculture, Fishing & Hunting | 59 (100.0%) | 0 (0.0%) |
| Mining, Quarrying, & Extraction | 10 (100.0%) | 0 (0.0%) |
| Construction | 4 (100.0%) | 0 (0.0%) |
| Manufacturing | 5 (100.0%) | 0 (0.0%) |
| Wholesale Trade | 0 (0.0%) | 18 (100.0%) |
| Retail Trade | 0 (0.0%) | 11 (100.0%) |
| Transportation & Warehousing | 9 (100.0%) | 0 (0.0%) |
| Utilities | 0 (0.0%) | 0 (0.0%) |
| Information | 1 (100.0%) | 0 (0.0%) |
| Finance & Insurance | 0 (0.0%) | 0 (0.0%) |
| Real Estate, Rental & Leasing | 4 (100.0%) | 0 (0.0%) |
| Professional & Scientific | 0 (0.0%) | 0 (0.0%) |
| Enterprise Management | 0 (0.0%) | 0 (0.0%) |
| Administrative & Support | 0 (0.0%) | 0 (0.0%) |
| Educational Services | 0 (0.0%) | 22 (100.0%) |
| Health Care & Social Assistance | 3 (4.5%) | 63 (95.5%) |
| Arts, Entertainment & Recreation | 0 (0.0%) | 0 (0.0%) |
| Accommodation & Food Services | 27 (48.2%) | 29 (51.8%) |
| Public Administration | 21 (56.8%) | 16 (43.2%) |
| Total | 143 (43.6%) | 185 (56.4%) |
Education in Willsboro
School Enrollment in Willsboro
The most common levels of schooling among the 171 students in Willsboro are elementary school (74 | 43.3%), high school (44 | 25.7%), and middle school (27 | 15.8%).
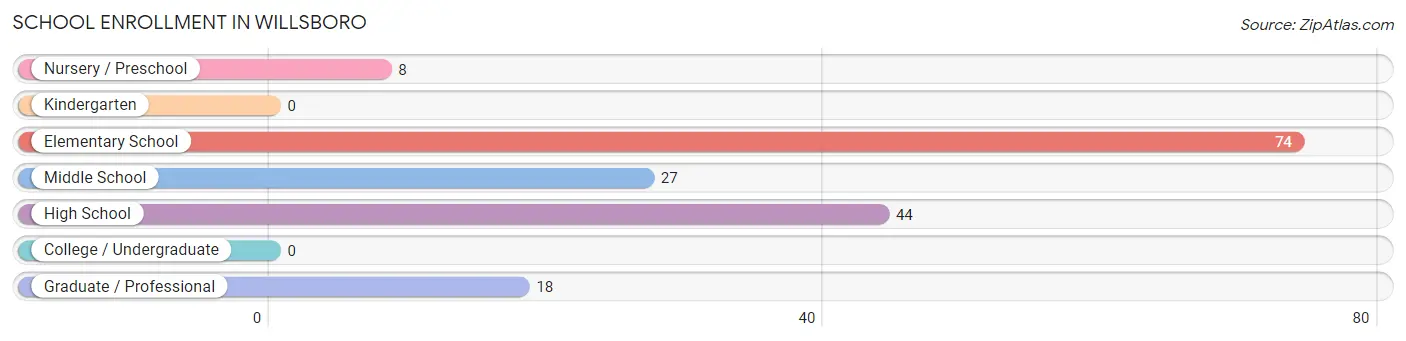
| School Level | # Students | % Students |
| Nursery / Preschool | 8 | 4.7% |
| Kindergarten | 0 | 0.0% |
| Elementary School | 74 | 43.3% |
| Middle School | 27 | 15.8% |
| High School | 44 | 25.7% |
| College / Undergraduate | 0 | 0.0% |
| Graduate / Professional | 18 | 10.5% |
| Total | 171 | 100.0% |
School Enrollment by Age by Funding Source in Willsboro
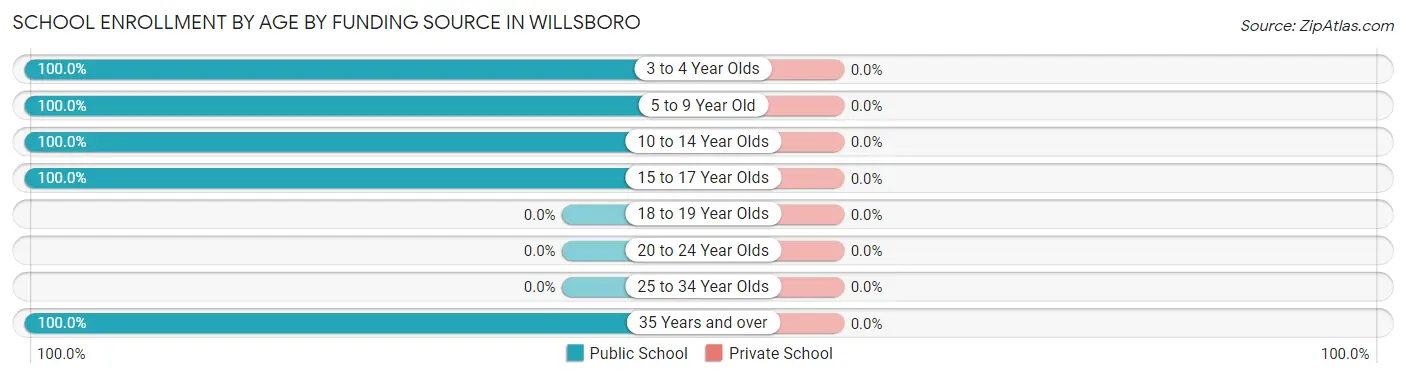
| Age Bracket | Public School | Private School |
| 3 to 4 Year Olds | 8 (100.0%) | 0 (0.0%) |
| 5 to 9 Year Old | 74 (100.0%) | 0 (0.0%) |
| 10 to 14 Year Olds | 27 (100.0%) | 0 (0.0%) |
| 15 to 17 Year Olds | 44 (100.0%) | 0 (0.0%) |
| 18 to 19 Year Olds | 0 (0.0%) | 0 (0.0%) |
| 20 to 24 Year Olds | 0 (0.0%) | 0 (0.0%) |
| 25 to 34 Year Olds | 0 (0.0%) | 0 (0.0%) |
| 35 Years and over | 18 (100.0%) | 0 (0.0%) |
| Total | 171 (100.0%) | 0 (0.0%) |
Educational Attainment by Field of Study in Willsboro
Social sciences (65 | 37.1%), arts & humanities (32 | 18.3%), education (31 | 17.7%), liberal arts & history (19 | 10.9%), and business (15 | 8.6%) are the most common fields of study among 175 individuals in Willsboro who have obtained a bachelor's degree or higher.
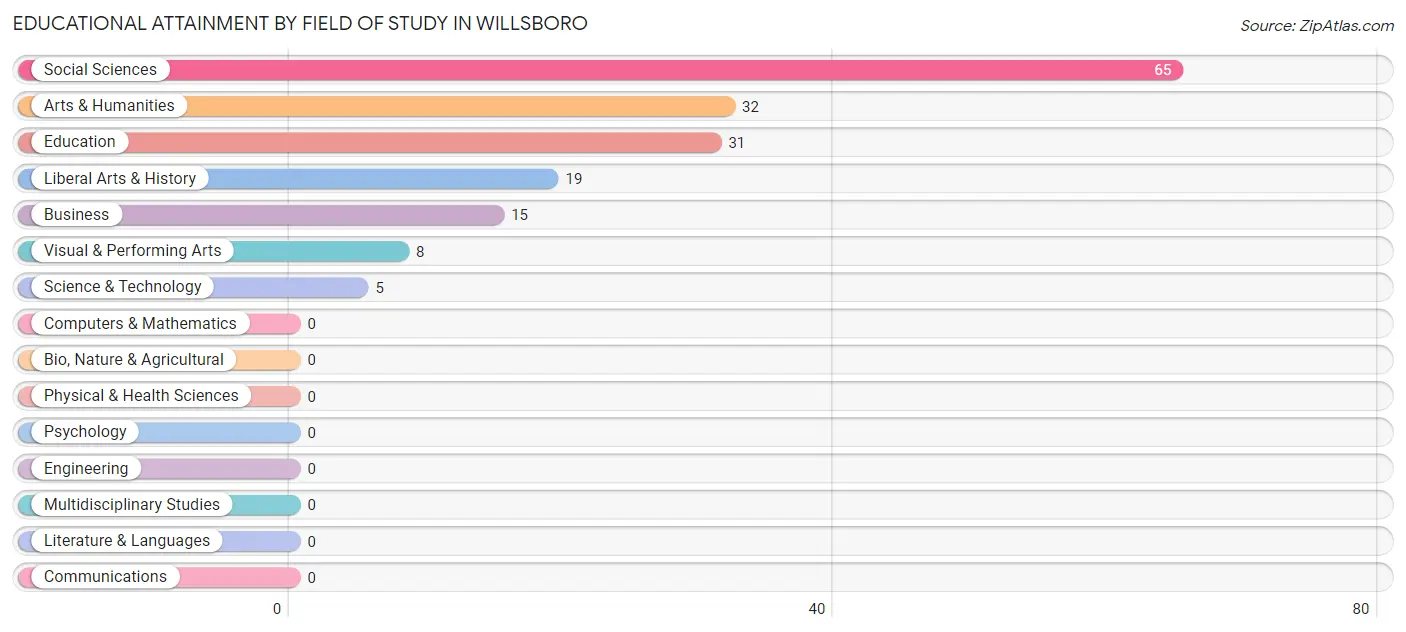
| Field of Study | # Graduates | % Graduates |
| Computers & Mathematics | 0 | 0.0% |
| Bio, Nature & Agricultural | 0 | 0.0% |
| Physical & Health Sciences | 0 | 0.0% |
| Psychology | 0 | 0.0% |
| Social Sciences | 65 | 37.1% |
| Engineering | 0 | 0.0% |
| Multidisciplinary Studies | 0 | 0.0% |
| Science & Technology | 5 | 2.9% |
| Business | 15 | 8.6% |
| Education | 31 | 17.7% |
| Literature & Languages | 0 | 0.0% |
| Liberal Arts & History | 19 | 10.9% |
| Visual & Performing Arts | 8 | 4.6% |
| Communications | 0 | 0.0% |
| Arts & Humanities | 32 | 18.3% |
| Total | 175 | 100.0% |
Transportation & Commute in Willsboro
Vehicle Availability by Sex in Willsboro
The most prevalent vehicle ownership categories in Willsboro are males with 3 vehicles (66, accounting for 46.2%) and females with 3 vehicles (57, making up 35.7%).
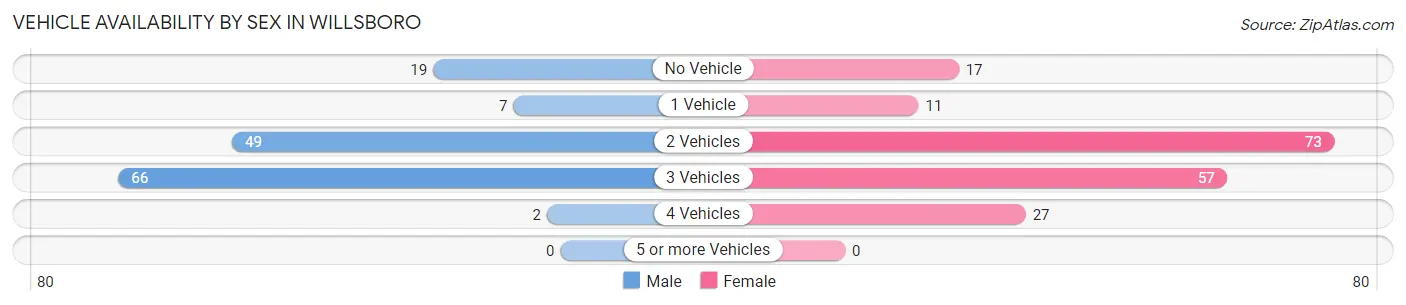
| Vehicles Available | Male | Female |
| No Vehicle | 19 (13.3%) | 17 (9.2%) |
| 1 Vehicle | 7 (4.9%) | 11 (5.9%) |
| 2 Vehicles | 49 (34.3%) | 73 (39.5%) |
| 3 Vehicles | 66 (46.2%) | 57 (30.8%) |
| 4 Vehicles | 2 (1.4%) | 27 (14.6%) |
| 5 or more Vehicles | 0 (0.0%) | 0 (0.0%) |
| Total | 143 (100.0%) | 185 (100.0%) |
Commute Time in Willsboro
The most frequently occuring commute durations in Willsboro are 5 to 9 minutes (117 commuters, 36.2%), 30 to 34 minutes (55 commuters, 17.0%), and 10 to 14 minutes (47 commuters, 14.5%).
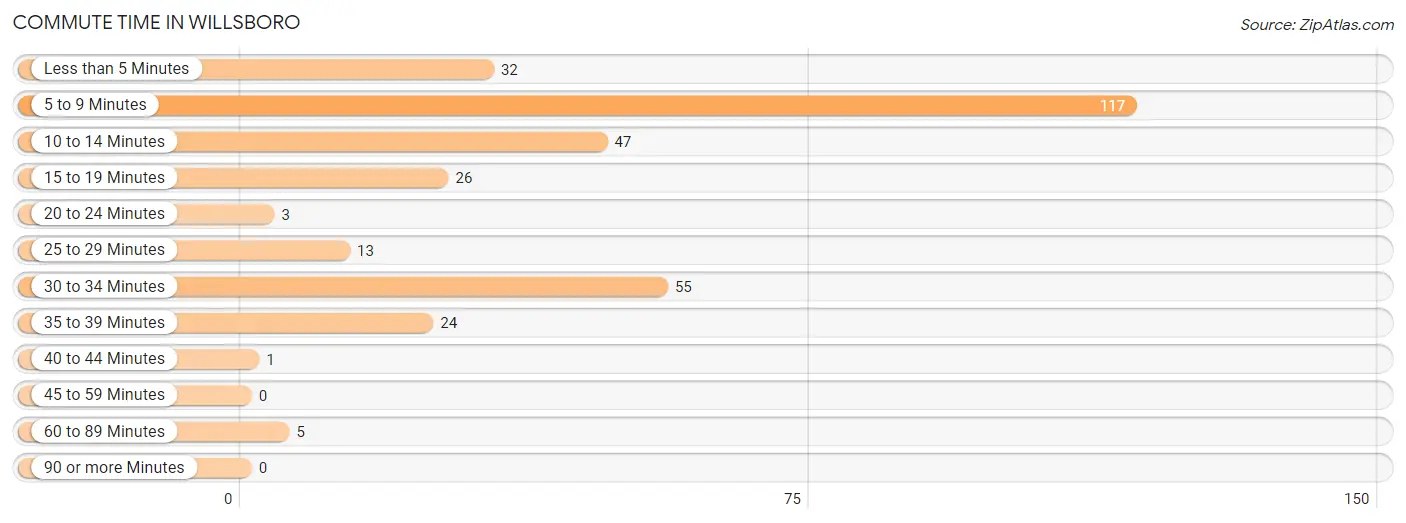
| Commute Time | # Commuters | % Commuters |
| Less than 5 Minutes | 32 | 9.9% |
| 5 to 9 Minutes | 117 | 36.2% |
| 10 to 14 Minutes | 47 | 14.5% |
| 15 to 19 Minutes | 26 | 8.1% |
| 20 to 24 Minutes | 3 | 0.9% |
| 25 to 29 Minutes | 13 | 4.0% |
| 30 to 34 Minutes | 55 | 17.0% |
| 35 to 39 Minutes | 24 | 7.4% |
| 40 to 44 Minutes | 1 | 0.3% |
| 45 to 59 Minutes | 0 | 0.0% |
| 60 to 89 Minutes | 5 | 1.5% |
| 90 or more Minutes | 0 | 0.0% |
Commute Time by Sex in Willsboro
The most common commute times in Willsboro are 5 to 9 minutes (78 commuters, 54.5%) for males and 10 to 14 minutes (47 commuters, 26.1%) for females.
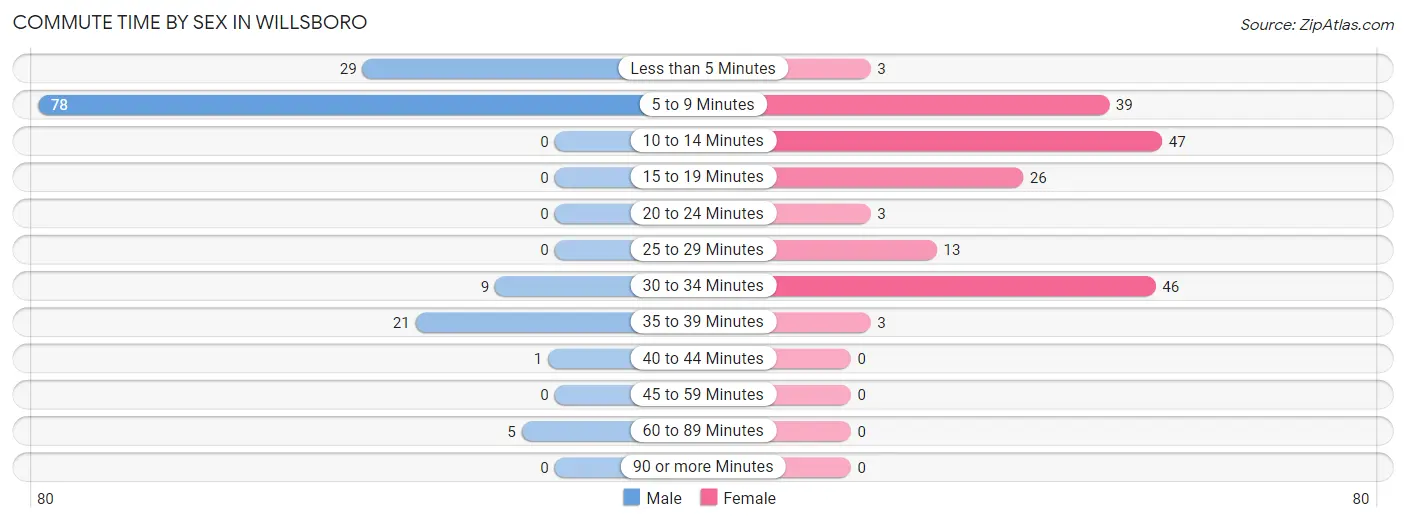
| Commute Time | Male | Female |
| Less than 5 Minutes | 29 (20.3%) | 3 (1.7%) |
| 5 to 9 Minutes | 78 (54.5%) | 39 (21.7%) |
| 10 to 14 Minutes | 0 (0.0%) | 47 (26.1%) |
| 15 to 19 Minutes | 0 (0.0%) | 26 (14.4%) |
| 20 to 24 Minutes | 0 (0.0%) | 3 (1.7%) |
| 25 to 29 Minutes | 0 (0.0%) | 13 (7.2%) |
| 30 to 34 Minutes | 9 (6.3%) | 46 (25.6%) |
| 35 to 39 Minutes | 21 (14.7%) | 3 (1.7%) |
| 40 to 44 Minutes | 1 (0.7%) | 0 (0.0%) |
| 45 to 59 Minutes | 0 (0.0%) | 0 (0.0%) |
| 60 to 89 Minutes | 5 (3.5%) | 0 (0.0%) |
| 90 or more Minutes | 0 (0.0%) | 0 (0.0%) |
Time of Departure to Work by Sex in Willsboro
The most frequent times of departure to work in Willsboro are 4:00 PM to 11:59 PM (66, 46.2%) for males and 6:30 AM to 6:59 AM (80, 44.4%) for females.
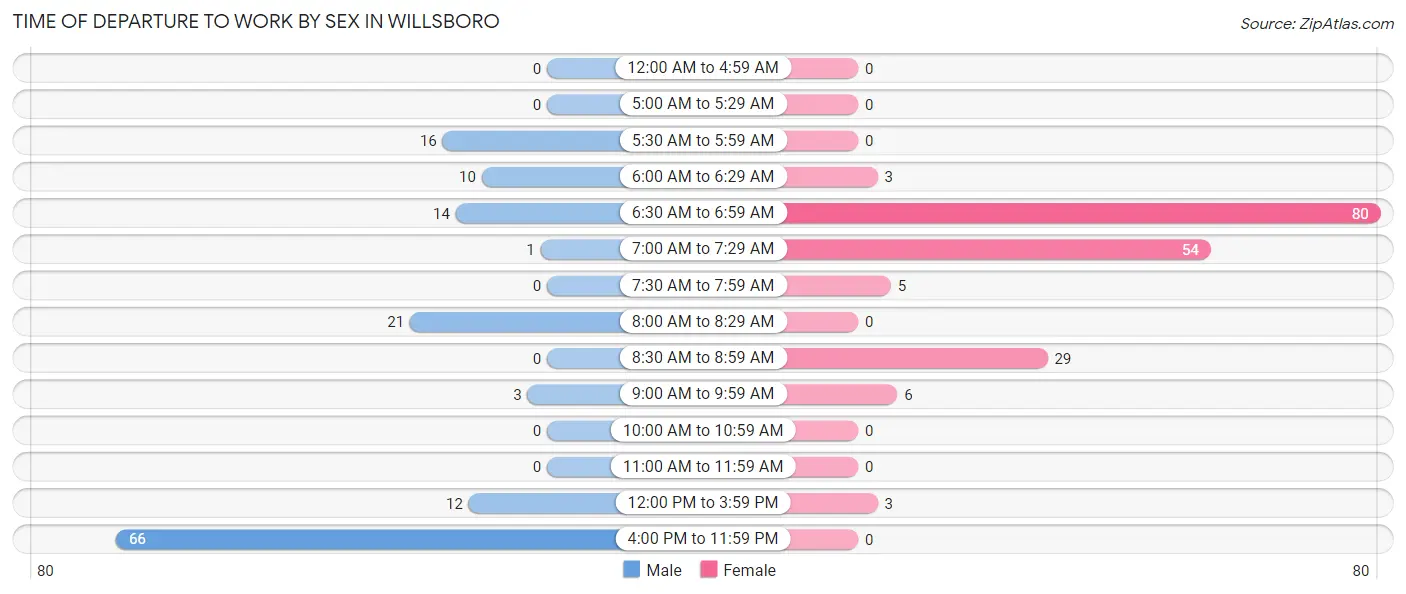
| Time of Departure | Male | Female |
| 12:00 AM to 4:59 AM | 0 (0.0%) | 0 (0.0%) |
| 5:00 AM to 5:29 AM | 0 (0.0%) | 0 (0.0%) |
| 5:30 AM to 5:59 AM | 16 (11.2%) | 0 (0.0%) |
| 6:00 AM to 6:29 AM | 10 (7.0%) | 3 (1.7%) |
| 6:30 AM to 6:59 AM | 14 (9.8%) | 80 (44.4%) |
| 7:00 AM to 7:29 AM | 1 (0.7%) | 54 (30.0%) |
| 7:30 AM to 7:59 AM | 0 (0.0%) | 5 (2.8%) |
| 8:00 AM to 8:29 AM | 21 (14.7%) | 0 (0.0%) |
| 8:30 AM to 8:59 AM | 0 (0.0%) | 29 (16.1%) |
| 9:00 AM to 9:59 AM | 3 (2.1%) | 6 (3.3%) |
| 10:00 AM to 10:59 AM | 0 (0.0%) | 0 (0.0%) |
| 11:00 AM to 11:59 AM | 0 (0.0%) | 0 (0.0%) |
| 12:00 PM to 3:59 PM | 12 (8.4%) | 3 (1.7%) |
| 4:00 PM to 11:59 PM | 66 (46.2%) | 0 (0.0%) |
| Total | 143 (100.0%) | 180 (100.0%) |
Housing Occupancy in Willsboro
Occupancy by Ownership in Willsboro
Of the total 254 dwellings in Willsboro, owner-occupied units account for 186 (73.2%), while renter-occupied units make up 68 (26.8%).
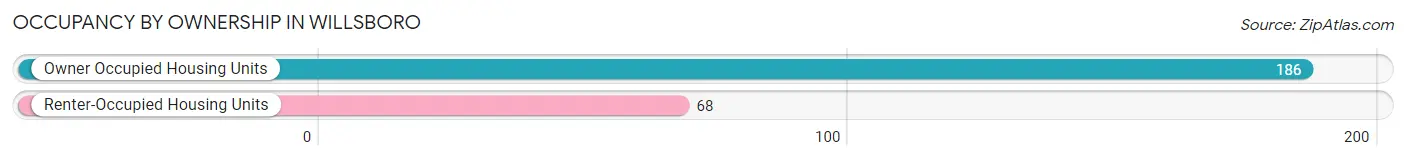
| Occupancy | # Housing Units | % Housing Units |
| Owner Occupied Housing Units | 186 | 73.2% |
| Renter-Occupied Housing Units | 68 | 26.8% |
| Total Occupied Housing Units | 254 | 100.0% |
Occupancy by Household Size in Willsboro
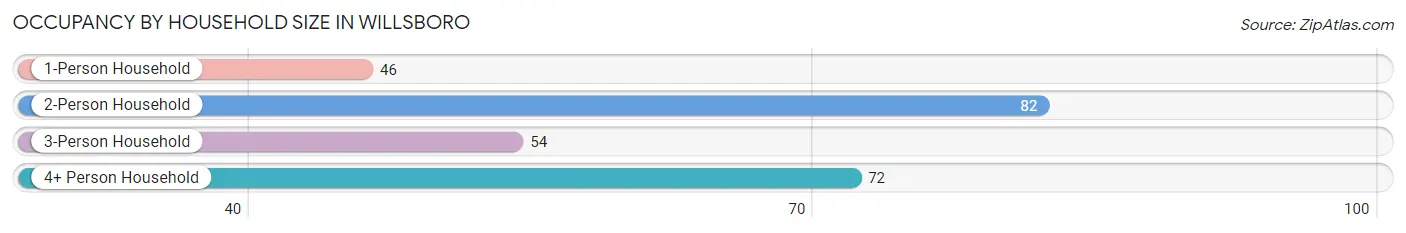
| Household Size | # Housing Units | % Housing Units |
| 1-Person Household | 46 | 18.1% |
| 2-Person Household | 82 | 32.3% |
| 3-Person Household | 54 | 21.3% |
| 4+ Person Household | 72 | 28.3% |
| Total Housing Units | 254 | 100.0% |
Occupancy by Ownership by Household Size in Willsboro
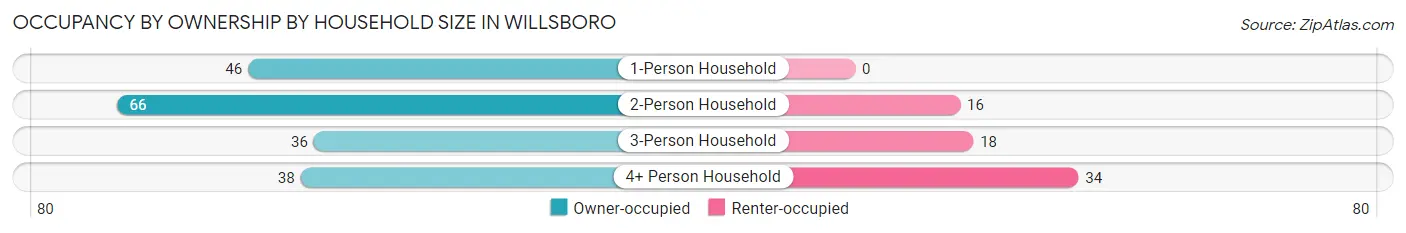
| Household Size | Owner-occupied | Renter-occupied |
| 1-Person Household | 46 (100.0%) | 0 (0.0%) |
| 2-Person Household | 66 (80.5%) | 16 (19.5%) |
| 3-Person Household | 36 (66.7%) | 18 (33.3%) |
| 4+ Person Household | 38 (52.8%) | 34 (47.2%) |
| Total Housing Units | 186 (73.2%) | 68 (26.8%) |
Occupancy by Educational Attainment in Willsboro
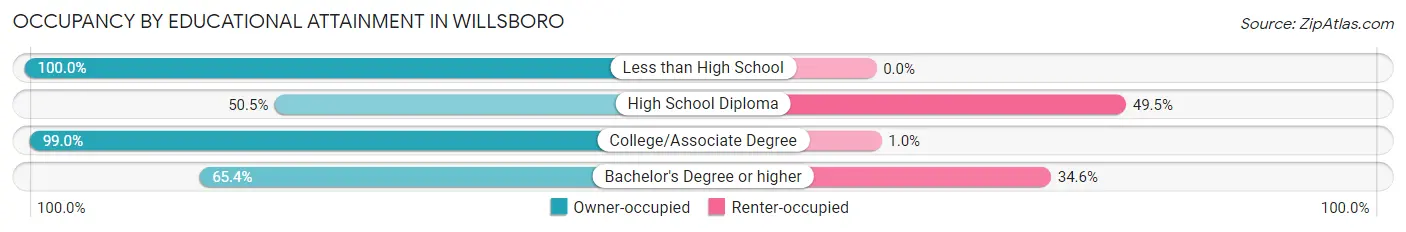
| Household Size | Owner-occupied | Renter-occupied |
| Less than High School | 6 (100.0%) | 0 (0.0%) |
| High School Diploma | 50 (50.5%) | 49 (49.5%) |
| College/Associate Degree | 96 (99.0%) | 1 (1.0%) |
| Bachelor's Degree or higher | 34 (65.4%) | 18 (34.6%) |
Occupancy by Age of Householder in Willsboro
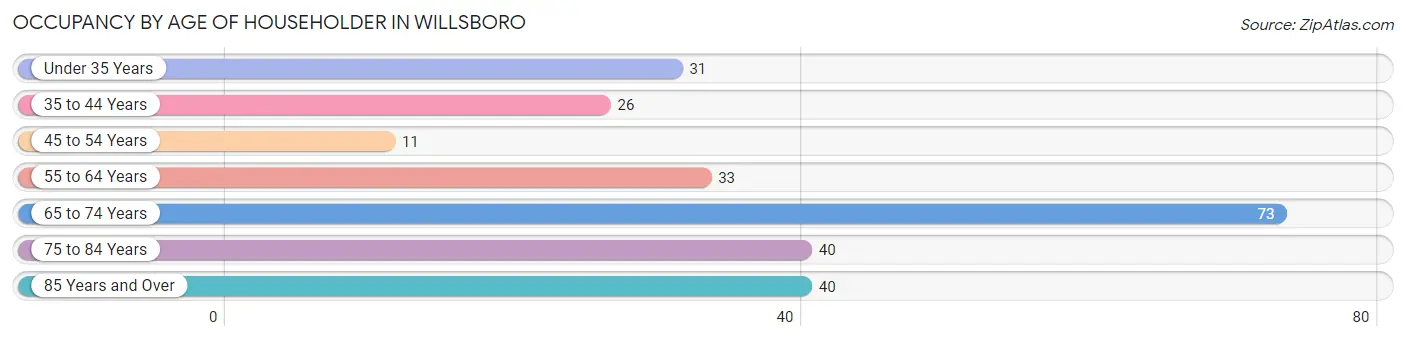
| Age Bracket | # Households | % Households |
| Under 35 Years | 31 | 12.2% |
| 35 to 44 Years | 26 | 10.2% |
| 45 to 54 Years | 11 | 4.3% |
| 55 to 64 Years | 33 | 13.0% |
| 65 to 74 Years | 73 | 28.7% |
| 75 to 84 Years | 40 | 15.8% |
| 85 Years and Over | 40 | 15.8% |
| Total | 254 | 100.0% |
Housing Finances in Willsboro
Median Income by Occupancy in Willsboro
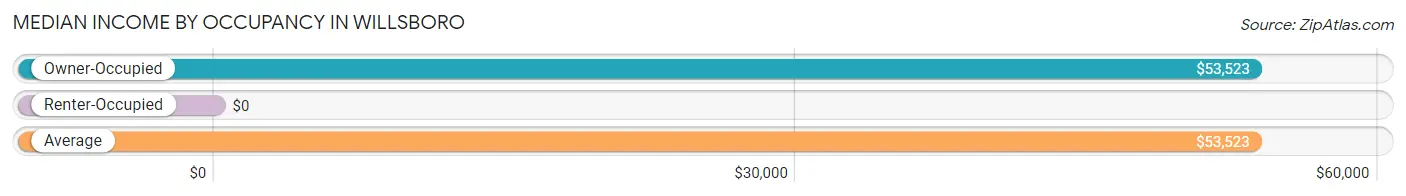
| Occupancy Type | # Households | Median Income |
| Owner-Occupied | 186 (73.2%) | $53,523 |
| Renter-Occupied | 68 (26.8%) | $0 |
| Average | 254 (100.0%) | $53,523 |
Occupancy by Householder Income Bracket in Willsboro
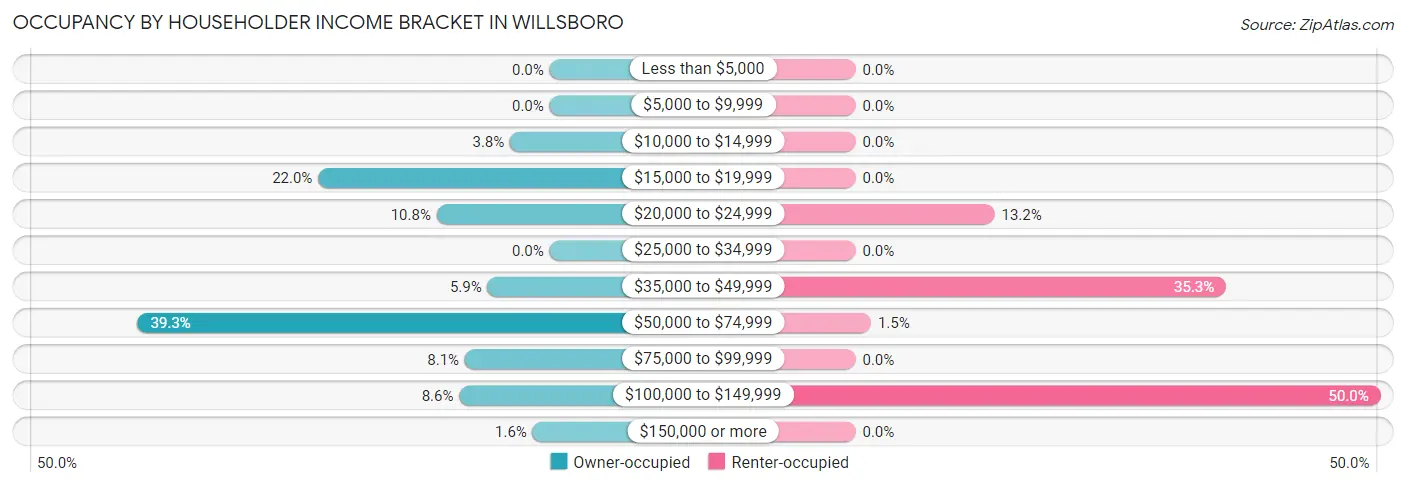
| Income Bracket | Owner-occupied | Renter-occupied |
| Less than $5,000 | 0 (0.0%) | 0 (0.0%) |
| $5,000 to $9,999 | 0 (0.0%) | 0 (0.0%) |
| $10,000 to $14,999 | 7 (3.8%) | 0 (0.0%) |
| $15,000 to $19,999 | 41 (22.0%) | 0 (0.0%) |
| $20,000 to $24,999 | 20 (10.7%) | 9 (13.2%) |
| $25,000 to $34,999 | 0 (0.0%) | 0 (0.0%) |
| $35,000 to $49,999 | 11 (5.9%) | 24 (35.3%) |
| $50,000 to $74,999 | 73 (39.3%) | 1 (1.5%) |
| $75,000 to $99,999 | 15 (8.1%) | 0 (0.0%) |
| $100,000 to $149,999 | 16 (8.6%) | 34 (50.0%) |
| $150,000 or more | 3 (1.6%) | 0 (0.0%) |
| Total | 186 (100.0%) | 68 (100.0%) |
Monthly Housing Cost Tiers in Willsboro
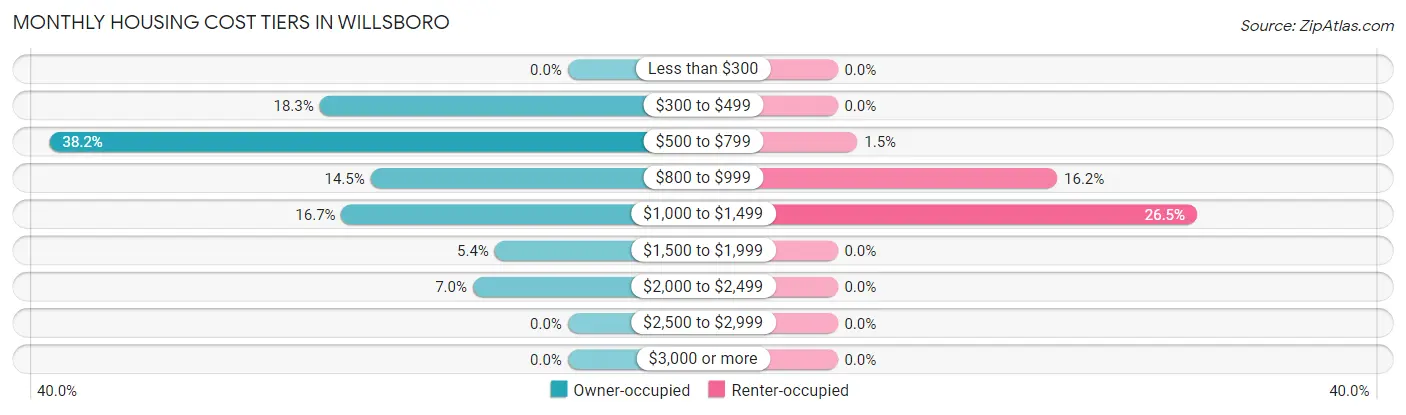
| Monthly Cost | Owner-occupied | Renter-occupied |
| Less than $300 | 0 (0.0%) | 0 (0.0%) |
| $300 to $499 | 34 (18.3%) | 0 (0.0%) |
| $500 to $799 | 71 (38.2%) | 1 (1.5%) |
| $800 to $999 | 27 (14.5%) | 11 (16.2%) |
| $1,000 to $1,499 | 31 (16.7%) | 18 (26.5%) |
| $1,500 to $1,999 | 10 (5.4%) | 0 (0.0%) |
| $2,000 to $2,499 | 13 (7.0%) | 0 (0.0%) |
| $2,500 to $2,999 | 0 (0.0%) | 0 (0.0%) |
| $3,000 or more | 0 (0.0%) | 0 (0.0%) |
| Total | 186 (100.0%) | 68 (100.0%) |
Physical Housing Characteristics in Willsboro
Housing Structures in Willsboro
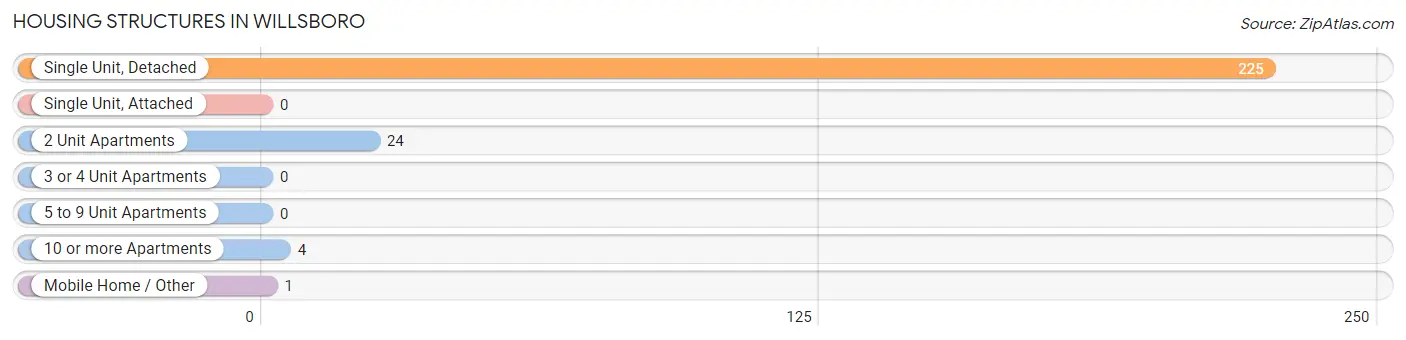
| Structure Type | # Housing Units | % Housing Units |
| Single Unit, Detached | 225 | 88.6% |
| Single Unit, Attached | 0 | 0.0% |
| 2 Unit Apartments | 24 | 9.5% |
| 3 or 4 Unit Apartments | 0 | 0.0% |
| 5 to 9 Unit Apartments | 0 | 0.0% |
| 10 or more Apartments | 4 | 1.6% |
| Mobile Home / Other | 1 | 0.4% |
| Total | 254 | 100.0% |
Housing Structures by Occupancy in Willsboro
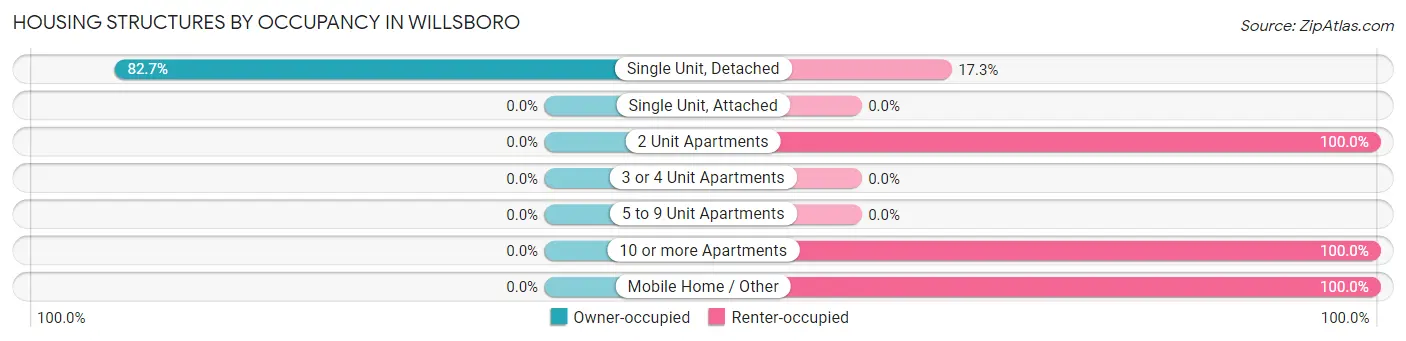
| Structure Type | Owner-occupied | Renter-occupied |
| Single Unit, Detached | 186 (82.7%) | 39 (17.3%) |
| Single Unit, Attached | 0 (0.0%) | 0 (0.0%) |
| 2 Unit Apartments | 0 (0.0%) | 24 (100.0%) |
| 3 or 4 Unit Apartments | 0 (0.0%) | 0 (0.0%) |
| 5 to 9 Unit Apartments | 0 (0.0%) | 0 (0.0%) |
| 10 or more Apartments | 0 (0.0%) | 4 (100.0%) |
| Mobile Home / Other | 0 (0.0%) | 1 (100.0%) |
| Total | 186 (73.2%) | 68 (26.8%) |
Housing Structures by Number of Rooms in Willsboro
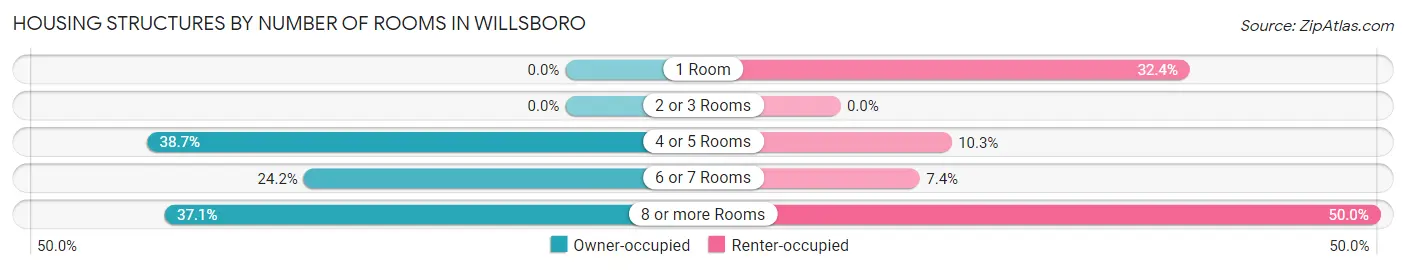
| Number of Rooms | Owner-occupied | Renter-occupied |
| 1 Room | 0 (0.0%) | 22 (32.4%) |
| 2 or 3 Rooms | 0 (0.0%) | 0 (0.0%) |
| 4 or 5 Rooms | 72 (38.7%) | 7 (10.3%) |
| 6 or 7 Rooms | 45 (24.2%) | 5 (7.3%) |
| 8 or more Rooms | 69 (37.1%) | 34 (50.0%) |
| Total | 186 (100.0%) | 68 (100.0%) |
Housing Structure by Heating Type in Willsboro
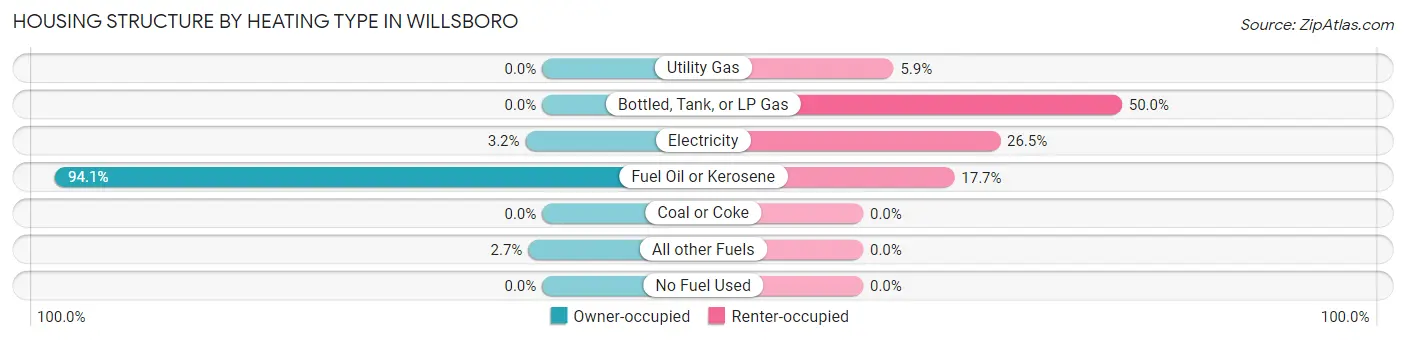
| Heating Type | Owner-occupied | Renter-occupied |
| Utility Gas | 0 (0.0%) | 4 (5.9%) |
| Bottled, Tank, or LP Gas | 0 (0.0%) | 34 (50.0%) |
| Electricity | 6 (3.2%) | 18 (26.5%) |
| Fuel Oil or Kerosene | 175 (94.1%) | 12 (17.6%) |
| Coal or Coke | 0 (0.0%) | 0 (0.0%) |
| All other Fuels | 5 (2.7%) | 0 (0.0%) |
| No Fuel Used | 0 (0.0%) | 0 (0.0%) |
| Total | 186 (100.0%) | 68 (100.0%) |
Household Vehicle Usage in Willsboro
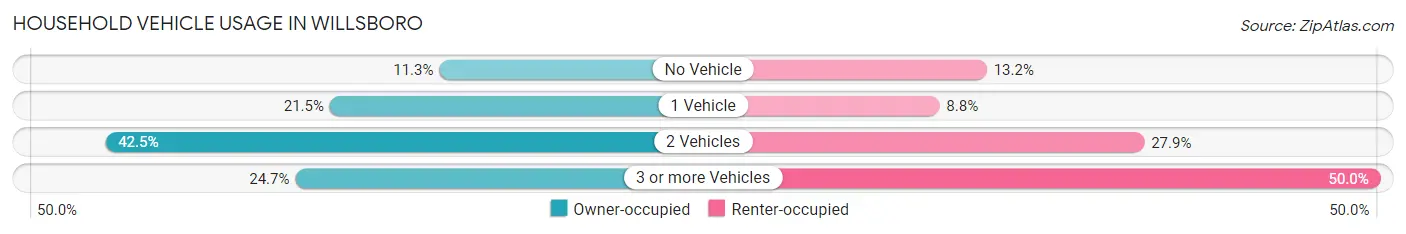
| Vehicles per Household | Owner-occupied | Renter-occupied |
| No Vehicle | 21 (11.3%) | 9 (13.2%) |
| 1 Vehicle | 40 (21.5%) | 6 (8.8%) |
| 2 Vehicles | 79 (42.5%) | 19 (27.9%) |
| 3 or more Vehicles | 46 (24.7%) | 34 (50.0%) |
| Total | 186 (100.0%) | 68 (100.0%) |
Real Estate & Mortgages in Willsboro
Real Estate and Mortgage Overview in Willsboro
| Characteristic | Without Mortgage | With Mortgage |
| Housing Units | 99 | 87 |
| Median Property Value | $124,700 | $191,500 |
| Median Household Income | - | - |
| Monthly Housing Costs | $707 | $0 |
| Real Estate Taxes | $1,355 | $0 |
Property Value by Mortgage Status in Willsboro
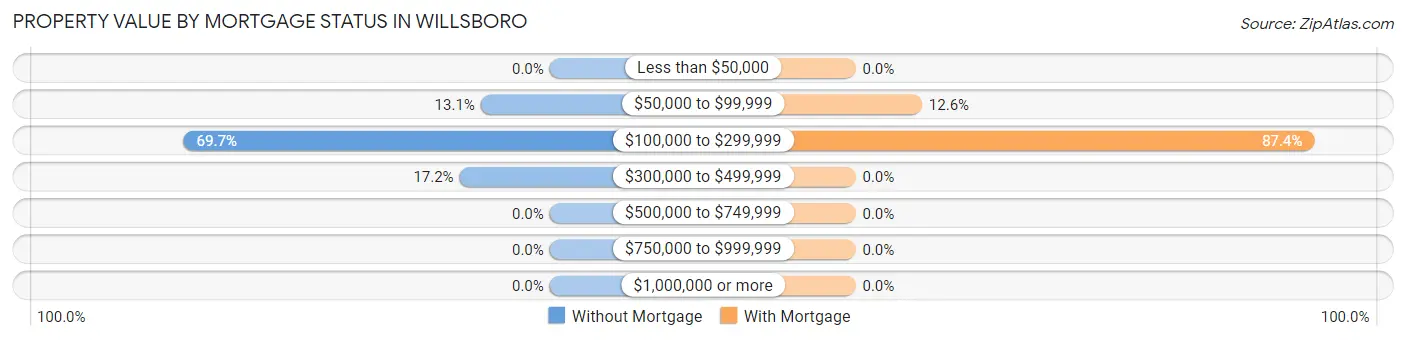
| Property Value | Without Mortgage | With Mortgage |
| Less than $50,000 | 0 (0.0%) | 0 (0.0%) |
| $50,000 to $99,999 | 13 (13.1%) | 11 (12.6%) |
| $100,000 to $299,999 | 69 (69.7%) | 76 (87.4%) |
| $300,000 to $499,999 | 17 (17.2%) | 0 (0.0%) |
| $500,000 to $749,999 | 0 (0.0%) | 0 (0.0%) |
| $750,000 to $999,999 | 0 (0.0%) | 0 (0.0%) |
| $1,000,000 or more | 0 (0.0%) | 0 (0.0%) |
| Total | 99 (100.0%) | 87 (100.0%) |
Household Income by Mortgage Status in Willsboro
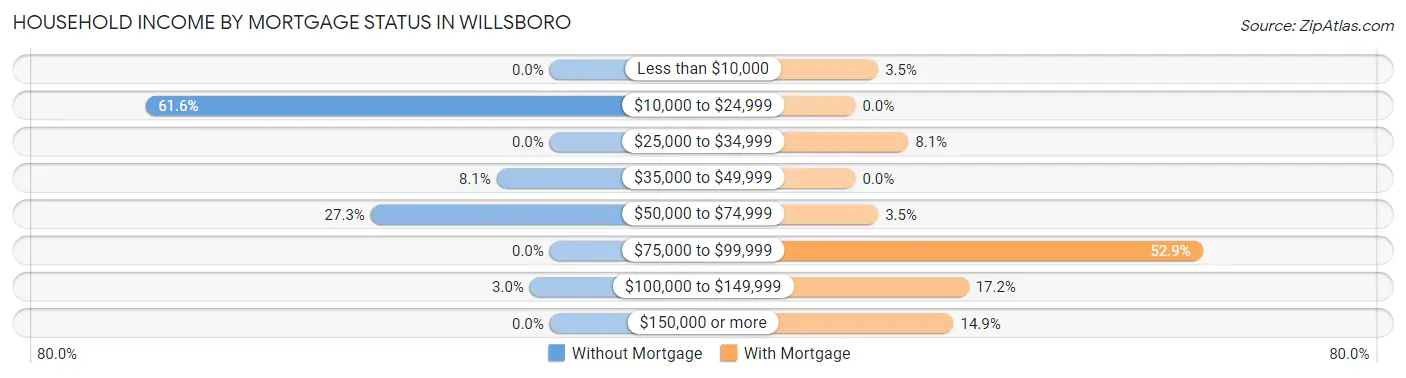
| Household Income | Without Mortgage | With Mortgage |
| Less than $10,000 | 0 (0.0%) | 3 (3.5%) |
| $10,000 to $24,999 | 61 (61.6%) | 0 (0.0%) |
| $25,000 to $34,999 | 0 (0.0%) | 7 (8.1%) |
| $35,000 to $49,999 | 8 (8.1%) | 0 (0.0%) |
| $50,000 to $74,999 | 27 (27.3%) | 3 (3.5%) |
| $75,000 to $99,999 | 0 (0.0%) | 46 (52.9%) |
| $100,000 to $149,999 | 3 (3.0%) | 15 (17.2%) |
| $150,000 or more | 0 (0.0%) | 13 (14.9%) |
| Total | 99 (100.0%) | 87 (100.0%) |
Property Value to Household Income Ratio in Willsboro
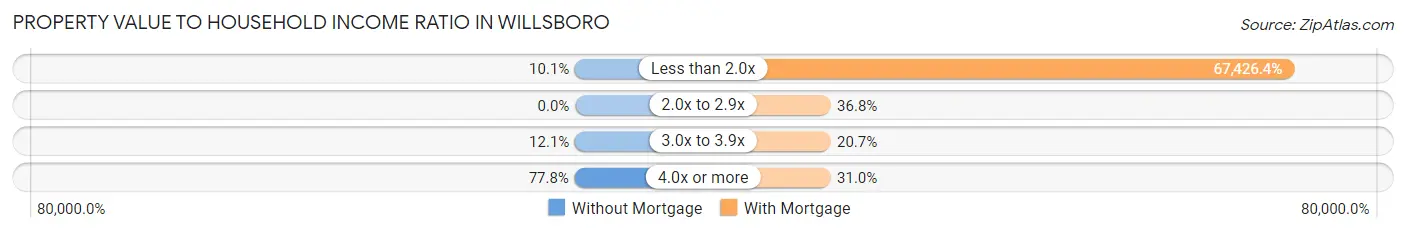
| Value-to-Income Ratio | Without Mortgage | With Mortgage |
| Less than 2.0x | 10 (10.1%) | 58,661 (67,426.4%) |
| 2.0x to 2.9x | 0 (0.0%) | 32 (36.8%) |
| 3.0x to 3.9x | 12 (12.1%) | 18 (20.7%) |
| 4.0x or more | 77 (77.8%) | 27 (31.0%) |
| Total | 99 (100.0%) | 87 (100.0%) |
Real Estate Taxes by Mortgage Status in Willsboro
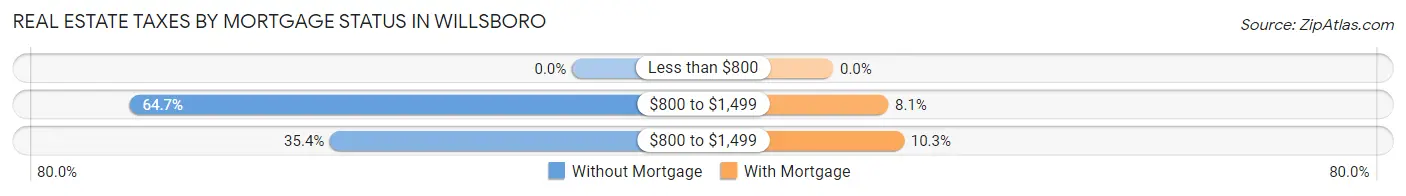
| Property Taxes | Without Mortgage | With Mortgage |
| Less than $800 | 0 (0.0%) | 0 (0.0%) |
| $800 to $1,499 | 64 (64.6%) | 7 (8.1%) |
| $800 to $1,499 | 35 (35.3%) | 9 (10.3%) |
| Total | 99 (100.0%) | 87 (100.0%) |
Health & Disability in Willsboro
Health Insurance Coverage by Age in Willsboro
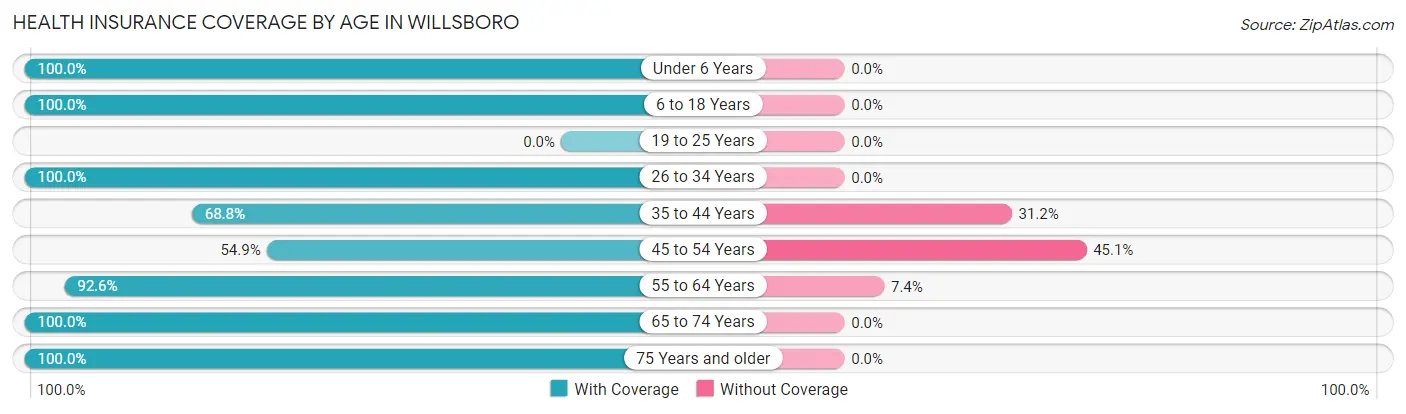
| Age Bracket | With Coverage | Without Coverage |
| Under 6 Years | 44 (100.0%) | 0 (0.0%) |
| 6 to 18 Years | 145 (100.0%) | 0 (0.0%) |
| 19 to 25 Years | 0 (0.0%) | 0 (0.0%) |
| 26 to 34 Years | 65 (100.0%) | 0 (0.0%) |
| 35 to 44 Years | 75 (68.8%) | 34 (31.2%) |
| 45 to 54 Years | 73 (54.9%) | 60 (45.1%) |
| 55 to 64 Years | 50 (92.6%) | 4 (7.4%) |
| 65 to 74 Years | 98 (100.0%) | 0 (0.0%) |
| 75 Years and older | 105 (100.0%) | 0 (0.0%) |
| Total | 655 (87.0%) | 98 (13.0%) |
Health Insurance Coverage by Citizenship Status in Willsboro
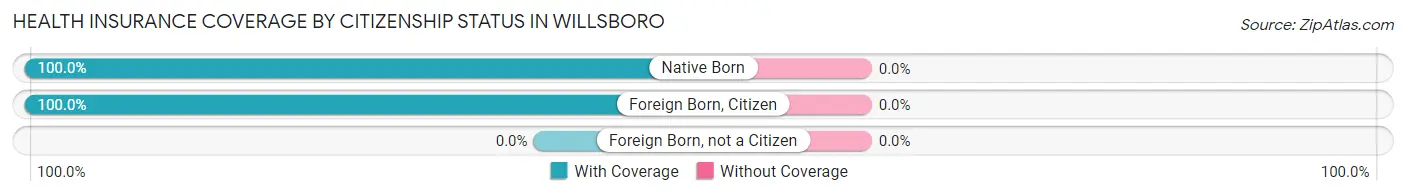
| Citizenship Status | With Coverage | Without Coverage |
| Native Born | 44 (100.0%) | 0 (0.0%) |
| Foreign Born, Citizen | 145 (100.0%) | 0 (0.0%) |
| Foreign Born, not a Citizen | 0 (0.0%) | 0 (0.0%) |
Health Insurance Coverage by Household Income in Willsboro
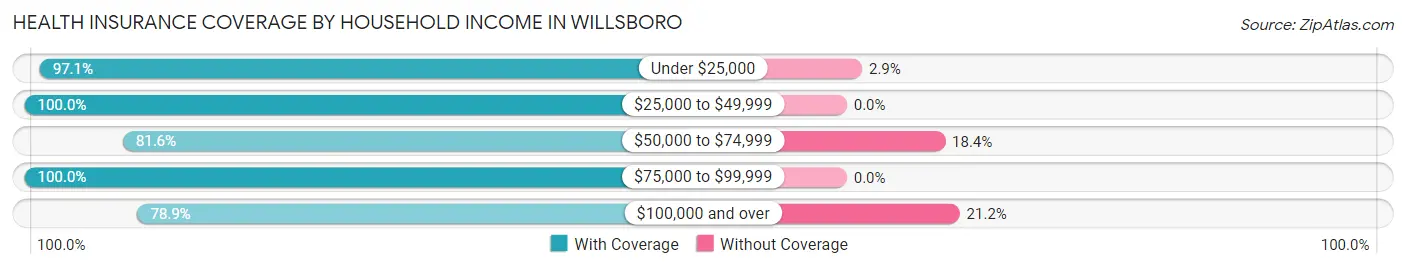
| Household Income | With Coverage | Without Coverage |
| Under $25,000 | 136 (97.1%) | 4 (2.9%) |
| $25,000 to $49,999 | 87 (100.0%) | 0 (0.0%) |
| $50,000 to $74,999 | 155 (81.6%) | 35 (18.4%) |
| $75,000 to $99,999 | 57 (100.0%) | 0 (0.0%) |
| $100,000 and over | 220 (78.8%) | 59 (21.1%) |
Public vs Private Health Insurance Coverage by Age in Willsboro
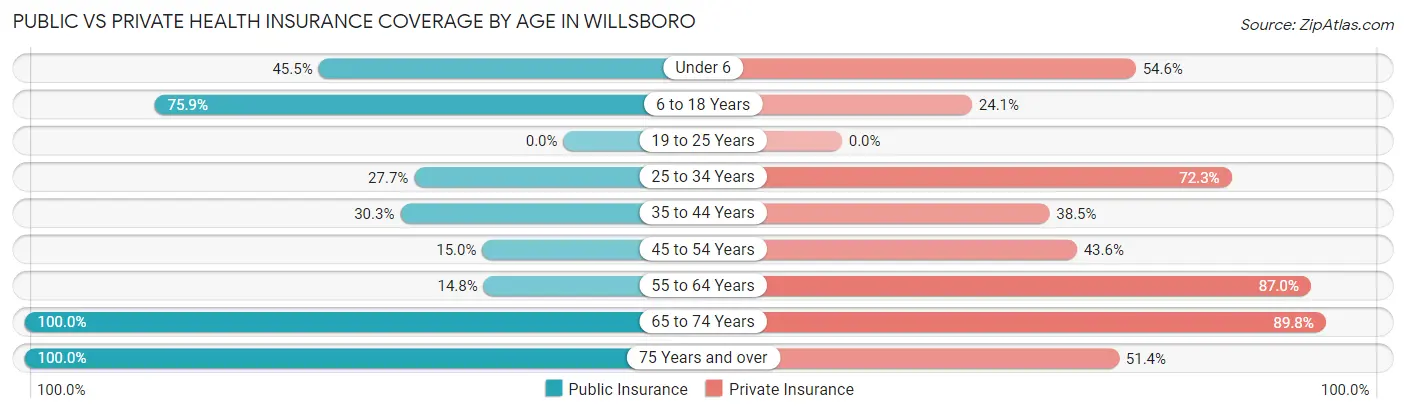
| Age Bracket | Public Insurance | Private Insurance |
| Under 6 | 20 (45.5%) | 24 (54.5%) |
| 6 to 18 Years | 110 (75.9%) | 35 (24.1%) |
| 19 to 25 Years | 0 (0.0%) | 0 (0.0%) |
| 25 to 34 Years | 18 (27.7%) | 47 (72.3%) |
| 35 to 44 Years | 33 (30.3%) | 42 (38.5%) |
| 45 to 54 Years | 20 (15.0%) | 58 (43.6%) |
| 55 to 64 Years | 8 (14.8%) | 47 (87.0%) |
| 65 to 74 Years | 98 (100.0%) | 88 (89.8%) |
| 75 Years and over | 105 (100.0%) | 54 (51.4%) |
| Total | 412 (54.7%) | 395 (52.5%) |
Disability Status by Sex by Age in Willsboro
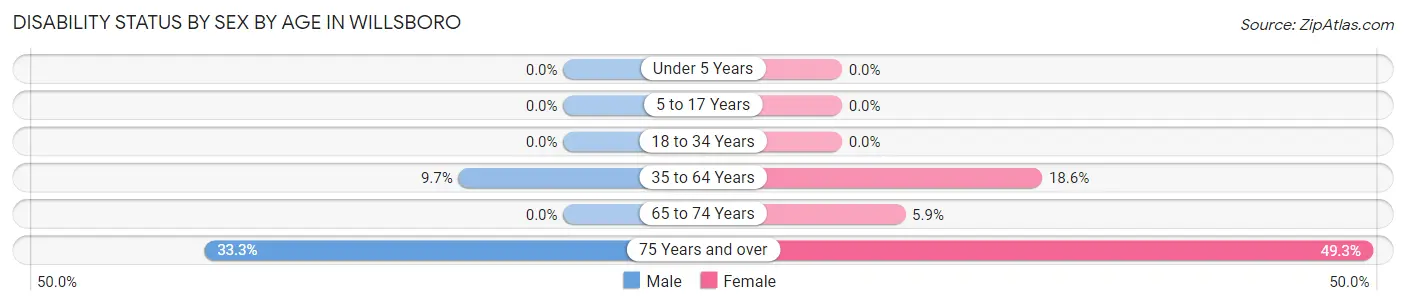
| Age Bracket | Male | Female |
| Under 5 Years | 0 (0.0%) | 0 (0.0%) |
| 5 to 17 Years | 0 (0.0%) | 0 (0.0%) |
| 18 to 34 Years | 0 (0.0%) | 0 (0.0%) |
| 35 to 64 Years | 11 (9.7%) | 34 (18.6%) |
| 65 to 74 Years | 0 (0.0%) | 1 (5.9%) |
| 75 Years and over | 12 (33.3%) | 34 (49.3%) |
Disability Class by Sex by Age in Willsboro
Disability Class: Hearing Difficulty
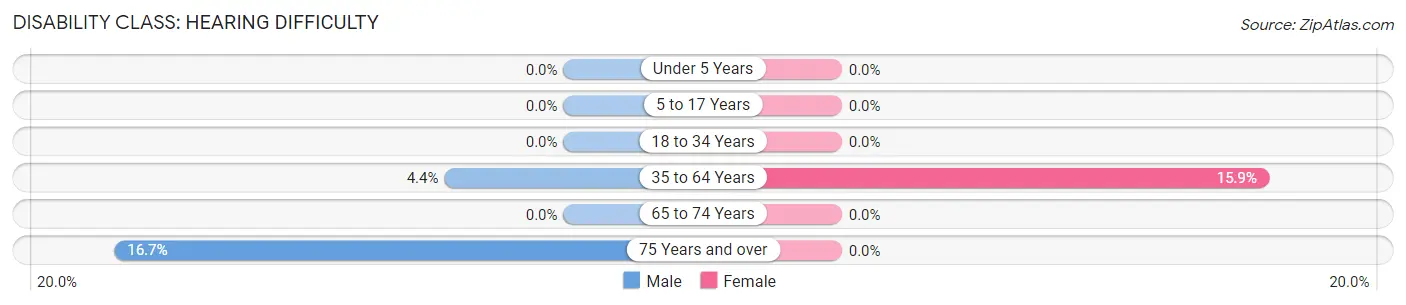
| Age Bracket | Male | Female |
| Under 5 Years | 0 (0.0%) | 0 (0.0%) |
| 5 to 17 Years | 0 (0.0%) | 0 (0.0%) |
| 18 to 34 Years | 0 (0.0%) | 0 (0.0%) |
| 35 to 64 Years | 5 (4.4%) | 29 (15.9%) |
| 65 to 74 Years | 0 (0.0%) | 0 (0.0%) |
| 75 Years and over | 6 (16.7%) | 0 (0.0%) |
Disability Class: Vision Difficulty
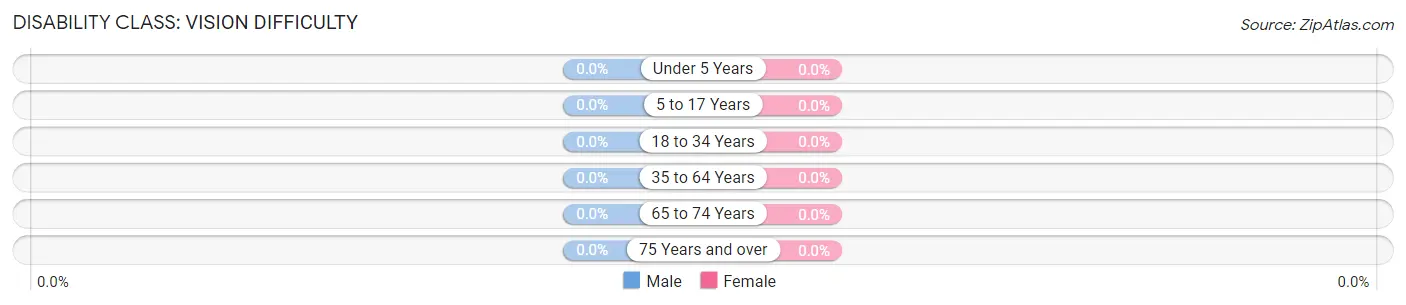
| Age Bracket | Male | Female |
| Under 5 Years | 0 (0.0%) | 0 (0.0%) |
| 5 to 17 Years | 0 (0.0%) | 0 (0.0%) |
| 18 to 34 Years | 0 (0.0%) | 0 (0.0%) |
| 35 to 64 Years | 0 (0.0%) | 0 (0.0%) |
| 65 to 74 Years | 0 (0.0%) | 0 (0.0%) |
| 75 Years and over | 0 (0.0%) | 0 (0.0%) |
Disability Class: Cognitive Difficulty
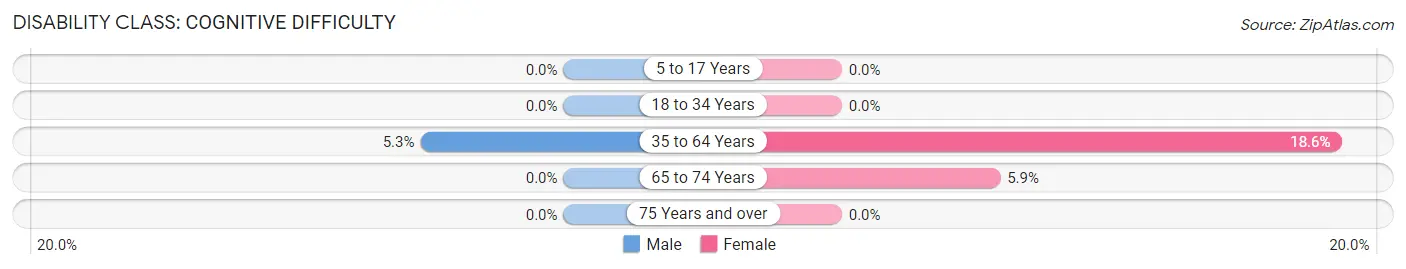
| Age Bracket | Male | Female |
| 5 to 17 Years | 0 (0.0%) | 0 (0.0%) |
| 18 to 34 Years | 0 (0.0%) | 0 (0.0%) |
| 35 to 64 Years | 6 (5.3%) | 34 (18.6%) |
| 65 to 74 Years | 0 (0.0%) | 1 (5.9%) |
| 75 Years and over | 0 (0.0%) | 0 (0.0%) |
Disability Class: Ambulatory Difficulty
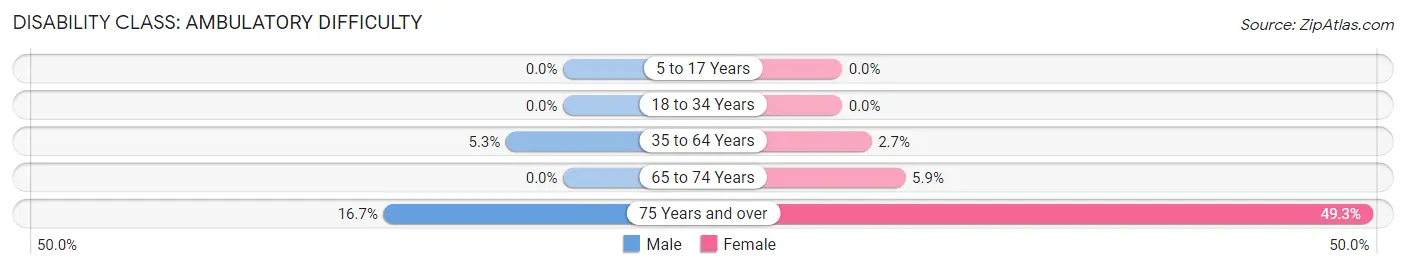
| Age Bracket | Male | Female |
| 5 to 17 Years | 0 (0.0%) | 0 (0.0%) |
| 18 to 34 Years | 0 (0.0%) | 0 (0.0%) |
| 35 to 64 Years | 6 (5.3%) | 5 (2.7%) |
| 65 to 74 Years | 0 (0.0%) | 1 (5.9%) |
| 75 Years and over | 6 (16.7%) | 34 (49.3%) |
Disability Class: Self-Care Difficulty
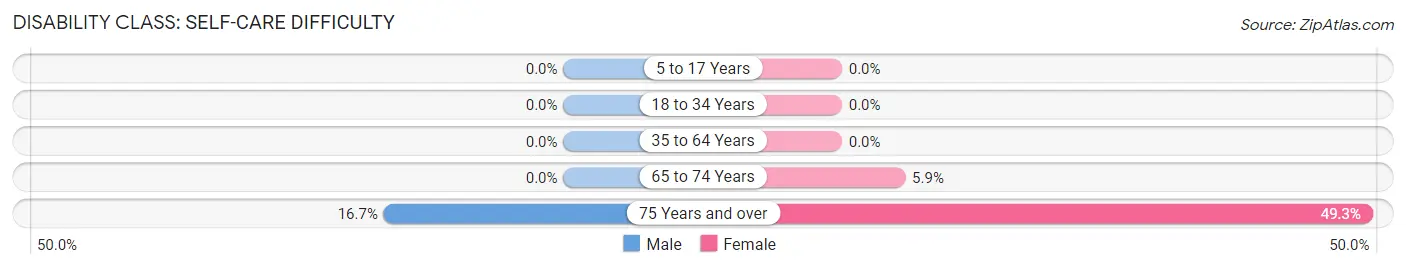
| Age Bracket | Male | Female |
| 5 to 17 Years | 0 (0.0%) | 0 (0.0%) |
| 18 to 34 Years | 0 (0.0%) | 0 (0.0%) |
| 35 to 64 Years | 0 (0.0%) | 0 (0.0%) |
| 65 to 74 Years | 0 (0.0%) | 1 (5.9%) |
| 75 Years and over | 6 (16.7%) | 34 (49.3%) |
Technology Access in Willsboro
Computing Device Access in Willsboro
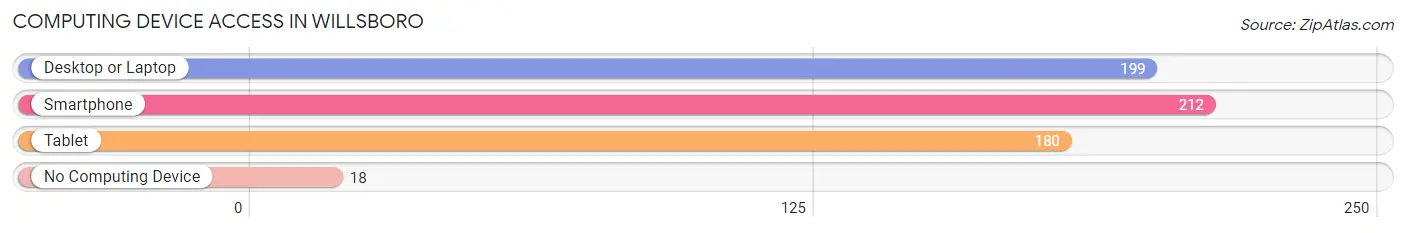
| Device Type | # Households | % Households |
| Desktop or Laptop | 199 | 78.3% |
| Smartphone | 212 | 83.5% |
| Tablet | 180 | 70.9% |
| No Computing Device | 18 | 7.1% |
| Total | 254 | 100.0% |
Internet Access in Willsboro
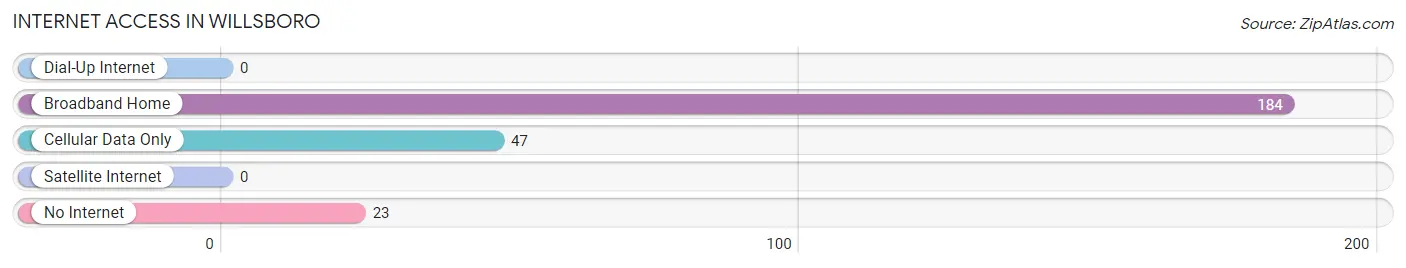
| Internet Type | # Households | % Households |
| Dial-Up Internet | 0 | 0.0% |
| Broadband Home | 184 | 72.4% |
| Cellular Data Only | 47 | 18.5% |
| Satellite Internet | 0 | 0.0% |
| No Internet | 23 | 9.1% |
| Total | 254 | 100.0% |
Willsboro Summary
Willsboro is a town located in Essex County, New York, United States. The population was 1,845 at the 2010 census. The town is located in the northeastern corner of the county, east of the city of Plattsburgh.
History
The town of Willsboro was first settled in 1765 by William Wills, who was granted a patent for the land. The town was formed in 1788 from the town of Essex. The town was named after William Wills.
Geography
Willsboro is located in the northeastern corner of Essex County, east of the city of Plattsburgh. The town is bordered by the towns of Essex to the west, Westport to the north, and Lewis to the east. The town is located on the eastern shore of Lake Champlain, and is home to the Willsboro Bay Wildlife Management Area.
The town has a total area of 40.2 square miles, of which, 38.2 square miles of it is land and 2.0 square miles of it (4.94%) is water.
Economy
The economy of Willsboro is largely based on tourism and agriculture. The town is home to several wineries, including the Willsboro Bay Winery, which produces a variety of wines from local grapes. The town is also home to several farms, including the Willsboro Farm, which produces a variety of fruits and vegetables.
The town is also home to several businesses, including the Willsboro Country Store, which sells a variety of local products, and the Willsboro Inn, which offers lodging and dining.
Demographics
As of the census of 2010, there were 1,845 people, 745 households, and 498 families residing in the town. The population density was 48.2 people per square mile (18.6/km2). There were 845 housing units at an average density of 22.1 per square mile (8.5/km2). The racial makeup of the town was 97.2% White, 0.7% African American, 0.3% Native American, 0.2% Asian, 0.1% Pacific Islander, 0.2% from other races, and 1.3% from two or more races. Hispanic or Latino of any race were 1.3% of the population.
There were 745 households, out of which 28.2% had children under the age of 18 living with them, 51.2% were married couples living together, 9.7% had a female householder with no husband present, and 34.2% were non-families. 28.2% of all households were made up of individuals, and 11.7% had someone living alone who was 65 years of age or older. The average household size was 2.45 and the average family size was 2.97.
In the town, the population was spread out, with 24.2% under the age of 18, 6.2% from 18 to 24, 25.2% from 25 to 44, 28.2% from 45 to 64, and 16.2% who were 65 years of age or older. The median age was 41 years. For every 100 females, there were 97.2 males. For every 100 females age 18 and over, there were 94.2 males.
The median income for a household in the town was $37,500, and the median income for a family was $45,000. Males had a median income of $31,250 versus $25,000 for females. The per capita income for the town was $19,845. About 8.2% of families and 11.2% of the population were below the poverty line, including 14.2% of those under age 18 and 8.2% of those age 65 or over.
Common Questions
What is Per Capita Income in Willsboro?
Per Capita income in Willsboro is $22,426.
What is the Median Family Income in Willsboro?
Median Family Income in Willsboro is $59,583.
What is the Median Household income in Willsboro?
Median Household Income in Willsboro is $53,523.
What is Income or Wage Gap in Willsboro?
Income or Wage Gap in Willsboro is 20.8%.
Women in Willsboro earn 79.2 cents for every dollar earned by a man.
What is Inequality or Gini Index in Willsboro?
Inequality or Gini Index in Willsboro is 0.35.
What is the Total Population of Willsboro?
Total Population of Willsboro is 753.
What is the Total Male Population of Willsboro?
Total Male Population of Willsboro is 397.
What is the Total Female Population of Willsboro?
Total Female Population of Willsboro is 356.
What is the Ratio of Males per 100 Females in Willsboro?
There are 111.52 Males per 100 Females in Willsboro.
What is the Ratio of Females per 100 Males in Willsboro?
There are 89.67 Females per 100 Males in Willsboro.
What is the Median Population Age in Willsboro?
Median Population Age in Willsboro is 45.3 Years.
What is the Average Family Size in Willsboro
Average Family Size in Willsboro is 3.4 People.
What is the Average Household Size in Willsboro
Average Household Size in Willsboro is 3.0 People.
How Large is the Labor Force in Willsboro?
There are 328 People in the Labor Forcein in Willsboro.
What is the Percentage of People in the Labor Force in Willsboro?
53.9% of People are in the Labor Force in Willsboro.