Westhampton Beach, NY Map & Demographics
Westhampton Beach Map
Westhampton Beach Overview
$98,111
PER CAPITA INCOME
$154,265
AVG FAMILY INCOME
$133,173
AVG HOUSEHOLD INCOME
51.9%
WAGE / INCOME GAP [ % ]
48.1¢/ $1
WAGE / INCOME GAP [ $ ]
0.54
INEQUALITY / GINI INDEX
2,344
TOTAL POPULATION
1,207
MALE POPULATION
1,137
FEMALE POPULATION
106.16
MALES / 100 FEMALES
94.20
FEMALES / 100 MALES
52.2
MEDIAN AGE
2.9
AVG FAMILY SIZE
2.3
AVG HOUSEHOLD SIZE
1,223
LABOR FORCE [ PEOPLE ]
56.3%
PERCENT IN LABOR FORCE
3.7%
UNEMPLOYMENT RATE
Westhampton Beach Zip Codes
Westhampton Beach Area Codes
Income in Westhampton Beach
Income Overview in Westhampton Beach
Per Capita Income in Westhampton Beach is $98,111, while median incomes of families and households are $154,265 and $133,173 respectively.
| Characteristic | Number | Measure |
| Per Capita Income | 2,344 | $98,111 |
| Median Family Income | 588 | $154,265 |
| Mean Family Income | 588 | $231,665 |
| Median Household Income | 981 | $133,173 |
| Mean Household Income | 981 | $225,972 |
| Income Deficit | 588 | $0 |
| Wage / Income Gap (%) | 2,344 | 51.87% |
| Wage / Income Gap ($) | 2,344 | 48.13¢ per $1 |
| Gini / Inequality Index | 2,344 | 0.54 |
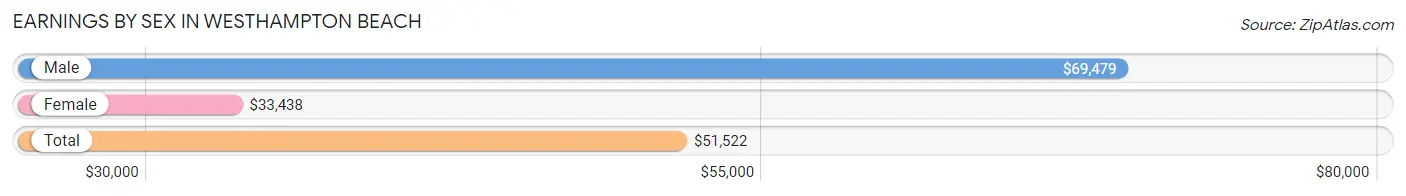
Earnings by Sex in Westhampton Beach
Average Earnings in Westhampton Beach are $51,522, $69,479 for men and $33,438 for women, a difference of 51.9%.
| Sex | Number | Average Earnings |
| Male | 763 (58.6%) | $69,479 |
| Female | 539 (41.4%) | $33,438 |
| Total | 1,302 (100.0%) | $51,522 |
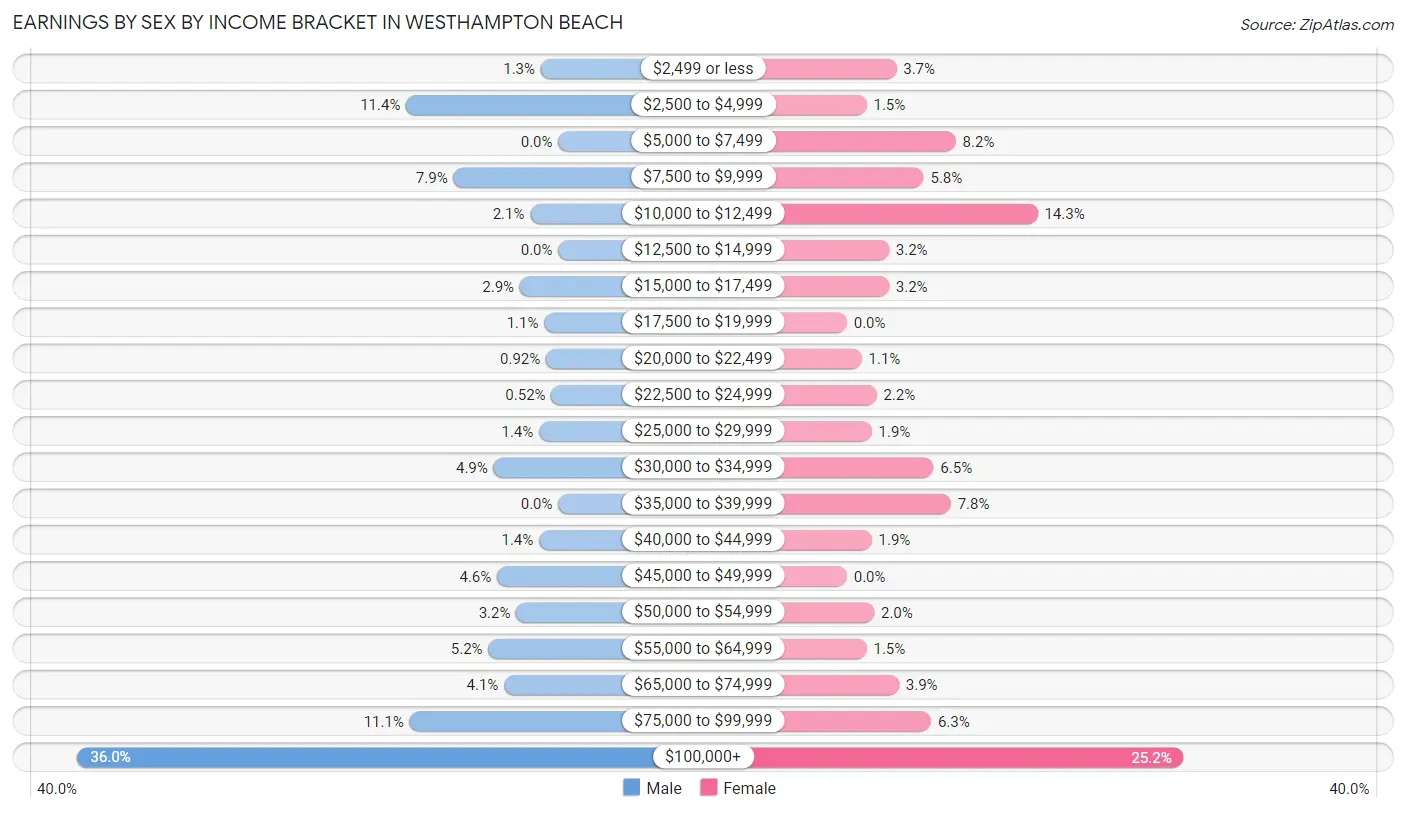
Earnings by Sex by Income Bracket in Westhampton Beach
The most common earnings brackets in Westhampton Beach are $100,000+ for men (275 | 36.0%) and $100,000+ for women (136 | 25.2%).
| Income | Male | Female |
| $2,499 or less | 10 (1.3%) | 20 (3.7%) |
| $2,500 to $4,999 | 87 (11.4%) | 8 (1.5%) |
| $5,000 to $7,499 | 0 (0.0%) | 44 (8.2%) |
| $7,500 to $9,999 | 60 (7.9%) | 31 (5.8%) |
| $10,000 to $12,499 | 16 (2.1%) | 77 (14.3%) |
| $12,500 to $14,999 | 0 (0.0%) | 17 (3.2%) |
| $15,000 to $17,499 | 22 (2.9%) | 17 (3.2%) |
| $17,500 to $19,999 | 8 (1.1%) | 0 (0.0%) |
| $20,000 to $22,499 | 7 (0.9%) | 6 (1.1%) |
| $22,500 to $24,999 | 4 (0.5%) | 12 (2.2%) |
| $25,000 to $29,999 | 11 (1.4%) | 10 (1.9%) |
| $30,000 to $34,999 | 37 (4.9%) | 35 (6.5%) |
| $35,000 to $39,999 | 0 (0.0%) | 42 (7.8%) |
| $40,000 to $44,999 | 11 (1.4%) | 10 (1.9%) |
| $45,000 to $49,999 | 35 (4.6%) | 0 (0.0%) |
| $50,000 to $54,999 | 24 (3.2%) | 11 (2.0%) |
| $55,000 to $64,999 | 40 (5.2%) | 8 (1.5%) |
| $65,000 to $74,999 | 31 (4.1%) | 21 (3.9%) |
| $75,000 to $99,999 | 85 (11.1%) | 34 (6.3%) |
| $100,000+ | 275 (36.0%) | 136 (25.2%) |
| Total | 763 (100.0%) | 539 (100.0%) |
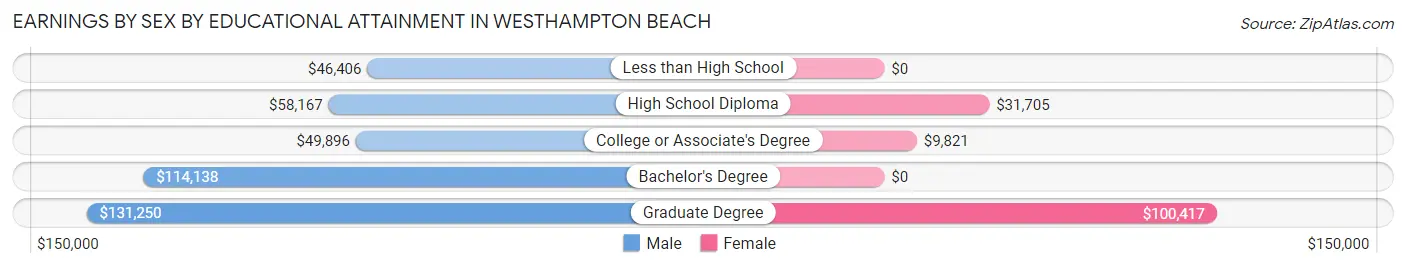
Earnings by Sex by Educational Attainment in Westhampton Beach
Average earnings in Westhampton Beach are $84,848 for men and $37,262 for women, a difference of 56.1%. Men with an educational attainment of graduate degree enjoy the highest average annual earnings of $131,250, while those with less than high school education earn the least with $46,406. Women with an educational attainment of graduate degree earn the most with the average annual earnings of $100,417, while those with college or associate's degree education have the smallest earnings of $9,821.
| Educational Attainment | Male Income | Female Income |
| Less than High School | $46,406 | $0 |
| High School Diploma | $58,167 | $31,705 |
| College or Associate's Degree | $49,896 | $9,821 |
| Bachelor's Degree | $114,138 | $0 |
| Graduate Degree | $131,250 | $100,417 |
| Total | $84,848 | $37,262 |
Family Income in Westhampton Beach
Family Income Brackets in Westhampton Beach
According to the Westhampton Beach family income data, there are 248 families falling into the $200,000+ income range, which is the most common income bracket and makes up 42.2% of all families.
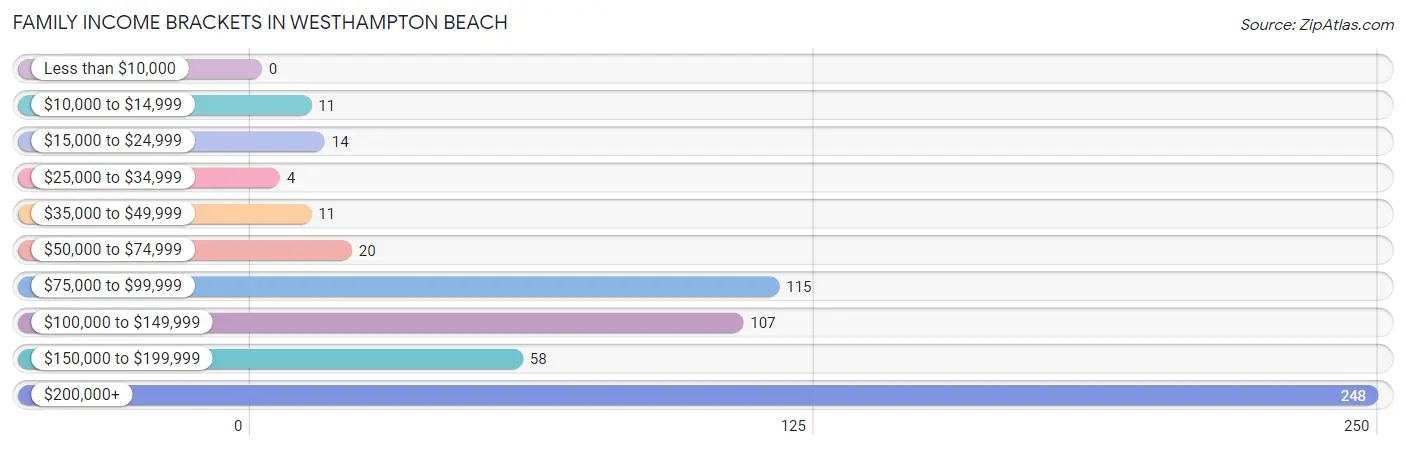
| Income Bracket | # Families | % Families |
| Less than $10,000 | 0 | 0.0% |
| $10,000 to $14,999 | 11 | 1.9% |
| $15,000 to $24,999 | 14 | 2.4% |
| $25,000 to $34,999 | 4 | 0.7% |
| $35,000 to $49,999 | 11 | 1.9% |
| $50,000 to $74,999 | 20 | 3.4% |
| $75,000 to $99,999 | 115 | 19.6% |
| $100,000 to $149,999 | 107 | 18.2% |
| $150,000 to $199,999 | 58 | 9.9% |
| $200,000+ | 248 | 42.2% |
Family Income by Famaliy Size in Westhampton Beach
3-person families (123 | 20.9%) account for the highest median family income in Westhampton Beach with $196,917 per family, while 2-person families (325 | 55.3%) have the highest median income of $83,594 per family member.
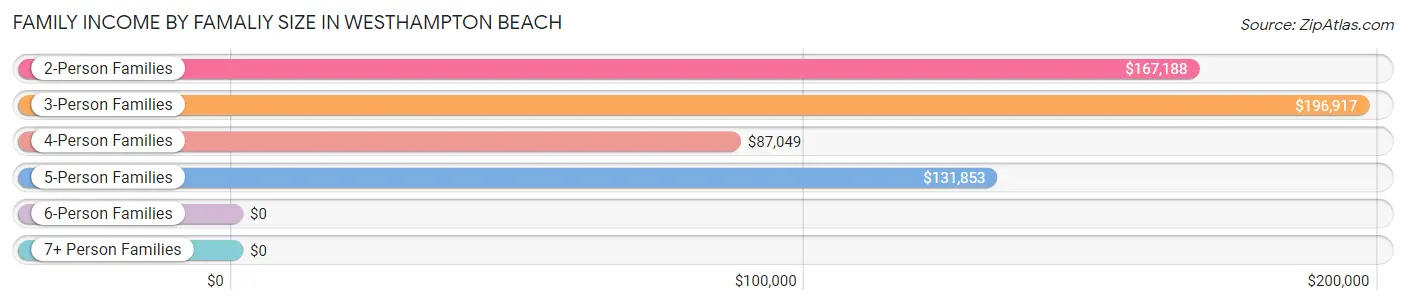
| Income Bracket | # Families | Median Income |
| 2-Person Families | 325 (55.3%) | $167,188 |
| 3-Person Families | 123 (20.9%) | $196,917 |
| 4-Person Families | 81 (13.8%) | $87,049 |
| 5-Person Families | 59 (10.0%) | $131,853 |
| 6-Person Families | 0 (0.0%) | $0 |
| 7+ Person Families | 0 (0.0%) | $0 |
| Total | 588 (100.0%) | $154,265 |
Family Income by Number of Earners in Westhampton Beach
The median family income in Westhampton Beach is $154,265, with families comprising 1 earner (201) having the highest median family income of $218,750, while families with 3+ earners (111) have the lowest median family income of $109,554, accounting for 34.2% and 18.9% of families, respectively.
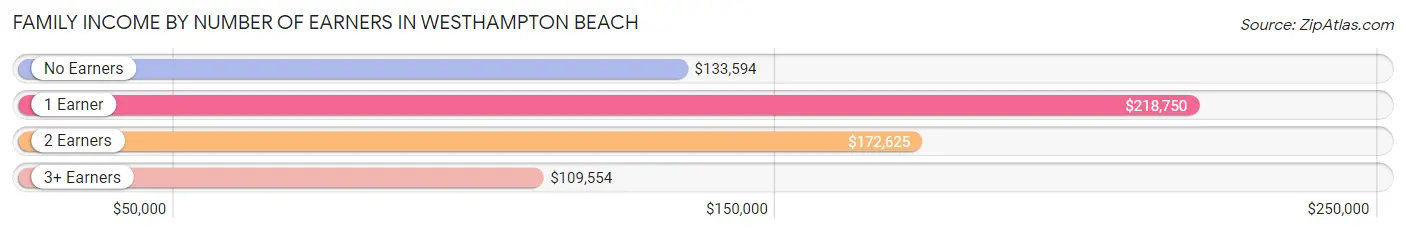
| Number of Earners | # Families | Median Income |
| No Earners | 95 (16.2%) | $133,594 |
| 1 Earner | 201 (34.2%) | $218,750 |
| 2 Earners | 181 (30.8%) | $172,625 |
| 3+ Earners | 111 (18.9%) | $109,554 |
| Total | 588 (100.0%) | $154,265 |
Household Income in Westhampton Beach
Household Income Brackets in Westhampton Beach
With 333 households falling in the category, the $200,000+ income range is the most frequent in Westhampton Beach, accounting for 33.9% of all households. In contrast, only 11 households (1.1%) fall into the $10,000 to $14,999 income bracket, making it the least populous group.
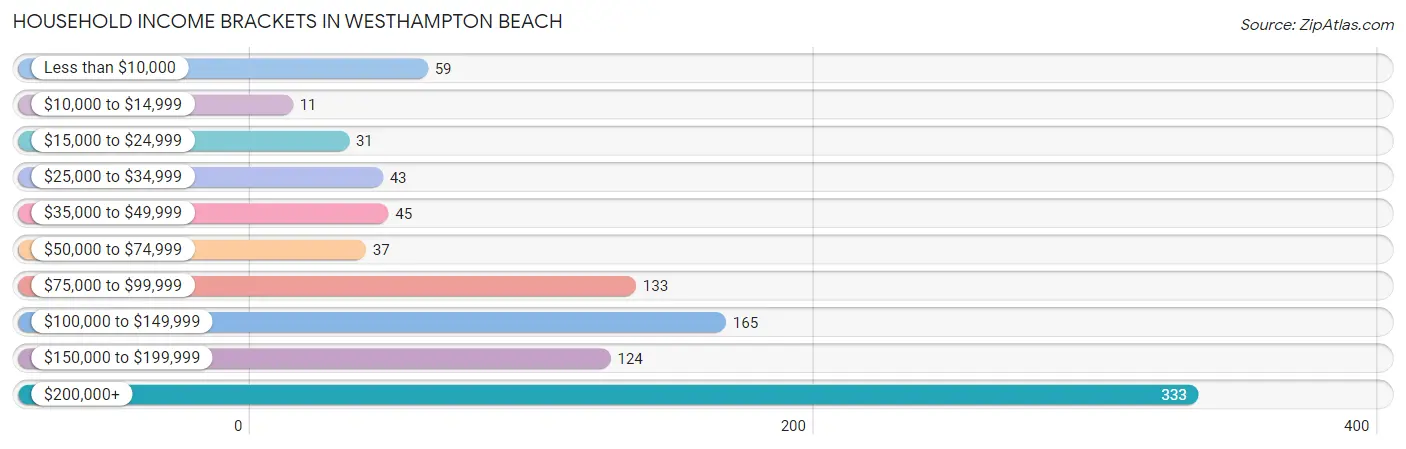
| Income Bracket | # Households | % Households |
| Less than $10,000 | 59 | 6.0% |
| $10,000 to $14,999 | 11 | 1.1% |
| $15,000 to $24,999 | 31 | 3.2% |
| $25,000 to $34,999 | 43 | 4.4% |
| $35,000 to $49,999 | 45 | 4.6% |
| $50,000 to $74,999 | 37 | 3.8% |
| $75,000 to $99,999 | 133 | 13.6% |
| $100,000 to $149,999 | 165 | 16.8% |
| $150,000 to $199,999 | 124 | 12.6% |
| $200,000+ | 333 | 33.9% |
Household Income by Householder Age in Westhampton Beach
The median household income in Westhampton Beach is $133,173, with the highest median household income of $154,821 found in the 45 to 64 years age bracket for the primary householder. A total of 400 households (40.8%) fall into this category.
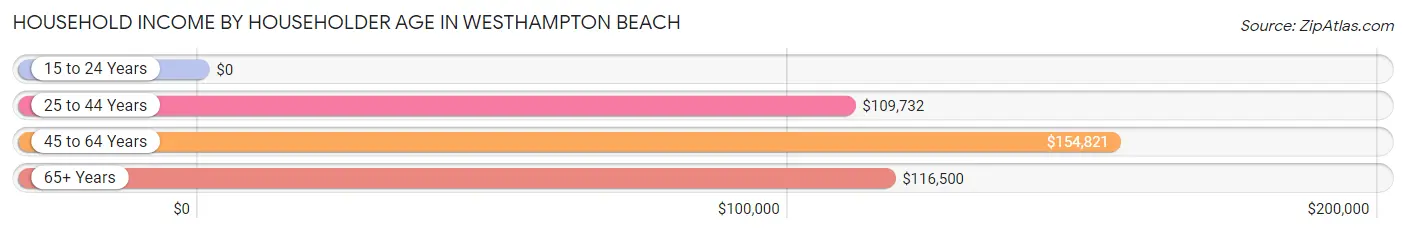
| Income Bracket | # Households | Median Income |
| 15 to 24 Years | 0 (0.0%) | $0 |
| 25 to 44 Years | 129 (13.2%) | $109,732 |
| 45 to 64 Years | 400 (40.8%) | $154,821 |
| 65+ Years | 452 (46.1%) | $116,500 |
| Total | 981 (100.0%) | $133,173 |
Poverty in Westhampton Beach
Income Below Poverty by Sex and Age in Westhampton Beach
With 6.2% poverty level for males and 13.7% for females among the residents of Westhampton Beach, 12 to 14 year old males and 12 to 14 year old females are the most vulnerable to poverty, with 16 males (59.3%) and 12 females (30.8%) in their respective age groups living below the poverty level.
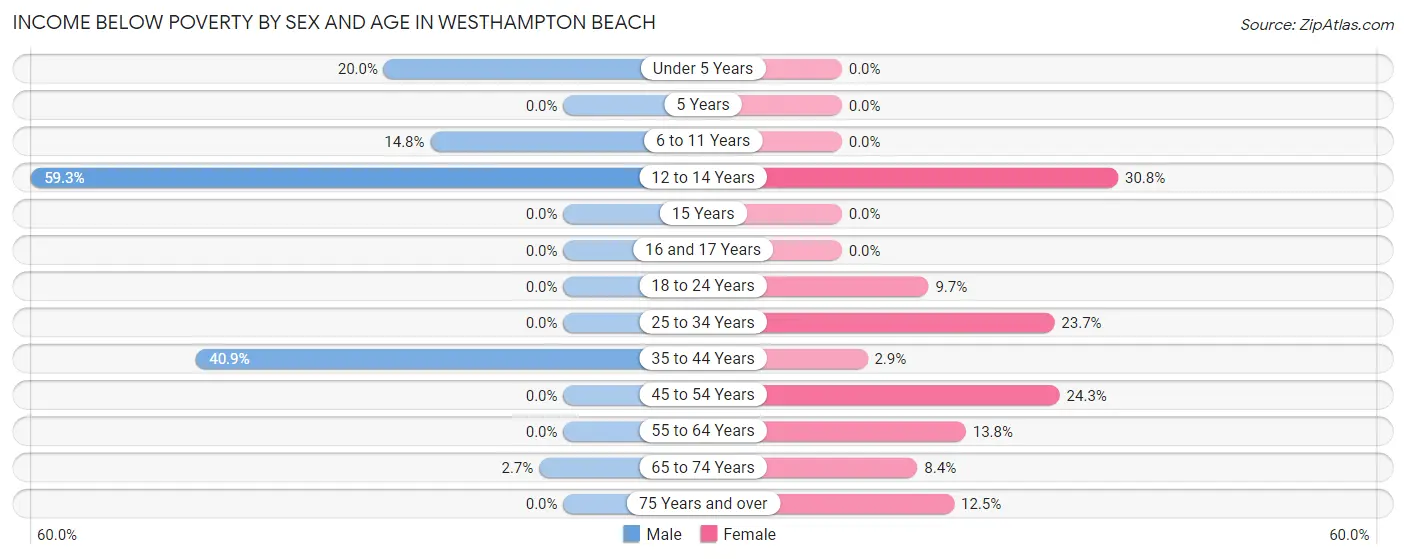
| Age Bracket | Male | Female |
| Under 5 Years | 3 (20.0%) | 0 (0.0%) |
| 5 Years | 0 (0.0%) | 0 (0.0%) |
| 6 to 11 Years | 4 (14.8%) | 0 (0.0%) |
| 12 to 14 Years | 16 (59.3%) | 12 (30.8%) |
| 15 Years | 0 (0.0%) | 0 (0.0%) |
| 16 and 17 Years | 0 (0.0%) | 0 (0.0%) |
| 18 to 24 Years | 0 (0.0%) | 11 (9.7%) |
| 25 to 34 Years | 0 (0.0%) | 27 (23.7%) |
| 35 to 44 Years | 47 (40.9%) | 2 (2.9%) |
| 45 to 54 Years | 0 (0.0%) | 33 (24.3%) |
| 55 to 64 Years | 0 (0.0%) | 33 (13.8%) |
| 65 to 74 Years | 5 (2.7%) | 16 (8.4%) |
| 75 Years and over | 0 (0.0%) | 22 (12.5%) |
| Total | 75 (6.2%) | 156 (13.7%) |
Income Above Poverty by Sex and Age in Westhampton Beach
According to the poverty statistics in Westhampton Beach, males aged 5 years and females aged under 5 years are the age groups that are most secure financially, with 100.0% of males and 100.0% of females in these age groups living above the poverty line.
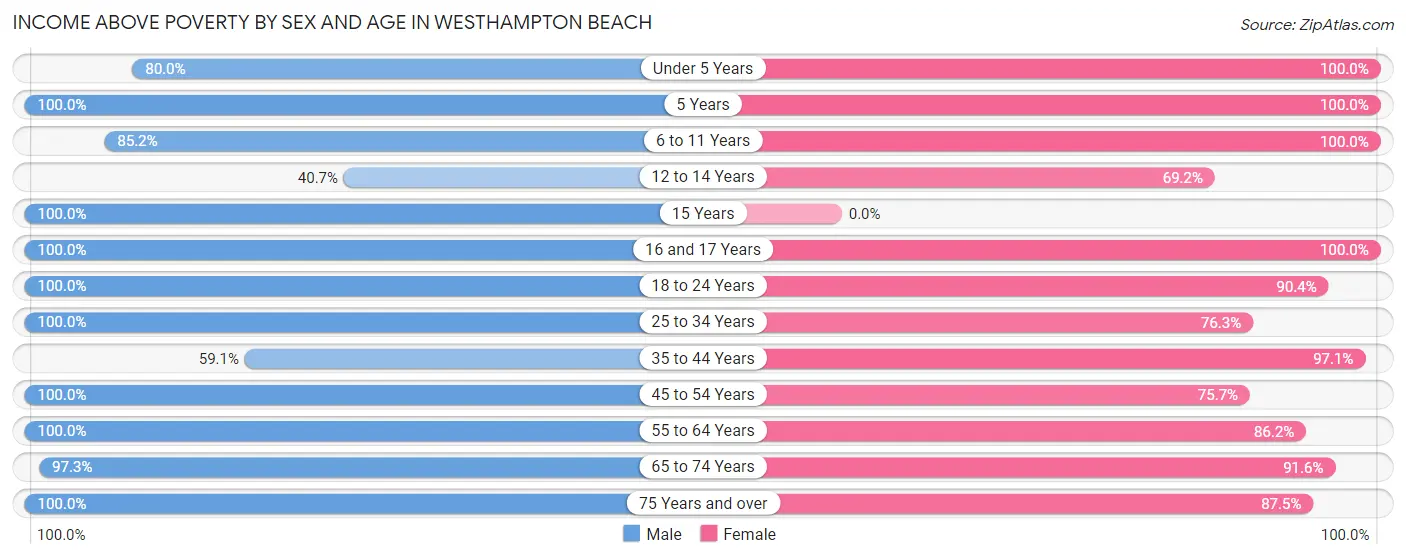
| Age Bracket | Male | Female |
| Under 5 Years | 12 (80.0%) | 11 (100.0%) |
| 5 Years | 5 (100.0%) | 5 (100.0%) |
| 6 to 11 Years | 23 (85.2%) | 33 (100.0%) |
| 12 to 14 Years | 11 (40.7%) | 27 (69.2%) |
| 15 Years | 10 (100.0%) | 0 (0.0%) |
| 16 and 17 Years | 59 (100.0%) | 10 (100.0%) |
| 18 to 24 Years | 191 (100.0%) | 103 (90.3%) |
| 25 to 34 Years | 125 (100.0%) | 87 (76.3%) |
| 35 to 44 Years | 68 (59.1%) | 68 (97.1%) |
| 45 to 54 Years | 127 (100.0%) | 103 (75.7%) |
| 55 to 64 Years | 157 (100.0%) | 206 (86.2%) |
| 65 to 74 Years | 180 (97.3%) | 174 (91.6%) |
| 75 Years and over | 164 (100.0%) | 154 (87.5%) |
| Total | 1,132 (93.8%) | 981 (86.3%) |
Income Below Poverty Among Married-Couple Families in Westhampton Beach
The poverty statistics for married-couple families in Westhampton Beach show that 0.9% or 4 of the total 438 families live below the poverty line. Families with 1 or 2 children have the highest poverty rate of 5.0%, comprising of 4 families. On the other hand, families with no children have the lowest poverty rate of 0.0%, which includes 0 families.
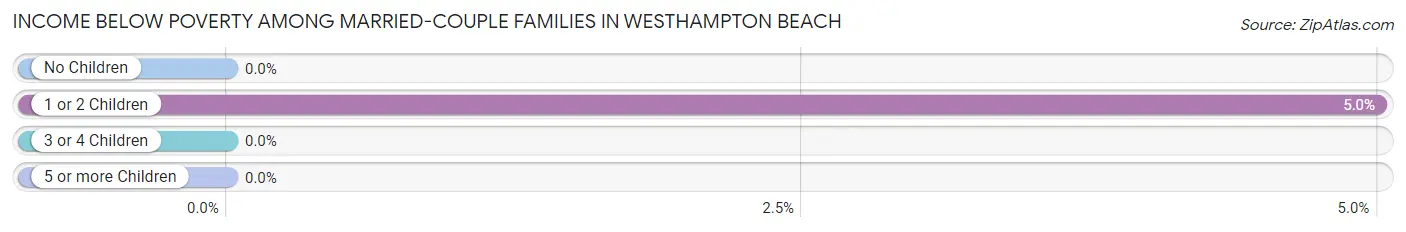
| Children | Above Poverty | Below Poverty |
| No Children | 349 (100.0%) | 0 (0.0%) |
| 1 or 2 Children | 76 (95.0%) | 4 (5.0%) |
| 3 or 4 Children | 9 (100.0%) | 0 (0.0%) |
| 5 or more Children | 0 (0.0%) | 0 (0.0%) |
| Total | 434 (99.1%) | 4 (0.9%) |
Income Below Poverty Among Single-Parent Households in Westhampton Beach
According to the poverty data in Westhampton Beach, 14.5% or 12 single-father households and 19.4% or 13 single-mother households are living below the poverty line. Among single-father households, those with 1 or 2 children have the highest poverty rate, with 12 households (21.8%) experiencing poverty. Likewise, among single-mother households, those with 1 or 2 children have the highest poverty rate, with 13 households (86.7%) falling below the poverty line.
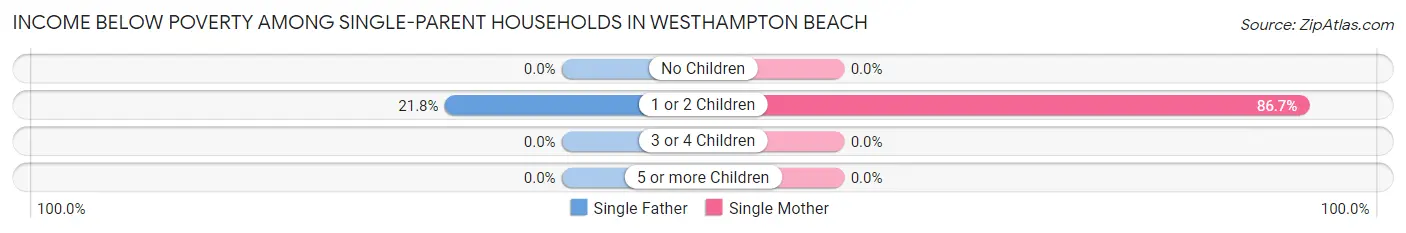
| Children | Single Father | Single Mother |
| No Children | 0 (0.0%) | 0 (0.0%) |
| 1 or 2 Children | 12 (21.8%) | 13 (86.7%) |
| 3 or 4 Children | 0 (0.0%) | 0 (0.0%) |
| 5 or more Children | 0 (0.0%) | 0 (0.0%) |
| Total | 12 (14.5%) | 13 (19.4%) |
Income Below Poverty Among Married-Couple vs Single-Parent Households in Westhampton Beach
The poverty data for Westhampton Beach shows that 4 of the married-couple family households (0.9%) and 25 of the single-parent households (16.7%) are living below the poverty level. Within the married-couple family households, those with 1 or 2 children have the highest poverty rate, with 4 households (5.0%) falling below the poverty line. Among the single-parent households, those with 1 or 2 children have the highest poverty rate, with 25 household (35.7%) living below poverty.
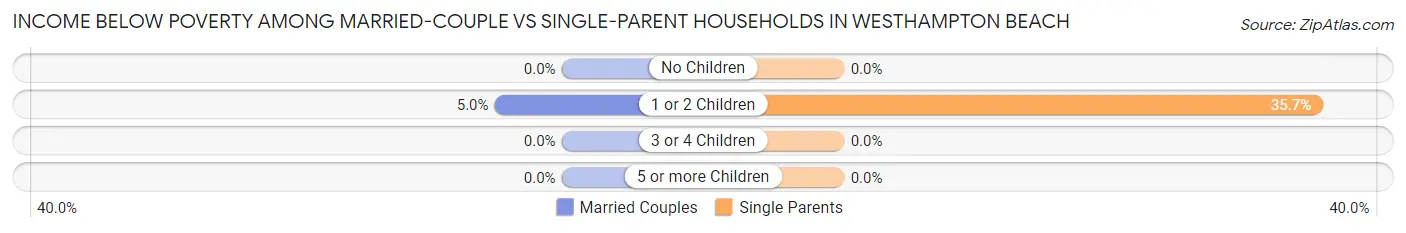
| Children | Married-Couple Families | Single-Parent Households |
| No Children | 0 (0.0%) | 0 (0.0%) |
| 1 or 2 Children | 4 (5.0%) | 25 (35.7%) |
| 3 or 4 Children | 0 (0.0%) | 0 (0.0%) |
| 5 or more Children | 0 (0.0%) | 0 (0.0%) |
| Total | 4 (0.9%) | 25 (16.7%) |
Race in Westhampton Beach
The most populous races in Westhampton Beach are White / Caucasian (2,068 | 88.2%), Hispanic or Latino (205 | 8.7%), and Two or more Races (128 | 5.5%).
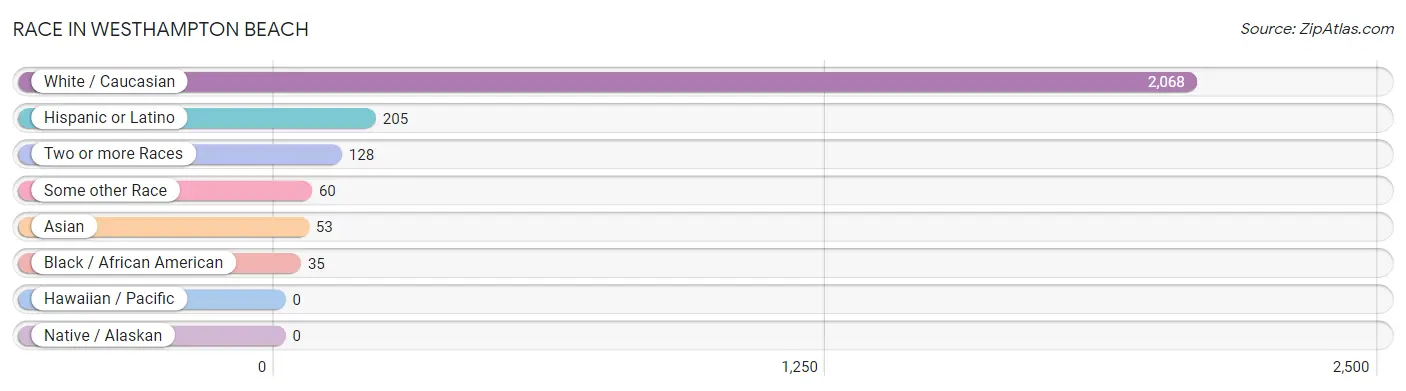
| Race | # Population | % Population |
| Asian | 53 | 2.3% |
| Black / African American | 35 | 1.5% |
| Hawaiian / Pacific | 0 | 0.0% |
| Hispanic or Latino | 205 | 8.7% |
| Native / Alaskan | 0 | 0.0% |
| White / Caucasian | 2,068 | 88.2% |
| Two or more Races | 128 | 5.5% |
| Some other Race | 60 | 2.6% |
| Total | 2,344 | 100.0% |
Ancestry in Westhampton Beach
The most populous ancestries reported in Westhampton Beach are Irish (355 | 15.1%), Italian (335 | 14.3%), Polish (214 | 9.1%), German (185 | 7.9%), and English (181 | 7.7%), together accounting for 54.2% of all Westhampton Beach residents.
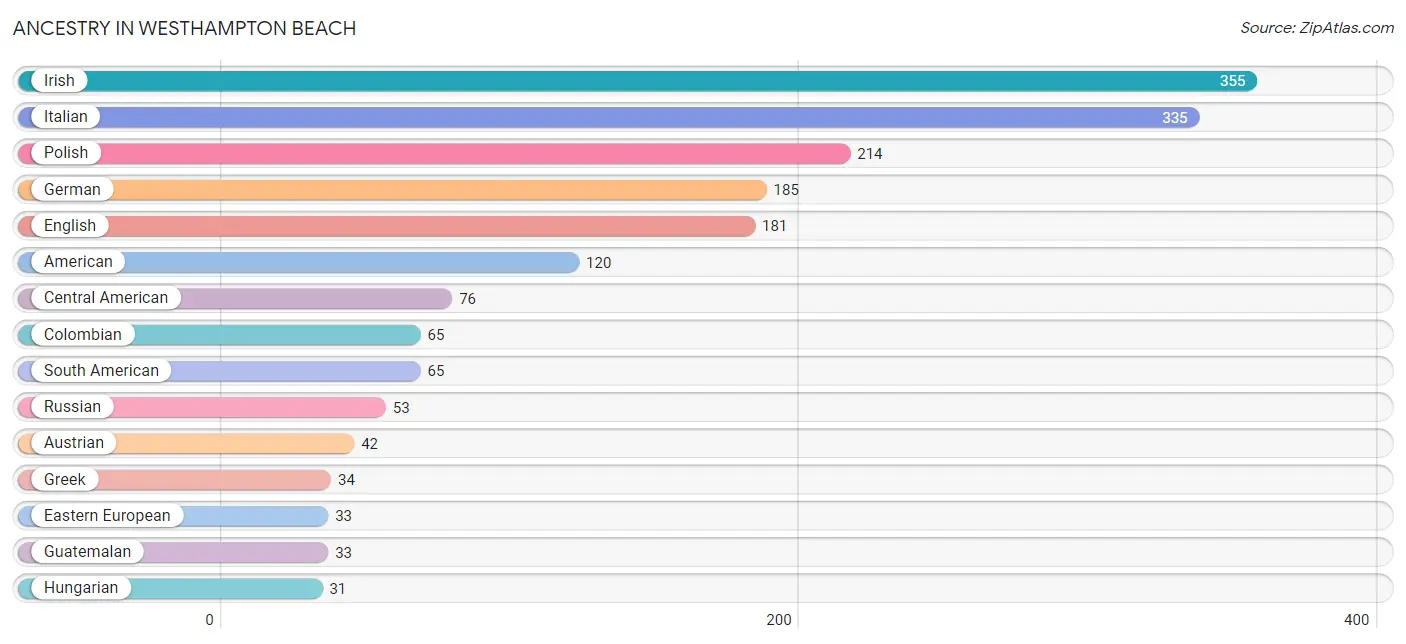
| Ancestry | # Population | % Population |
| American | 120 | 5.1% |
| Arab | 5 | 0.2% |
| Armenian | 1 | 0.0% |
| Austrian | 42 | 1.8% |
| Bhutanese | 13 | 0.5% |
| British | 10 | 0.4% |
| Burmese | 12 | 0.5% |
| Central American | 76 | 3.2% |
| Colombian | 65 | 2.8% |
| Costa Rican | 12 | 0.5% |
| Danish | 4 | 0.2% |
| Dutch | 14 | 0.6% |
| Eastern European | 33 | 1.4% |
| English | 181 | 7.7% |
| European | 9 | 0.4% |
| French | 8 | 0.3% |
| German | 185 | 7.9% |
| Greek | 34 | 1.5% |
| Guatemalan | 33 | 1.4% |
| Guyanese | 8 | 0.3% |
| Hungarian | 31 | 1.3% |
| Indian (Asian) | 26 | 1.1% |
| Irish | 355 | 15.1% |
| Italian | 335 | 14.3% |
| Jamaican | 11 | 0.5% |
| Korean | 16 | 0.7% |
| Lithuanian | 13 | 0.5% |
| Mexican | 11 | 0.5% |
| Norwegian | 18 | 0.8% |
| Polish | 214 | 9.1% |
| Portuguese | 8 | 0.3% |
| Puerto Rican | 16 | 0.7% |
| Romanian | 5 | 0.2% |
| Russian | 53 | 2.3% |
| Salvadoran | 31 | 1.3% |
| Scotch-Irish | 2 | 0.1% |
| Scottish | 22 | 0.9% |
| Slavic | 4 | 0.2% |
| Slovak | 5 | 0.2% |
| South American | 65 | 2.8% |
| Spaniard | 9 | 0.4% |
| Swedish | 14 | 0.6% |
| Swiss | 27 | 1.1% |
| Turkish | 5 | 0.2% |
| Ukrainian | 5 | 0.2% | View All 45 Rows |
Immigrants in Westhampton Beach
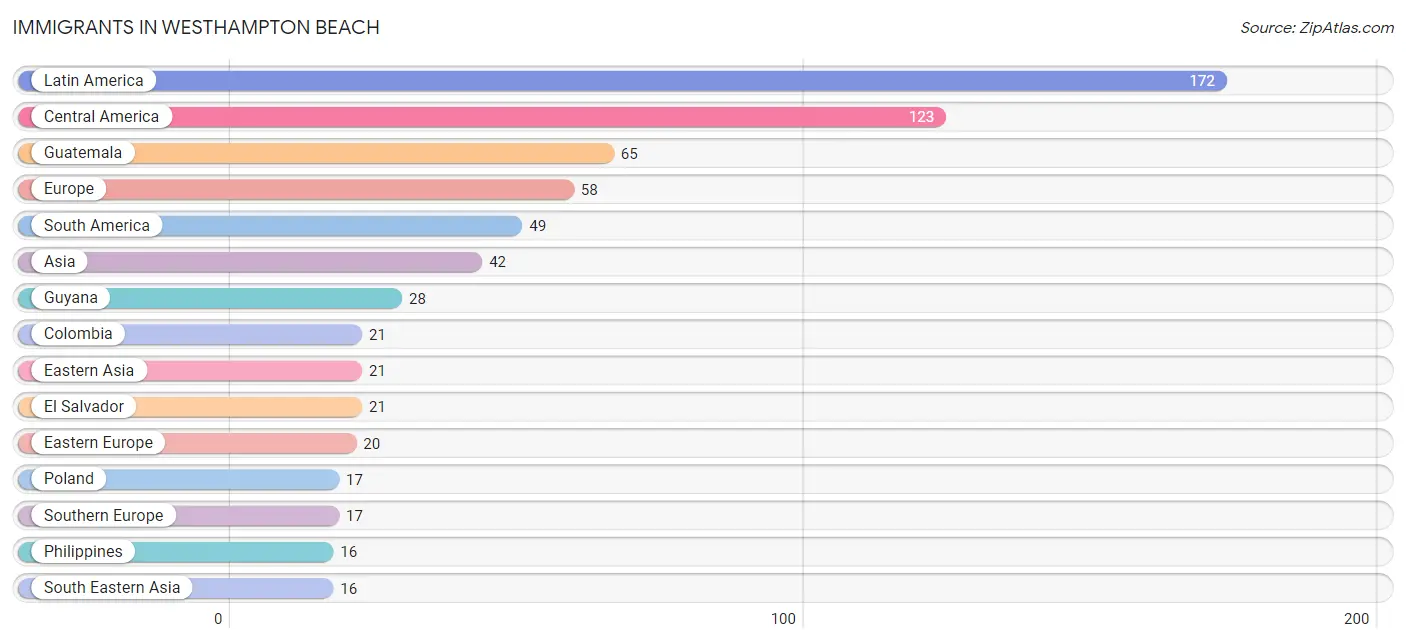
The most numerous immigrant groups reported in Westhampton Beach came from Latin America (172 | 7.3%), Central America (123 | 5.2%), Guatemala (65 | 2.8%), Europe (58 | 2.5%), and South America (49 | 2.1%), together accounting for 19.9% of all Westhampton Beach residents.
| Immigration Origin | # Population | % Population |
| Africa | 5 | 0.2% |
| Asia | 42 | 1.8% |
| Australia | 4 | 0.2% |
| Central America | 123 | 5.2% |
| China | 5 | 0.2% |
| Colombia | 21 | 0.9% |
| Costa Rica | 12 | 0.5% |
| Eastern Asia | 21 | 0.9% |
| Eastern Europe | 20 | 0.9% |
| El Salvador | 21 | 0.9% |
| Europe | 58 | 2.5% |
| Germany | 9 | 0.4% |
| Greece | 12 | 0.5% |
| Guatemala | 65 | 2.8% |
| Guyana | 28 | 1.2% |
| Honduras | 14 | 0.6% |
| Ireland | 4 | 0.2% |
| Italy | 5 | 0.2% |
| Japan | 13 | 0.5% |
| Korea | 3 | 0.1% |
| Latin America | 172 | 7.3% |
| Lithuania | 3 | 0.1% |
| Mexico | 11 | 0.5% |
| Northern Africa | 5 | 0.2% |
| Northern Europe | 12 | 0.5% |
| Oceania | 4 | 0.2% |
| Philippines | 16 | 0.7% |
| Poland | 17 | 0.7% |
| South America | 49 | 2.1% |
| South Eastern Asia | 16 | 0.7% |
| Southern Europe | 17 | 0.7% |
| Turkey | 5 | 0.2% |
| Western Asia | 5 | 0.2% |
| Western Europe | 9 | 0.4% | View All 34 Rows |
Sex and Age in Westhampton Beach
Sex and Age in Westhampton Beach
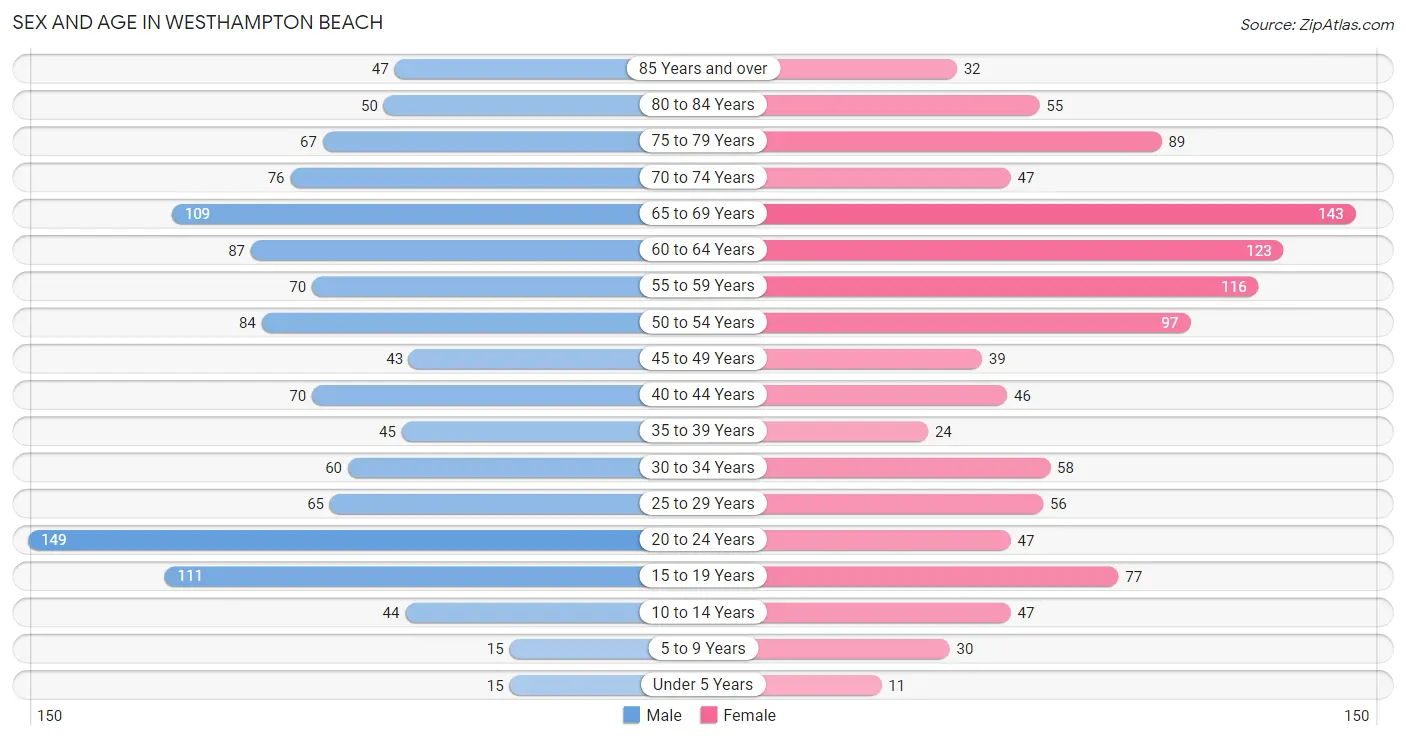
The most populous age groups in Westhampton Beach are 20 to 24 Years (149 | 12.3%) for men and 65 to 69 Years (143 | 12.6%) for women.
| Age Bracket | Male | Female |
| Under 5 Years | 15 (1.2%) | 11 (1.0%) |
| 5 to 9 Years | 15 (1.2%) | 30 (2.6%) |
| 10 to 14 Years | 44 (3.6%) | 47 (4.1%) |
| 15 to 19 Years | 111 (9.2%) | 77 (6.8%) |
| 20 to 24 Years | 149 (12.3%) | 47 (4.1%) |
| 25 to 29 Years | 65 (5.4%) | 56 (4.9%) |
| 30 to 34 Years | 60 (5.0%) | 58 (5.1%) |
| 35 to 39 Years | 45 (3.7%) | 24 (2.1%) |
| 40 to 44 Years | 70 (5.8%) | 46 (4.1%) |
| 45 to 49 Years | 43 (3.6%) | 39 (3.4%) |
| 50 to 54 Years | 84 (7.0%) | 97 (8.5%) |
| 55 to 59 Years | 70 (5.8%) | 116 (10.2%) |
| 60 to 64 Years | 87 (7.2%) | 123 (10.8%) |
| 65 to 69 Years | 109 (9.0%) | 143 (12.6%) |
| 70 to 74 Years | 76 (6.3%) | 47 (4.1%) |
| 75 to 79 Years | 67 (5.6%) | 89 (7.8%) |
| 80 to 84 Years | 50 (4.1%) | 55 (4.8%) |
| 85 Years and over | 47 (3.9%) | 32 (2.8%) |
| Total | 1,207 (100.0%) | 1,137 (100.0%) |
Families and Households in Westhampton Beach
Median Family Size in Westhampton Beach
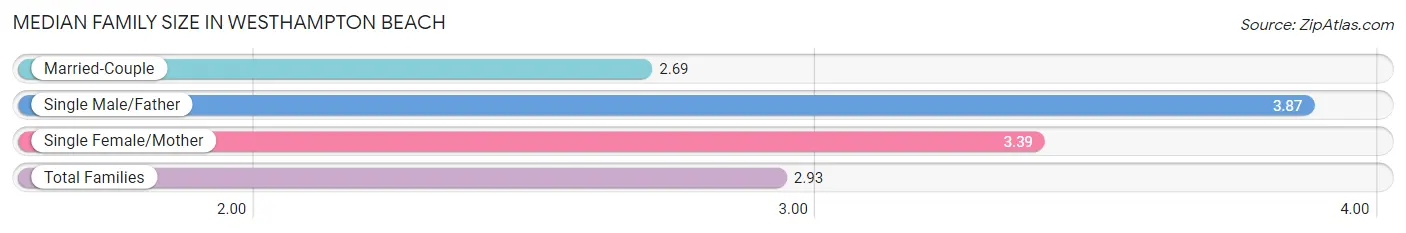
The median family size in Westhampton Beach is 2.93 persons per family, with single male/father families (83 | 14.1%) accounting for the largest median family size of 3.87 persons per family. On the other hand, married-couple families (438 | 74.5%) represent the smallest median family size with 2.69 persons per family.
| Family Type | # Families | Family Size |
| Married-Couple | 438 (74.5%) | 2.69 |
| Single Male/Father | 83 (14.1%) | 3.87 |
| Single Female/Mother | 67 (11.4%) | 3.39 |
| Total Families | 588 (100.0%) | 2.93 |
Median Household Size in Westhampton Beach
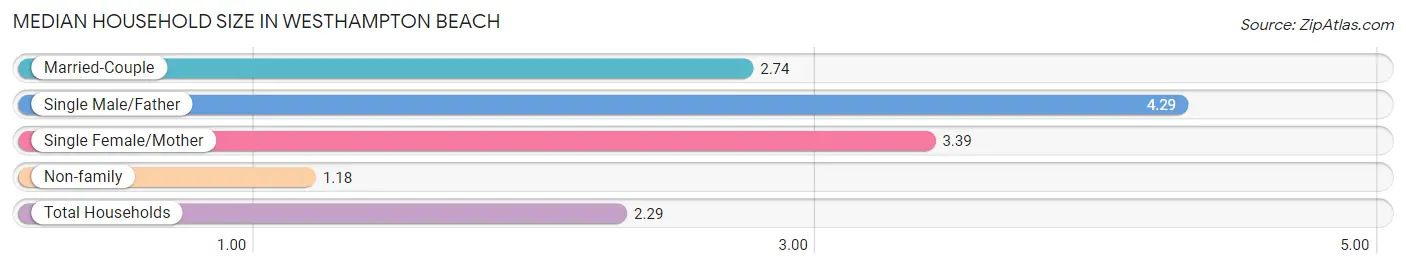
The median household size in Westhampton Beach is 2.29 persons per household, with single male/father households (83 | 8.5%) accounting for the largest median household size of 4.29 persons per household. non-family households (393 | 40.1%) represent the smallest median household size with 1.18 persons per household.
| Household Type | # Households | Household Size |
| Married-Couple | 438 (44.7%) | 2.74 |
| Single Male/Father | 83 (8.5%) | 4.29 |
| Single Female/Mother | 67 (6.8%) | 3.39 |
| Non-family | 393 (40.1%) | 1.18 |
| Total Households | 981 (100.0%) | 2.29 |
Household Size by Marriage Status in Westhampton Beach
Out of a total of 981 households in Westhampton Beach, 588 (59.9%) are family households, while 393 (40.1%) are nonfamily households. The most numerous type of family households are 2-person households, comprising 291, and the most common type of nonfamily households are 1-person households, comprising 335.
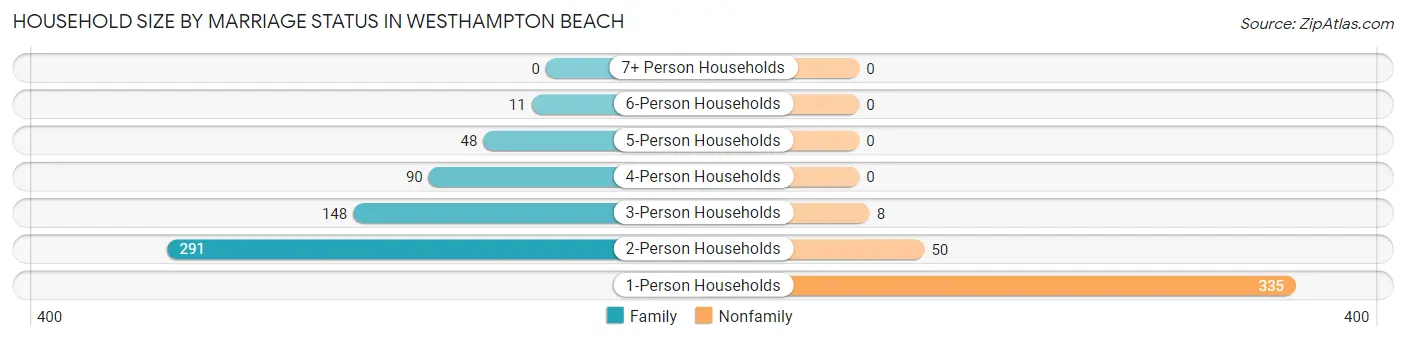
| Household Size | Family Households | Nonfamily Households |
| 1-Person Households | - | 335 (34.2%) |
| 2-Person Households | 291 (29.7%) | 50 (5.1%) |
| 3-Person Households | 148 (15.1%) | 8 (0.8%) |
| 4-Person Households | 90 (9.2%) | 0 (0.0%) |
| 5-Person Households | 48 (4.9%) | 0 (0.0%) |
| 6-Person Households | 11 (1.1%) | 0 (0.0%) |
| 7+ Person Households | 0 (0.0%) | 0 (0.0%) |
| Total | 588 (59.9%) | 393 (40.1%) |
Female Fertility in Westhampton Beach
Fertility by Age in Westhampton Beach
| Age Bracket | Women with Births | Births / 1,000 Women |
| 15 to 19 years | 0 (0.0%) | 0.0 |
| 20 to 34 years | 0 (0.0%) | 0.0 |
| 35 to 50 years | 0 (0.0%) | 0.0 |
| Total | 0 (0.0%) | 0.0 |
Fertility by Age by Marriage Status in Westhampton Beach
| Age Bracket | Married | Unmarried |
| 15 to 19 years | 0 (0.0%) | 0 (0.0%) |
| 20 to 34 years | 0 (0.0%) | 0 (0.0%) |
| 35 to 50 years | 0 (0.0%) | 0 (0.0%) |
| Total | 0 (0.0%) | 0 (0.0%) |
Fertility by Education in Westhampton Beach
| Educational Attainment | Women with Births | Births / 1,000 Women |
| Less than High School | 0 (0.0%) | 0.0 |
| High School Diploma | 0 (0.0%) | 0.0 |
| College or Associate's Degree | 0 (0.0%) | 0.0 |
| Bachelor's Degree | 0 (0.0%) | 0.0 |
| Graduate Degree | 0 (0.0%) | 0.0 |
| Total | 0 (0.0%) | 0.0 |
Fertility by Education by Marriage Status in Westhampton Beach
| Educational Attainment | Married | Unmarried |
| Less than High School | 0 (0.0%) | 0 (0.0%) |
| High School Diploma | 0 (0.0%) | 0 (0.0%) |
| College or Associate's Degree | 0 (0.0%) | 0 (0.0%) |
| Bachelor's Degree | 0 (0.0%) | 0 (0.0%) |
| Graduate Degree | 0 (0.0%) | 0 (0.0%) |
| Total | 0 (0.0%) | 0 (0.0%) |
Employment Characteristics in Westhampton Beach
Employment by Class of Employer in Westhampton Beach
Among the 1,140 employed individuals in Westhampton Beach, private company employees (683 | 59.9%), self-employed (incorporated) (143 | 12.5%), and not-for-profit organizations (111 | 9.7%) make up the most common classes of employment.
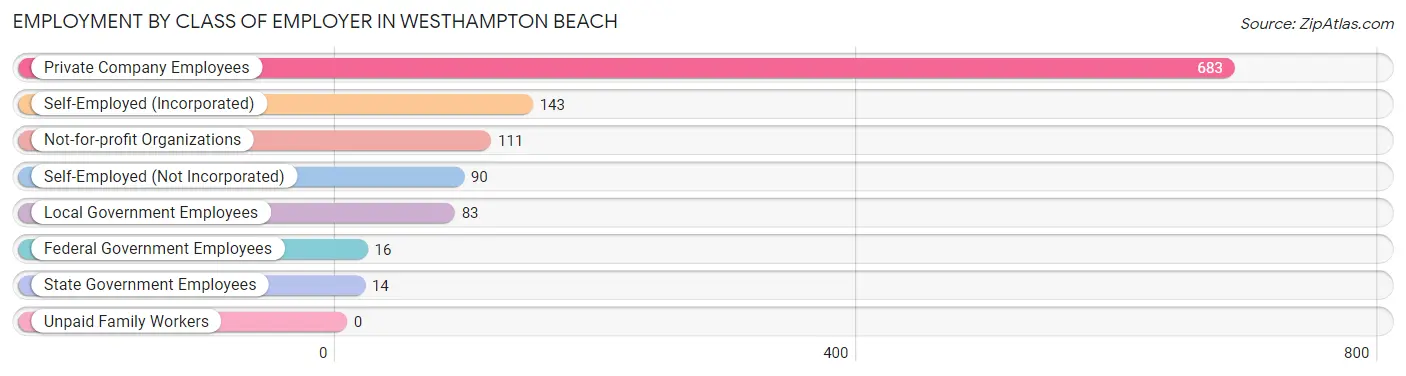
| Employer Class | # Employees | % Employees |
| Private Company Employees | 683 | 59.9% |
| Self-Employed (Incorporated) | 143 | 12.5% |
| Self-Employed (Not Incorporated) | 90 | 7.9% |
| Not-for-profit Organizations | 111 | 9.7% |
| Local Government Employees | 83 | 7.3% |
| State Government Employees | 14 | 1.2% |
| Federal Government Employees | 16 | 1.4% |
| Unpaid Family Workers | 0 | 0.0% |
| Total | 1,140 | 100.0% |
Employment Status by Age in Westhampton Beach
According to the labor force statistics for Westhampton Beach, out of the total population over 16 years of age (2,172), 56.3% or 1,223 individuals are in the labor force, with 3.7% or 45 of them unemployed. The age group with the highest labor force participation rate is 25 to 29 years, with 97.5% or 118 individuals in the labor force. Within the labor force, the 20 to 24 years age range has the highest percentage of unemployed individuals, with 20.2% or 33 of them being unemployed.
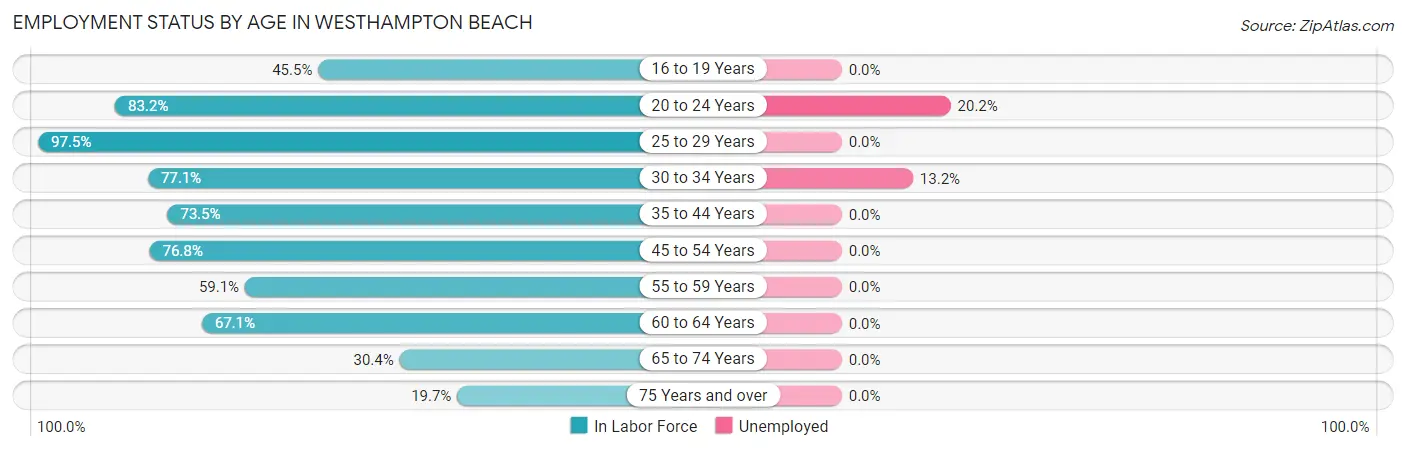
| Age Bracket | In Labor Force | Unemployed |
| 16 to 19 Years | 81 (45.5%) | 0 (0.0%) |
| 20 to 24 Years | 163 (83.2%) | 33 (20.2%) |
| 25 to 29 Years | 118 (97.5%) | 0 (0.0%) |
| 30 to 34 Years | 91 (77.1%) | 12 (13.2%) |
| 35 to 44 Years | 136 (73.5%) | 0 (0.0%) |
| 45 to 54 Years | 202 (76.8%) | 0 (0.0%) |
| 55 to 59 Years | 110 (59.1%) | 0 (0.0%) |
| 60 to 64 Years | 141 (67.1%) | 0 (0.0%) |
| 65 to 74 Years | 114 (30.4%) | 0 (0.0%) |
| 75 Years and over | 67 (19.7%) | 0 (0.0%) |
| Total | 1,223 (56.3%) | 45 (3.7%) |
Employment Status by Educational Attainment in Westhampton Beach
According to labor force statistics for Westhampton Beach, 73.7% of individuals (798) out of the total population between 25 and 64 years of age (1,083) are in the labor force, with 1.5% or 12 of them being unemployed. The group with the highest labor force participation rate are those with the educational attainment of bachelor's degree or higher, with 79.4% or 523 individuals in the labor force. Within the labor force, individuals with college / associate degree education have the highest percentage of unemployment, with 12.8% or 12 of them being unemployed.
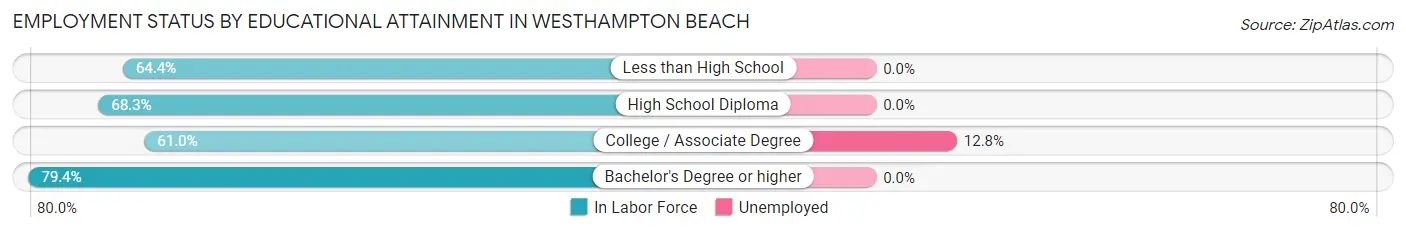
| Educational Attainment | In Labor Force | Unemployed |
| Less than High School | 58 (64.4%) | 0 (0.0%) |
| High School Diploma | 123 (68.3%) | 0 (0.0%) |
| College / Associate Degree | 94 (61.0%) | 20 (12.8%) |
| Bachelor's Degree or higher | 523 (79.4%) | 0 (0.0%) |
| Total | 798 (73.7%) | 16 (1.5%) |
Employment Occupations by Sex in Westhampton Beach
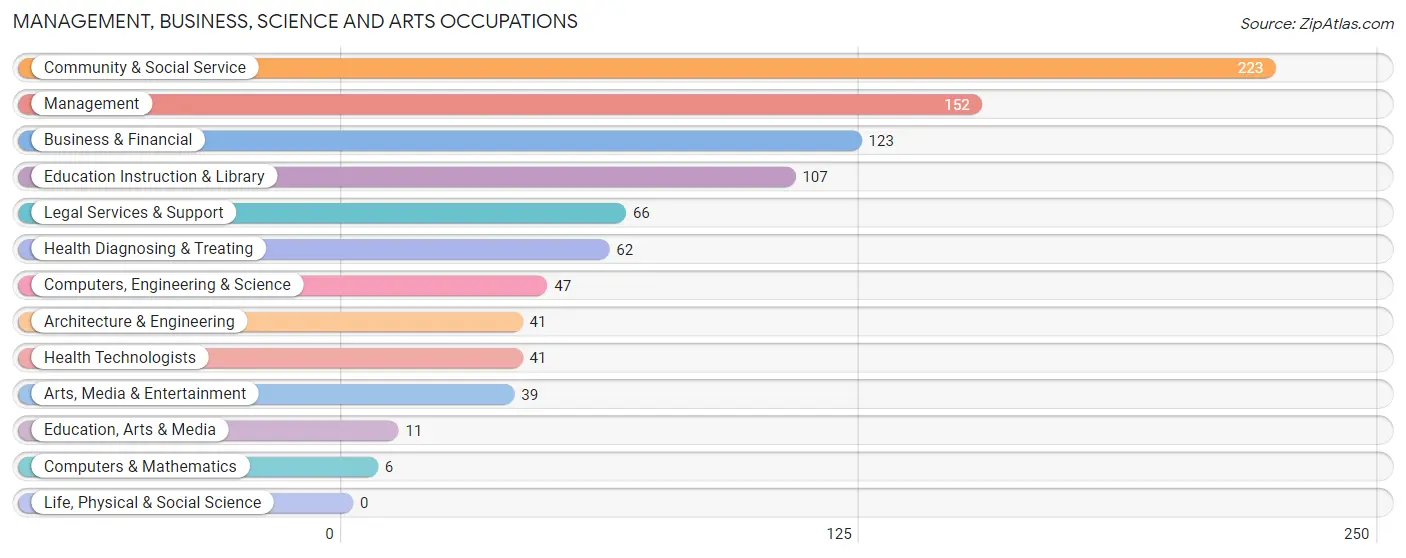
Management, Business, Science and Arts Occupations
The most common Management, Business, Science and Arts occupations in Westhampton Beach are Community & Social Service (223 | 18.9%), Management (152 | 12.9%), Business & Financial (123 | 10.4%), Education Instruction & Library (107 | 9.1%), and Legal Services & Support (66 | 5.6%).
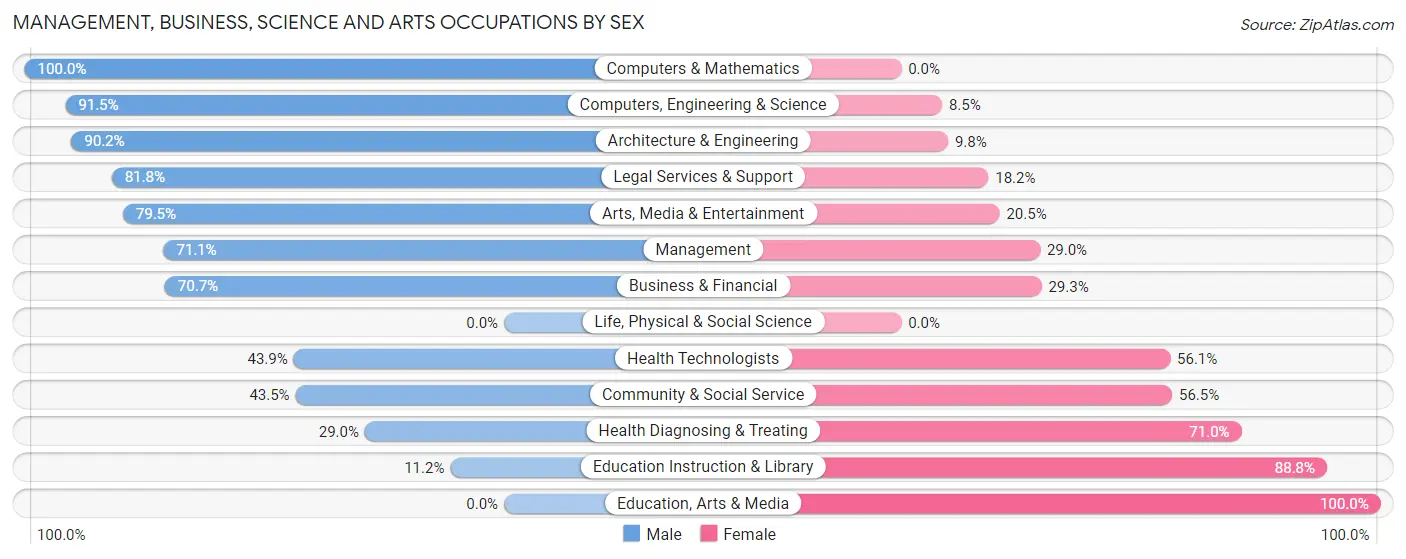
Management, Business, Science and Arts Occupations by Sex
Within the Management, Business, Science and Arts occupations in Westhampton Beach, the most male-oriented occupations are Computers & Mathematics (100.0%), Computers, Engineering & Science (91.5%), and Architecture & Engineering (90.2%), while the most female-oriented occupations are Education, Arts & Media (100.0%), Education Instruction & Library (88.8%), and Health Diagnosing & Treating (71.0%).
| Occupation | Male | Female |
| Management | 108 (71.1%) | 44 (28.9%) |
| Business & Financial | 87 (70.7%) | 36 (29.3%) |
| Computers, Engineering & Science | 43 (91.5%) | 4 (8.5%) |
| Computers & Mathematics | 6 (100.0%) | 0 (0.0%) |
| Architecture & Engineering | 37 (90.2%) | 4 (9.8%) |
| Life, Physical & Social Science | 0 (0.0%) | 0 (0.0%) |
| Community & Social Service | 97 (43.5%) | 126 (56.5%) |
| Education, Arts & Media | 0 (0.0%) | 11 (100.0%) |
| Legal Services & Support | 54 (81.8%) | 12 (18.2%) |
| Education Instruction & Library | 12 (11.2%) | 95 (88.8%) |
| Arts, Media & Entertainment | 31 (79.5%) | 8 (20.5%) |
| Health Diagnosing & Treating | 18 (29.0%) | 44 (71.0%) |
| Health Technologists | 18 (43.9%) | 23 (56.1%) |
| Total (Category) | 353 (58.2%) | 254 (41.8%) |
| Total (Overall) | 678 (57.6%) | 500 (42.4%) |
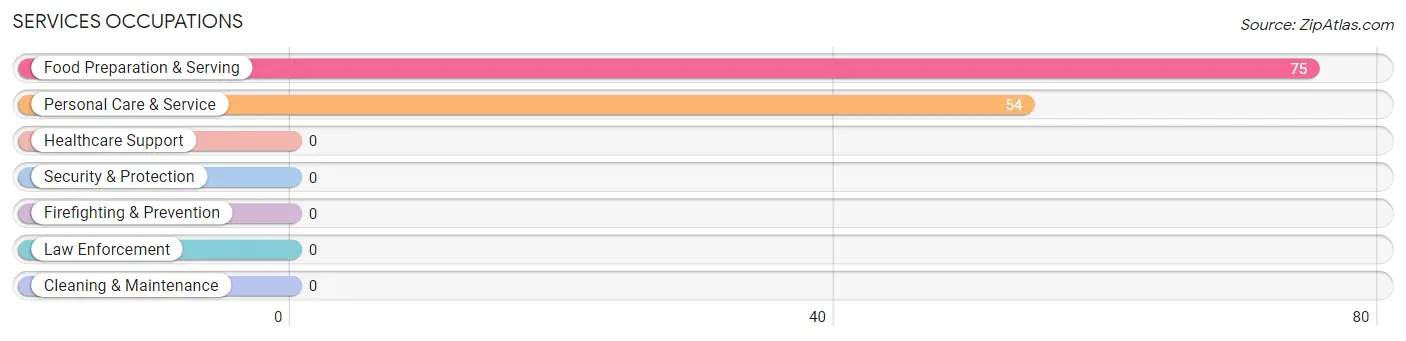
Services Occupations
The most common Services occupations in Westhampton Beach are Food Preparation & Serving (75 | 6.4%), and Personal Care & Service (54 | 4.6%).
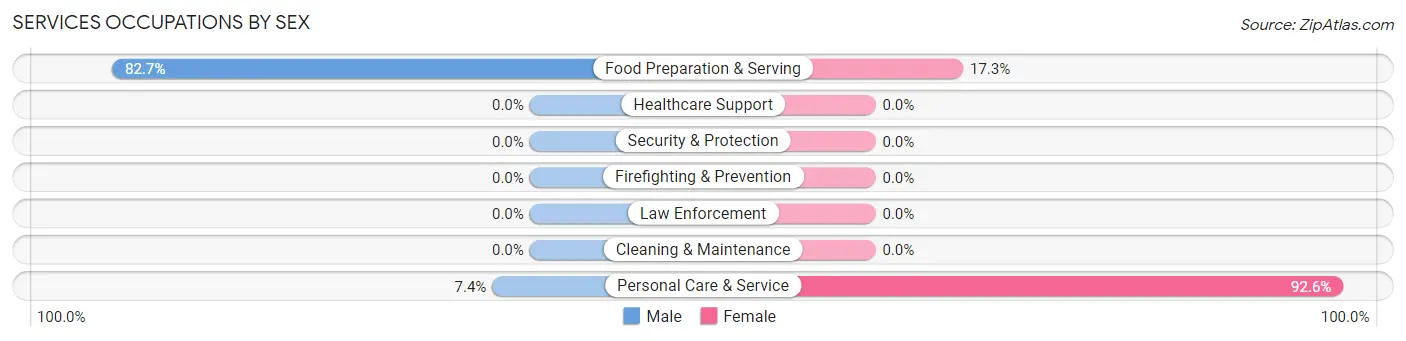
Services Occupations by Sex
Within the Services occupations in Westhampton Beach, the most male-oriented occupations are Food Preparation & Serving (82.7%), and Personal Care & Service (7.4%), while the most female-oriented occupations are Personal Care & Service (92.6%), and Food Preparation & Serving (17.3%).
| Occupation | Male | Female |
| Healthcare Support | 0 (0.0%) | 0 (0.0%) |
| Security & Protection | 0 (0.0%) | 0 (0.0%) |
| Firefighting & Prevention | 0 (0.0%) | 0 (0.0%) |
| Law Enforcement | 0 (0.0%) | 0 (0.0%) |
| Food Preparation & Serving | 62 (82.7%) | 13 (17.3%) |
| Cleaning & Maintenance | 0 (0.0%) | 0 (0.0%) |
| Personal Care & Service | 4 (7.4%) | 50 (92.6%) |
| Total (Category) | 66 (51.2%) | 63 (48.8%) |
| Total (Overall) | 678 (57.6%) | 500 (42.4%) |
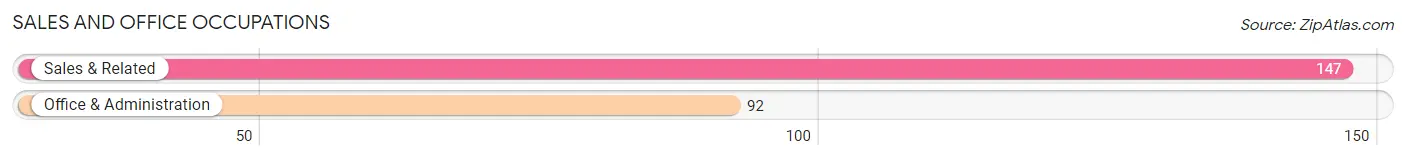
Sales and Office Occupations
The most common Sales and Office occupations in Westhampton Beach are Sales & Related (147 | 12.5%), and Office & Administration (92 | 7.8%).
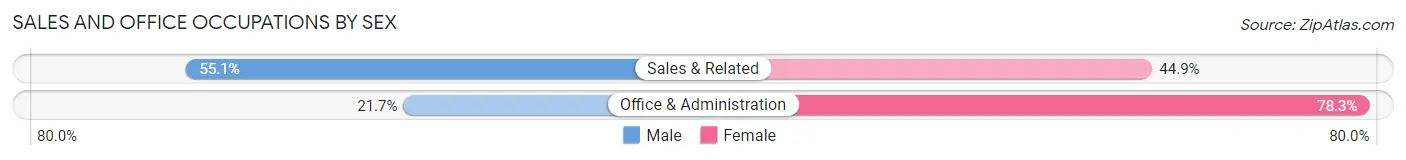
Sales and Office Occupations by Sex
| Occupation | Male | Female |
| Sales & Related | 81 (55.1%) | 66 (44.9%) |
| Office & Administration | 20 (21.7%) | 72 (78.3%) |
| Total (Category) | 101 (42.3%) | 138 (57.7%) |
| Total (Overall) | 678 (57.6%) | 500 (42.4%) |
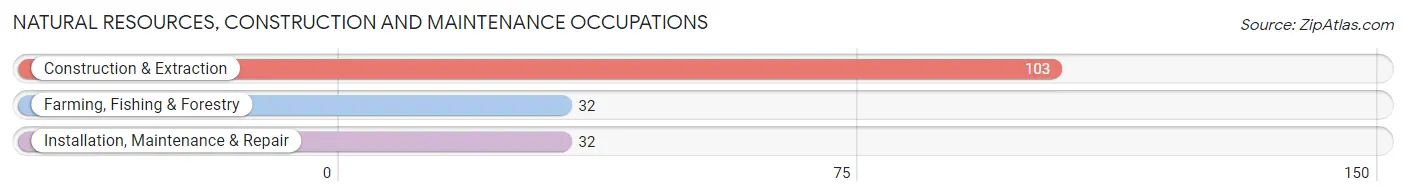
Natural Resources, Construction and Maintenance Occupations
The most common Natural Resources, Construction and Maintenance occupations in Westhampton Beach are Construction & Extraction (103 | 8.7%), Farming, Fishing & Forestry (32 | 2.7%), and Installation, Maintenance & Repair (32 | 2.7%).
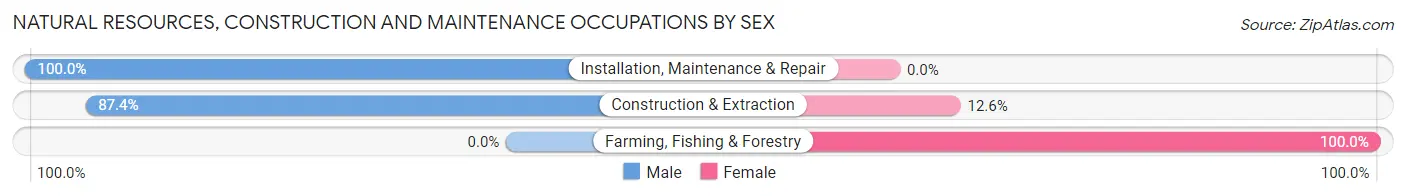
Natural Resources, Construction and Maintenance Occupations by Sex
| Occupation | Male | Female |
| Farming, Fishing & Forestry | 0 (0.0%) | 32 (100.0%) |
| Construction & Extraction | 90 (87.4%) | 13 (12.6%) |
| Installation, Maintenance & Repair | 32 (100.0%) | 0 (0.0%) |
| Total (Category) | 122 (73.1%) | 45 (27.0%) |
| Total (Overall) | 678 (57.6%) | 500 (42.4%) |
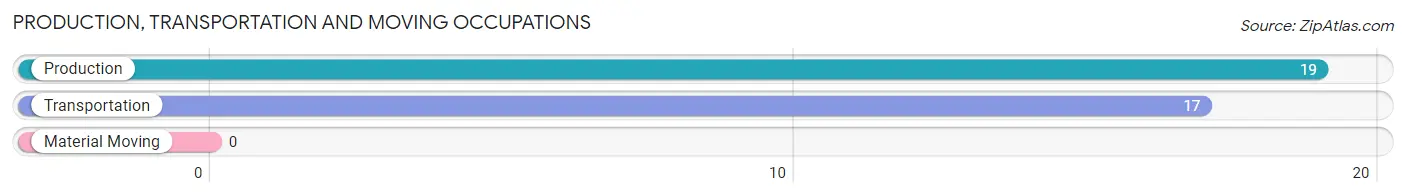
Production, Transportation and Moving Occupations
The most common Production, Transportation and Moving occupations in Westhampton Beach are Production (19 | 1.6%), and Transportation (17 | 1.4%).
Production, Transportation and Moving Occupations by Sex
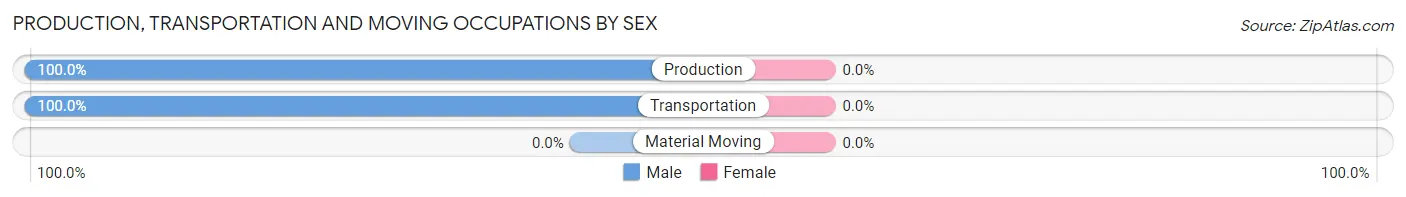
| Occupation | Male | Female |
| Production | 19 (100.0%) | 0 (0.0%) |
| Transportation | 17 (100.0%) | 0 (0.0%) |
| Material Moving | 0 (0.0%) | 0 (0.0%) |
| Total (Category) | 36 (100.0%) | 0 (0.0%) |
| Total (Overall) | 678 (57.6%) | 500 (42.4%) |
Employment Industries by Sex in Westhampton Beach
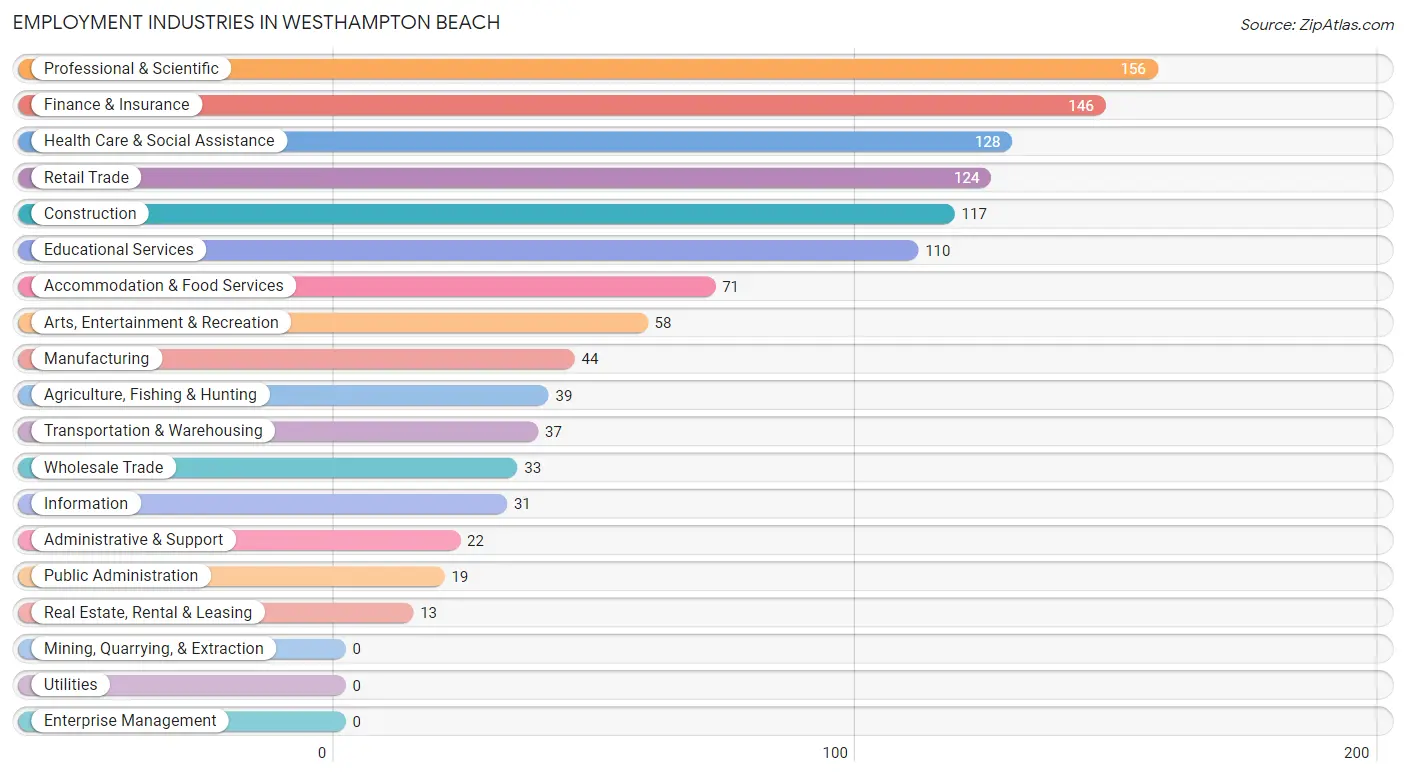
Employment Industries in Westhampton Beach
The major employment industries in Westhampton Beach include Professional & Scientific (156 | 13.2%), Finance & Insurance (146 | 12.4%), Health Care & Social Assistance (128 | 10.9%), Retail Trade (124 | 10.5%), and Construction (117 | 9.9%).
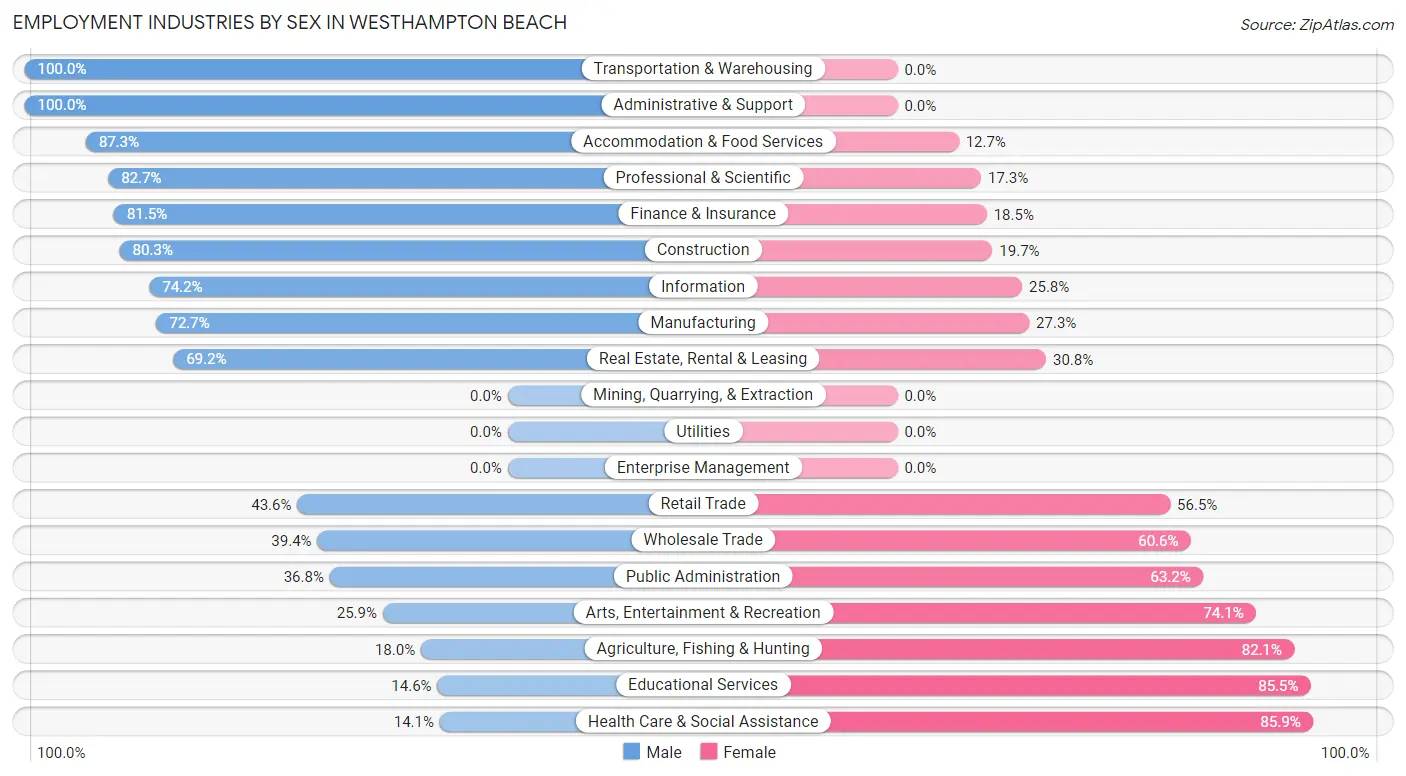
Employment Industries by Sex in Westhampton Beach
The Westhampton Beach industries that see more men than women are Transportation & Warehousing (100.0%), Administrative & Support (100.0%), and Accommodation & Food Services (87.3%), whereas the industries that tend to have a higher number of women are Health Care & Social Assistance (85.9%), Educational Services (85.5%), and Agriculture, Fishing & Hunting (82.1%).
| Industry | Male | Female |
| Agriculture, Fishing & Hunting | 7 (17.9%) | 32 (82.1%) |
| Mining, Quarrying, & Extraction | 0 (0.0%) | 0 (0.0%) |
| Construction | 94 (80.3%) | 23 (19.7%) |
| Manufacturing | 32 (72.7%) | 12 (27.3%) |
| Wholesale Trade | 13 (39.4%) | 20 (60.6%) |
| Retail Trade | 54 (43.5%) | 70 (56.5%) |
| Transportation & Warehousing | 37 (100.0%) | 0 (0.0%) |
| Utilities | 0 (0.0%) | 0 (0.0%) |
| Information | 23 (74.2%) | 8 (25.8%) |
| Finance & Insurance | 119 (81.5%) | 27 (18.5%) |
| Real Estate, Rental & Leasing | 9 (69.2%) | 4 (30.8%) |
| Professional & Scientific | 129 (82.7%) | 27 (17.3%) |
| Enterprise Management | 0 (0.0%) | 0 (0.0%) |
| Administrative & Support | 22 (100.0%) | 0 (0.0%) |
| Educational Services | 16 (14.5%) | 94 (85.5%) |
| Health Care & Social Assistance | 18 (14.1%) | 110 (85.9%) |
| Arts, Entertainment & Recreation | 15 (25.9%) | 43 (74.1%) |
| Accommodation & Food Services | 62 (87.3%) | 9 (12.7%) |
| Public Administration | 7 (36.8%) | 12 (63.2%) |
| Total | 678 (57.6%) | 500 (42.4%) |
Education in Westhampton Beach
School Enrollment in Westhampton Beach
The most common levels of schooling among the 442 students in Westhampton Beach are college / undergraduate (192 | 43.4%), high school (127 | 28.7%), and middle school (61 | 13.8%).
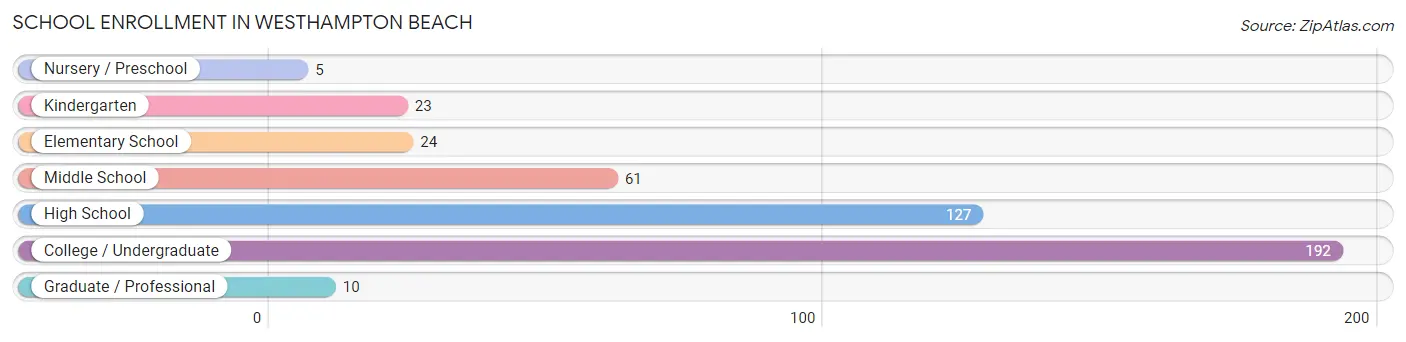
| School Level | # Students | % Students |
| Nursery / Preschool | 5 | 1.1% |
| Kindergarten | 23 | 5.2% |
| Elementary School | 24 | 5.4% |
| Middle School | 61 | 13.8% |
| High School | 127 | 28.7% |
| College / Undergraduate | 192 | 43.4% |
| Graduate / Professional | 10 | 2.3% |
| Total | 442 | 100.0% |
School Enrollment by Age by Funding Source in Westhampton Beach
Out of a total of 442 students who are enrolled in schools in Westhampton Beach, 96 (21.7%) attend a private institution, while the remaining 346 (78.3%) are enrolled in public schools. The age group of 20 to 24 year olds has the highest likelihood of being enrolled in private schools, with 33 (33.7% in the age bracket) enrolled. Conversely, the age group of 3 to 4 year olds has the lowest likelihood of being enrolled in a private school, with 3 (100.0% in the age bracket) attending a public institution.
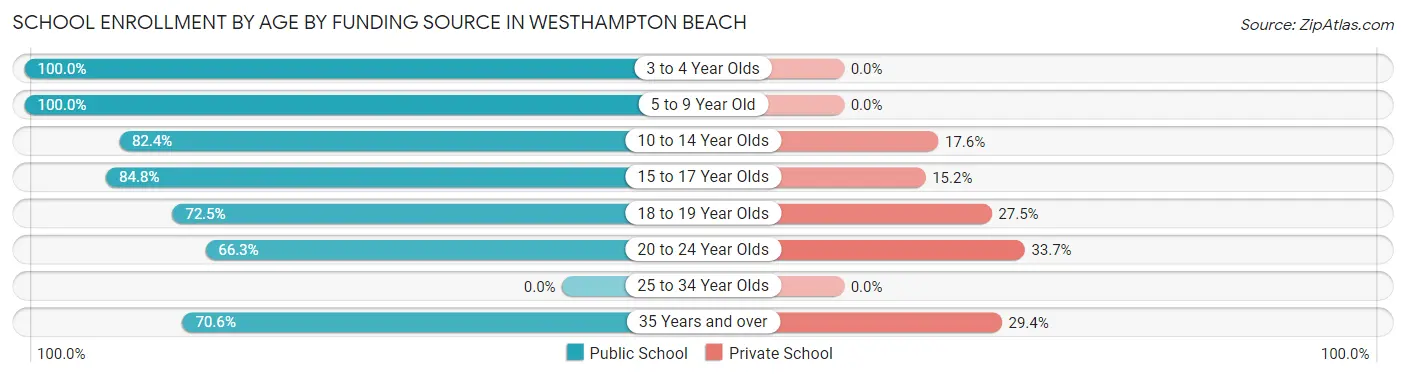
| Age Bracket | Public School | Private School |
| 3 to 4 Year Olds | 3 (100.0%) | 0 (0.0%) |
| 5 to 9 Year Old | 45 (100.0%) | 0 (0.0%) |
| 10 to 14 Year Olds | 75 (82.4%) | 16 (17.6%) |
| 15 to 17 Year Olds | 67 (84.8%) | 12 (15.2%) |
| 18 to 19 Year Olds | 79 (72.5%) | 30 (27.5%) |
| 20 to 24 Year Olds | 65 (66.3%) | 33 (33.7%) |
| 25 to 34 Year Olds | 0 (0.0%) | 0 (0.0%) |
| 35 Years and over | 12 (70.6%) | 5 (29.4%) |
| Total | 346 (78.3%) | 96 (21.7%) |
Educational Attainment by Field of Study in Westhampton Beach
Business (200 | 16.4%), social sciences (146 | 11.9%), liberal arts & history (136 | 11.1%), education (133 | 10.9%), and literature & languages (101 | 8.3%) are the most common fields of study among 1,222 individuals in Westhampton Beach who have obtained a bachelor's degree or higher.
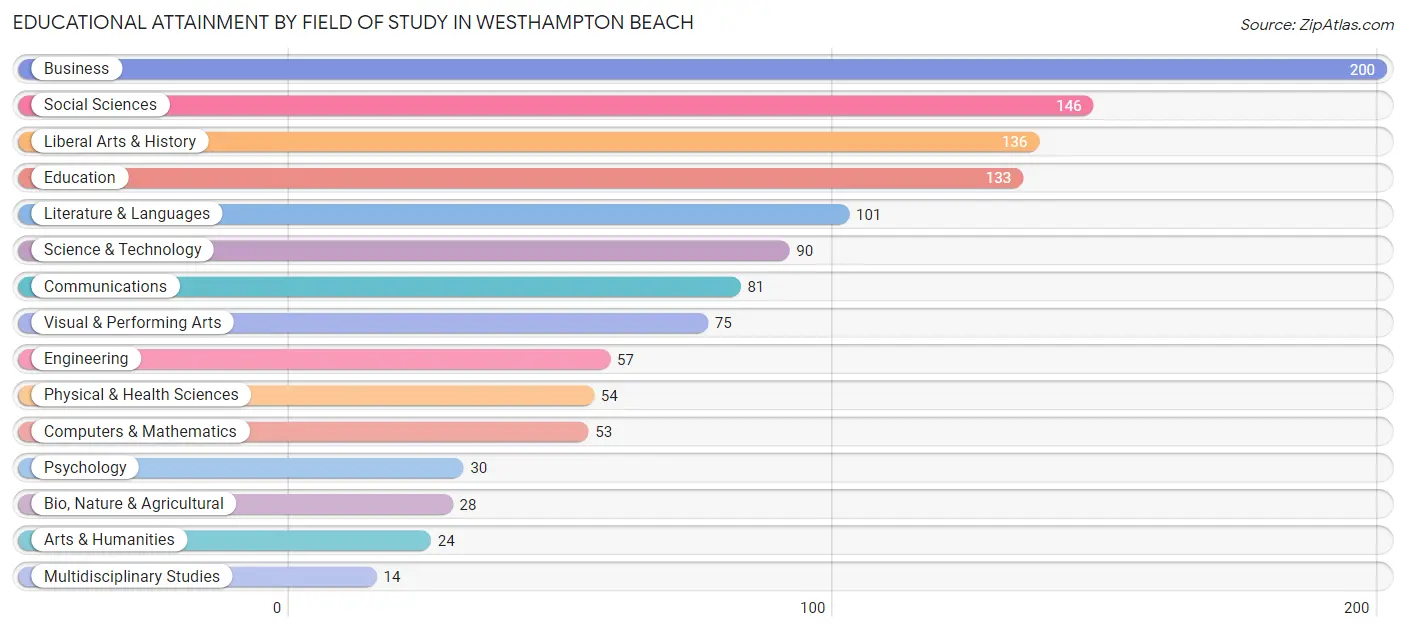
| Field of Study | # Graduates | % Graduates |
| Computers & Mathematics | 53 | 4.3% |
| Bio, Nature & Agricultural | 28 | 2.3% |
| Physical & Health Sciences | 54 | 4.4% |
| Psychology | 30 | 2.5% |
| Social Sciences | 146 | 11.9% |
| Engineering | 57 | 4.7% |
| Multidisciplinary Studies | 14 | 1.1% |
| Science & Technology | 90 | 7.4% |
| Business | 200 | 16.4% |
| Education | 133 | 10.9% |
| Literature & Languages | 101 | 8.3% |
| Liberal Arts & History | 136 | 11.1% |
| Visual & Performing Arts | 75 | 6.1% |
| Communications | 81 | 6.6% |
| Arts & Humanities | 24 | 2.0% |
| Total | 1,222 | 100.0% |
Transportation & Commute in Westhampton Beach
Vehicle Availability by Sex in Westhampton Beach
The most prevalent vehicle ownership categories in Westhampton Beach are males with 3 vehicles (229, accounting for 35.8%) and females with 3 vehicles (83, making up 47.4%).
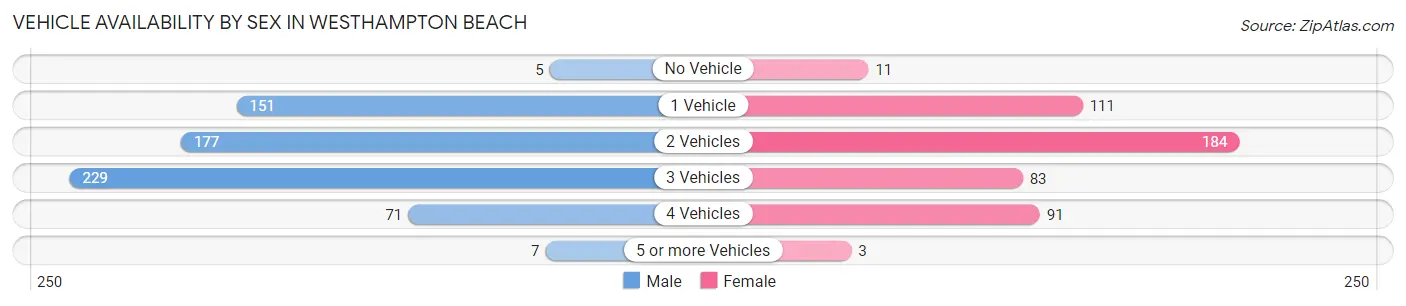
| Vehicles Available | Male | Female |
| No Vehicle | 5 (0.8%) | 11 (2.3%) |
| 1 Vehicle | 151 (23.6%) | 111 (23.0%) |
| 2 Vehicles | 177 (27.7%) | 184 (38.1%) |
| 3 Vehicles | 229 (35.8%) | 83 (17.2%) |
| 4 Vehicles | 71 (11.1%) | 91 (18.8%) |
| 5 or more Vehicles | 7 (1.1%) | 3 (0.6%) |
| Total | 640 (100.0%) | 483 (100.0%) |
Commute Time in Westhampton Beach
The most frequently occuring commute durations in Westhampton Beach are 10 to 14 minutes (165 commuters, 18.0%), less than 5 minutes (121 commuters, 13.2%), and 45 to 59 minutes (93 commuters, 10.2%).
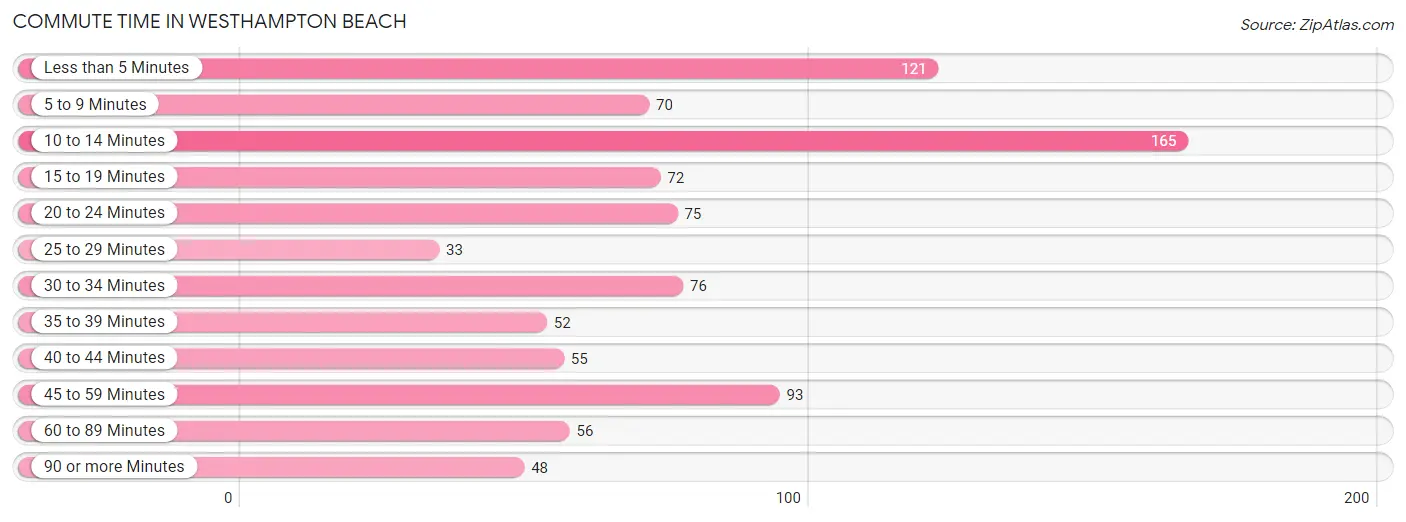
| Commute Time | # Commuters | % Commuters |
| Less than 5 Minutes | 121 | 13.2% |
| 5 to 9 Minutes | 70 | 7.6% |
| 10 to 14 Minutes | 165 | 18.0% |
| 15 to 19 Minutes | 72 | 7.9% |
| 20 to 24 Minutes | 75 | 8.2% |
| 25 to 29 Minutes | 33 | 3.6% |
| 30 to 34 Minutes | 76 | 8.3% |
| 35 to 39 Minutes | 52 | 5.7% |
| 40 to 44 Minutes | 55 | 6.0% |
| 45 to 59 Minutes | 93 | 10.2% |
| 60 to 89 Minutes | 56 | 6.1% |
| 90 or more Minutes | 48 | 5.2% |
Commute Time by Sex in Westhampton Beach
The most common commute times in Westhampton Beach are 45 to 59 minutes (84 commuters, 16.3%) for males and 10 to 14 minutes (97 commuters, 24.2%) for females.
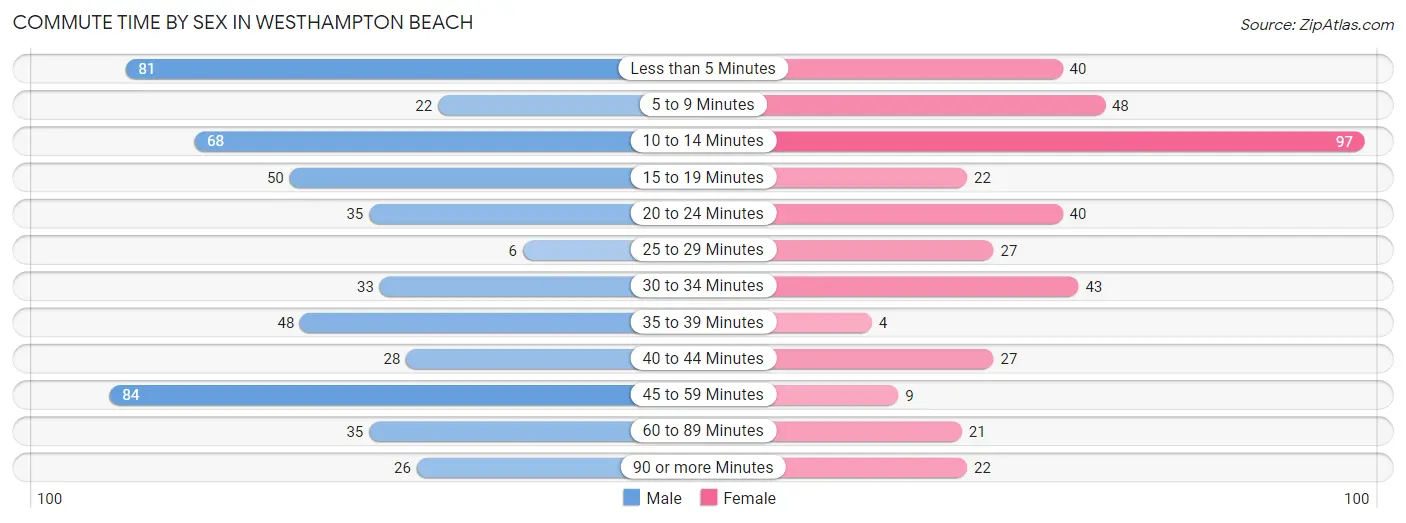
| Commute Time | Male | Female |
| Less than 5 Minutes | 81 (15.7%) | 40 (10.0%) |
| 5 to 9 Minutes | 22 (4.3%) | 48 (12.0%) |
| 10 to 14 Minutes | 68 (13.2%) | 97 (24.2%) |
| 15 to 19 Minutes | 50 (9.7%) | 22 (5.5%) |
| 20 to 24 Minutes | 35 (6.8%) | 40 (10.0%) |
| 25 to 29 Minutes | 6 (1.2%) | 27 (6.8%) |
| 30 to 34 Minutes | 33 (6.4%) | 43 (10.7%) |
| 35 to 39 Minutes | 48 (9.3%) | 4 (1.0%) |
| 40 to 44 Minutes | 28 (5.4%) | 27 (6.8%) |
| 45 to 59 Minutes | 84 (16.3%) | 9 (2.2%) |
| 60 to 89 Minutes | 35 (6.8%) | 21 (5.2%) |
| 90 or more Minutes | 26 (5.0%) | 22 (5.5%) |
Time of Departure to Work by Sex in Westhampton Beach
The most frequent times of departure to work in Westhampton Beach are 7:00 AM to 7:29 AM (145, 28.1%) for males and 8:00 AM to 8:29 AM (89, 22.3%) for females.
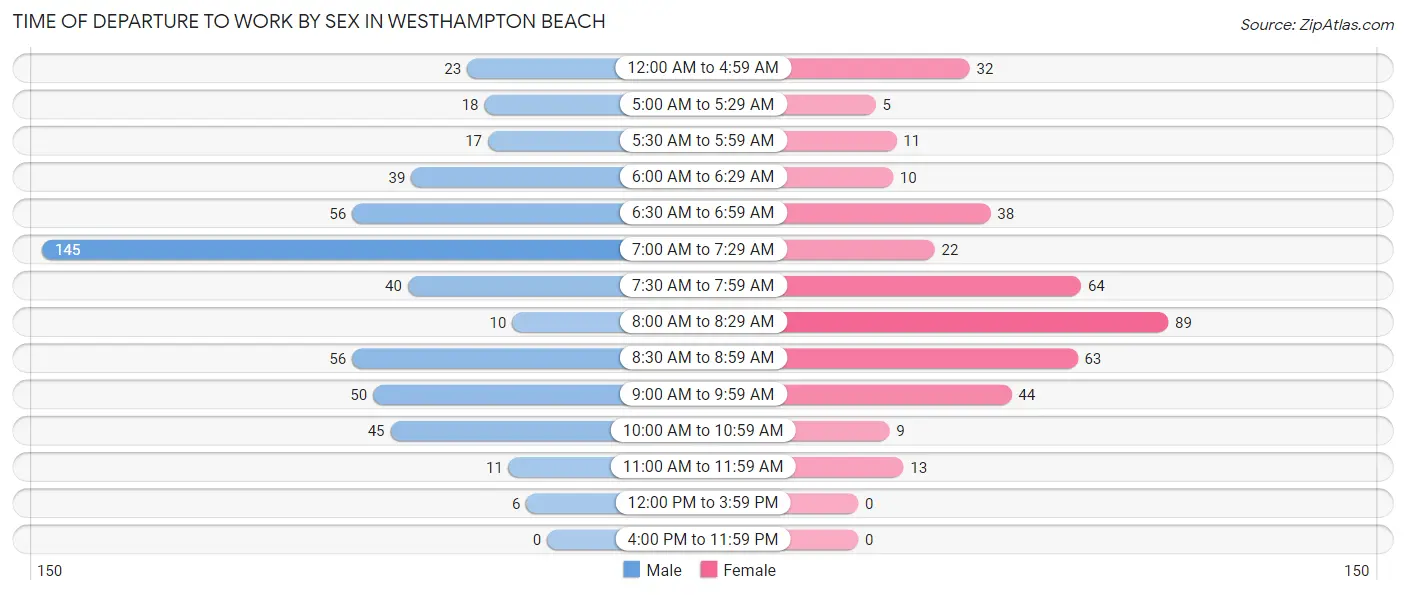
| Time of Departure | Male | Female |
| 12:00 AM to 4:59 AM | 23 (4.5%) | 32 (8.0%) |
| 5:00 AM to 5:29 AM | 18 (3.5%) | 5 (1.3%) |
| 5:30 AM to 5:59 AM | 17 (3.3%) | 11 (2.8%) |
| 6:00 AM to 6:29 AM | 39 (7.6%) | 10 (2.5%) |
| 6:30 AM to 6:59 AM | 56 (10.8%) | 38 (9.5%) |
| 7:00 AM to 7:29 AM | 145 (28.1%) | 22 (5.5%) |
| 7:30 AM to 7:59 AM | 40 (7.7%) | 64 (16.0%) |
| 8:00 AM to 8:29 AM | 10 (1.9%) | 89 (22.3%) |
| 8:30 AM to 8:59 AM | 56 (10.8%) | 63 (15.8%) |
| 9:00 AM to 9:59 AM | 50 (9.7%) | 44 (11.0%) |
| 10:00 AM to 10:59 AM | 45 (8.7%) | 9 (2.2%) |
| 11:00 AM to 11:59 AM | 11 (2.1%) | 13 (3.3%) |
| 12:00 PM to 3:59 PM | 6 (1.2%) | 0 (0.0%) |
| 4:00 PM to 11:59 PM | 0 (0.0%) | 0 (0.0%) |
| Total | 516 (100.0%) | 400 (100.0%) |
Housing Occupancy in Westhampton Beach
Occupancy by Ownership in Westhampton Beach
Of the total 981 dwellings in Westhampton Beach, owner-occupied units account for 861 (87.8%), while renter-occupied units make up 120 (12.2%).
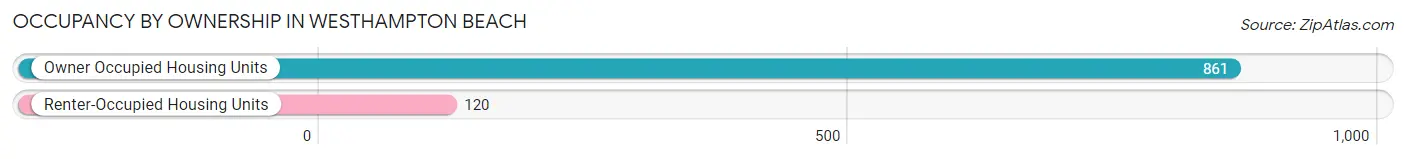
| Occupancy | # Housing Units | % Housing Units |
| Owner Occupied Housing Units | 861 | 87.8% |
| Renter-Occupied Housing Units | 120 | 12.2% |
| Total Occupied Housing Units | 981 | 100.0% |
Occupancy by Household Size in Westhampton Beach
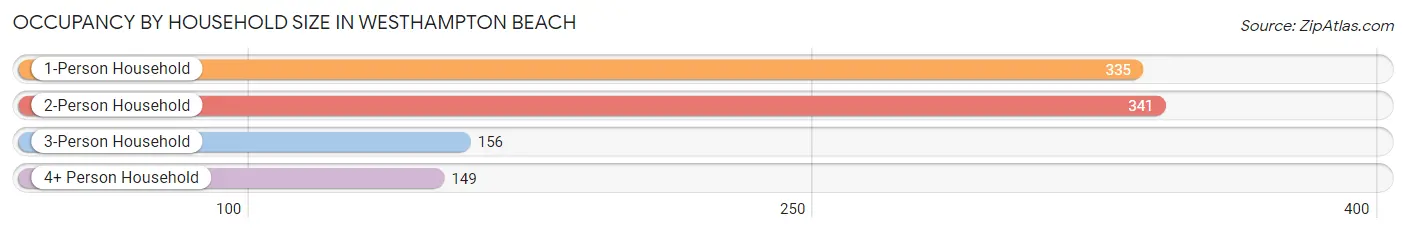
| Household Size | # Housing Units | % Housing Units |
| 1-Person Household | 335 | 34.2% |
| 2-Person Household | 341 | 34.8% |
| 3-Person Household | 156 | 15.9% |
| 4+ Person Household | 149 | 15.2% |
| Total Housing Units | 981 | 100.0% |
Occupancy by Ownership by Household Size in Westhampton Beach
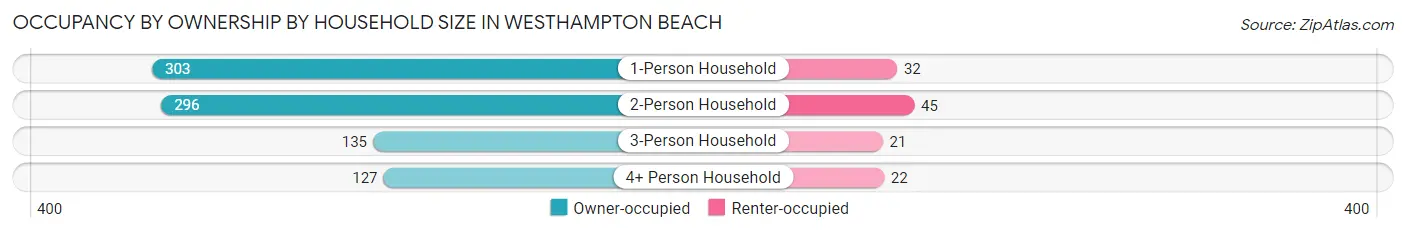
| Household Size | Owner-occupied | Renter-occupied |
| 1-Person Household | 303 (90.4%) | 32 (9.6%) |
| 2-Person Household | 296 (86.8%) | 45 (13.2%) |
| 3-Person Household | 135 (86.5%) | 21 (13.5%) |
| 4+ Person Household | 127 (85.2%) | 22 (14.8%) |
| Total Housing Units | 861 (87.8%) | 120 (12.2%) |
Occupancy by Educational Attainment in Westhampton Beach
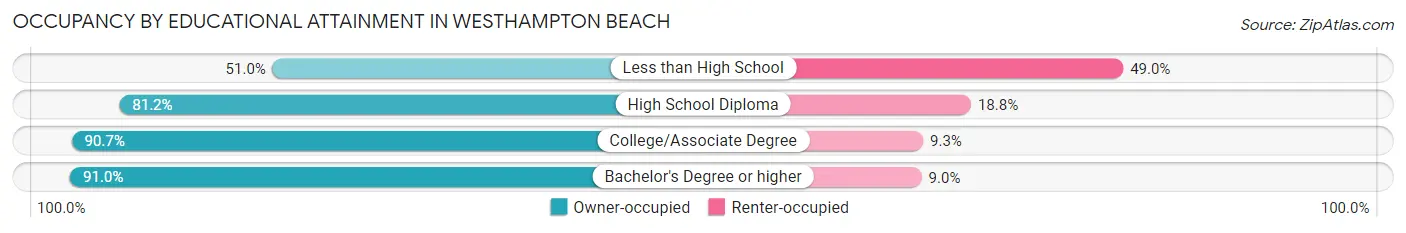
| Household Size | Owner-occupied | Renter-occupied |
| Less than High School | 25 (51.0%) | 24 (49.0%) |
| High School Diploma | 95 (81.2%) | 22 (18.8%) |
| College/Associate Degree | 156 (90.7%) | 16 (9.3%) |
| Bachelor's Degree or higher | 585 (91.0%) | 58 (9.0%) |
Occupancy by Age of Householder in Westhampton Beach
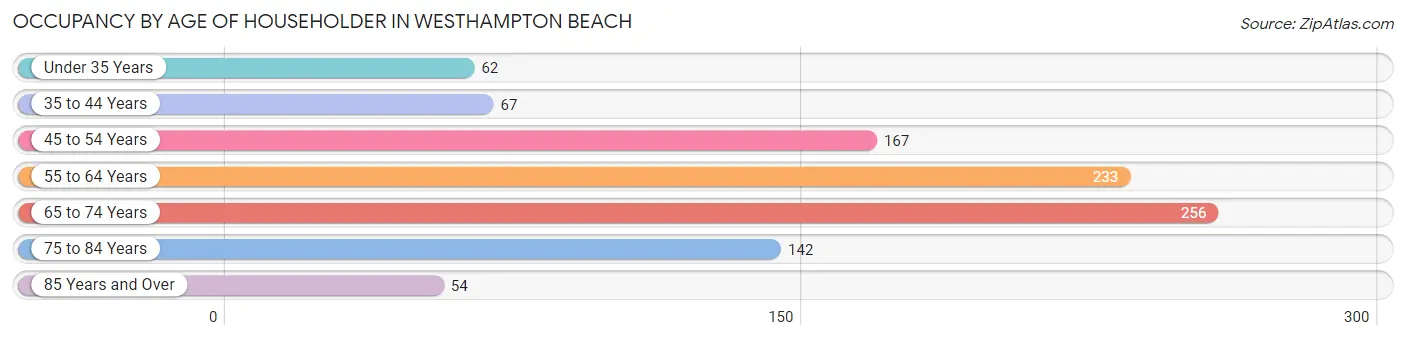
| Age Bracket | # Households | % Households |
| Under 35 Years | 62 | 6.3% |
| 35 to 44 Years | 67 | 6.8% |
| 45 to 54 Years | 167 | 17.0% |
| 55 to 64 Years | 233 | 23.7% |
| 65 to 74 Years | 256 | 26.1% |
| 75 to 84 Years | 142 | 14.5% |
| 85 Years and Over | 54 | 5.5% |
| Total | 981 | 100.0% |
Housing Finances in Westhampton Beach
Median Income by Occupancy in Westhampton Beach
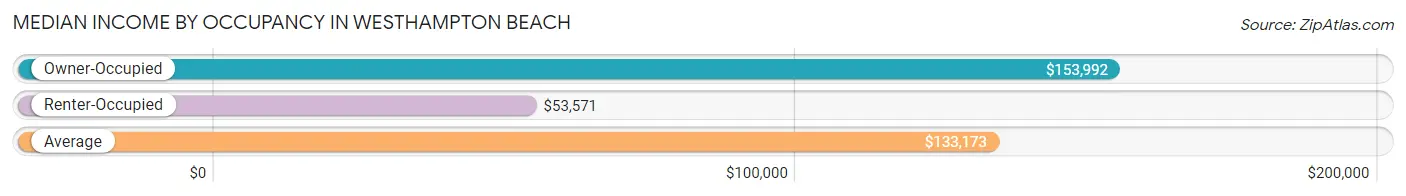
| Occupancy Type | # Households | Median Income |
| Owner-Occupied | 861 (87.8%) | $153,992 |
| Renter-Occupied | 120 (12.2%) | $53,571 |
| Average | 981 (100.0%) | $133,173 |
Occupancy by Householder Income Bracket in Westhampton Beach
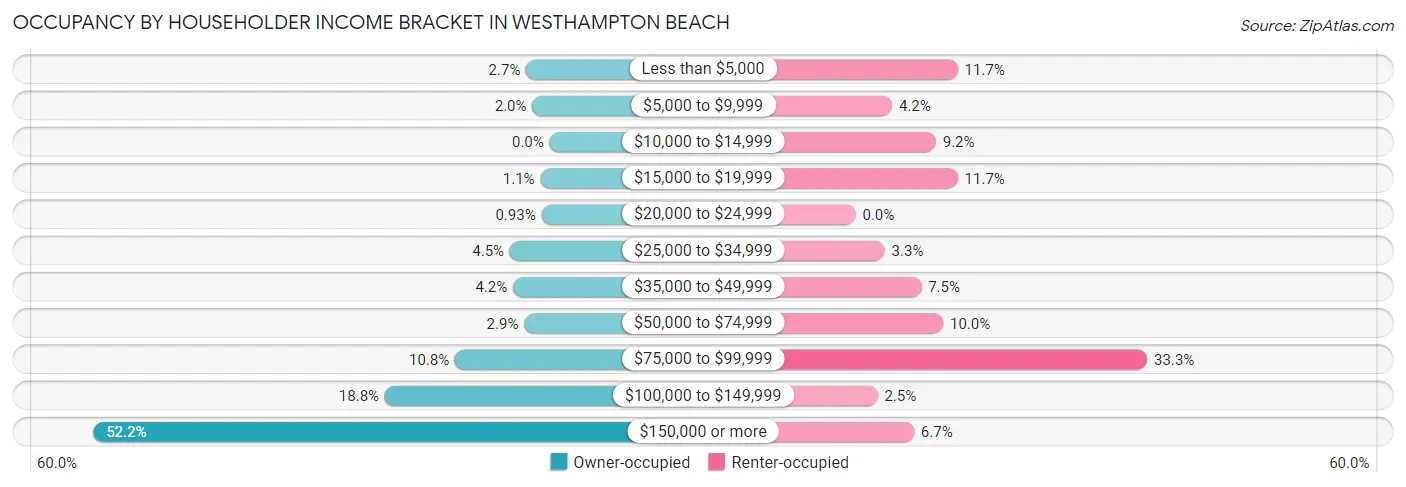
| Income Bracket | Owner-occupied | Renter-occupied |
| Less than $5,000 | 23 (2.7%) | 14 (11.7%) |
| $5,000 to $9,999 | 17 (2.0%) | 5 (4.2%) |
| $10,000 to $14,999 | 0 (0.0%) | 11 (9.2%) |
| $15,000 to $19,999 | 9 (1.1%) | 14 (11.7%) |
| $20,000 to $24,999 | 8 (0.9%) | 0 (0.0%) |
| $25,000 to $34,999 | 39 (4.5%) | 4 (3.3%) |
| $35,000 to $49,999 | 36 (4.2%) | 9 (7.5%) |
| $50,000 to $74,999 | 25 (2.9%) | 12 (10.0%) |
| $75,000 to $99,999 | 93 (10.8%) | 40 (33.3%) |
| $100,000 to $149,999 | 162 (18.8%) | 3 (2.5%) |
| $150,000 or more | 449 (52.1%) | 8 (6.7%) |
| Total | 861 (100.0%) | 120 (100.0%) |
Monthly Housing Cost Tiers in Westhampton Beach
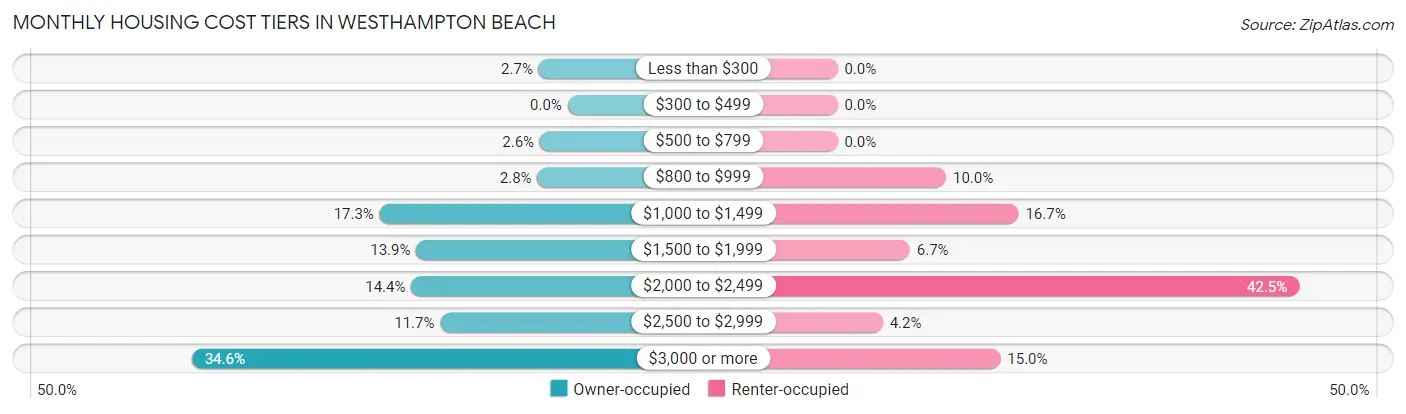
| Monthly Cost | Owner-occupied | Renter-occupied |
| Less than $300 | 23 (2.7%) | 0 (0.0%) |
| $300 to $499 | 0 (0.0%) | 0 (0.0%) |
| $500 to $799 | 22 (2.6%) | 0 (0.0%) |
| $800 to $999 | 24 (2.8%) | 12 (10.0%) |
| $1,000 to $1,499 | 149 (17.3%) | 20 (16.7%) |
| $1,500 to $1,999 | 120 (13.9%) | 8 (6.7%) |
| $2,000 to $2,499 | 124 (14.4%) | 51 (42.5%) |
| $2,500 to $2,999 | 101 (11.7%) | 5 (4.2%) |
| $3,000 or more | 298 (34.6%) | 18 (15.0%) |
| Total | 861 (100.0%) | 120 (100.0%) |
Physical Housing Characteristics in Westhampton Beach
Housing Structures in Westhampton Beach
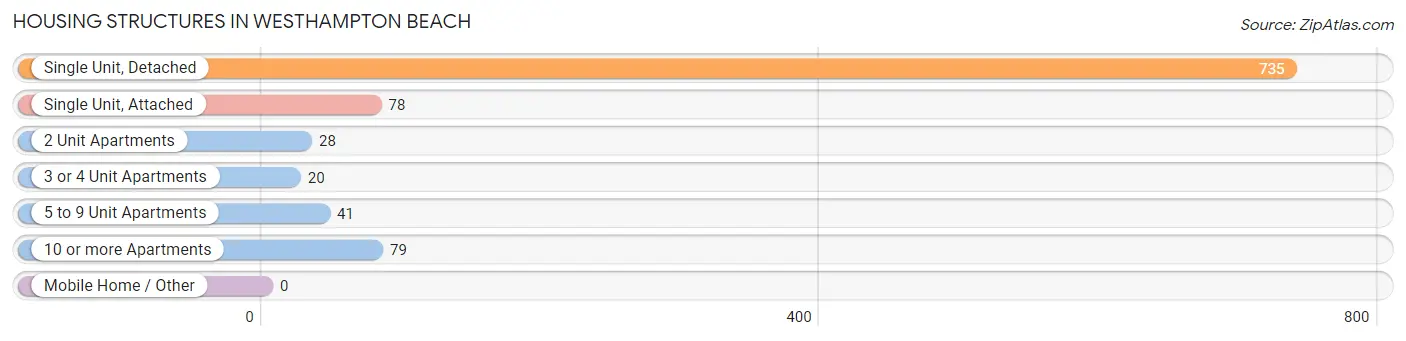
| Structure Type | # Housing Units | % Housing Units |
| Single Unit, Detached | 735 | 74.9% |
| Single Unit, Attached | 78 | 8.0% |
| 2 Unit Apartments | 28 | 2.9% |
| 3 or 4 Unit Apartments | 20 | 2.0% |
| 5 to 9 Unit Apartments | 41 | 4.2% |
| 10 or more Apartments | 79 | 8.1% |
| Mobile Home / Other | 0 | 0.0% |
| Total | 981 | 100.0% |
Housing Structures by Occupancy in Westhampton Beach
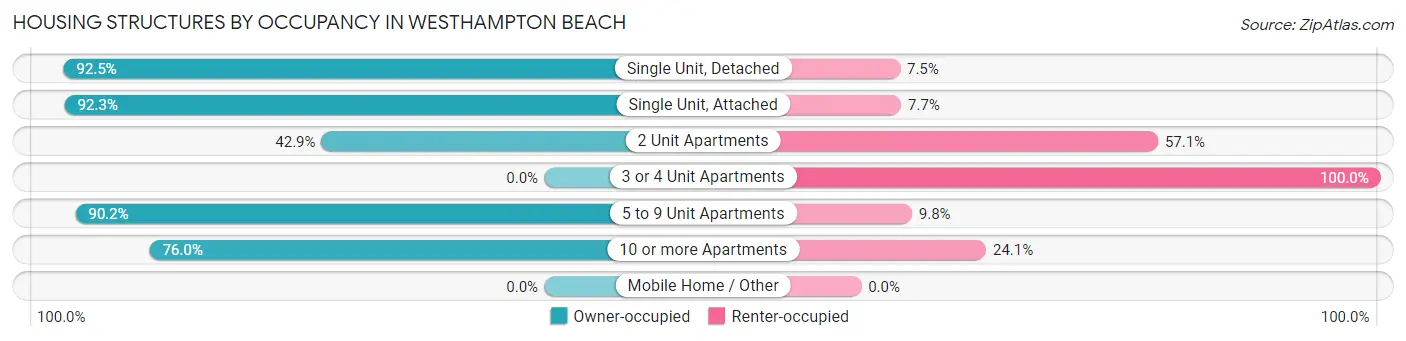
| Structure Type | Owner-occupied | Renter-occupied |
| Single Unit, Detached | 680 (92.5%) | 55 (7.5%) |
| Single Unit, Attached | 72 (92.3%) | 6 (7.7%) |
| 2 Unit Apartments | 12 (42.9%) | 16 (57.1%) |
| 3 or 4 Unit Apartments | 0 (0.0%) | 20 (100.0%) |
| 5 to 9 Unit Apartments | 37 (90.2%) | 4 (9.8%) |
| 10 or more Apartments | 60 (75.9%) | 19 (24.0%) |
| Mobile Home / Other | 0 (0.0%) | 0 (0.0%) |
| Total | 861 (87.8%) | 120 (12.2%) |
Housing Structures by Number of Rooms in Westhampton Beach
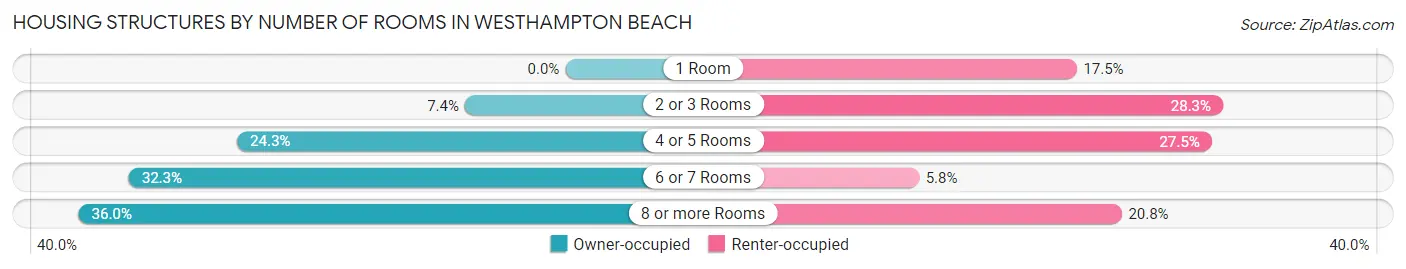
| Number of Rooms | Owner-occupied | Renter-occupied |
| 1 Room | 0 (0.0%) | 21 (17.5%) |
| 2 or 3 Rooms | 64 (7.4%) | 34 (28.3%) |
| 4 or 5 Rooms | 209 (24.3%) | 33 (27.5%) |
| 6 or 7 Rooms | 278 (32.3%) | 7 (5.8%) |
| 8 or more Rooms | 310 (36.0%) | 25 (20.8%) |
| Total | 861 (100.0%) | 120 (100.0%) |
Housing Structure by Heating Type in Westhampton Beach
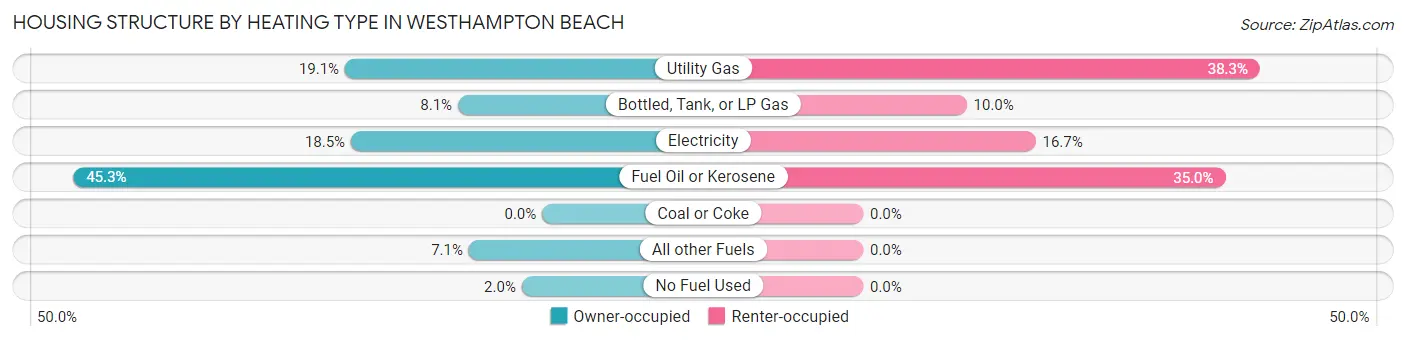
| Heating Type | Owner-occupied | Renter-occupied |
| Utility Gas | 164 (19.1%) | 46 (38.3%) |
| Bottled, Tank, or LP Gas | 70 (8.1%) | 12 (10.0%) |
| Electricity | 159 (18.5%) | 20 (16.7%) |
| Fuel Oil or Kerosene | 390 (45.3%) | 42 (35.0%) |
| Coal or Coke | 0 (0.0%) | 0 (0.0%) |
| All other Fuels | 61 (7.1%) | 0 (0.0%) |
| No Fuel Used | 17 (2.0%) | 0 (0.0%) |
| Total | 861 (100.0%) | 120 (100.0%) |
Household Vehicle Usage in Westhampton Beach
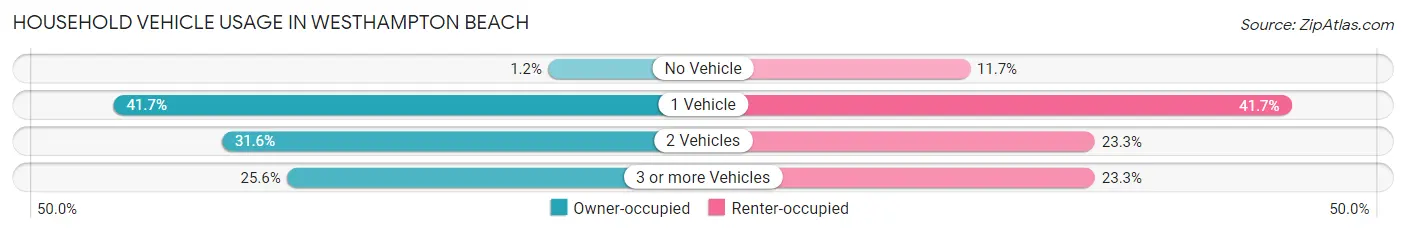
| Vehicles per Household | Owner-occupied | Renter-occupied |
| No Vehicle | 10 (1.2%) | 14 (11.7%) |
| 1 Vehicle | 359 (41.7%) | 50 (41.7%) |
| 2 Vehicles | 272 (31.6%) | 28 (23.3%) |
| 3 or more Vehicles | 220 (25.6%) | 28 (23.3%) |
| Total | 861 (100.0%) | 120 (100.0%) |
Real Estate & Mortgages in Westhampton Beach
Real Estate and Mortgage Overview in Westhampton Beach
| Characteristic | Without Mortgage | With Mortgage |
| Housing Units | 478 | 383 |
| Median Property Value | $983,500 | $896,700 |
| Median Household Income | $119,500 | $246 |
| Monthly Housing Costs | $1,501 | $229 |
| Real Estate Taxes | $9,835 | $0 |
Property Value by Mortgage Status in Westhampton Beach
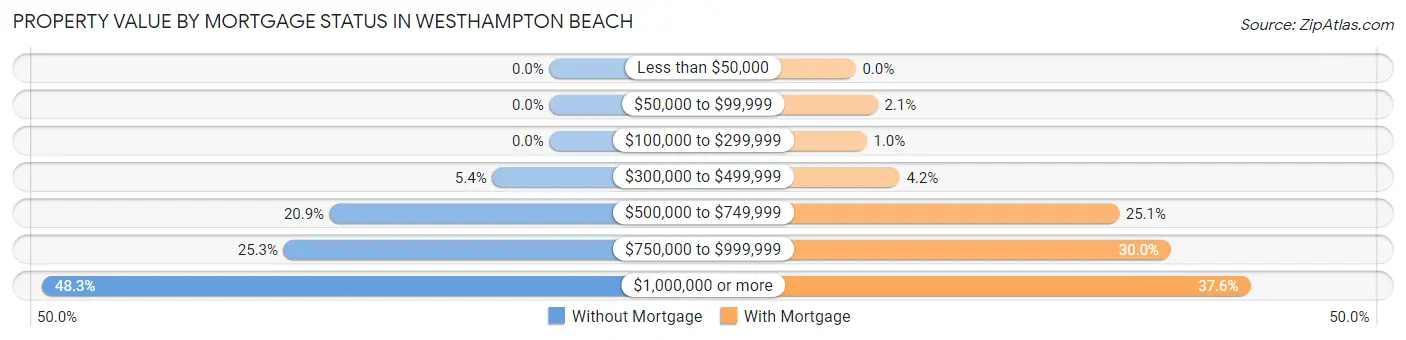
| Property Value | Without Mortgage | With Mortgage |
| Less than $50,000 | 0 (0.0%) | 0 (0.0%) |
| $50,000 to $99,999 | 0 (0.0%) | 8 (2.1%) |
| $100,000 to $299,999 | 0 (0.0%) | 4 (1.0%) |
| $300,000 to $499,999 | 26 (5.4%) | 16 (4.2%) |
| $500,000 to $749,999 | 100 (20.9%) | 96 (25.1%) |
| $750,000 to $999,999 | 121 (25.3%) | 115 (30.0%) |
| $1,000,000 or more | 231 (48.3%) | 144 (37.6%) |
| Total | 478 (100.0%) | 383 (100.0%) |
Household Income by Mortgage Status in Westhampton Beach
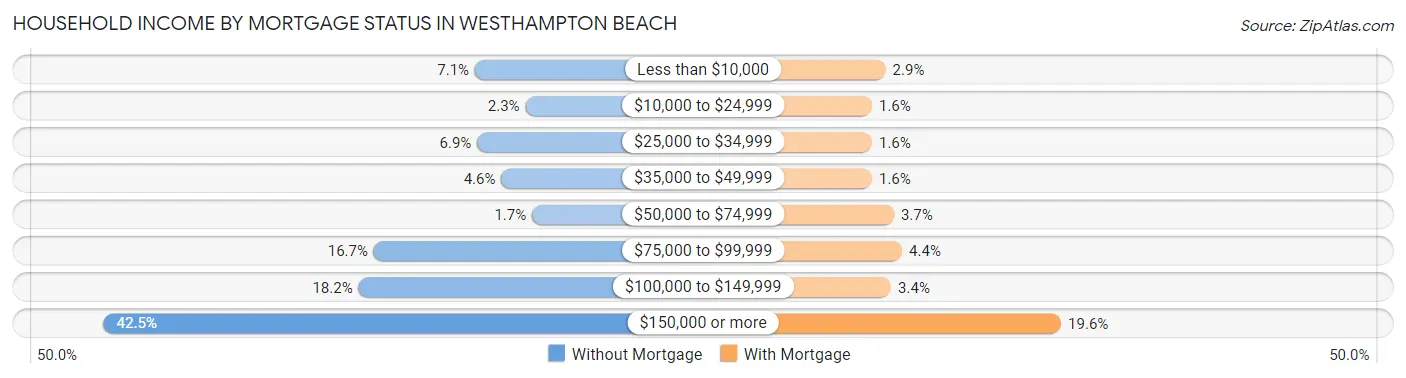
| Household Income | Without Mortgage | With Mortgage |
| Less than $10,000 | 34 (7.1%) | 11 (2.9%) |
| $10,000 to $24,999 | 11 (2.3%) | 6 (1.6%) |
| $25,000 to $34,999 | 33 (6.9%) | 6 (1.6%) |
| $35,000 to $49,999 | 22 (4.6%) | 6 (1.6%) |
| $50,000 to $74,999 | 8 (1.7%) | 14 (3.7%) |
| $75,000 to $99,999 | 80 (16.7%) | 17 (4.4%) |
| $100,000 to $149,999 | 87 (18.2%) | 13 (3.4%) |
| $150,000 or more | 203 (42.5%) | 75 (19.6%) |
| Total | 478 (100.0%) | 383 (100.0%) |
Property Value to Household Income Ratio in Westhampton Beach
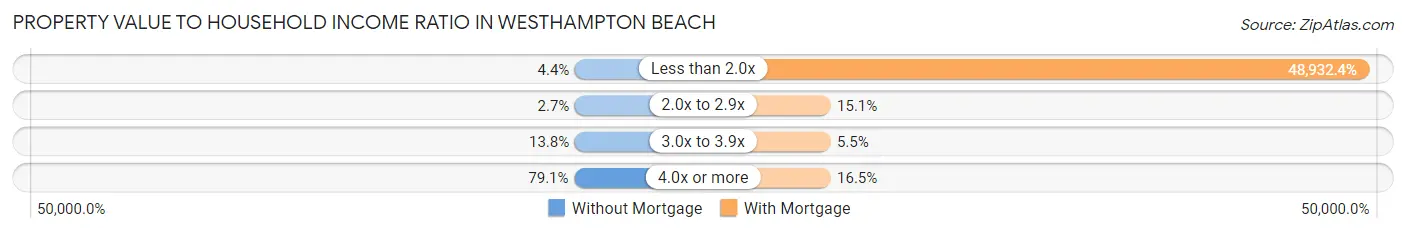
| Value-to-Income Ratio | Without Mortgage | With Mortgage |
| Less than 2.0x | 21 (4.4%) | 187,411 (48,932.4%) |
| 2.0x to 2.9x | 13 (2.7%) | 58 (15.1%) |
| 3.0x to 3.9x | 66 (13.8%) | 21 (5.5%) |
| 4.0x or more | 378 (79.1%) | 63 (16.5%) |
| Total | 478 (100.0%) | 383 (100.0%) |
Real Estate Taxes by Mortgage Status in Westhampton Beach
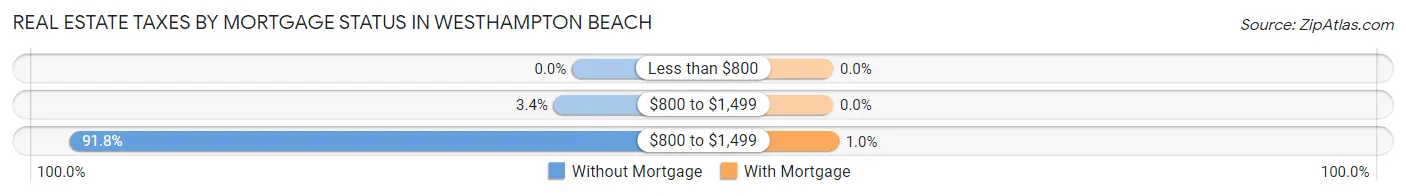
| Property Taxes | Without Mortgage | With Mortgage |
| Less than $800 | 0 (0.0%) | 0 (0.0%) |
| $800 to $1,499 | 16 (3.4%) | 0 (0.0%) |
| $800 to $1,499 | 439 (91.8%) | 4 (1.0%) |
| Total | 478 (100.0%) | 383 (100.0%) |
Health & Disability in Westhampton Beach
Health Insurance Coverage by Age in Westhampton Beach
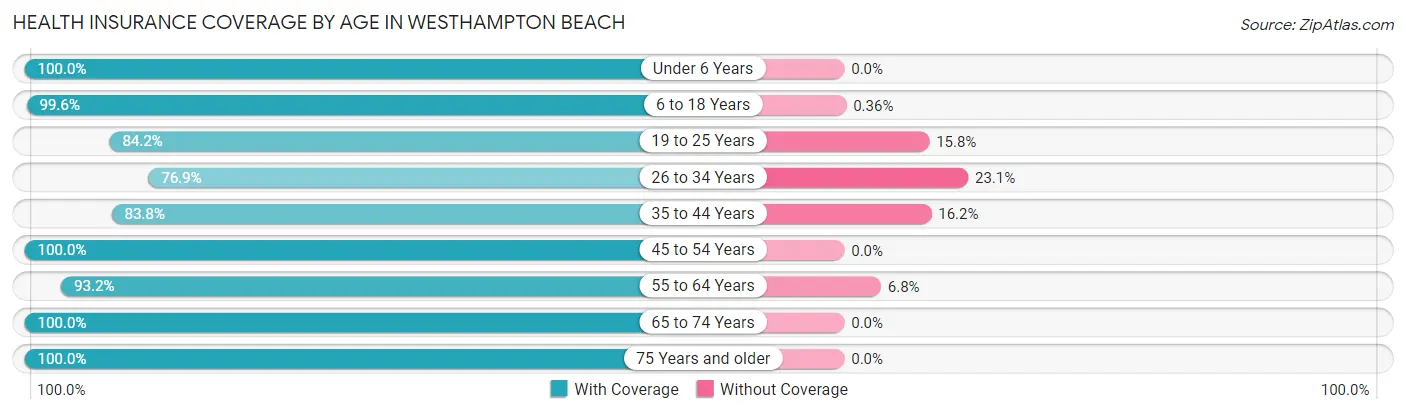
| Age Bracket | With Coverage | Without Coverage |
| Under 6 Years | 36 (100.0%) | 0 (0.0%) |
| 6 to 18 Years | 275 (99.6%) | 1 (0.4%) |
| 19 to 25 Years | 234 (84.2%) | 44 (15.8%) |
| 26 to 34 Years | 150 (76.9%) | 45 (23.1%) |
| 35 to 44 Years | 155 (83.8%) | 30 (16.2%) |
| 45 to 54 Years | 263 (100.0%) | 0 (0.0%) |
| 55 to 64 Years | 369 (93.2%) | 27 (6.8%) |
| 65 to 74 Years | 375 (100.0%) | 0 (0.0%) |
| 75 Years and older | 340 (100.0%) | 0 (0.0%) |
| Total | 2,197 (93.7%) | 147 (6.3%) |
Health Insurance Coverage by Citizenship Status in Westhampton Beach
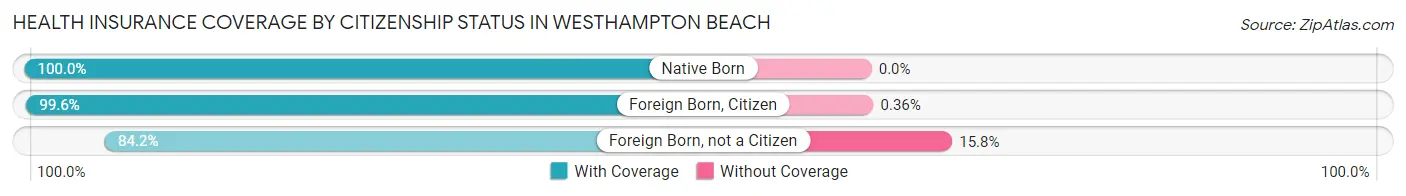
| Citizenship Status | With Coverage | Without Coverage |
| Native Born | 36 (100.0%) | 0 (0.0%) |
| Foreign Born, Citizen | 275 (99.6%) | 1 (0.4%) |
| Foreign Born, not a Citizen | 234 (84.2%) | 44 (15.8%) |
Health Insurance Coverage by Household Income in Westhampton Beach
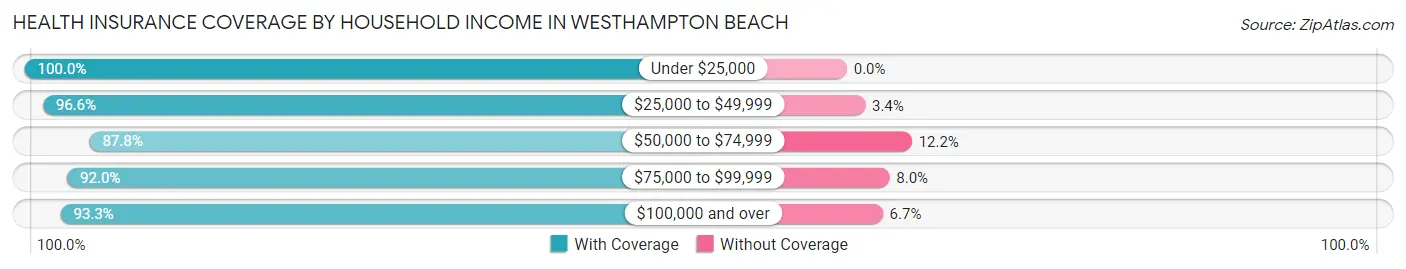
| Household Income | With Coverage | Without Coverage |
| Under $25,000 | 128 (100.0%) | 0 (0.0%) |
| $25,000 to $49,999 | 113 (96.6%) | 4 (3.4%) |
| $50,000 to $74,999 | 65 (87.8%) | 9 (12.2%) |
| $75,000 to $99,999 | 346 (92.0%) | 30 (8.0%) |
| $100,000 and over | 1,444 (93.3%) | 104 (6.7%) |
Public vs Private Health Insurance Coverage by Age in Westhampton Beach
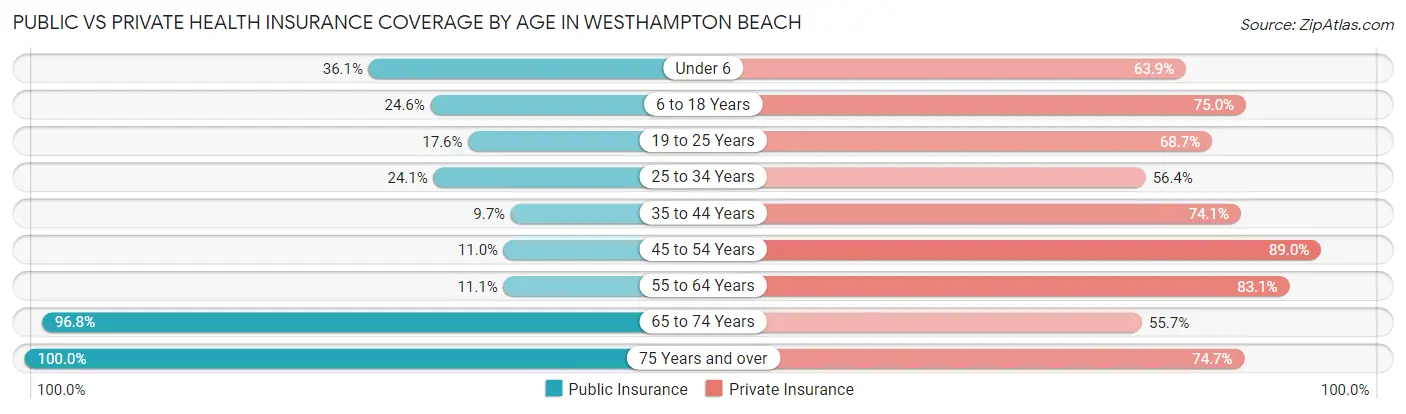
| Age Bracket | Public Insurance | Private Insurance |
| Under 6 | 13 (36.1%) | 23 (63.9%) |
| 6 to 18 Years | 68 (24.6%) | 207 (75.0%) |
| 19 to 25 Years | 49 (17.6%) | 191 (68.7%) |
| 25 to 34 Years | 47 (24.1%) | 110 (56.4%) |
| 35 to 44 Years | 18 (9.7%) | 137 (74.1%) |
| 45 to 54 Years | 29 (11.0%) | 234 (89.0%) |
| 55 to 64 Years | 44 (11.1%) | 329 (83.1%) |
| 65 to 74 Years | 363 (96.8%) | 209 (55.7%) |
| 75 Years and over | 340 (100.0%) | 254 (74.7%) |
| Total | 971 (41.4%) | 1,694 (72.3%) |
Disability Status by Sex by Age in Westhampton Beach
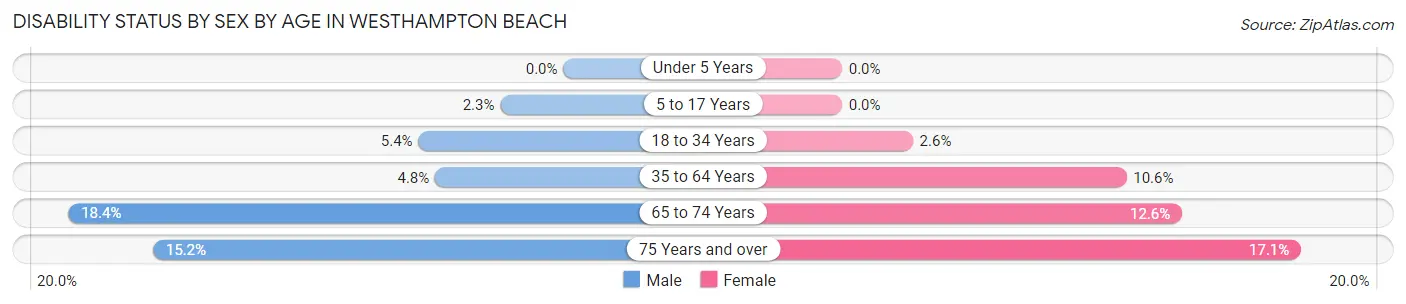
| Age Bracket | Male | Female |
| Under 5 Years | 0 (0.0%) | 0 (0.0%) |
| 5 to 17 Years | 3 (2.3%) | 0 (0.0%) |
| 18 to 34 Years | 17 (5.4%) | 6 (2.6%) |
| 35 to 64 Years | 19 (4.8%) | 47 (10.6%) |
| 65 to 74 Years | 34 (18.4%) | 24 (12.6%) |
| 75 Years and over | 25 (15.2%) | 30 (17.1%) |
Disability Class by Sex by Age in Westhampton Beach
Disability Class: Hearing Difficulty
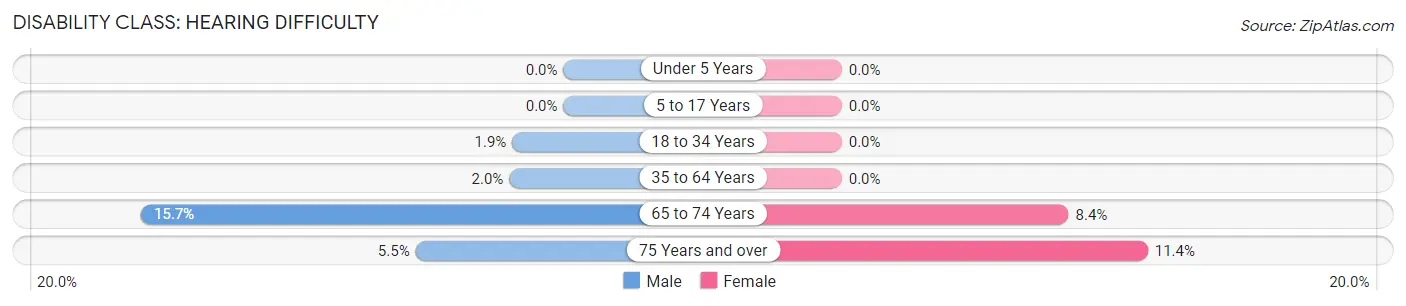
| Age Bracket | Male | Female |
| Under 5 Years | 0 (0.0%) | 0 (0.0%) |
| 5 to 17 Years | 0 (0.0%) | 0 (0.0%) |
| 18 to 34 Years | 6 (1.9%) | 0 (0.0%) |
| 35 to 64 Years | 8 (2.0%) | 0 (0.0%) |
| 65 to 74 Years | 29 (15.7%) | 16 (8.4%) |
| 75 Years and over | 9 (5.5%) | 20 (11.4%) |
Disability Class: Vision Difficulty
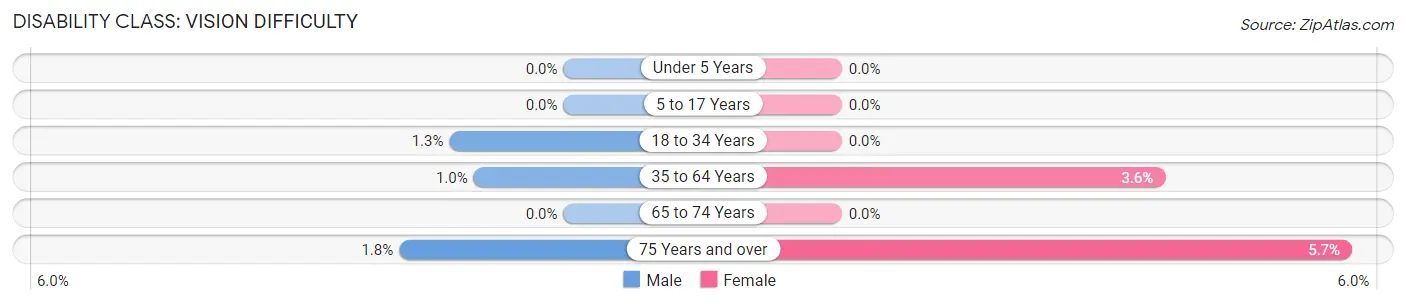
| Age Bracket | Male | Female |
| Under 5 Years | 0 (0.0%) | 0 (0.0%) |
| 5 to 17 Years | 0 (0.0%) | 0 (0.0%) |
| 18 to 34 Years | 4 (1.3%) | 0 (0.0%) |
| 35 to 64 Years | 4 (1.0%) | 16 (3.6%) |
| 65 to 74 Years | 0 (0.0%) | 0 (0.0%) |
| 75 Years and over | 3 (1.8%) | 10 (5.7%) |
Disability Class: Cognitive Difficulty
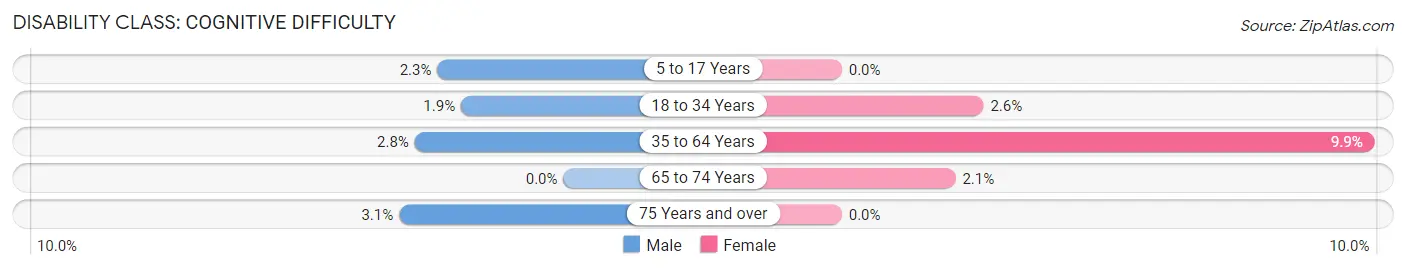
| Age Bracket | Male | Female |
| 5 to 17 Years | 3 (2.3%) | 0 (0.0%) |
| 18 to 34 Years | 6 (1.9%) | 6 (2.6%) |
| 35 to 64 Years | 11 (2.8%) | 44 (9.9%) |
| 65 to 74 Years | 0 (0.0%) | 4 (2.1%) |
| 75 Years and over | 5 (3.0%) | 0 (0.0%) |
Disability Class: Ambulatory Difficulty
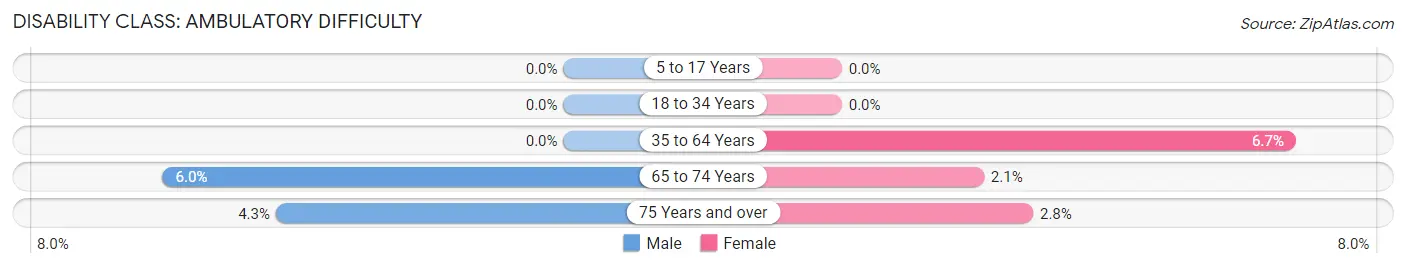
| Age Bracket | Male | Female |
| 5 to 17 Years | 0 (0.0%) | 0 (0.0%) |
| 18 to 34 Years | 0 (0.0%) | 0 (0.0%) |
| 35 to 64 Years | 0 (0.0%) | 30 (6.7%) |
| 65 to 74 Years | 11 (5.9%) | 4 (2.1%) |
| 75 Years and over | 7 (4.3%) | 5 (2.8%) |
Disability Class: Self-Care Difficulty
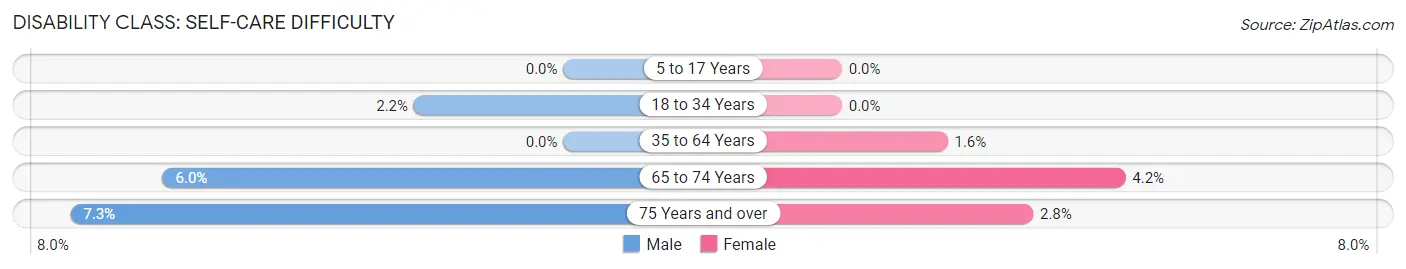
| Age Bracket | Male | Female |
| 5 to 17 Years | 0 (0.0%) | 0 (0.0%) |
| 18 to 34 Years | 7 (2.2%) | 0 (0.0%) |
| 35 to 64 Years | 0 (0.0%) | 7 (1.6%) |
| 65 to 74 Years | 11 (5.9%) | 8 (4.2%) |
| 75 Years and over | 12 (7.3%) | 5 (2.8%) |
Technology Access in Westhampton Beach
Computing Device Access in Westhampton Beach
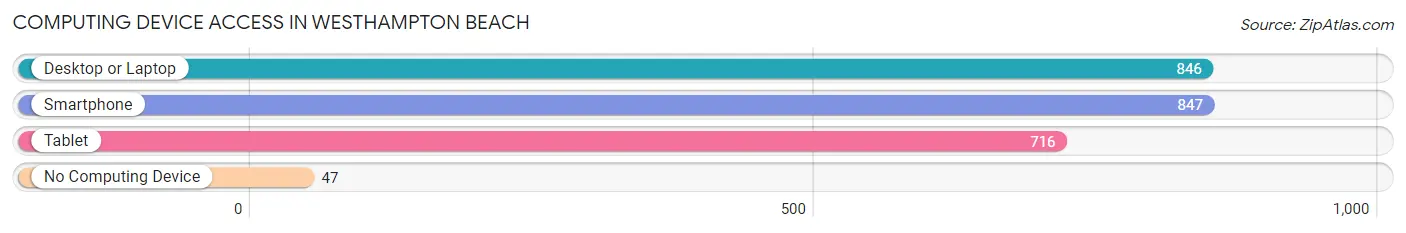
| Device Type | # Households | % Households |
| Desktop or Laptop | 846 | 86.2% |
| Smartphone | 847 | 86.3% |
| Tablet | 716 | 73.0% |
| No Computing Device | 47 | 4.8% |
| Total | 981 | 100.0% |
Internet Access in Westhampton Beach
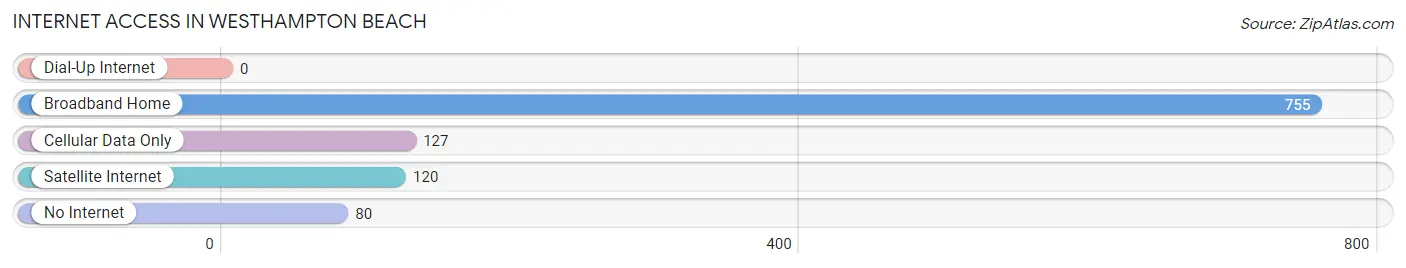
| Internet Type | # Households | % Households |
| Dial-Up Internet | 0 | 0.0% |
| Broadband Home | 755 | 77.0% |
| Cellular Data Only | 127 | 13.0% |
| Satellite Internet | 120 | 12.2% |
| No Internet | 80 | 8.2% |
| Total | 981 | 100.0% |
Westhampton Beach Summary
Hampton Beach, NY is a small village located on the south shore of Long Island in Suffolk County, New York. It is part of the Town of Southampton and is located approximately 70 miles east of New York City. The village is bordered by the Atlantic Ocean to the south, the Shinnecock Canal to the west, and the Great Peconic Bay to the north. The village has a population of approximately 2,000 people and covers an area of 1.2 square miles.
History
The area that is now known as Westhampton Beach was originally inhabited by the Shinnecock Indians. The first European settlers arrived in the area in the late 1600s and the area was officially established as a village in 1869. The village was named after the nearby Westhampton Beach, which was a popular destination for wealthy New Yorkers during the late 19th century.
The village experienced a period of growth in the early 20th century, when it became a popular summer destination for wealthy New Yorkers. The village was home to several large hotels, including the Westhampton Beach Hotel, which was built in 1902. The village also became a popular destination for celebrities, including the likes of John F. Kennedy, who visited the village in the 1950s.
Geography
Westhampton Beach is located on the south shore of Long Island in Suffolk County, New York. It is bordered by the Atlantic Ocean to the south, the Shinnecock Canal to the west, and the Great Peconic Bay to the north. The village covers an area of 1.2 square miles and has a population of approximately 2,000 people.
The village is located approximately 70 miles east of New York City and is accessible by car via the Long Island Expressway. The village is also served by the Long Island Rail Road, which provides service to New York City and other nearby towns.
Economy
The economy of Westhampton Beach is largely based on tourism. The village is a popular summer destination for wealthy New Yorkers and is home to several large hotels, including the Westhampton Beach Hotel. The village also has several restaurants, bars, and shops, which cater to tourists and locals alike.
The village is also home to several businesses, including a marina, a golf course, and a yacht club. The village is also home to several art galleries, which showcase the work of local artists.
Demographics
As of the 2010 census, the population of Westhampton Beach was 2,000 people. The racial makeup of the village was 94.2% White, 2.2% African American, 0.7% Asian, 0.3% Native American, and 2.6% from other races. The median household income was $87,500 and the median family income was $97,500.
The village is home to several religious institutions, including the Westhampton Beach Presbyterian Church, the Westhampton Beach United Methodist Church, and the Westhampton Beach Jewish Center. The village is also home to several private schools, including the Westhampton Beach School District and the Westhampton Beach Academy.
Common Questions
What is Per Capita Income in Westhampton Beach?
Per Capita income in Westhampton Beach is $98,111.
What is the Median Family Income in Westhampton Beach?
Median Family Income in Westhampton Beach is $154,265.
What is the Median Household income in Westhampton Beach?
Median Household Income in Westhampton Beach is $133,173.
What is Income or Wage Gap in Westhampton Beach?
Income or Wage Gap in Westhampton Beach is 51.9%.
Women in Westhampton Beach earn 48.1 cents for every dollar earned by a man.
What is Inequality or Gini Index in Westhampton Beach?
Inequality or Gini Index in Westhampton Beach is 0.54.
What is the Total Population of Westhampton Beach?
Total Population of Westhampton Beach is 2,344.
What is the Total Male Population of Westhampton Beach?
Total Male Population of Westhampton Beach is 1,207.
What is the Total Female Population of Westhampton Beach?
Total Female Population of Westhampton Beach is 1,137.
What is the Ratio of Males per 100 Females in Westhampton Beach?
There are 106.16 Males per 100 Females in Westhampton Beach.
What is the Ratio of Females per 100 Males in Westhampton Beach?
There are 94.20 Females per 100 Males in Westhampton Beach.
What is the Median Population Age in Westhampton Beach?
Median Population Age in Westhampton Beach is 52.2 Years.
What is the Average Family Size in Westhampton Beach
Average Family Size in Westhampton Beach is 2.9 People.
What is the Average Household Size in Westhampton Beach
Average Household Size in Westhampton Beach is 2.3 People.
How Large is the Labor Force in Westhampton Beach?
There are 1,223 People in the Labor Forcein in Westhampton Beach.
What is the Percentage of People in the Labor Force in Westhampton Beach?
56.3% of People are in the Labor Force in Westhampton Beach.
What is the Unemployment Rate in Westhampton Beach?
Unemployment Rate in Westhampton Beach is 3.7%.