Chittenango, NY Map & Demographics
Chittenango Map
Chittenango Overview
$33,209
PER CAPITA INCOME
$82,596
AVG FAMILY INCOME
$63,966
AVG HOUSEHOLD INCOME
26.1%
WAGE / INCOME GAP [ % ]
73.9¢/ $1
WAGE / INCOME GAP [ $ ]
0.46
INEQUALITY / GINI INDEX
4,884
TOTAL POPULATION
2,703
MALE POPULATION
2,181
FEMALE POPULATION
123.93
MALES / 100 FEMALES
80.69
FEMALES / 100 MALES
39.3
MEDIAN AGE
3.1
AVG FAMILY SIZE
2.6
AVG HOUSEHOLD SIZE
2,188
LABOR FORCE [ PEOPLE ]
55.6%
PERCENT IN LABOR FORCE
4.7%
UNEMPLOYMENT RATE
Chittenango Zip Codes
Chittenango Area Codes
Income in Chittenango
Income Overview in Chittenango
Per Capita Income in Chittenango is $33,209, while median incomes of families and households are $82,596 and $63,966 respectively.
| Characteristic | Number | Measure |
| Per Capita Income | 4,884 | $33,209 |
| Median Family Income | 1,331 | $82,596 |
| Mean Family Income | 1,331 | $96,281 |
| Median Household Income | 1,862 | $63,966 |
| Mean Household Income | 1,862 | $82,424 |
| Income Deficit | 1,331 | $0 |
| Wage / Income Gap (%) | 4,884 | 26.14% |
| Wage / Income Gap ($) | 4,884 | 73.86¢ per $1 |
| Gini / Inequality Index | 4,884 | 0.46 |
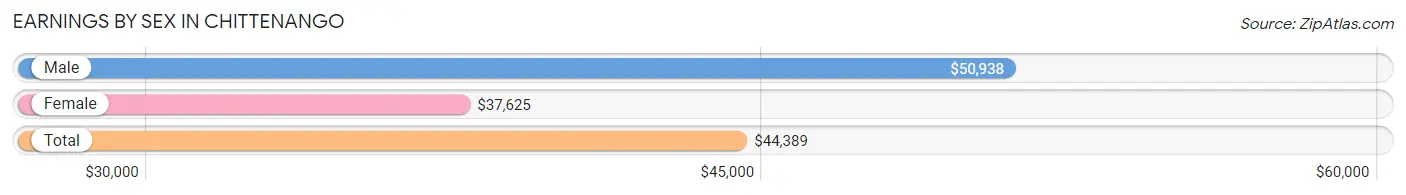
Earnings by Sex in Chittenango
Average Earnings in Chittenango are $44,389, $50,938 for men and $37,625 for women, a difference of 26.1%.
| Sex | Number | Average Earnings |
| Male | 1,170 (51.8%) | $50,938 |
| Female | 1,088 (48.2%) | $37,625 |
| Total | 2,258 (100.0%) | $44,389 |
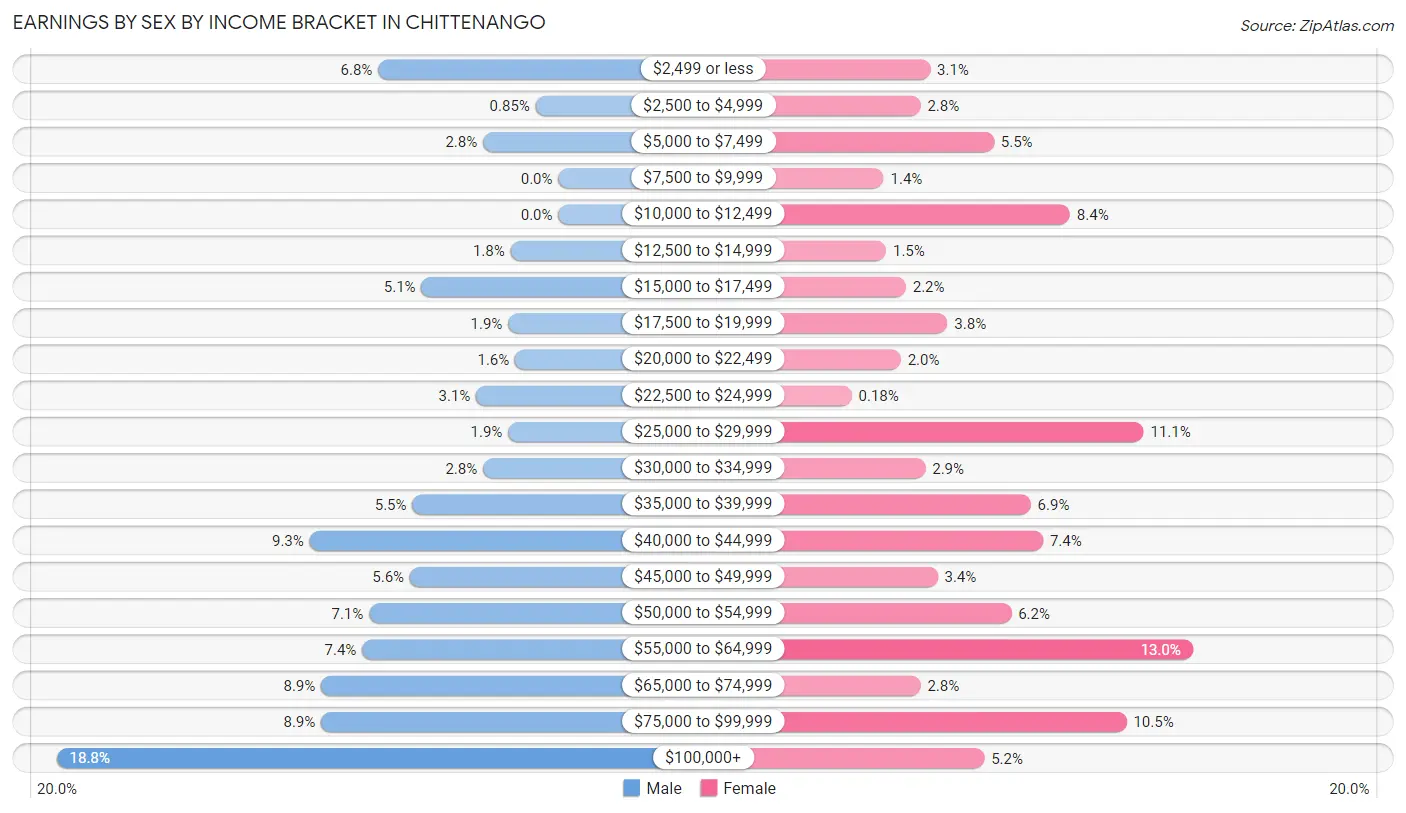
Earnings by Sex by Income Bracket in Chittenango
The most common earnings brackets in Chittenango are $100,000+ for men (220 | 18.8%) and $55,000 to $64,999 for women (141 | 13.0%).
| Income | Male | Female |
| $2,499 or less | 79 (6.8%) | 34 (3.1%) |
| $2,500 to $4,999 | 10 (0.9%) | 30 (2.8%) |
| $5,000 to $7,499 | 33 (2.8%) | 60 (5.5%) |
| $7,500 to $9,999 | 0 (0.0%) | 15 (1.4%) |
| $10,000 to $12,499 | 0 (0.0%) | 91 (8.4%) |
| $12,500 to $14,999 | 21 (1.8%) | 16 (1.5%) |
| $15,000 to $17,499 | 60 (5.1%) | 24 (2.2%) |
| $17,500 to $19,999 | 22 (1.9%) | 41 (3.8%) |
| $20,000 to $22,499 | 19 (1.6%) | 22 (2.0%) |
| $22,500 to $24,999 | 36 (3.1%) | 2 (0.2%) |
| $25,000 to $29,999 | 22 (1.9%) | 121 (11.1%) |
| $30,000 to $34,999 | 33 (2.8%) | 32 (2.9%) |
| $35,000 to $39,999 | 64 (5.5%) | 75 (6.9%) |
| $40,000 to $44,999 | 109 (9.3%) | 80 (7.3%) |
| $45,000 to $49,999 | 65 (5.6%) | 37 (3.4%) |
| $50,000 to $54,999 | 83 (7.1%) | 67 (6.2%) |
| $55,000 to $64,999 | 86 (7.3%) | 141 (13.0%) |
| $65,000 to $74,999 | 104 (8.9%) | 30 (2.8%) |
| $75,000 to $99,999 | 104 (8.9%) | 114 (10.5%) |
| $100,000+ | 220 (18.8%) | 56 (5.1%) |
| Total | 1,170 (100.0%) | 1,088 (100.0%) |
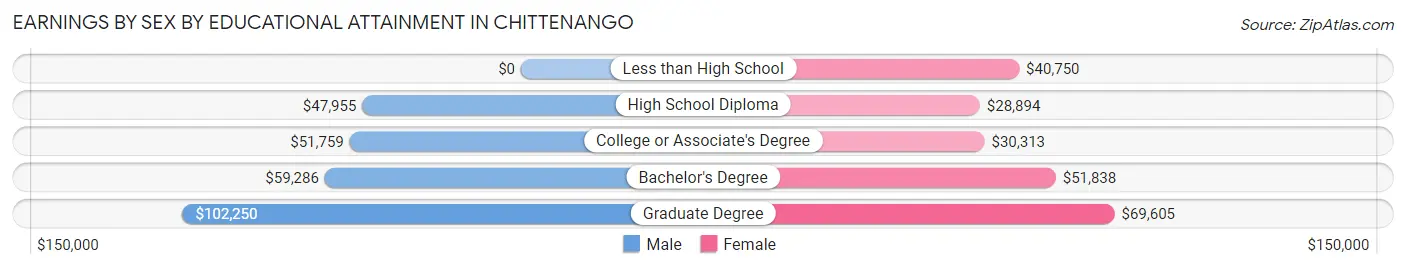
Earnings by Sex by Educational Attainment in Chittenango
Average earnings in Chittenango are $53,806 for men and $41,189 for women, a difference of 23.4%. Men with an educational attainment of graduate degree enjoy the highest average annual earnings of $102,250, while those with high school diploma education earn the least with $47,955. Women with an educational attainment of graduate degree earn the most with the average annual earnings of $69,605, while those with high school diploma education have the smallest earnings of $28,894.
| Educational Attainment | Male Income | Female Income |
| Less than High School | - | - |
| High School Diploma | $47,955 | $28,894 |
| College or Associate's Degree | $51,759 | $30,313 |
| Bachelor's Degree | $59,286 | $51,838 |
| Graduate Degree | $102,250 | $69,605 |
| Total | $53,806 | $41,189 |
Family Income in Chittenango
Family Income Brackets in Chittenango
According to the Chittenango family income data, there are 272 families falling into the $100,000 to $149,999 income range, which is the most common income bracket and makes up 20.4% of all families. Conversely, the $15,000 to $24,999 income bracket is the least frequent group with only 23 families (1.7%) belonging to this category.
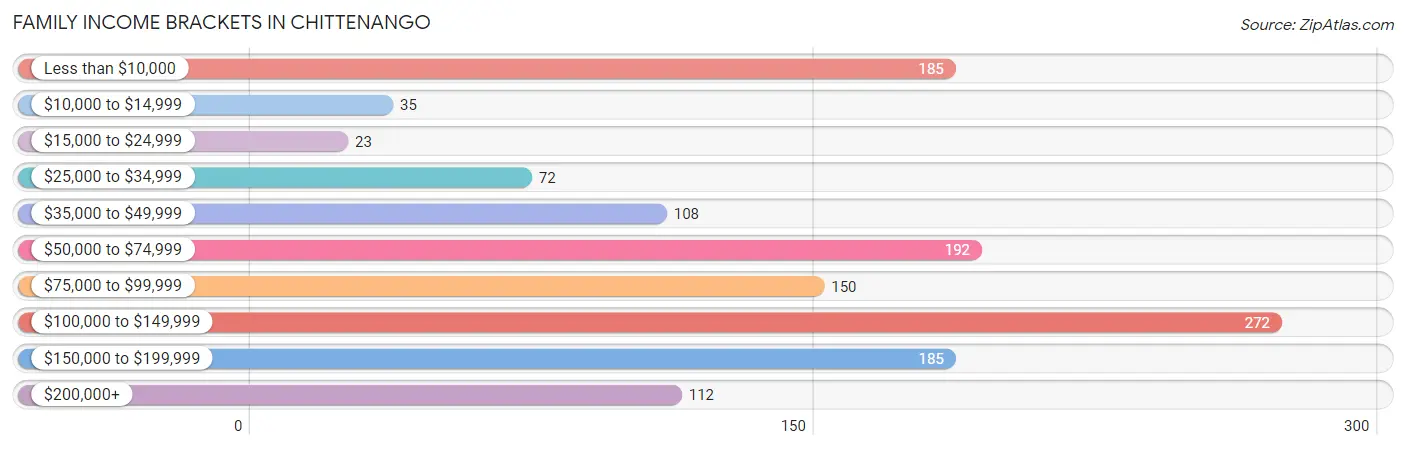
| Income Bracket | # Families | % Families |
| Less than $10,000 | 185 | 13.9% |
| $10,000 to $14,999 | 35 | 2.6% |
| $15,000 to $24,999 | 23 | 1.7% |
| $25,000 to $34,999 | 72 | 5.4% |
| $35,000 to $49,999 | 108 | 8.1% |
| $50,000 to $74,999 | 192 | 14.4% |
| $75,000 to $99,999 | 150 | 11.3% |
| $100,000 to $149,999 | 272 | 20.4% |
| $150,000 to $199,999 | 185 | 13.9% |
| $200,000+ | 112 | 8.4% |
Family Income by Famaliy Size in Chittenango
4-person families (301 | 22.6%) account for the highest median family income in Chittenango with $124,293 per family, while 2-person families (692 | 52.0%) have the highest median income of $31,776 per family member.
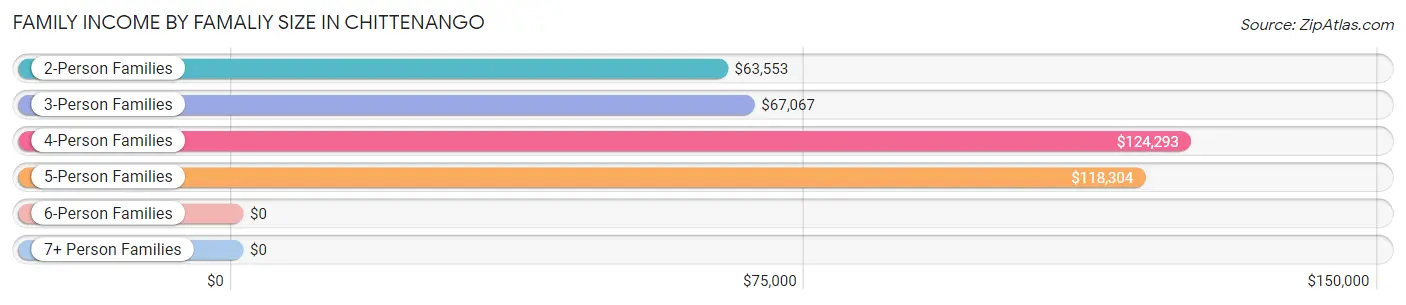
| Income Bracket | # Families | Median Income |
| 2-Person Families | 692 (52.0%) | $63,553 |
| 3-Person Families | 279 (21.0%) | $67,067 |
| 4-Person Families | 301 (22.6%) | $124,293 |
| 5-Person Families | 59 (4.4%) | $118,304 |
| 6-Person Families | 0 (0.0%) | $0 |
| 7+ Person Families | 0 (0.0%) | $0 |
| Total | 1,331 (100.0%) | $82,596 |
Family Income by Number of Earners in Chittenango
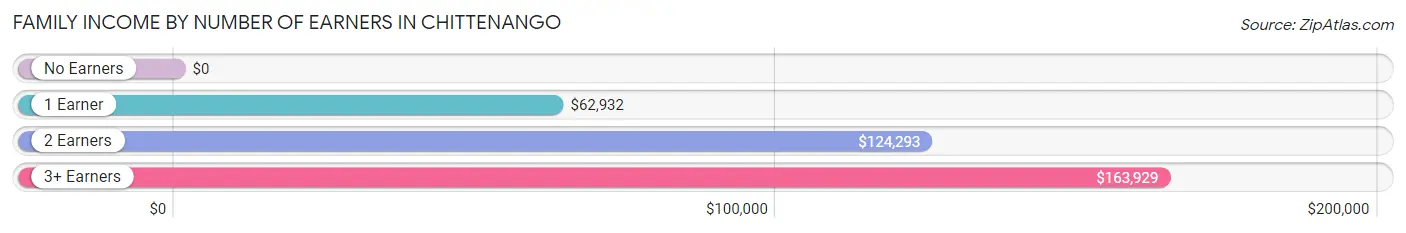
| Number of Earners | # Families | Median Income |
| No Earners | 327 (24.6%) | $0 |
| 1 Earner | 407 (30.6%) | $62,932 |
| 2 Earners | 473 (35.5%) | $124,293 |
| 3+ Earners | 124 (9.3%) | $163,929 |
| Total | 1,331 (100.0%) | $82,596 |
Household Income in Chittenango
Household Income Brackets in Chittenango
With 300 households falling in the category, the $100,000 to $149,999 income range is the most frequent in Chittenango, accounting for 16.1% of all households. In contrast, only 35 households (1.9%) fall into the $10,000 to $14,999 income bracket, making it the least populous group.
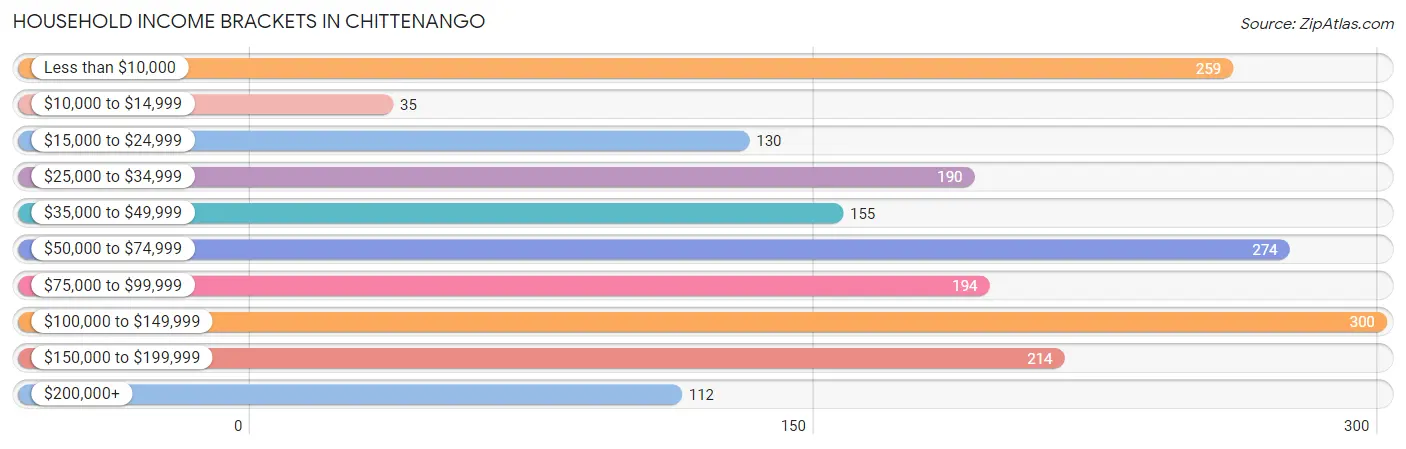
| Income Bracket | # Households | % Households |
| Less than $10,000 | 259 | 13.9% |
| $10,000 to $14,999 | 35 | 1.9% |
| $15,000 to $24,999 | 130 | 7.0% |
| $25,000 to $34,999 | 190 | 10.2% |
| $35,000 to $49,999 | 155 | 8.3% |
| $50,000 to $74,999 | 274 | 14.7% |
| $75,000 to $99,999 | 194 | 10.4% |
| $100,000 to $149,999 | 300 | 16.1% |
| $150,000 to $199,999 | 214 | 11.5% |
| $200,000+ | 112 | 6.0% |
Household Income by Householder Age in Chittenango
The median household income in Chittenango is $63,966, with the highest median household income of $84,028 found in the 45 to 64 years age bracket for the primary householder. A total of 641 households (34.4%) fall into this category. Meanwhile, the 65+ years age bracket for the primary householder has the lowest median household income of $42,054, with 533 households (28.6%) in this group.
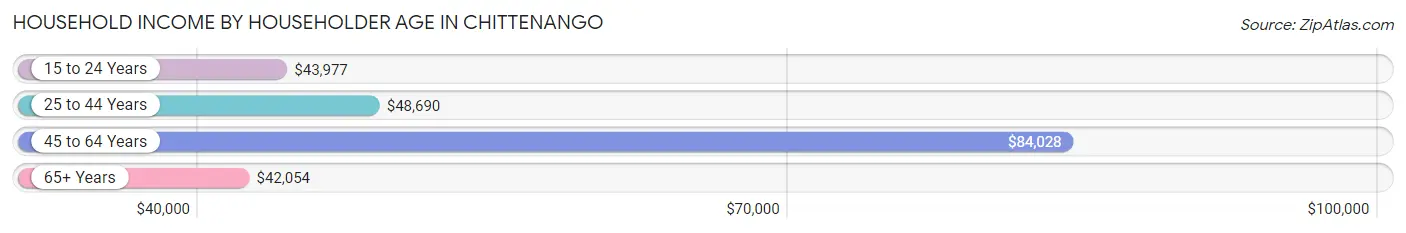
| Income Bracket | # Households | Median Income |
| 15 to 24 Years | 50 (2.7%) | $43,977 |
| 25 to 44 Years | 638 (34.3%) | $48,690 |
| 45 to 64 Years | 641 (34.4%) | $84,028 |
| 65+ Years | 533 (28.6%) | $42,054 |
| Total | 1,862 (100.0%) | $63,966 |
Poverty in Chittenango
Income Below Poverty by Sex and Age in Chittenango
With 19.5% poverty level for males and 9.2% for females among the residents of Chittenango, 12 to 14 year old males and 45 to 54 year old females are the most vulnerable to poverty, with 186 males (76.5%) and 59 females (19.3%) in their respective age groups living below the poverty level.
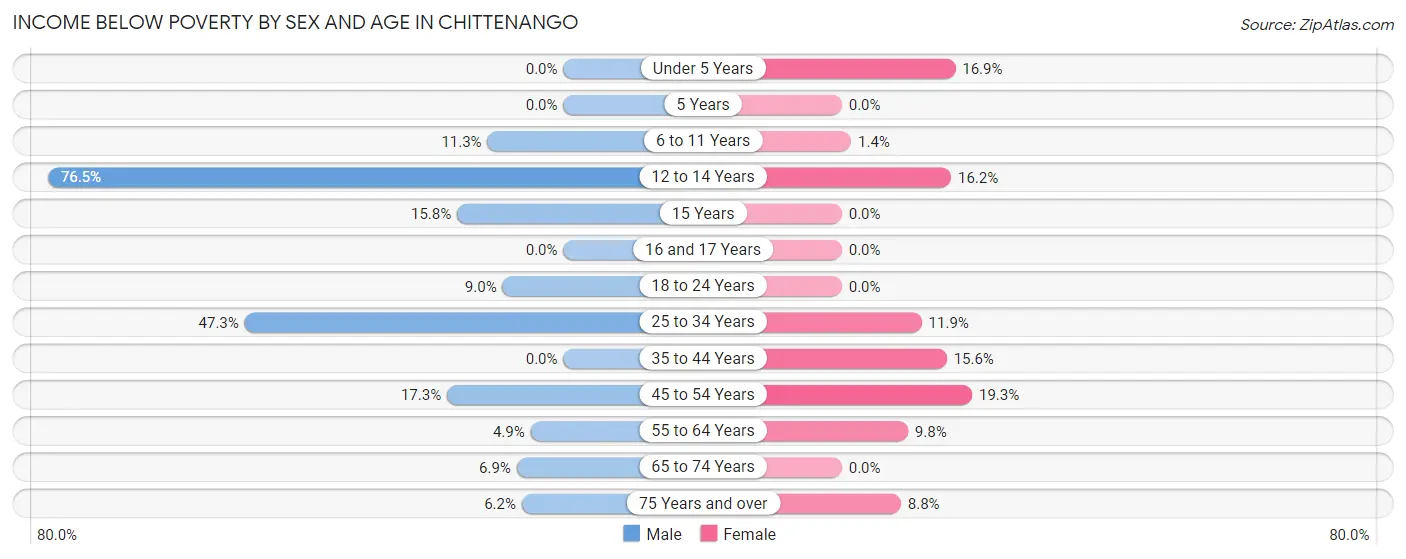
| Age Bracket | Male | Female |
| Under 5 Years | 0 (0.0%) | 15 (16.9%) |
| 5 Years | 0 (0.0%) | 0 (0.0%) |
| 6 to 11 Years | 23 (11.3%) | 2 (1.4%) |
| 12 to 14 Years | 186 (76.5%) | 6 (16.2%) |
| 15 Years | 9 (15.8%) | 0 (0.0%) |
| 16 and 17 Years | 0 (0.0%) | 0 (0.0%) |
| 18 to 24 Years | 30 (9.0%) | 0 (0.0%) |
| 25 to 34 Years | 177 (47.3%) | 35 (11.9%) |
| 35 to 44 Years | 0 (0.0%) | 43 (15.6%) |
| 45 to 54 Years | 52 (17.3%) | 59 (19.3%) |
| 55 to 64 Years | 19 (4.9%) | 28 (9.8%) |
| 65 to 74 Years | 19 (6.9%) | 0 (0.0%) |
| 75 Years and over | 5 (6.2%) | 10 (8.8%) |
| Total | 520 (19.5%) | 198 (9.2%) |
Income Above Poverty by Sex and Age in Chittenango
According to the poverty statistics in Chittenango, males aged under 5 years and females aged 5 years are the age groups that are most secure financially, with 100.0% of males and 100.0% of females in these age groups living above the poverty line.
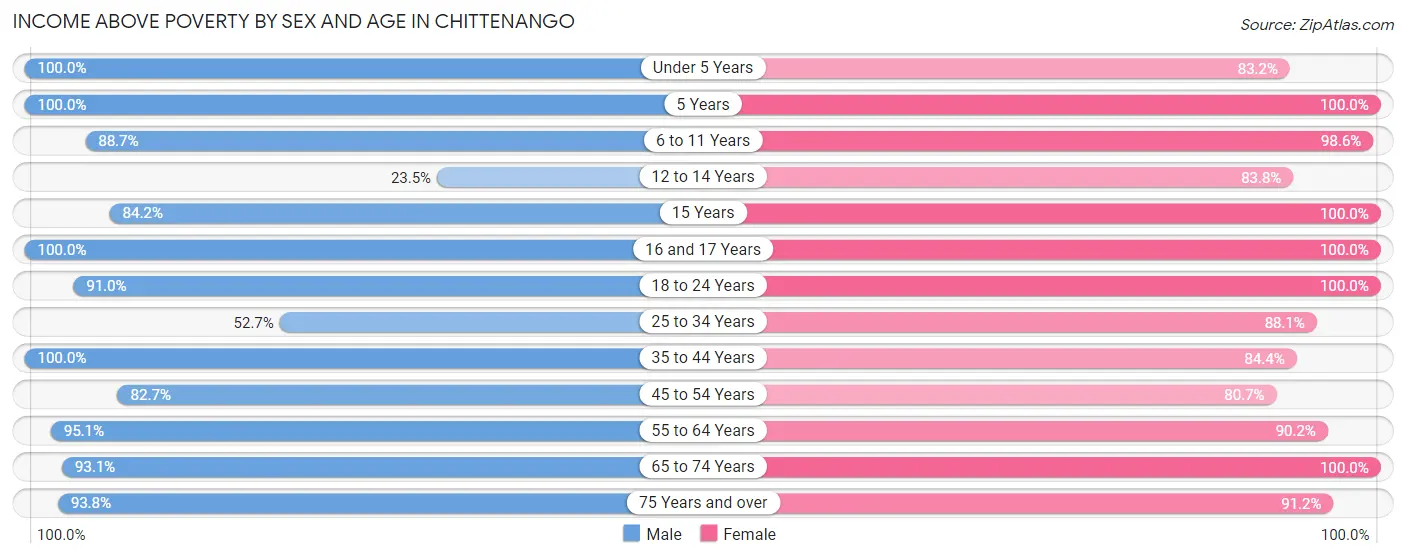
| Age Bracket | Male | Female |
| Under 5 Years | 100 (100.0%) | 74 (83.2%) |
| 5 Years | 7 (100.0%) | 38 (100.0%) |
| 6 to 11 Years | 181 (88.7%) | 143 (98.6%) |
| 12 to 14 Years | 57 (23.5%) | 31 (83.8%) |
| 15 Years | 48 (84.2%) | 25 (100.0%) |
| 16 and 17 Years | 68 (100.0%) | 116 (100.0%) |
| 18 to 24 Years | 302 (91.0%) | 86 (100.0%) |
| 25 to 34 Years | 197 (52.7%) | 260 (88.1%) |
| 35 to 44 Years | 234 (100.0%) | 233 (84.4%) |
| 45 to 54 Years | 249 (82.7%) | 246 (80.7%) |
| 55 to 64 Years | 371 (95.1%) | 257 (90.2%) |
| 65 to 74 Years | 255 (93.1%) | 335 (100.0%) |
| 75 Years and over | 76 (93.8%) | 104 (91.2%) |
| Total | 2,145 (80.5%) | 1,948 (90.8%) |
Income Below Poverty Among Married-Couple Families in Chittenango
The poverty statistics for married-couple families in Chittenango show that 4.1% or 39 of the total 953 families live below the poverty line. Families with no children have the highest poverty rate of 7.3%, comprising of 39 families. On the other hand, families with 1 or 2 children have the lowest poverty rate of 0.0%, which includes 0 families.
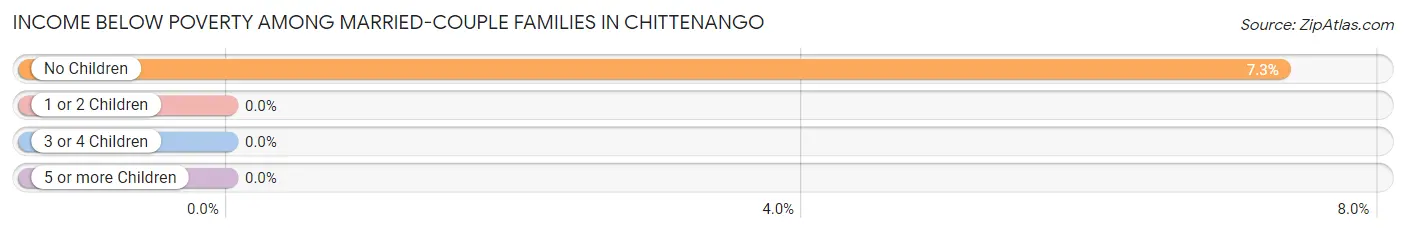
| Children | Above Poverty | Below Poverty |
| No Children | 493 (92.7%) | 39 (7.3%) |
| 1 or 2 Children | 386 (100.0%) | 0 (0.0%) |
| 3 or 4 Children | 35 (100.0%) | 0 (0.0%) |
| 5 or more Children | 0 (0.0%) | 0 (0.0%) |
| Total | 914 (95.9%) | 39 (4.1%) |
Income Below Poverty Among Single-Parent Households in Chittenango
According to the poverty data in Chittenango, 74.7% or 133 single-father households and 31.0% or 62 single-mother households are living below the poverty line. Among single-father households, those with 1 or 2 children have the highest poverty rate, with 133 households (74.7%) experiencing poverty. Likewise, among single-mother households, those with 3 or 4 children have the highest poverty rate, with 2 households (100.0%) falling below the poverty line.
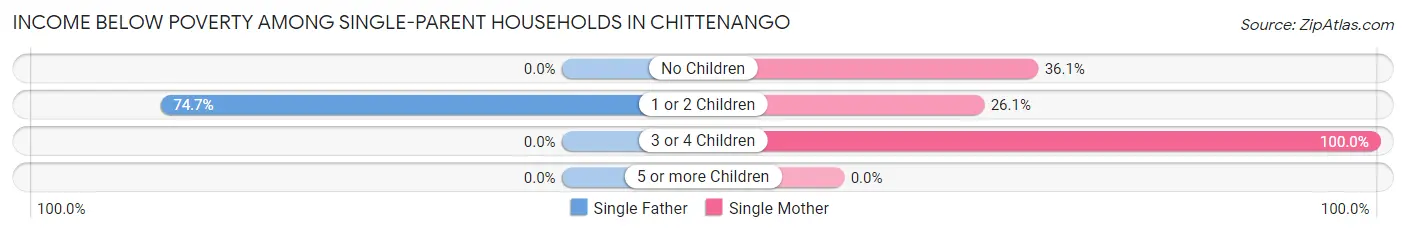
| Children | Single Father | Single Mother |
| No Children | 0 (0.0%) | 30 (36.1%) |
| 1 or 2 Children | 133 (74.7%) | 30 (26.1%) |
| 3 or 4 Children | 0 (0.0%) | 2 (100.0%) |
| 5 or more Children | 0 (0.0%) | 0 (0.0%) |
| Total | 133 (74.7%) | 62 (31.0%) |
Income Below Poverty Among Married-Couple vs Single-Parent Households in Chittenango
The poverty data for Chittenango shows that 39 of the married-couple family households (4.1%) and 195 of the single-parent households (51.6%) are living below the poverty level. Within the married-couple family households, those with no children have the highest poverty rate, with 39 households (7.3%) falling below the poverty line. Among the single-parent households, those with 3 or 4 children have the highest poverty rate, with 2 household (100.0%) living below poverty.
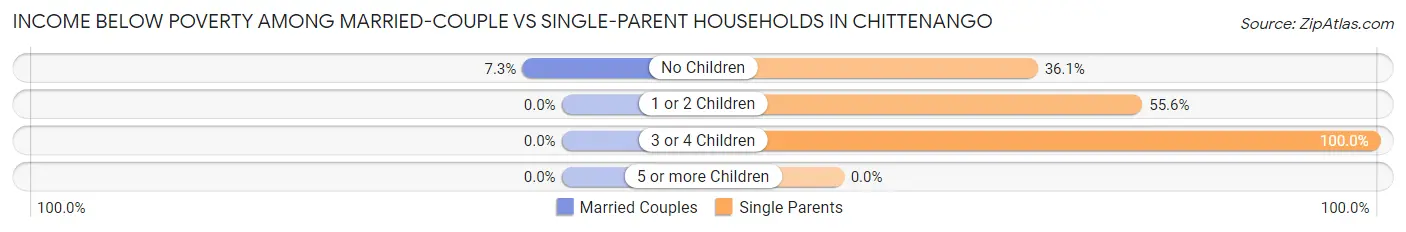
| Children | Married-Couple Families | Single-Parent Households |
| No Children | 39 (7.3%) | 30 (36.1%) |
| 1 or 2 Children | 0 (0.0%) | 163 (55.6%) |
| 3 or 4 Children | 0 (0.0%) | 2 (100.0%) |
| 5 or more Children | 0 (0.0%) | 0 (0.0%) |
| Total | 39 (4.1%) | 195 (51.6%) |
Race in Chittenango
The most populous races in Chittenango are White / Caucasian (4,654 | 95.3%), Hispanic or Latino (141 | 2.9%), and Two or more Races (137 | 2.8%).
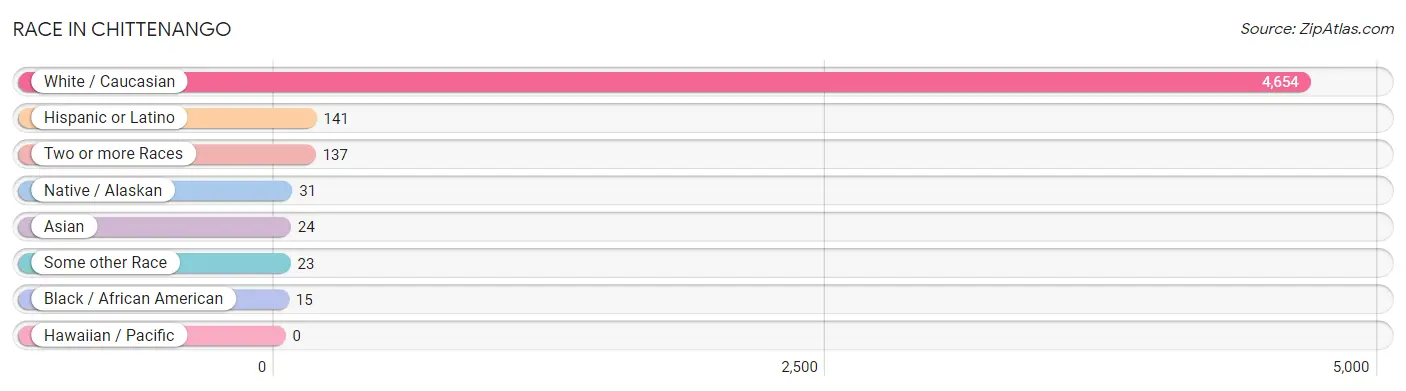
| Race | # Population | % Population |
| Asian | 24 | 0.5% |
| Black / African American | 15 | 0.3% |
| Hawaiian / Pacific | 0 | 0.0% |
| Hispanic or Latino | 141 | 2.9% |
| Native / Alaskan | 31 | 0.6% |
| White / Caucasian | 4,654 | 95.3% |
| Two or more Races | 137 | 2.8% |
| Some other Race | 23 | 0.5% |
| Total | 4,884 | 100.0% |
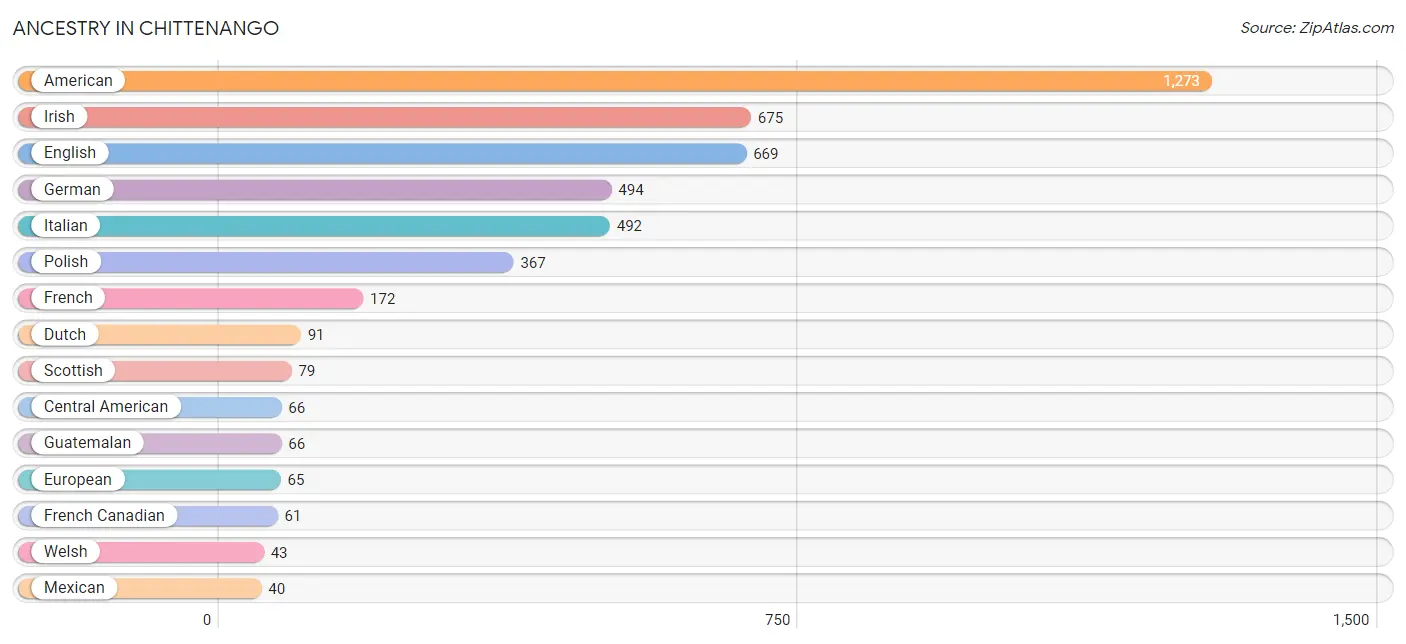
Ancestry in Chittenango
The most populous ancestries reported in Chittenango are American (1,273 | 26.1%), Irish (675 | 13.8%), English (669 | 13.7%), German (494 | 10.1%), and Italian (492 | 10.1%), together accounting for 73.8% of all Chittenango residents.
| Ancestry | # Population | % Population |
| American | 1,273 | 26.1% |
| Arab | 21 | 0.4% |
| British | 38 | 0.8% |
| Burmese | 24 | 0.5% |
| Canadian | 5 | 0.1% |
| Central American | 66 | 1.3% |
| Cherokee | 1 | 0.0% |
| Czech | 2 | 0.0% |
| Danish | 2 | 0.0% |
| Dutch | 91 | 1.9% |
| Eastern European | 19 | 0.4% |
| English | 669 | 13.7% |
| European | 65 | 1.3% |
| Finnish | 5 | 0.1% |
| French | 172 | 3.5% |
| French American Indian | 22 | 0.4% |
| French Canadian | 61 | 1.3% |
| German | 494 | 10.1% |
| Greek | 6 | 0.1% |
| Guatemalan | 66 | 1.3% |
| Hungarian | 9 | 0.2% |
| Irish | 675 | 13.8% |
| Iroquois | 15 | 0.3% |
| Italian | 492 | 10.1% |
| Lebanese | 4 | 0.1% |
| Lithuanian | 8 | 0.2% |
| Luxembourger | 14 | 0.3% |
| Mexican | 40 | 0.8% |
| Norwegian | 5 | 0.1% |
| Polish | 367 | 7.5% |
| Puerto Rican | 26 | 0.5% |
| Russian | 5 | 0.1% |
| Scotch-Irish | 36 | 0.7% |
| Scottish | 79 | 1.6% |
| Swedish | 14 | 0.3% |
| Swiss | 3 | 0.1% |
| Ukrainian | 2 | 0.0% |
| Welsh | 43 | 0.9% |
| Yugoslavian | 2 | 0.0% | View All 39 Rows |
Immigrants in Chittenango
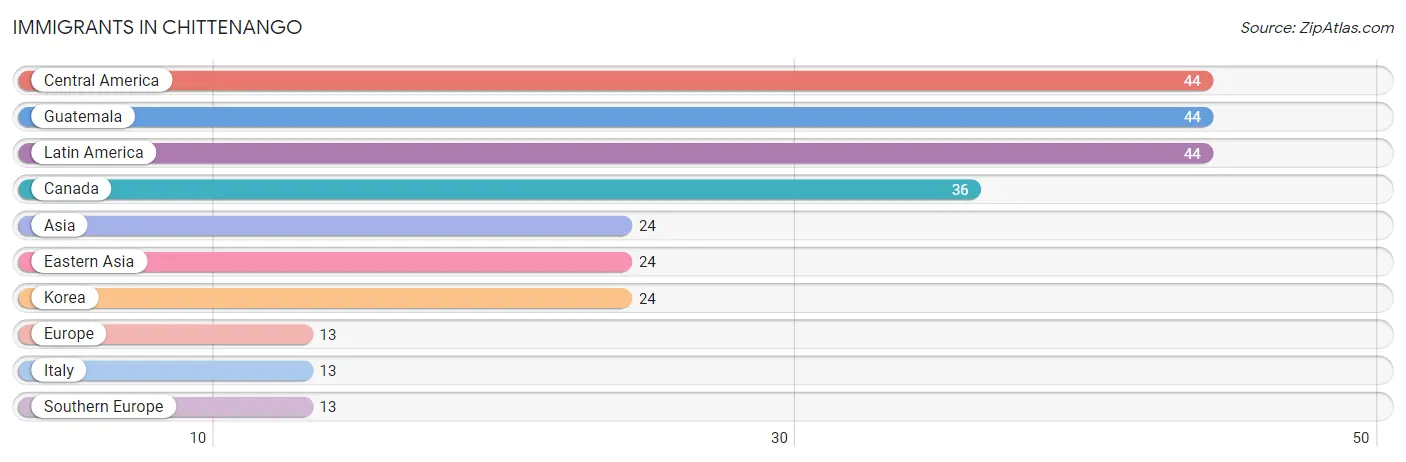
The most numerous immigrant groups reported in Chittenango came from Central America (44 | 0.9%), Guatemala (44 | 0.9%), Latin America (44 | 0.9%), Canada (36 | 0.7%), and Asia (24 | 0.5%), together accounting for 3.9% of all Chittenango residents.
| Immigration Origin | # Population | % Population |
| Asia | 24 | 0.5% |
| Canada | 36 | 0.7% |
| Central America | 44 | 0.9% |
| Eastern Asia | 24 | 0.5% |
| Europe | 13 | 0.3% |
| Guatemala | 44 | 0.9% |
| Italy | 13 | 0.3% |
| Korea | 24 | 0.5% |
| Latin America | 44 | 0.9% |
| Southern Europe | 13 | 0.3% | View All 10 Rows |
Sex and Age in Chittenango
Sex and Age in Chittenango
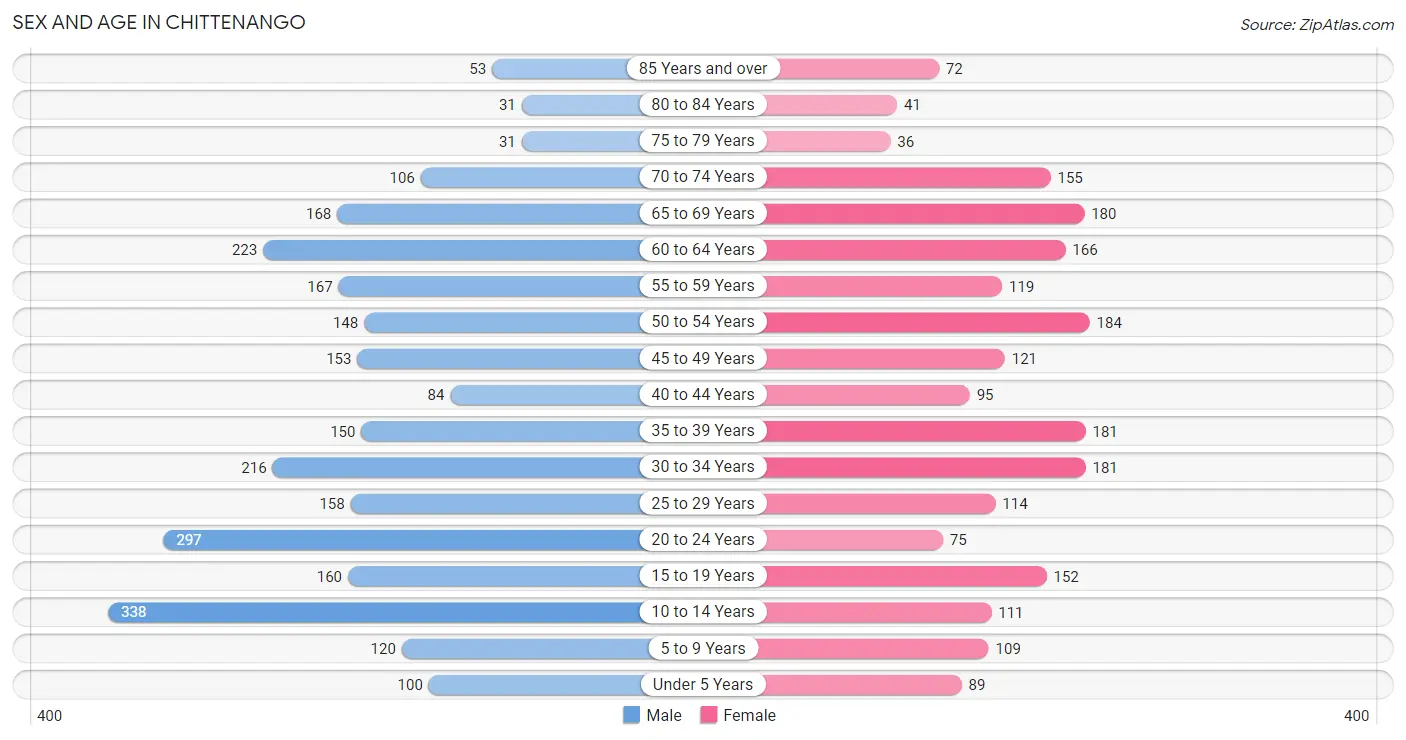
The most populous age groups in Chittenango are 10 to 14 Years (338 | 12.5%) for men and 50 to 54 Years (184 | 8.4%) for women.
| Age Bracket | Male | Female |
| Under 5 Years | 100 (3.7%) | 89 (4.1%) |
| 5 to 9 Years | 120 (4.4%) | 109 (5.0%) |
| 10 to 14 Years | 338 (12.5%) | 111 (5.1%) |
| 15 to 19 Years | 160 (5.9%) | 152 (7.0%) |
| 20 to 24 Years | 297 (11.0%) | 75 (3.4%) |
| 25 to 29 Years | 158 (5.9%) | 114 (5.2%) |
| 30 to 34 Years | 216 (8.0%) | 181 (8.3%) |
| 35 to 39 Years | 150 (5.6%) | 181 (8.3%) |
| 40 to 44 Years | 84 (3.1%) | 95 (4.4%) |
| 45 to 49 Years | 153 (5.7%) | 121 (5.6%) |
| 50 to 54 Years | 148 (5.5%) | 184 (8.4%) |
| 55 to 59 Years | 167 (6.2%) | 119 (5.5%) |
| 60 to 64 Years | 223 (8.3%) | 166 (7.6%) |
| 65 to 69 Years | 168 (6.2%) | 180 (8.3%) |
| 70 to 74 Years | 106 (3.9%) | 155 (7.1%) |
| 75 to 79 Years | 31 (1.1%) | 36 (1.7%) |
| 80 to 84 Years | 31 (1.1%) | 41 (1.9%) |
| 85 Years and over | 53 (2.0%) | 72 (3.3%) |
| Total | 2,703 (100.0%) | 2,181 (100.0%) |
Families and Households in Chittenango
Median Family Size in Chittenango
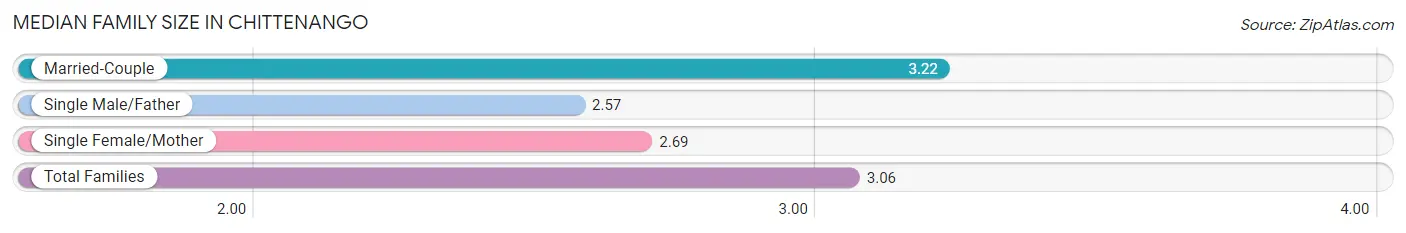
The median family size in Chittenango is 3.06 persons per family, with married-couple families (953 | 71.6%) accounting for the largest median family size of 3.22 persons per family. On the other hand, single male/father families (178 | 13.4%) represent the smallest median family size with 2.57 persons per family.
| Family Type | # Families | Family Size |
| Married-Couple | 953 (71.6%) | 3.22 |
| Single Male/Father | 178 (13.4%) | 2.57 |
| Single Female/Mother | 200 (15.0%) | 2.69 |
| Total Families | 1,331 (100.0%) | 3.06 |
Median Household Size in Chittenango
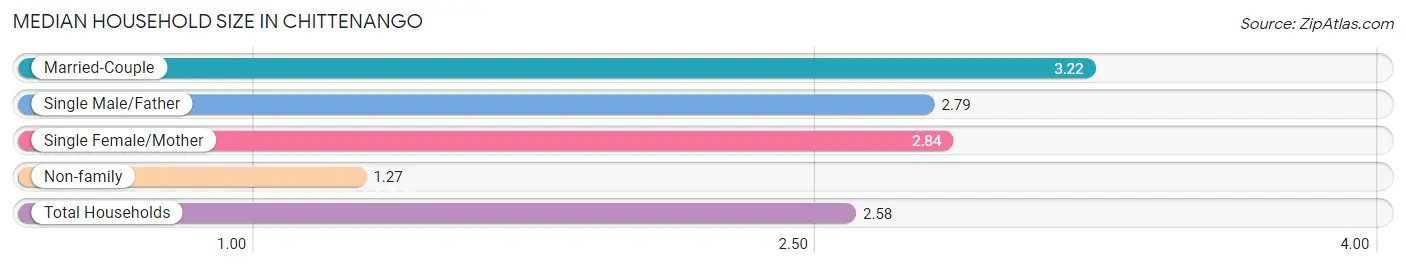
The median household size in Chittenango is 2.58 persons per household, with married-couple households (953 | 51.2%) accounting for the largest median household size of 3.22 persons per household. non-family households (531 | 28.5%) represent the smallest median household size with 1.27 persons per household.
| Household Type | # Households | Household Size |
| Married-Couple | 953 (51.2%) | 3.22 |
| Single Male/Father | 178 (9.6%) | 2.79 |
| Single Female/Mother | 200 (10.7%) | 2.84 |
| Non-family | 531 (28.5%) | 1.27 |
| Total Households | 1,862 (100.0%) | 2.58 |
Household Size by Marriage Status in Chittenango
Out of a total of 1,862 households in Chittenango, 1,331 (71.5%) are family households, while 531 (28.5%) are nonfamily households. The most numerous type of family households are 2-person households, comprising 671, and the most common type of nonfamily households are 1-person households, comprising 418.
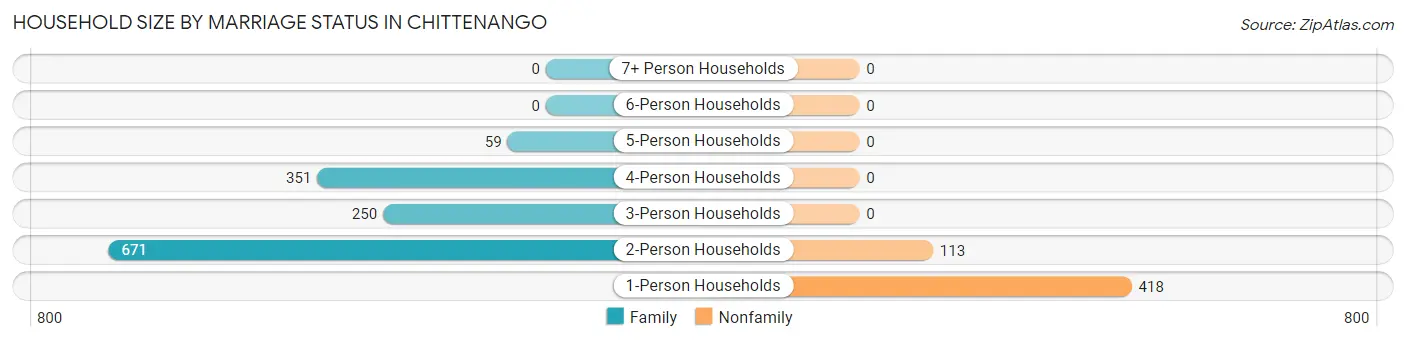
| Household Size | Family Households | Nonfamily Households |
| 1-Person Households | - | 418 (22.5%) |
| 2-Person Households | 671 (36.0%) | 113 (6.1%) |
| 3-Person Households | 250 (13.4%) | 0 (0.0%) |
| 4-Person Households | 351 (18.9%) | 0 (0.0%) |
| 5-Person Households | 59 (3.2%) | 0 (0.0%) |
| 6-Person Households | 0 (0.0%) | 0 (0.0%) |
| 7+ Person Households | 0 (0.0%) | 0 (0.0%) |
| Total | 1,331 (71.5%) | 531 (28.5%) |
Female Fertility in Chittenango
Fertility by Age in Chittenango
Average fertility rate in Chittenango is 74.0 births per 1,000 women. Women in the age bracket of 20 to 34 years have the highest fertility rate with 159.0 births per 1,000 women. Women in the age bracket of 20 to 34 years acount for 86.8% of all women with births.
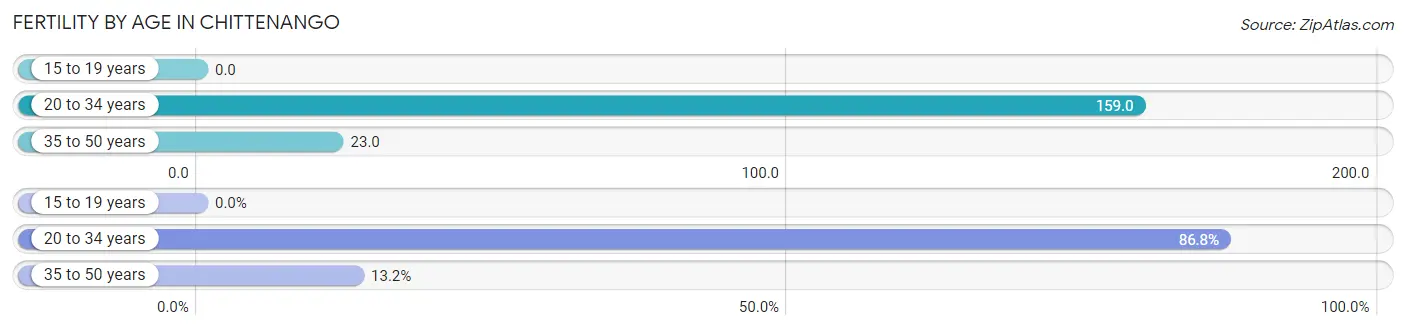
| Age Bracket | Women with Births | Births / 1,000 Women |
| 15 to 19 years | 0 (0.0%) | 0.0 |
| 20 to 34 years | 59 (86.8%) | 159.0 |
| 35 to 50 years | 9 (13.2%) | 23.0 |
| Total | 68 (100.0%) | 74.0 |
Fertility by Age by Marriage Status in Chittenango
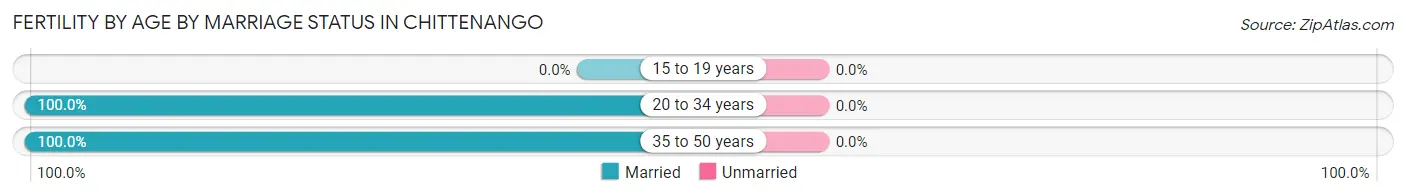
| Age Bracket | Married | Unmarried |
| 15 to 19 years | 0 (0.0%) | 0 (0.0%) |
| 20 to 34 years | 59 (100.0%) | 0 (0.0%) |
| 35 to 50 years | 9 (100.0%) | 0 (0.0%) |
| Total | 68 (100.0%) | 0 (0.0%) |
Fertility by Education in Chittenango
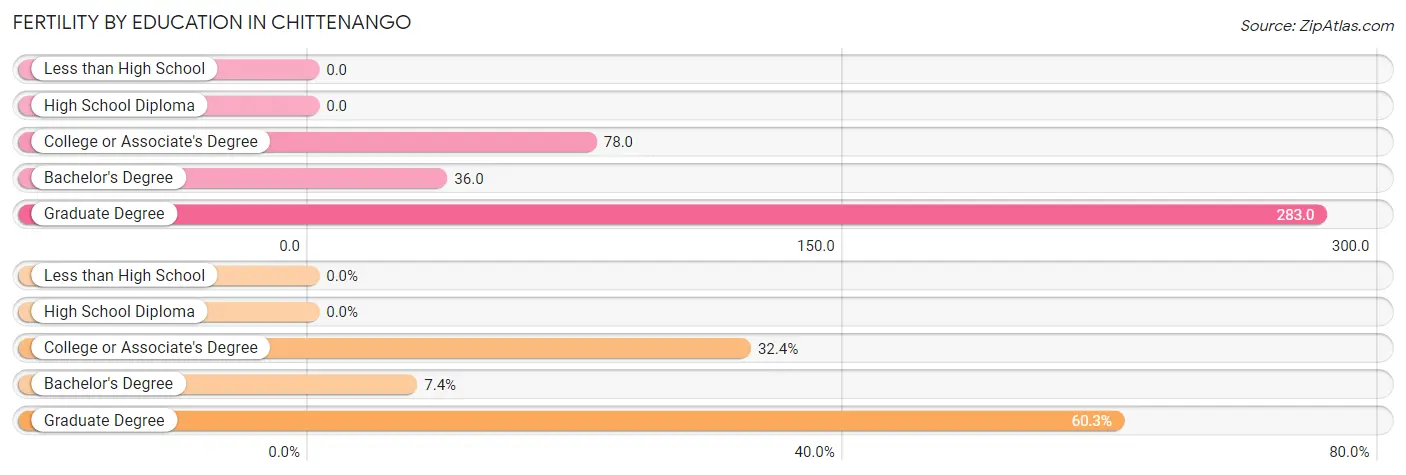
| Educational Attainment | Women with Births | Births / 1,000 Women |
| Less than High School | 0 (0.0%) | 0.0 |
| High School Diploma | 0 (0.0%) | 0.0 |
| College or Associate's Degree | 22 (32.4%) | 78.0 |
| Bachelor's Degree | 5 (7.3%) | 36.0 |
| Graduate Degree | 41 (60.3%) | 283.0 |
| Total | 68 (100.0%) | 74.0 |
Fertility by Education by Marriage Status in Chittenango
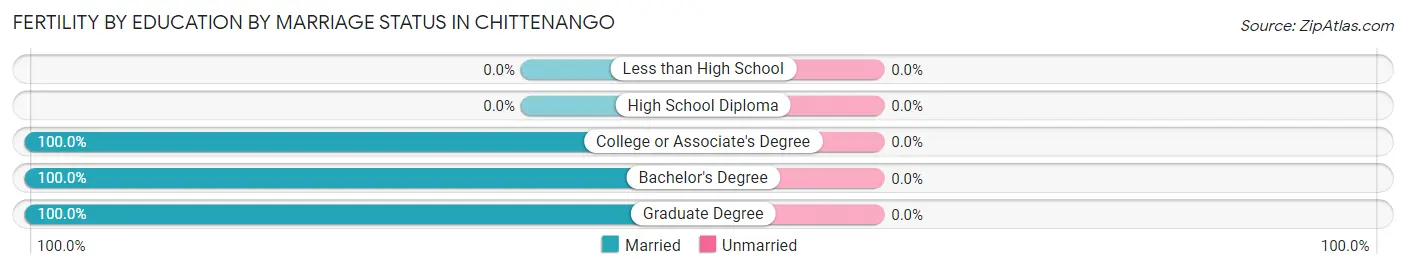
| Educational Attainment | Married | Unmarried |
| Less than High School | 0 (0.0%) | 0 (0.0%) |
| High School Diploma | 0 (0.0%) | 0 (0.0%) |
| College or Associate's Degree | 22 (100.0%) | 0 (0.0%) |
| Bachelor's Degree | 5 (100.0%) | 0 (0.0%) |
| Graduate Degree | 41 (100.0%) | 0 (0.0%) |
| Total | 68 (100.0%) | 0 (0.0%) |
Employment Characteristics in Chittenango
Employment by Class of Employer in Chittenango
Among the 2,074 employed individuals in Chittenango, private company employees (1,192 | 57.5%), not-for-profit organizations (321 | 15.5%), and local government employees (253 | 12.2%) make up the most common classes of employment.
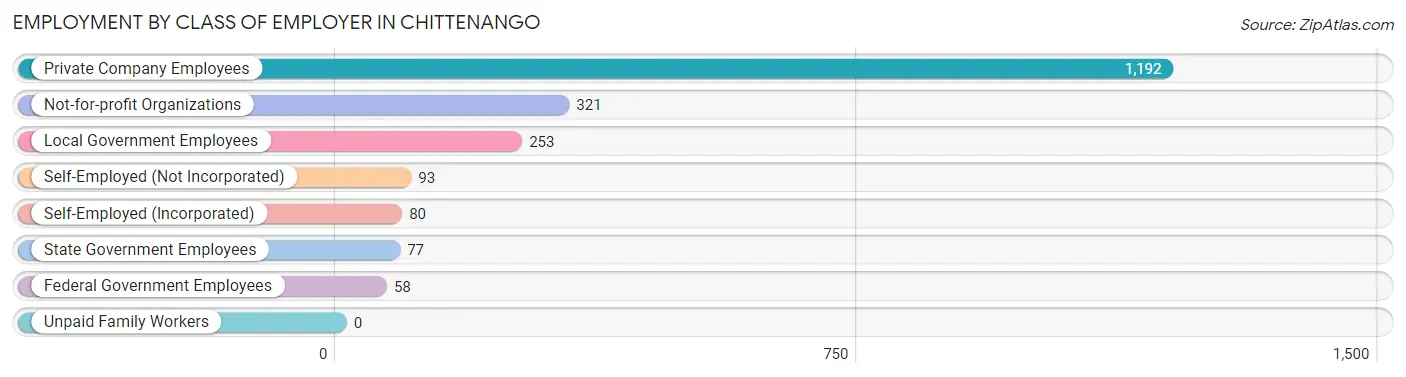
| Employer Class | # Employees | % Employees |
| Private Company Employees | 1,192 | 57.5% |
| Self-Employed (Incorporated) | 80 | 3.9% |
| Self-Employed (Not Incorporated) | 93 | 4.5% |
| Not-for-profit Organizations | 321 | 15.5% |
| Local Government Employees | 253 | 12.2% |
| State Government Employees | 77 | 3.7% |
| Federal Government Employees | 58 | 2.8% |
| Unpaid Family Workers | 0 | 0.0% |
| Total | 2,074 | 100.0% |
Employment Status by Age in Chittenango
According to the labor force statistics for Chittenango, out of the total population over 16 years of age (3,935), 55.6% or 2,188 individuals are in the labor force, with 4.7% or 103 of them unemployed. The age group with the highest labor force participation rate is 35 to 44 years, with 85.5% or 436 individuals in the labor force. Within the labor force, the 16 to 19 years age range has the highest percentage of unemployed individuals, with 22.4% or 17 of them being unemployed.
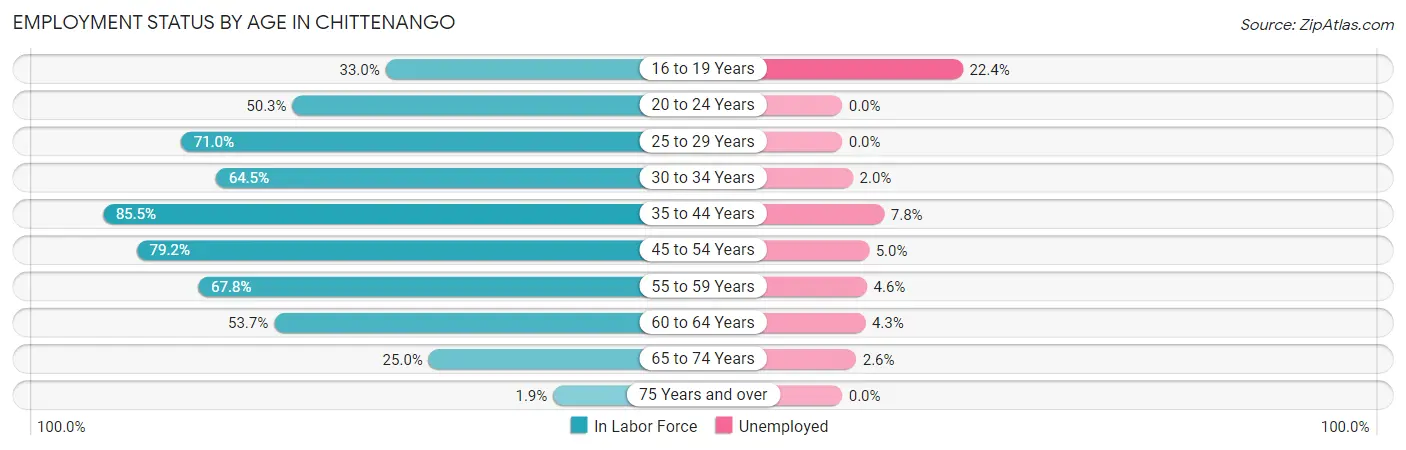
| Age Bracket | In Labor Force | Unemployed |
| 16 to 19 Years | 76 (33.0%) | 17 (22.4%) |
| 20 to 24 Years | 187 (50.3%) | 0 (0.0%) |
| 25 to 29 Years | 193 (71.0%) | 0 (0.0%) |
| 30 to 34 Years | 256 (64.5%) | 5 (2.0%) |
| 35 to 44 Years | 436 (85.5%) | 34 (7.8%) |
| 45 to 54 Years | 480 (79.2%) | 24 (5.0%) |
| 55 to 59 Years | 194 (67.8%) | 9 (4.6%) |
| 60 to 64 Years | 209 (53.7%) | 9 (4.3%) |
| 65 to 74 Years | 152 (25.0%) | 4 (2.6%) |
| 75 Years and over | 5 (1.9%) | 0 (0.0%) |
| Total | 2,188 (55.6%) | 103 (4.7%) |
Employment Status by Educational Attainment in Chittenango
According to labor force statistics for Chittenango, 71.9% of individuals (1,769) out of the total population between 25 and 64 years of age (2,460) are in the labor force, with 4.6% or 81 of them being unemployed. The group with the highest labor force participation rate are those with the educational attainment of bachelor's degree or higher, with 91.5% or 761 individuals in the labor force. Within the labor force, individuals with less than high school education have the highest percentage of unemployment, with 15.7% or 8 of them being unemployed.
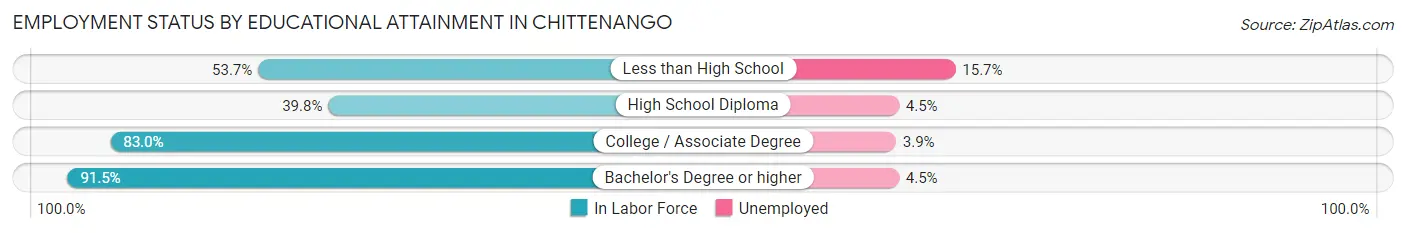
| Educational Attainment | In Labor Force | Unemployed |
| Less than High School | 51 (53.7%) | 15 (15.7%) |
| High School Diploma | 291 (39.8%) | 33 (4.5%) |
| College / Associate Degree | 665 (83.0%) | 31 (3.9%) |
| Bachelor's Degree or higher | 761 (91.5%) | 37 (4.5%) |
| Total | 1,769 (71.9%) | 113 (4.6%) |
Employment Occupations by Sex in Chittenango
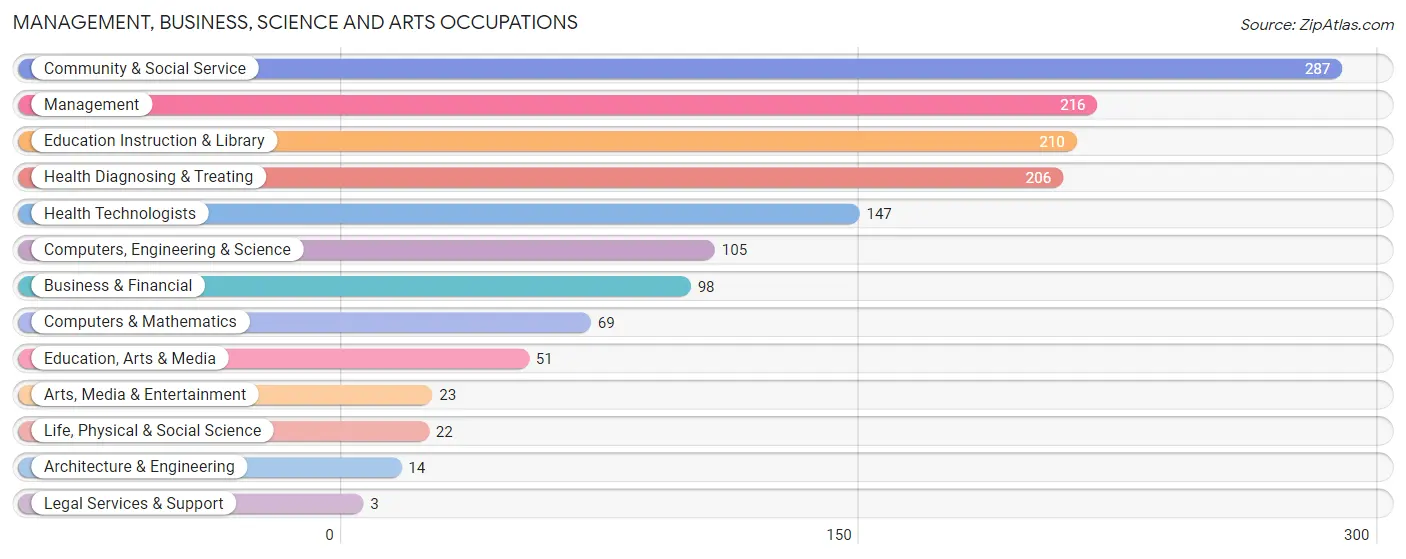
Management, Business, Science and Arts Occupations
The most common Management, Business, Science and Arts occupations in Chittenango are Community & Social Service (287 | 13.8%), Management (216 | 10.3%), Education Instruction & Library (210 | 10.1%), Health Diagnosing & Treating (206 | 9.9%), and Health Technologists (147 | 7.0%).
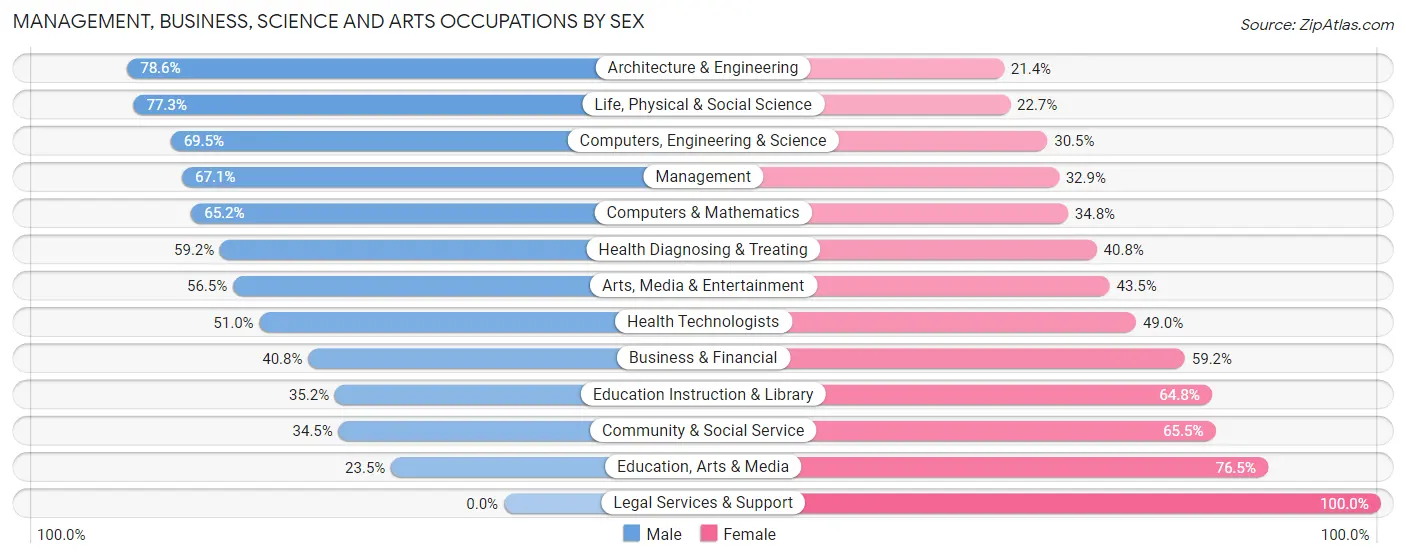
Management, Business, Science and Arts Occupations by Sex
Within the Management, Business, Science and Arts occupations in Chittenango, the most male-oriented occupations are Architecture & Engineering (78.6%), Life, Physical & Social Science (77.3%), and Computers, Engineering & Science (69.5%), while the most female-oriented occupations are Legal Services & Support (100.0%), Education, Arts & Media (76.5%), and Community & Social Service (65.5%).
| Occupation | Male | Female |
| Management | 145 (67.1%) | 71 (32.9%) |
| Business & Financial | 40 (40.8%) | 58 (59.2%) |
| Computers, Engineering & Science | 73 (69.5%) | 32 (30.5%) |
| Computers & Mathematics | 45 (65.2%) | 24 (34.8%) |
| Architecture & Engineering | 11 (78.6%) | 3 (21.4%) |
| Life, Physical & Social Science | 17 (77.3%) | 5 (22.7%) |
| Community & Social Service | 99 (34.5%) | 188 (65.5%) |
| Education, Arts & Media | 12 (23.5%) | 39 (76.5%) |
| Legal Services & Support | 0 (0.0%) | 3 (100.0%) |
| Education Instruction & Library | 74 (35.2%) | 136 (64.8%) |
| Arts, Media & Entertainment | 13 (56.5%) | 10 (43.5%) |
| Health Diagnosing & Treating | 122 (59.2%) | 84 (40.8%) |
| Health Technologists | 75 (51.0%) | 72 (49.0%) |
| Total (Category) | 479 (52.5%) | 433 (47.5%) |
| Total (Overall) | 1,079 (51.7%) | 1,007 (48.3%) |
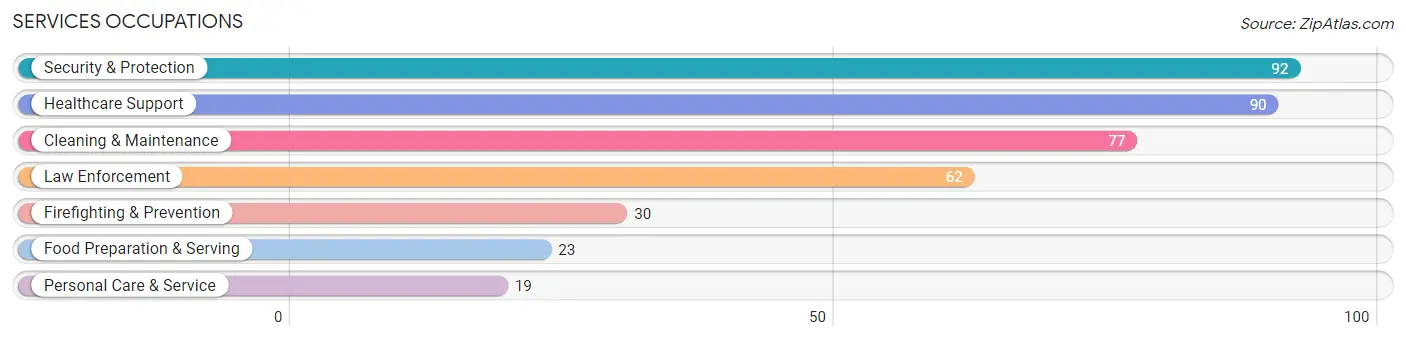
Services Occupations
The most common Services occupations in Chittenango are Security & Protection (92 | 4.4%), Healthcare Support (90 | 4.3%), Cleaning & Maintenance (77 | 3.7%), Law Enforcement (62 | 3.0%), and Firefighting & Prevention (30 | 1.4%).
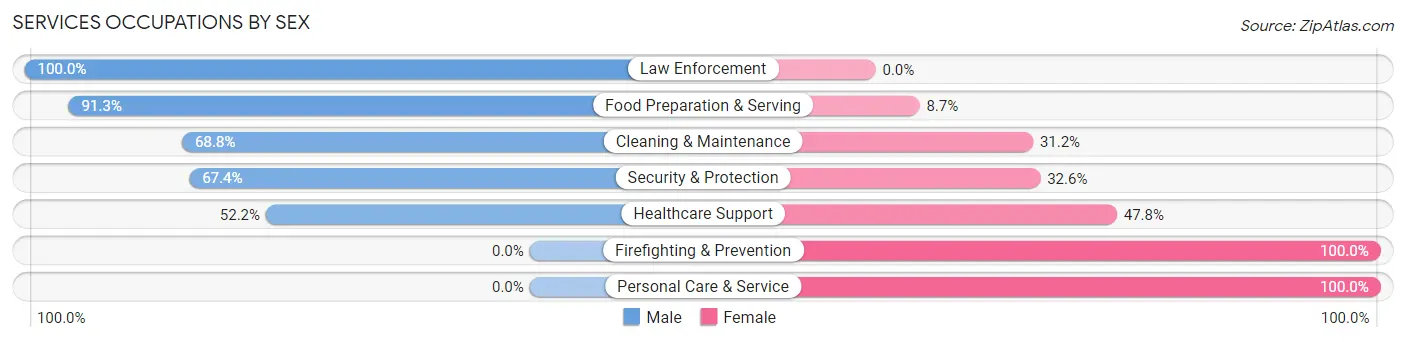
Services Occupations by Sex
Within the Services occupations in Chittenango, the most male-oriented occupations are Law Enforcement (100.0%), Food Preparation & Serving (91.3%), and Cleaning & Maintenance (68.8%), while the most female-oriented occupations are Firefighting & Prevention (100.0%), Personal Care & Service (100.0%), and Healthcare Support (47.8%).
| Occupation | Male | Female |
| Healthcare Support | 47 (52.2%) | 43 (47.8%) |
| Security & Protection | 62 (67.4%) | 30 (32.6%) |
| Firefighting & Prevention | 0 (0.0%) | 30 (100.0%) |
| Law Enforcement | 62 (100.0%) | 0 (0.0%) |
| Food Preparation & Serving | 21 (91.3%) | 2 (8.7%) |
| Cleaning & Maintenance | 53 (68.8%) | 24 (31.2%) |
| Personal Care & Service | 0 (0.0%) | 19 (100.0%) |
| Total (Category) | 183 (60.8%) | 118 (39.2%) |
| Total (Overall) | 1,079 (51.7%) | 1,007 (48.3%) |
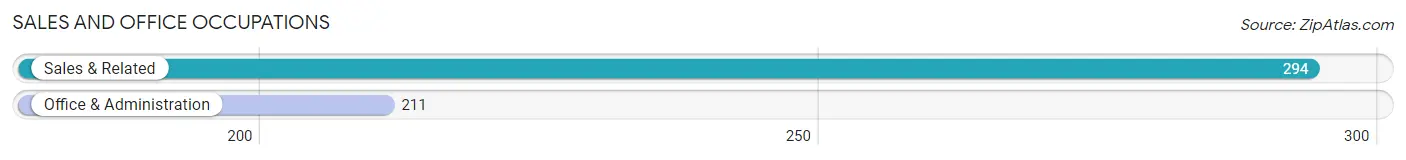
Sales and Office Occupations
The most common Sales and Office occupations in Chittenango are Sales & Related (294 | 14.1%), and Office & Administration (211 | 10.1%).
Sales and Office Occupations by Sex
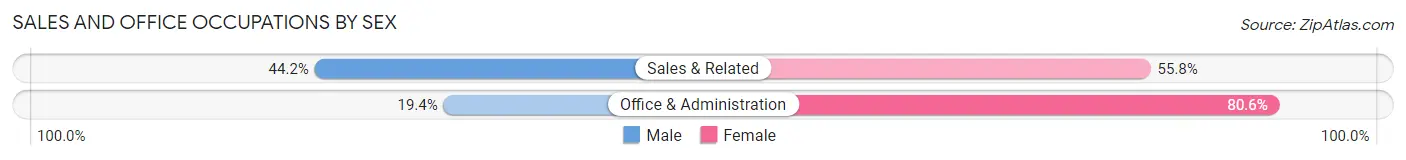
| Occupation | Male | Female |
| Sales & Related | 130 (44.2%) | 164 (55.8%) |
| Office & Administration | 41 (19.4%) | 170 (80.6%) |
| Total (Category) | 171 (33.9%) | 334 (66.1%) |
| Total (Overall) | 1,079 (51.7%) | 1,007 (48.3%) |
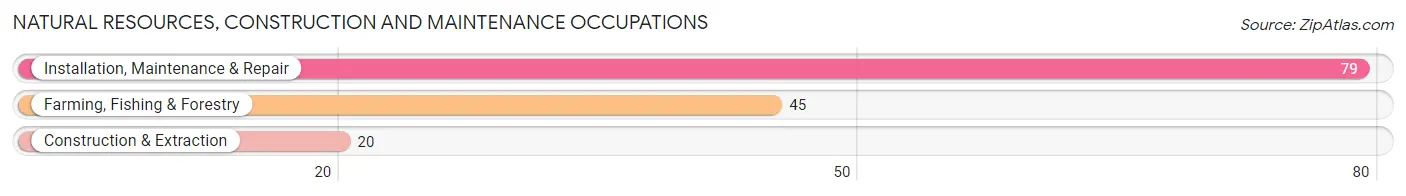
Natural Resources, Construction and Maintenance Occupations
The most common Natural Resources, Construction and Maintenance occupations in Chittenango are Installation, Maintenance & Repair (79 | 3.8%), Farming, Fishing & Forestry (45 | 2.2%), and Construction & Extraction (20 | 1.0%).
Natural Resources, Construction and Maintenance Occupations by Sex
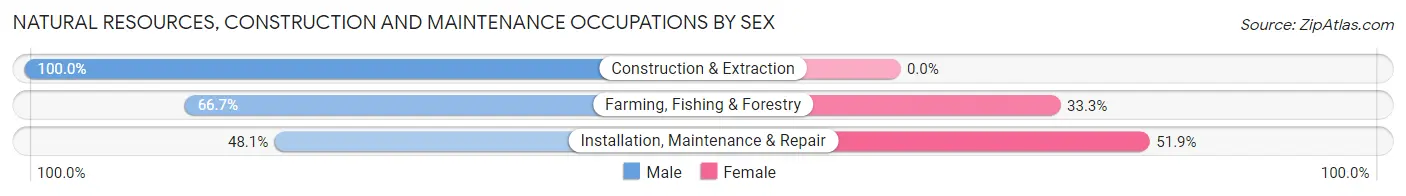
| Occupation | Male | Female |
| Farming, Fishing & Forestry | 30 (66.7%) | 15 (33.3%) |
| Construction & Extraction | 20 (100.0%) | 0 (0.0%) |
| Installation, Maintenance & Repair | 38 (48.1%) | 41 (51.9%) |
| Total (Category) | 88 (61.1%) | 56 (38.9%) |
| Total (Overall) | 1,079 (51.7%) | 1,007 (48.3%) |
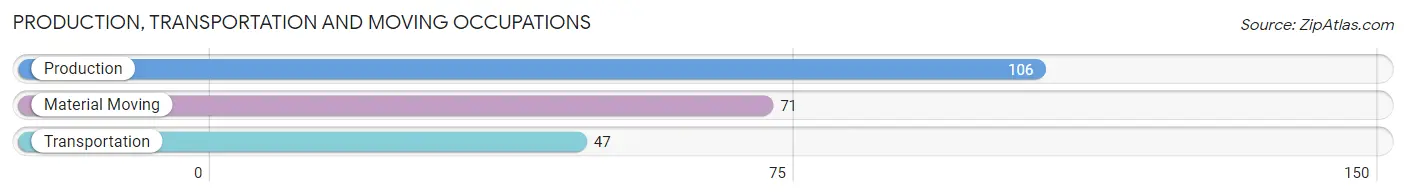
Production, Transportation and Moving Occupations
The most common Production, Transportation and Moving occupations in Chittenango are Production (106 | 5.1%), Material Moving (71 | 3.4%), and Transportation (47 | 2.2%).
Production, Transportation and Moving Occupations by Sex
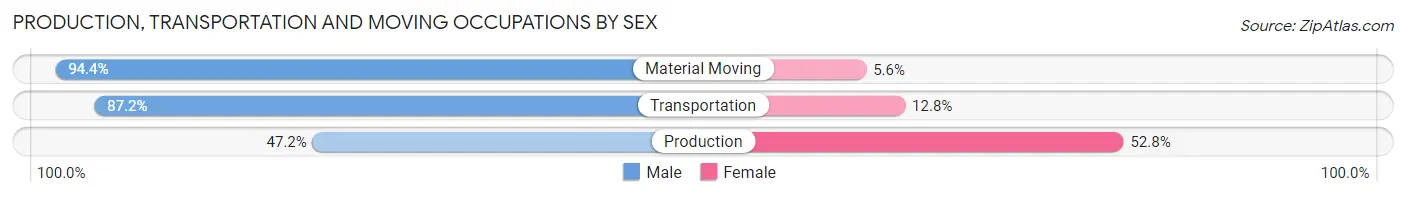
| Occupation | Male | Female |
| Production | 50 (47.2%) | 56 (52.8%) |
| Transportation | 41 (87.2%) | 6 (12.8%) |
| Material Moving | 67 (94.4%) | 4 (5.6%) |
| Total (Category) | 158 (70.5%) | 66 (29.5%) |
| Total (Overall) | 1,079 (51.7%) | 1,007 (48.3%) |
Employment Industries by Sex in Chittenango
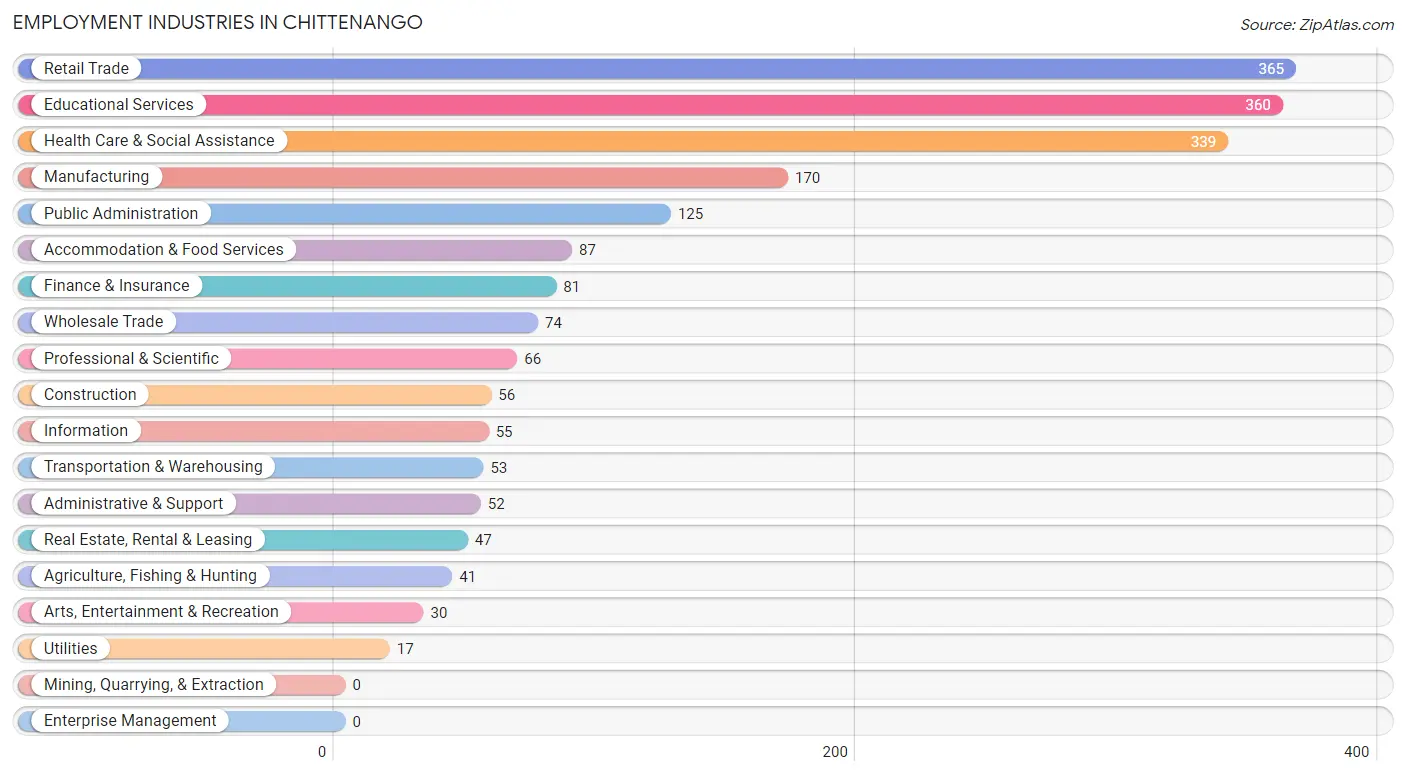
Employment Industries in Chittenango
The major employment industries in Chittenango include Retail Trade (365 | 17.5%), Educational Services (360 | 17.3%), Health Care & Social Assistance (339 | 16.3%), Manufacturing (170 | 8.2%), and Public Administration (125 | 6.0%).
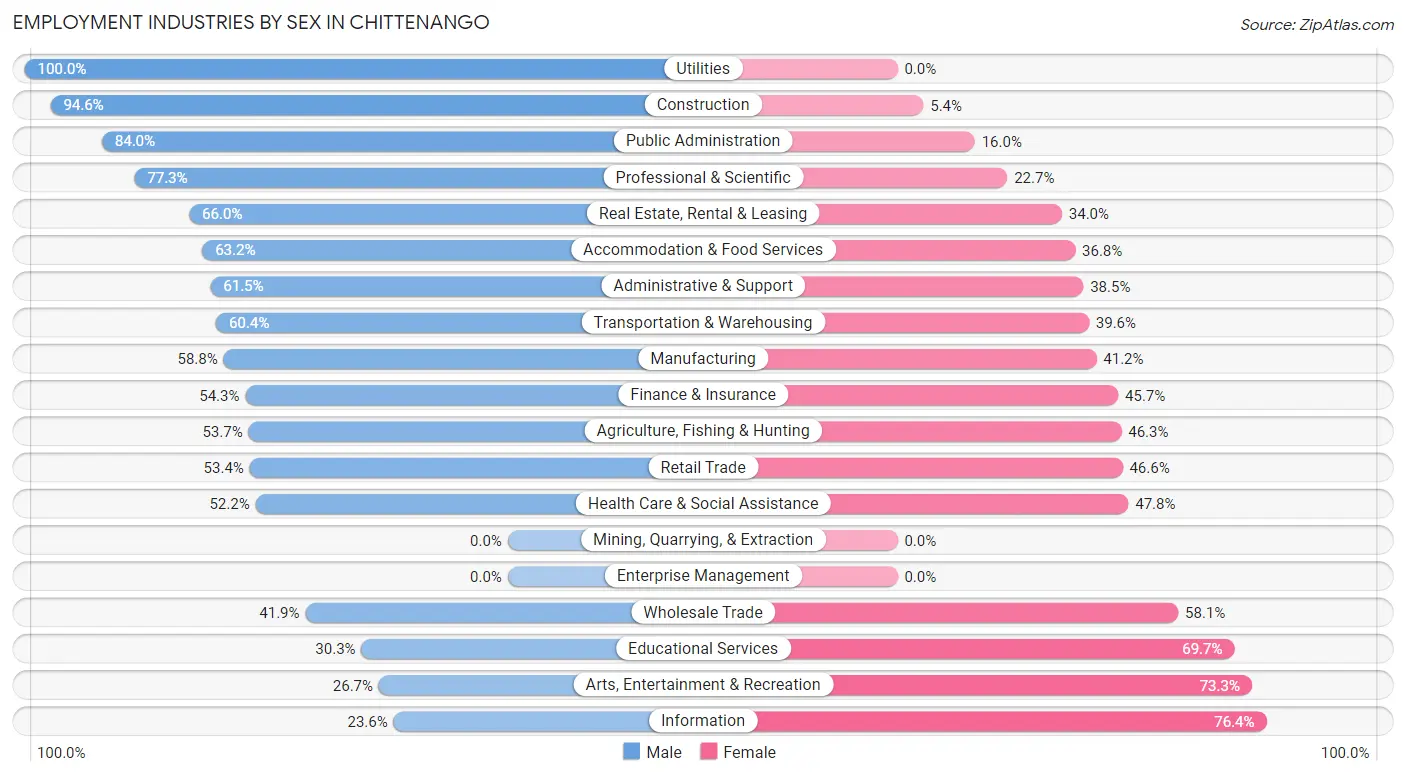
Employment Industries by Sex in Chittenango
The Chittenango industries that see more men than women are Utilities (100.0%), Construction (94.6%), and Public Administration (84.0%), whereas the industries that tend to have a higher number of women are Information (76.4%), Arts, Entertainment & Recreation (73.3%), and Educational Services (69.7%).
| Industry | Male | Female |
| Agriculture, Fishing & Hunting | 22 (53.7%) | 19 (46.3%) |
| Mining, Quarrying, & Extraction | 0 (0.0%) | 0 (0.0%) |
| Construction | 53 (94.6%) | 3 (5.4%) |
| Manufacturing | 100 (58.8%) | 70 (41.2%) |
| Wholesale Trade | 31 (41.9%) | 43 (58.1%) |
| Retail Trade | 195 (53.4%) | 170 (46.6%) |
| Transportation & Warehousing | 32 (60.4%) | 21 (39.6%) |
| Utilities | 17 (100.0%) | 0 (0.0%) |
| Information | 13 (23.6%) | 42 (76.4%) |
| Finance & Insurance | 44 (54.3%) | 37 (45.7%) |
| Real Estate, Rental & Leasing | 31 (66.0%) | 16 (34.0%) |
| Professional & Scientific | 51 (77.3%) | 15 (22.7%) |
| Enterprise Management | 0 (0.0%) | 0 (0.0%) |
| Administrative & Support | 32 (61.5%) | 20 (38.5%) |
| Educational Services | 109 (30.3%) | 251 (69.7%) |
| Health Care & Social Assistance | 177 (52.2%) | 162 (47.8%) |
| Arts, Entertainment & Recreation | 8 (26.7%) | 22 (73.3%) |
| Accommodation & Food Services | 55 (63.2%) | 32 (36.8%) |
| Public Administration | 105 (84.0%) | 20 (16.0%) |
| Total | 1,079 (51.7%) | 1,007 (48.3%) |
Education in Chittenango
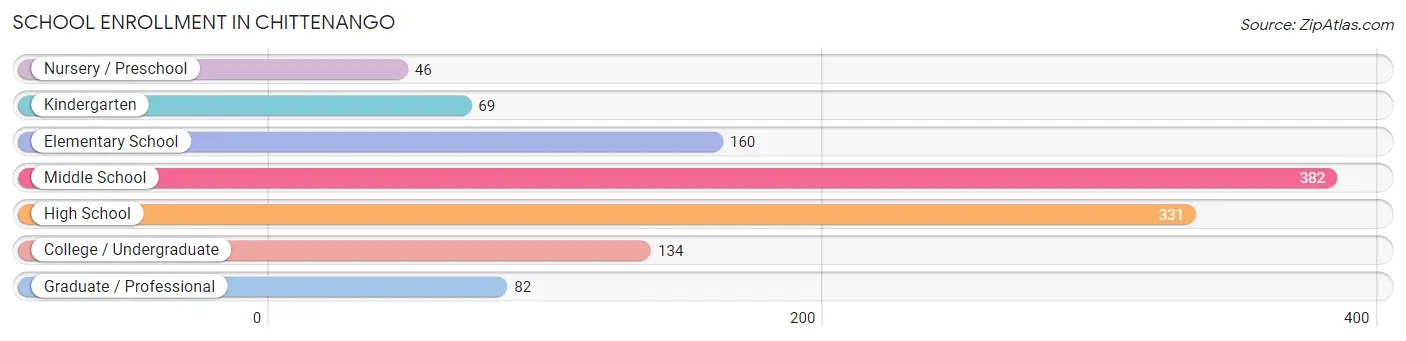
School Enrollment in Chittenango
The most common levels of schooling among the 1,204 students in Chittenango are middle school (382 | 31.7%), high school (331 | 27.5%), and elementary school (160 | 13.3%).
| School Level | # Students | % Students |
| Nursery / Preschool | 46 | 3.8% |
| Kindergarten | 69 | 5.7% |
| Elementary School | 160 | 13.3% |
| Middle School | 382 | 31.7% |
| High School | 331 | 27.5% |
| College / Undergraduate | 134 | 11.1% |
| Graduate / Professional | 82 | 6.8% |
| Total | 1,204 | 100.0% |
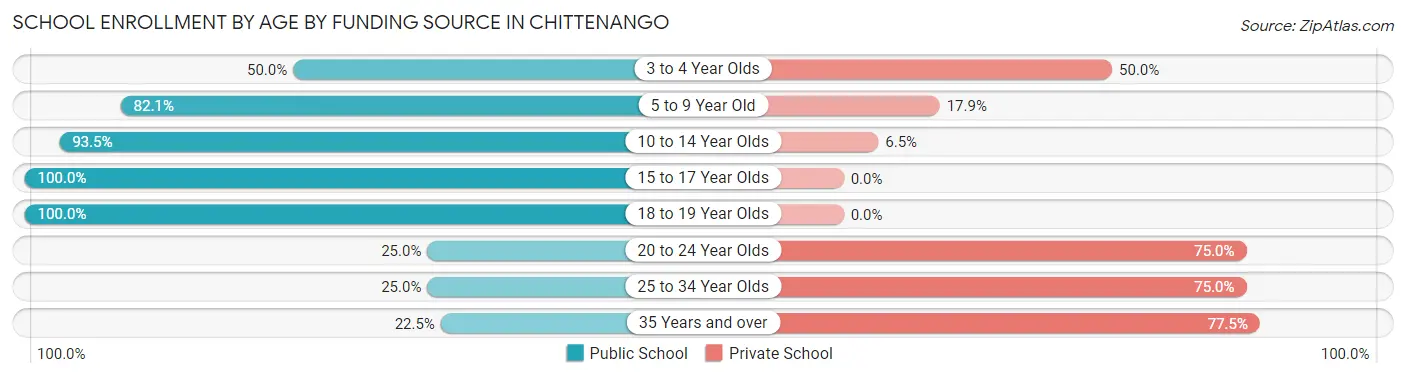
School Enrollment by Age by Funding Source in Chittenango
Out of a total of 1,204 students who are enrolled in schools in Chittenango, 249 (20.7%) attend a private institution, while the remaining 955 (79.3%) are enrolled in public schools. The age group of 35 years and over has the highest likelihood of being enrolled in private schools, with 31 (77.5% in the age bracket) enrolled. Conversely, the age group of 15 to 17 year olds has the lowest likelihood of being enrolled in a private school, with 257 (100.0% in the age bracket) attending a public institution.
| Age Bracket | Public School | Private School |
| 3 to 4 Year Olds | 21 (50.0%) | 21 (50.0%) |
| 5 to 9 Year Old | 179 (82.1%) | 39 (17.9%) |
| 10 to 14 Year Olds | 420 (93.5%) | 29 (6.5%) |
| 15 to 17 Year Olds | 257 (100.0%) | 0 (0.0%) |
| 18 to 19 Year Olds | 26 (100.0%) | 0 (0.0%) |
| 20 to 24 Year Olds | 22 (25.0%) | 66 (75.0%) |
| 25 to 34 Year Olds | 21 (25.0%) | 63 (75.0%) |
| 35 Years and over | 9 (22.5%) | 31 (77.5%) |
| Total | 955 (79.3%) | 249 (20.7%) |
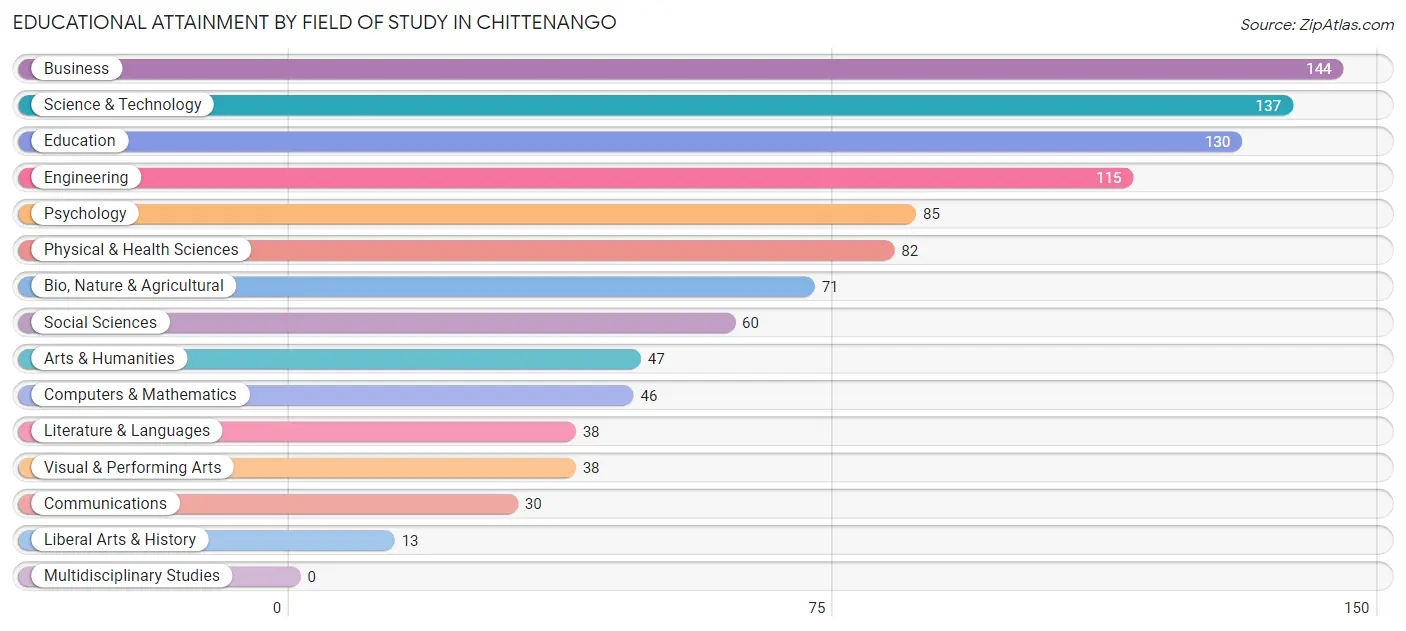
Educational Attainment by Field of Study in Chittenango
Business (144 | 13.9%), science & technology (137 | 13.2%), education (130 | 12.6%), engineering (115 | 11.1%), and psychology (85 | 8.2%) are the most common fields of study among 1,036 individuals in Chittenango who have obtained a bachelor's degree or higher.
| Field of Study | # Graduates | % Graduates |
| Computers & Mathematics | 46 | 4.4% |
| Bio, Nature & Agricultural | 71 | 6.9% |
| Physical & Health Sciences | 82 | 7.9% |
| Psychology | 85 | 8.2% |
| Social Sciences | 60 | 5.8% |
| Engineering | 115 | 11.1% |
| Multidisciplinary Studies | 0 | 0.0% |
| Science & Technology | 137 | 13.2% |
| Business | 144 | 13.9% |
| Education | 130 | 12.6% |
| Literature & Languages | 38 | 3.7% |
| Liberal Arts & History | 13 | 1.3% |
| Visual & Performing Arts | 38 | 3.7% |
| Communications | 30 | 2.9% |
| Arts & Humanities | 47 | 4.5% |
| Total | 1,036 | 100.0% |
Transportation & Commute in Chittenango
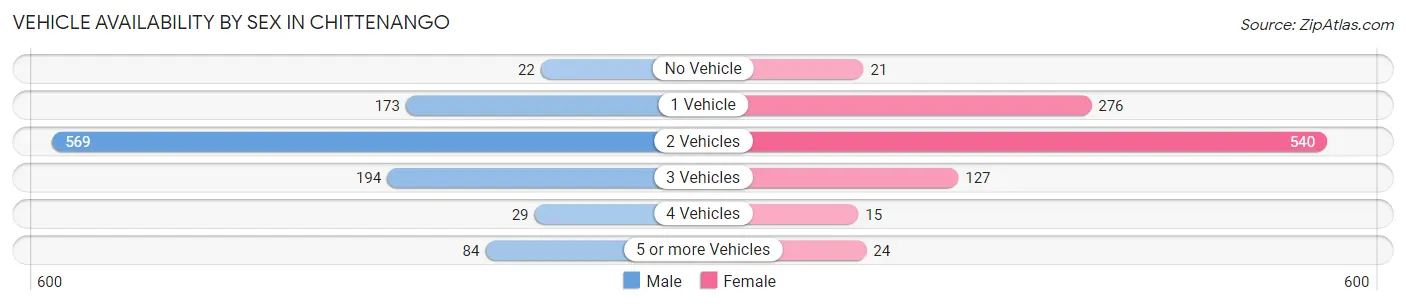
Vehicle Availability by Sex in Chittenango
The most prevalent vehicle ownership categories in Chittenango are males with 2 vehicles (569, accounting for 53.1%) and females with 2 vehicles (540, making up 56.7%).
| Vehicles Available | Male | Female |
| No Vehicle | 22 (2.1%) | 21 (2.1%) |
| 1 Vehicle | 173 (16.2%) | 276 (27.5%) |
| 2 Vehicles | 569 (53.1%) | 540 (53.8%) |
| 3 Vehicles | 194 (18.1%) | 127 (12.7%) |
| 4 Vehicles | 29 (2.7%) | 15 (1.5%) |
| 5 or more Vehicles | 84 (7.8%) | 24 (2.4%) |
| Total | 1,071 (100.0%) | 1,003 (100.0%) |
Commute Time in Chittenango
The most frequently occuring commute durations in Chittenango are 30 to 34 minutes (417 commuters, 22.2%), 20 to 24 minutes (228 commuters, 12.1%), and 15 to 19 minutes (225 commuters, 12.0%).
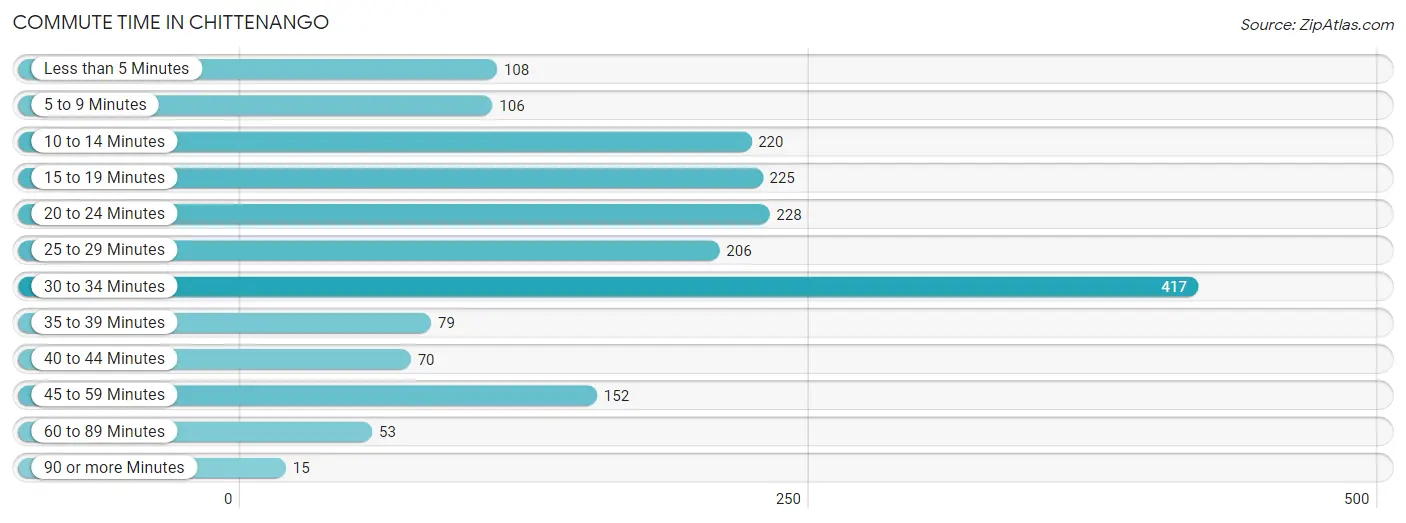
| Commute Time | # Commuters | % Commuters |
| Less than 5 Minutes | 108 | 5.8% |
| 5 to 9 Minutes | 106 | 5.6% |
| 10 to 14 Minutes | 220 | 11.7% |
| 15 to 19 Minutes | 225 | 12.0% |
| 20 to 24 Minutes | 228 | 12.1% |
| 25 to 29 Minutes | 206 | 11.0% |
| 30 to 34 Minutes | 417 | 22.2% |
| 35 to 39 Minutes | 79 | 4.2% |
| 40 to 44 Minutes | 70 | 3.7% |
| 45 to 59 Minutes | 152 | 8.1% |
| 60 to 89 Minutes | 53 | 2.8% |
| 90 or more Minutes | 15 | 0.8% |
Commute Time by Sex in Chittenango
The most common commute times in Chittenango are 30 to 34 minutes (242 commuters, 25.7%) for males and 30 to 34 minutes (175 commuters, 18.7%) for females.
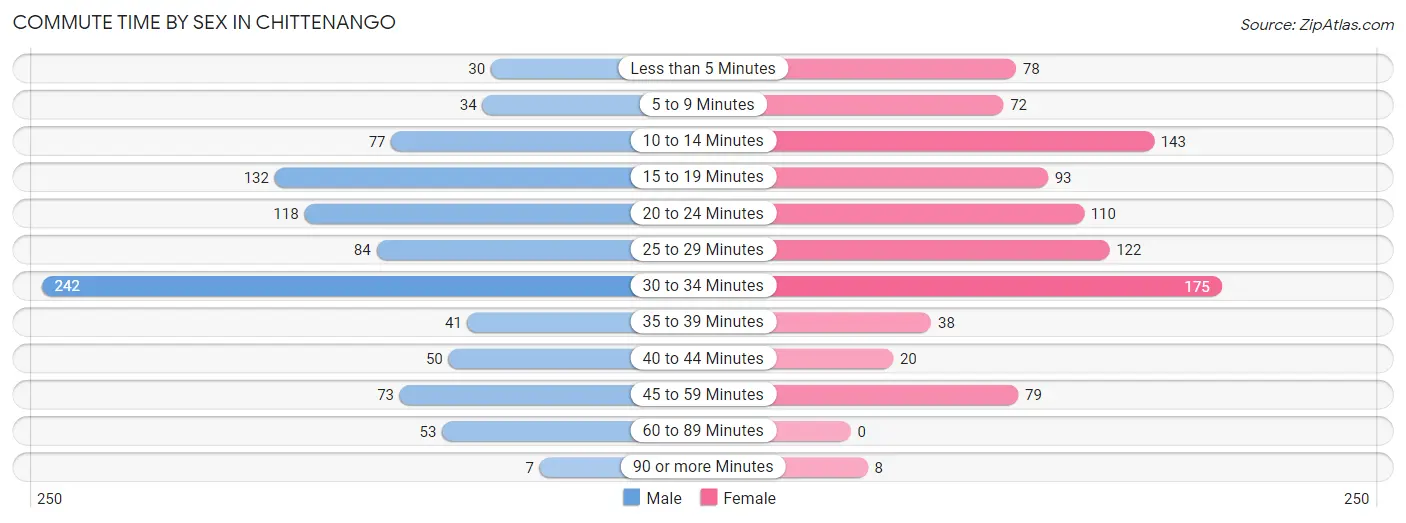
| Commute Time | Male | Female |
| Less than 5 Minutes | 30 (3.2%) | 78 (8.3%) |
| 5 to 9 Minutes | 34 (3.6%) | 72 (7.7%) |
| 10 to 14 Minutes | 77 (8.2%) | 143 (15.2%) |
| 15 to 19 Minutes | 132 (14.0%) | 93 (9.9%) |
| 20 to 24 Minutes | 118 (12.5%) | 110 (11.7%) |
| 25 to 29 Minutes | 84 (8.9%) | 122 (13.0%) |
| 30 to 34 Minutes | 242 (25.7%) | 175 (18.7%) |
| 35 to 39 Minutes | 41 (4.4%) | 38 (4.1%) |
| 40 to 44 Minutes | 50 (5.3%) | 20 (2.1%) |
| 45 to 59 Minutes | 73 (7.8%) | 79 (8.4%) |
| 60 to 89 Minutes | 53 (5.6%) | 0 (0.0%) |
| 90 or more Minutes | 7 (0.7%) | 8 (0.9%) |
Time of Departure to Work by Sex in Chittenango
The most frequent times of departure to work in Chittenango are 7:00 AM to 7:29 AM (245, 26.0%) for males and 7:00 AM to 7:29 AM (235, 25.1%) for females.
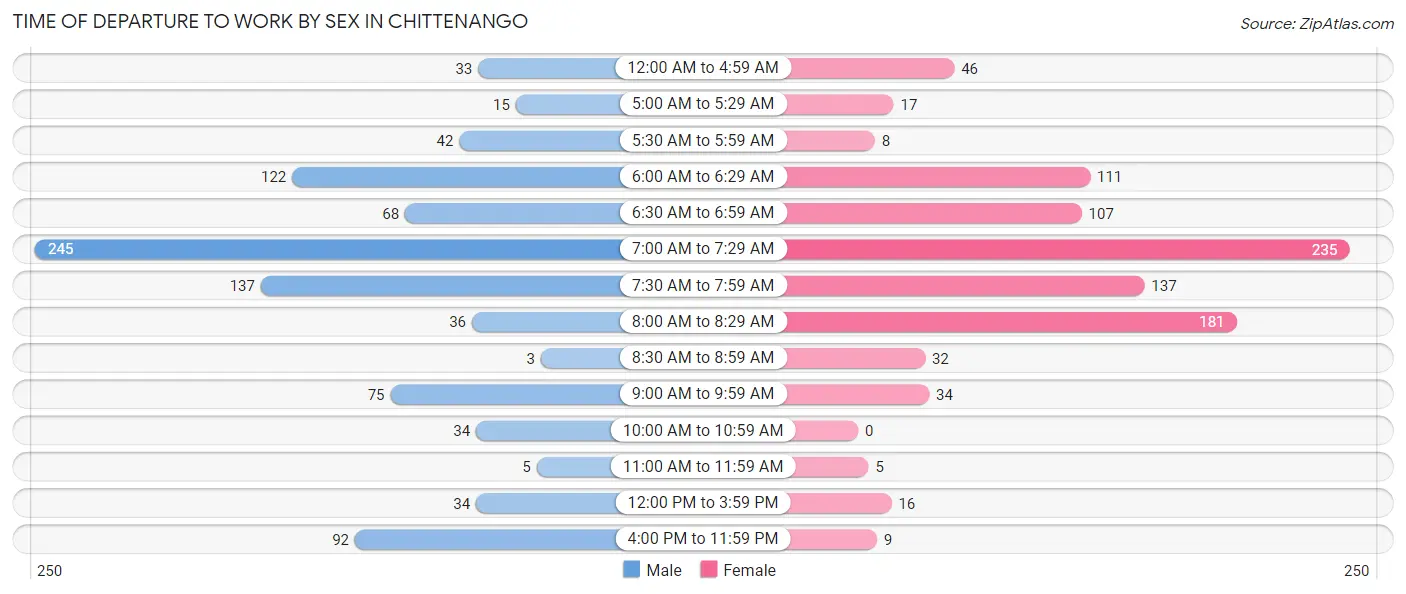
| Time of Departure | Male | Female |
| 12:00 AM to 4:59 AM | 33 (3.5%) | 46 (4.9%) |
| 5:00 AM to 5:29 AM | 15 (1.6%) | 17 (1.8%) |
| 5:30 AM to 5:59 AM | 42 (4.5%) | 8 (0.9%) |
| 6:00 AM to 6:29 AM | 122 (13.0%) | 111 (11.8%) |
| 6:30 AM to 6:59 AM | 68 (7.2%) | 107 (11.4%) |
| 7:00 AM to 7:29 AM | 245 (26.0%) | 235 (25.1%) |
| 7:30 AM to 7:59 AM | 137 (14.6%) | 137 (14.6%) |
| 8:00 AM to 8:29 AM | 36 (3.8%) | 181 (19.3%) |
| 8:30 AM to 8:59 AM | 3 (0.3%) | 32 (3.4%) |
| 9:00 AM to 9:59 AM | 75 (8.0%) | 34 (3.6%) |
| 10:00 AM to 10:59 AM | 34 (3.6%) | 0 (0.0%) |
| 11:00 AM to 11:59 AM | 5 (0.5%) | 5 (0.5%) |
| 12:00 PM to 3:59 PM | 34 (3.6%) | 16 (1.7%) |
| 4:00 PM to 11:59 PM | 92 (9.8%) | 9 (1.0%) |
| Total | 941 (100.0%) | 938 (100.0%) |
Housing Occupancy in Chittenango
Occupancy by Ownership in Chittenango
Of the total 1,862 dwellings in Chittenango, owner-occupied units account for 1,158 (62.2%), while renter-occupied units make up 704 (37.8%).
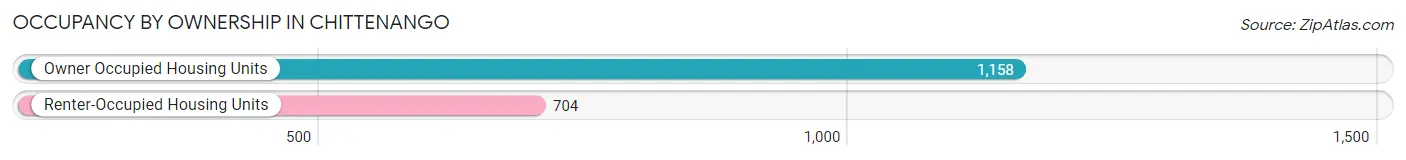
| Occupancy | # Housing Units | % Housing Units |
| Owner Occupied Housing Units | 1,158 | 62.2% |
| Renter-Occupied Housing Units | 704 | 37.8% |
| Total Occupied Housing Units | 1,862 | 100.0% |
Occupancy by Household Size in Chittenango
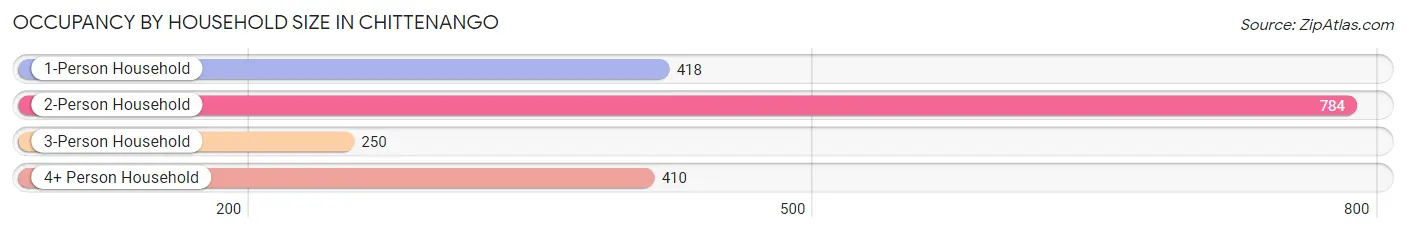
| Household Size | # Housing Units | % Housing Units |
| 1-Person Household | 418 | 22.5% |
| 2-Person Household | 784 | 42.1% |
| 3-Person Household | 250 | 13.4% |
| 4+ Person Household | 410 | 22.0% |
| Total Housing Units | 1,862 | 100.0% |
Occupancy by Ownership by Household Size in Chittenango
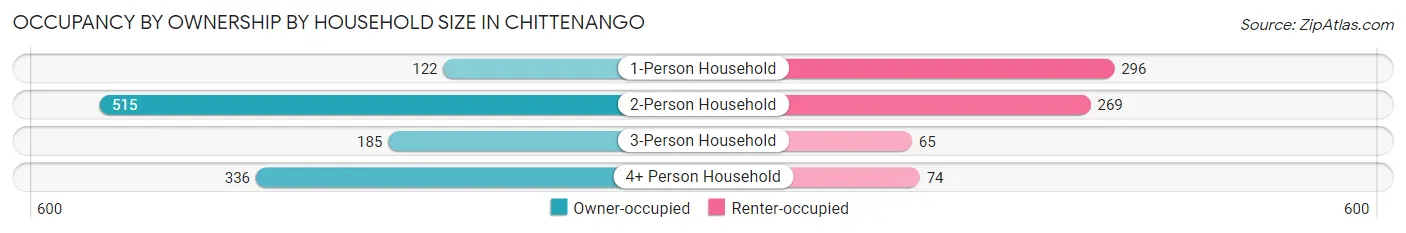
| Household Size | Owner-occupied | Renter-occupied |
| 1-Person Household | 122 (29.2%) | 296 (70.8%) |
| 2-Person Household | 515 (65.7%) | 269 (34.3%) |
| 3-Person Household | 185 (74.0%) | 65 (26.0%) |
| 4+ Person Household | 336 (82.0%) | 74 (18.0%) |
| Total Housing Units | 1,158 (62.2%) | 704 (37.8%) |
Occupancy by Educational Attainment in Chittenango
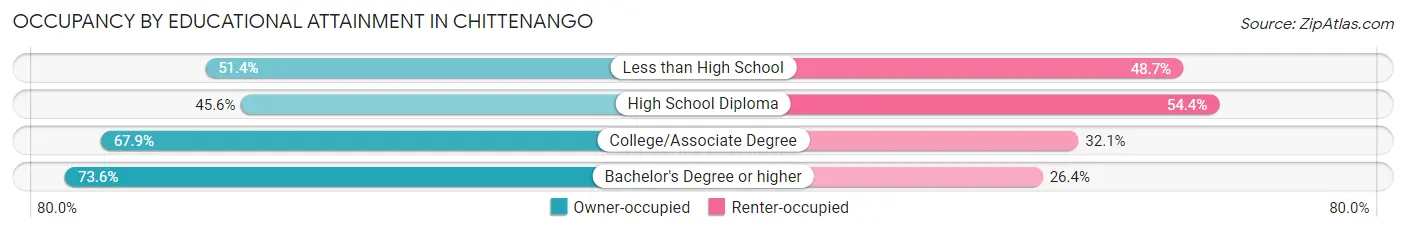
| Household Size | Owner-occupied | Renter-occupied |
| Less than High School | 19 (51.3%) | 18 (48.6%) |
| High School Diploma | 271 (45.6%) | 323 (54.4%) |
| College/Associate Degree | 453 (67.9%) | 214 (32.1%) |
| Bachelor's Degree or higher | 415 (73.6%) | 149 (26.4%) |
Occupancy by Age of Householder in Chittenango
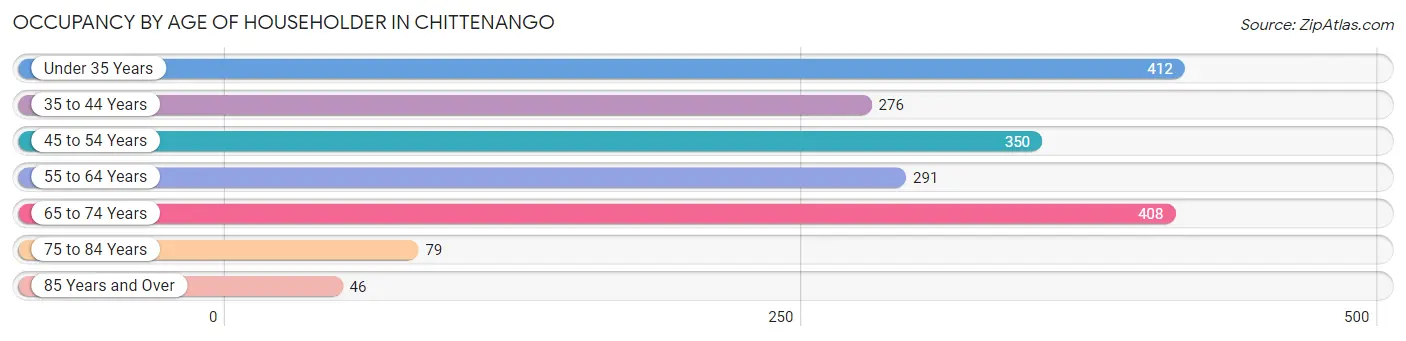
| Age Bracket | # Households | % Households |
| Under 35 Years | 412 | 22.1% |
| 35 to 44 Years | 276 | 14.8% |
| 45 to 54 Years | 350 | 18.8% |
| 55 to 64 Years | 291 | 15.6% |
| 65 to 74 Years | 408 | 21.9% |
| 75 to 84 Years | 79 | 4.2% |
| 85 Years and Over | 46 | 2.5% |
| Total | 1,862 | 100.0% |
Housing Finances in Chittenango
Median Income by Occupancy in Chittenango
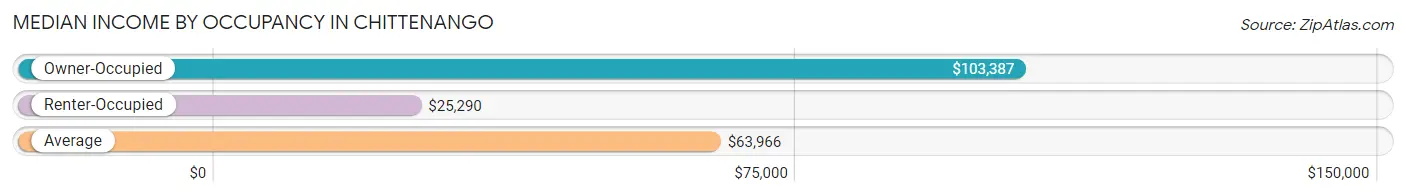
| Occupancy Type | # Households | Median Income |
| Owner-Occupied | 1,158 (62.2%) | $103,387 |
| Renter-Occupied | 704 (37.8%) | $25,290 |
| Average | 1,862 (100.0%) | $63,966 |
Occupancy by Householder Income Bracket in Chittenango
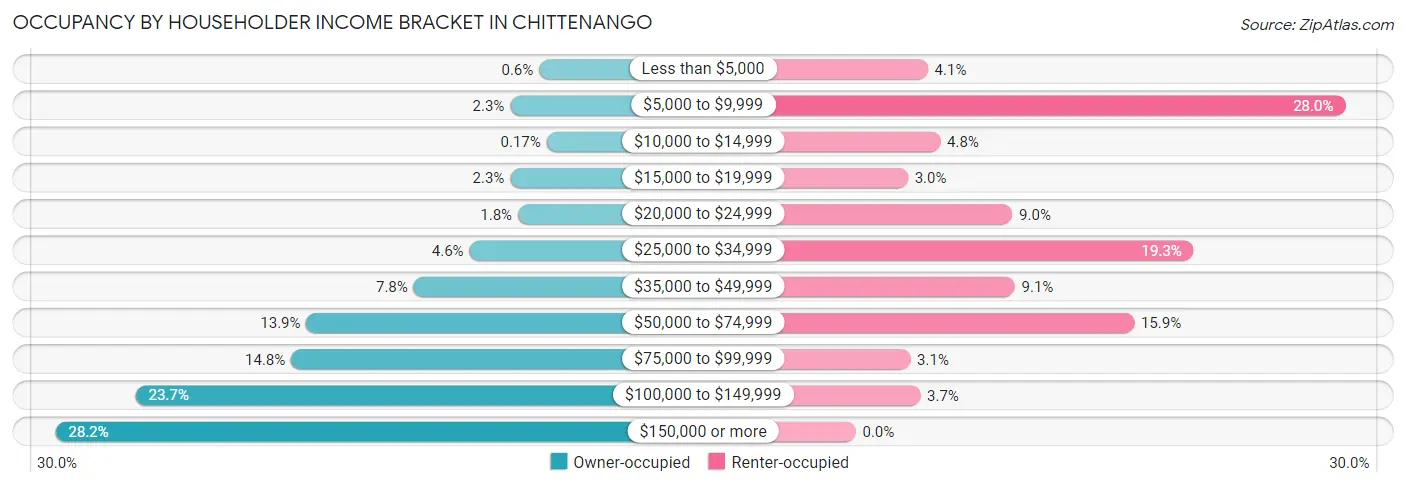
| Income Bracket | Owner-occupied | Renter-occupied |
| Less than $5,000 | 7 (0.6%) | 29 (4.1%) |
| $5,000 to $9,999 | 26 (2.2%) | 197 (28.0%) |
| $10,000 to $14,999 | 2 (0.2%) | 34 (4.8%) |
| $15,000 to $19,999 | 26 (2.2%) | 21 (3.0%) |
| $20,000 to $24,999 | 21 (1.8%) | 63 (8.9%) |
| $25,000 to $34,999 | 53 (4.6%) | 136 (19.3%) |
| $35,000 to $49,999 | 90 (7.8%) | 64 (9.1%) |
| $50,000 to $74,999 | 161 (13.9%) | 112 (15.9%) |
| $75,000 to $99,999 | 171 (14.8%) | 22 (3.1%) |
| $100,000 to $149,999 | 274 (23.7%) | 26 (3.7%) |
| $150,000 or more | 327 (28.2%) | 0 (0.0%) |
| Total | 1,158 (100.0%) | 704 (100.0%) |
Monthly Housing Cost Tiers in Chittenango
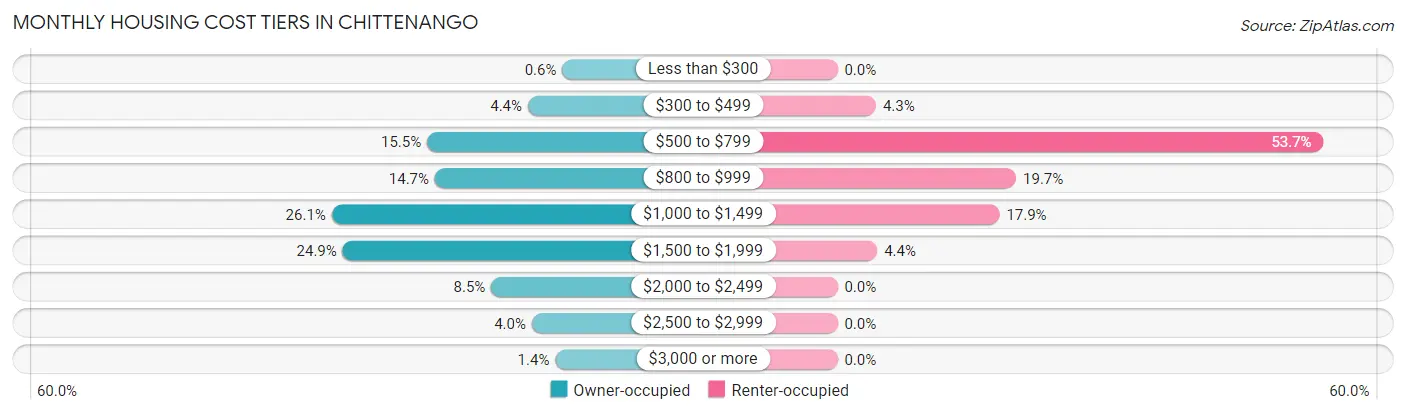
| Monthly Cost | Owner-occupied | Renter-occupied |
| Less than $300 | 7 (0.6%) | 0 (0.0%) |
| $300 to $499 | 51 (4.4%) | 30 (4.3%) |
| $500 to $799 | 180 (15.5%) | 378 (53.7%) |
| $800 to $999 | 170 (14.7%) | 139 (19.7%) |
| $1,000 to $1,499 | 302 (26.1%) | 126 (17.9%) |
| $1,500 to $1,999 | 288 (24.9%) | 31 (4.4%) |
| $2,000 to $2,499 | 98 (8.5%) | 0 (0.0%) |
| $2,500 to $2,999 | 46 (4.0%) | 0 (0.0%) |
| $3,000 or more | 16 (1.4%) | 0 (0.0%) |
| Total | 1,158 (100.0%) | 704 (100.0%) |
Physical Housing Characteristics in Chittenango
Housing Structures in Chittenango
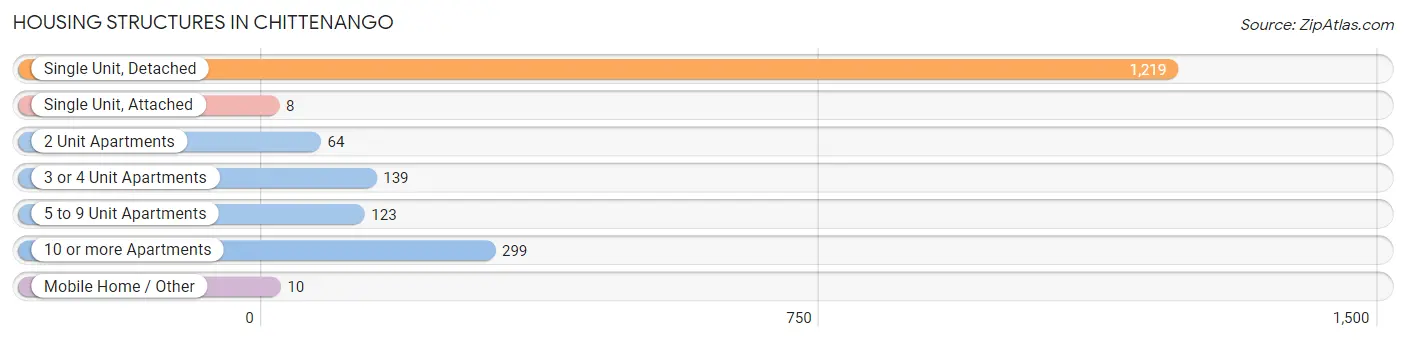
| Structure Type | # Housing Units | % Housing Units |
| Single Unit, Detached | 1,219 | 65.5% |
| Single Unit, Attached | 8 | 0.4% |
| 2 Unit Apartments | 64 | 3.4% |
| 3 or 4 Unit Apartments | 139 | 7.5% |
| 5 to 9 Unit Apartments | 123 | 6.6% |
| 10 or more Apartments | 299 | 16.1% |
| Mobile Home / Other | 10 | 0.5% |
| Total | 1,862 | 100.0% |
Housing Structures by Occupancy in Chittenango
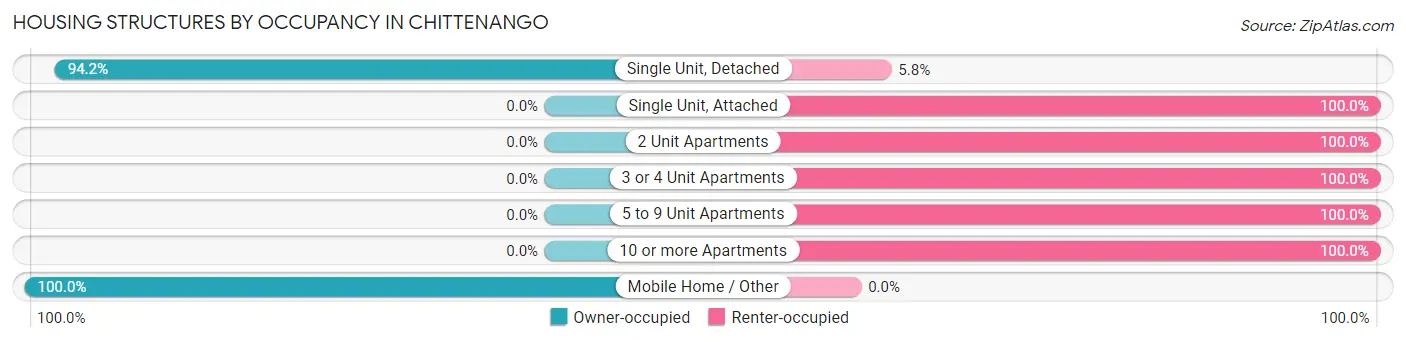
| Structure Type | Owner-occupied | Renter-occupied |
| Single Unit, Detached | 1,148 (94.2%) | 71 (5.8%) |
| Single Unit, Attached | 0 (0.0%) | 8 (100.0%) |
| 2 Unit Apartments | 0 (0.0%) | 64 (100.0%) |
| 3 or 4 Unit Apartments | 0 (0.0%) | 139 (100.0%) |
| 5 to 9 Unit Apartments | 0 (0.0%) | 123 (100.0%) |
| 10 or more Apartments | 0 (0.0%) | 299 (100.0%) |
| Mobile Home / Other | 10 (100.0%) | 0 (0.0%) |
| Total | 1,158 (62.2%) | 704 (37.8%) |
Housing Structures by Number of Rooms in Chittenango
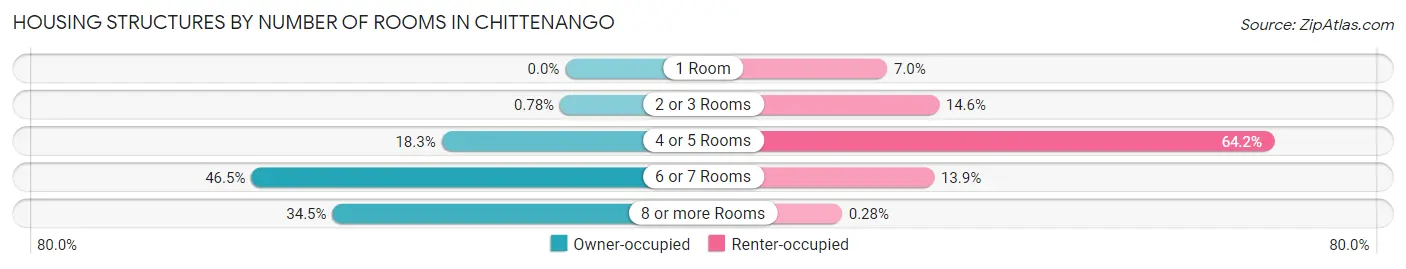
| Number of Rooms | Owner-occupied | Renter-occupied |
| 1 Room | 0 (0.0%) | 49 (7.0%) |
| 2 or 3 Rooms | 9 (0.8%) | 103 (14.6%) |
| 4 or 5 Rooms | 212 (18.3%) | 452 (64.2%) |
| 6 or 7 Rooms | 538 (46.5%) | 98 (13.9%) |
| 8 or more Rooms | 399 (34.5%) | 2 (0.3%) |
| Total | 1,158 (100.0%) | 704 (100.0%) |
Housing Structure by Heating Type in Chittenango
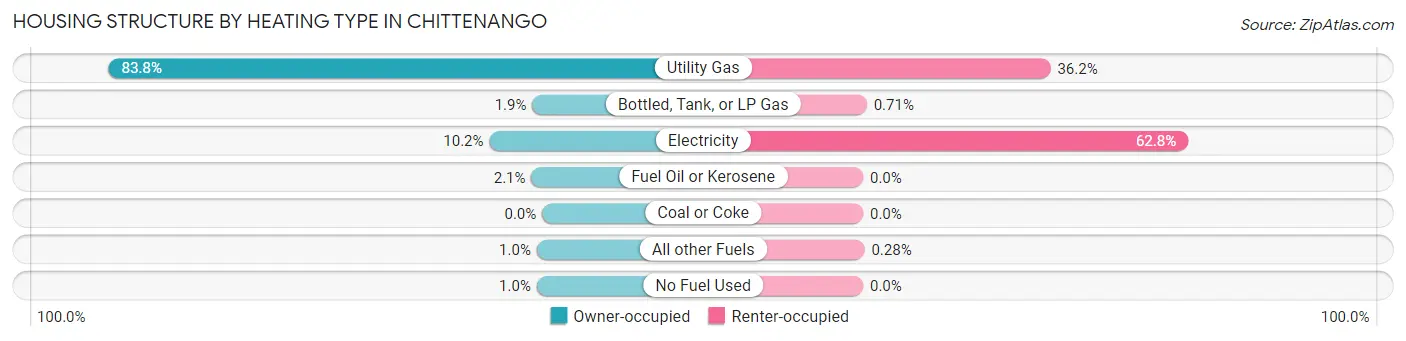
| Heating Type | Owner-occupied | Renter-occupied |
| Utility Gas | 970 (83.8%) | 255 (36.2%) |
| Bottled, Tank, or LP Gas | 22 (1.9%) | 5 (0.7%) |
| Electricity | 118 (10.2%) | 442 (62.8%) |
| Fuel Oil or Kerosene | 24 (2.1%) | 0 (0.0%) |
| Coal or Coke | 0 (0.0%) | 0 (0.0%) |
| All other Fuels | 12 (1.0%) | 2 (0.3%) |
| No Fuel Used | 12 (1.0%) | 0 (0.0%) |
| Total | 1,158 (100.0%) | 704 (100.0%) |
Household Vehicle Usage in Chittenango
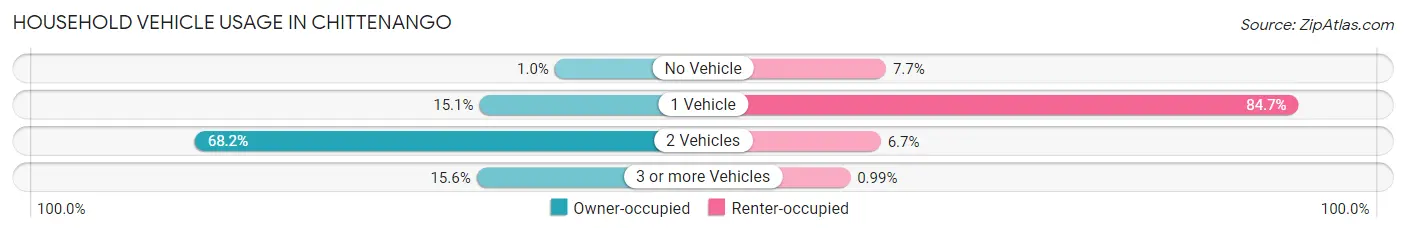
| Vehicles per Household | Owner-occupied | Renter-occupied |
| No Vehicle | 12 (1.0%) | 54 (7.7%) |
| 1 Vehicle | 175 (15.1%) | 596 (84.7%) |
| 2 Vehicles | 790 (68.2%) | 47 (6.7%) |
| 3 or more Vehicles | 181 (15.6%) | 7 (1.0%) |
| Total | 1,158 (100.0%) | 704 (100.0%) |
Real Estate & Mortgages in Chittenango
Real Estate and Mortgage Overview in Chittenango
| Characteristic | Without Mortgage | With Mortgage |
| Housing Units | 359 | 799 |
| Median Property Value | $176,700 | $166,500 |
| Median Household Income | $86,172 | $223 |
| Monthly Housing Costs | $744 | $16 |
| Real Estate Taxes | $4,900 | $14 |
Property Value by Mortgage Status in Chittenango
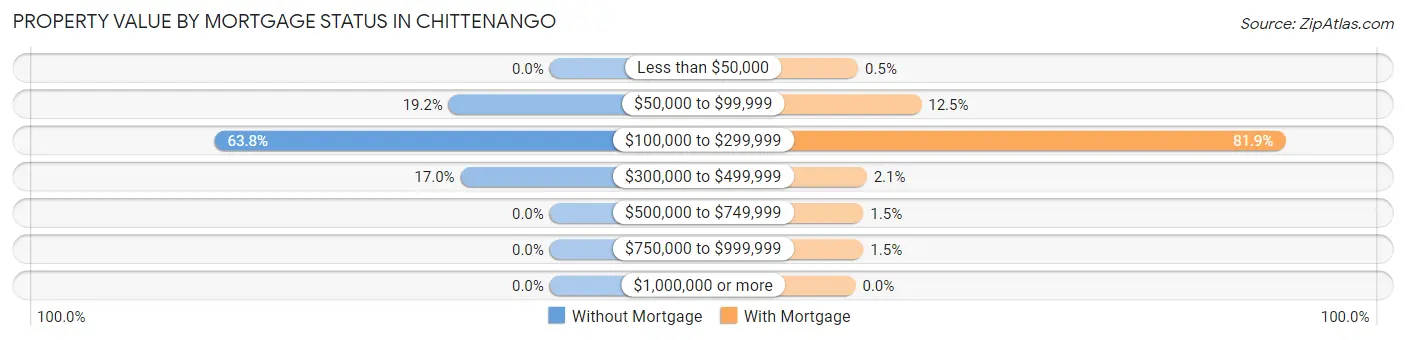
| Property Value | Without Mortgage | With Mortgage |
| Less than $50,000 | 0 (0.0%) | 4 (0.5%) |
| $50,000 to $99,999 | 69 (19.2%) | 100 (12.5%) |
| $100,000 to $299,999 | 229 (63.8%) | 654 (81.9%) |
| $300,000 to $499,999 | 61 (17.0%) | 17 (2.1%) |
| $500,000 to $749,999 | 0 (0.0%) | 12 (1.5%) |
| $750,000 to $999,999 | 0 (0.0%) | 12 (1.5%) |
| $1,000,000 or more | 0 (0.0%) | 0 (0.0%) |
| Total | 359 (100.0%) | 799 (100.0%) |
Household Income by Mortgage Status in Chittenango
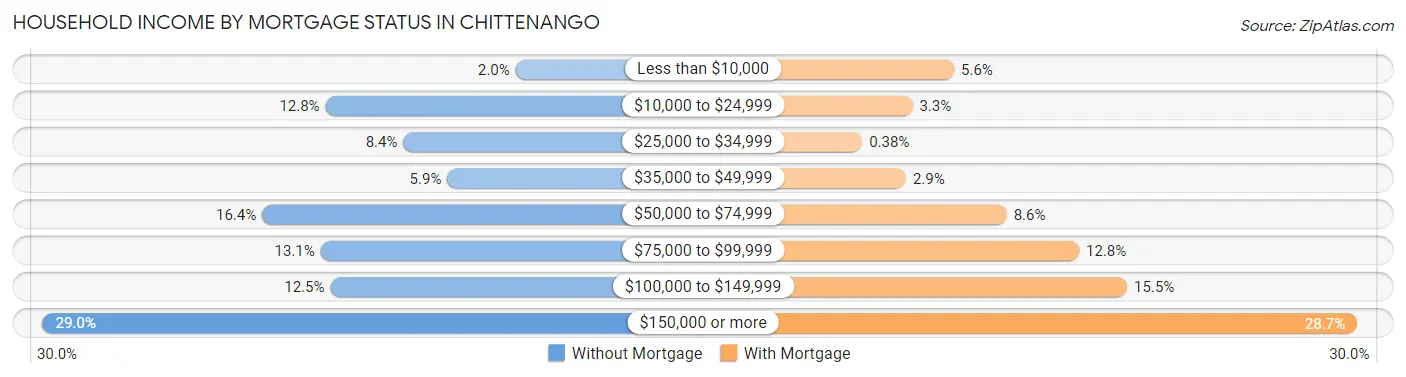
| Household Income | Without Mortgage | With Mortgage |
| Less than $10,000 | 7 (1.9%) | 45 (5.6%) |
| $10,000 to $24,999 | 46 (12.8%) | 26 (3.3%) |
| $25,000 to $34,999 | 30 (8.4%) | 3 (0.4%) |
| $35,000 to $49,999 | 21 (5.9%) | 23 (2.9%) |
| $50,000 to $74,999 | 59 (16.4%) | 69 (8.6%) |
| $75,000 to $99,999 | 47 (13.1%) | 102 (12.8%) |
| $100,000 to $149,999 | 45 (12.5%) | 124 (15.5%) |
| $150,000 or more | 104 (29.0%) | 229 (28.7%) |
| Total | 359 (100.0%) | 799 (100.0%) |
Property Value to Household Income Ratio in Chittenango
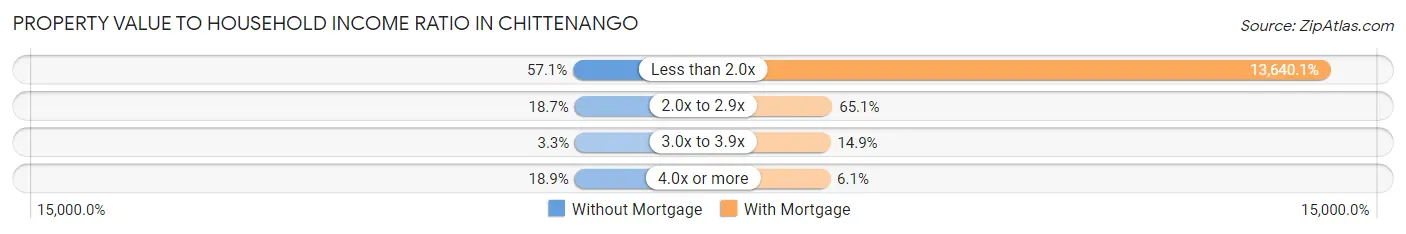
| Value-to-Income Ratio | Without Mortgage | With Mortgage |
| Less than 2.0x | 205 (57.1%) | 108,984 (13,640.0%) |
| 2.0x to 2.9x | 67 (18.7%) | 520 (65.1%) |
| 3.0x to 3.9x | 12 (3.3%) | 119 (14.9%) |
| 4.0x or more | 68 (18.9%) | 49 (6.1%) |
| Total | 359 (100.0%) | 799 (100.0%) |
Real Estate Taxes by Mortgage Status in Chittenango
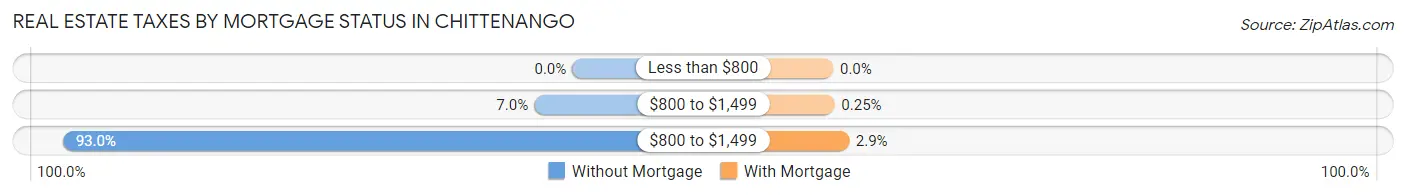
| Property Taxes | Without Mortgage | With Mortgage |
| Less than $800 | 0 (0.0%) | 0 (0.0%) |
| $800 to $1,499 | 25 (7.0%) | 2 (0.3%) |
| $800 to $1,499 | 334 (93.0%) | 23 (2.9%) |
| Total | 359 (100.0%) | 799 (100.0%) |
Health & Disability in Chittenango
Health Insurance Coverage by Age in Chittenango
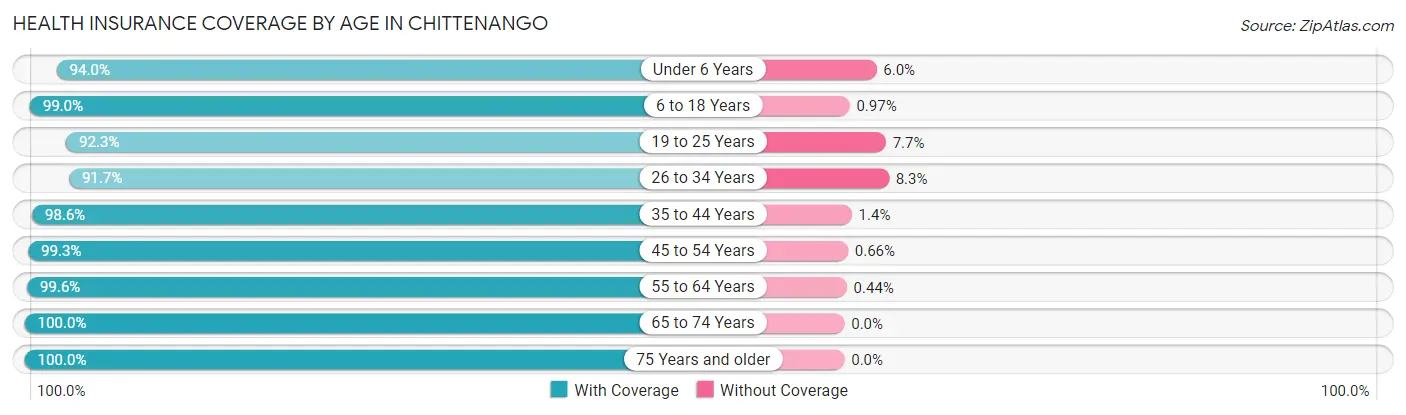
| Age Bracket | With Coverage | Without Coverage |
| Under 6 Years | 220 (94.0%) | 14 (6.0%) |
| 6 to 18 Years | 919 (99.0%) | 9 (1.0%) |
| 19 to 25 Years | 430 (92.3%) | 36 (7.7%) |
| 26 to 34 Years | 543 (91.7%) | 49 (8.3%) |
| 35 to 44 Years | 503 (98.6%) | 7 (1.4%) |
| 45 to 54 Years | 602 (99.3%) | 4 (0.7%) |
| 55 to 64 Years | 672 (99.6%) | 3 (0.4%) |
| 65 to 74 Years | 609 (100.0%) | 0 (0.0%) |
| 75 Years and older | 195 (100.0%) | 0 (0.0%) |
| Total | 4,693 (97.5%) | 122 (2.5%) |
Health Insurance Coverage by Citizenship Status in Chittenango
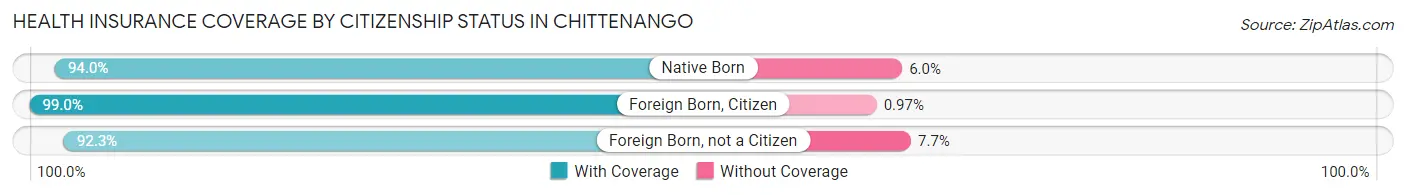
| Citizenship Status | With Coverage | Without Coverage |
| Native Born | 220 (94.0%) | 14 (6.0%) |
| Foreign Born, Citizen | 919 (99.0%) | 9 (1.0%) |
| Foreign Born, not a Citizen | 430 (92.3%) | 36 (7.7%) |
Health Insurance Coverage by Household Income in Chittenango
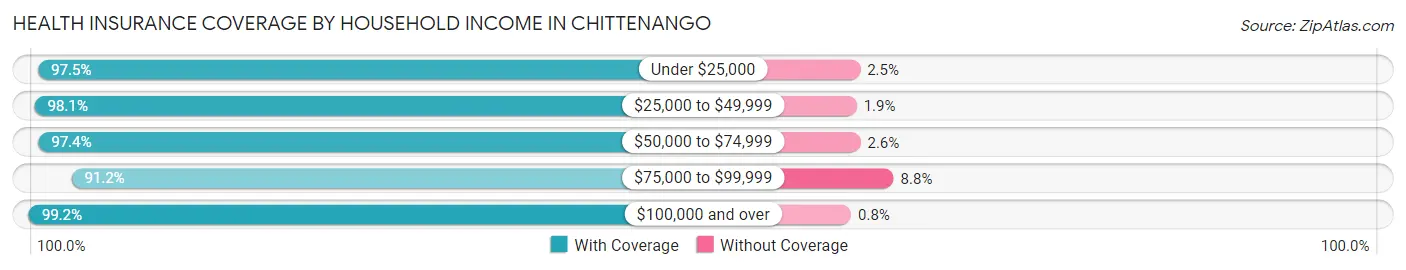
| Household Income | With Coverage | Without Coverage |
| Under $25,000 | 734 (97.5%) | 19 (2.5%) |
| $25,000 to $49,999 | 685 (98.1%) | 13 (1.9%) |
| $50,000 to $74,999 | 873 (97.4%) | 23 (2.6%) |
| $75,000 to $99,999 | 540 (91.2%) | 52 (8.8%) |
| $100,000 and over | 1,858 (99.2%) | 15 (0.8%) |
Public vs Private Health Insurance Coverage by Age in Chittenango
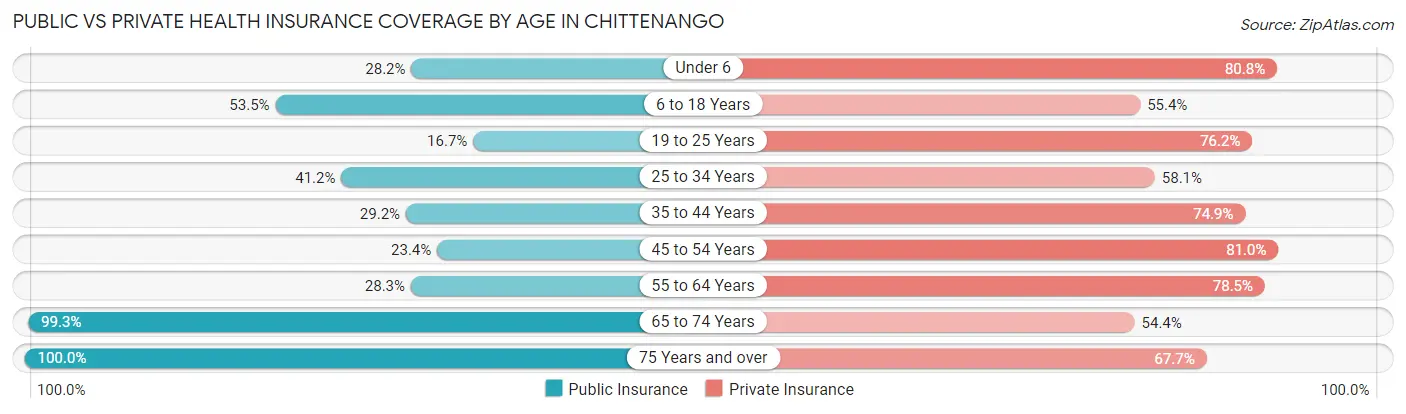
| Age Bracket | Public Insurance | Private Insurance |
| Under 6 | 66 (28.2%) | 189 (80.8%) |
| 6 to 18 Years | 496 (53.4%) | 514 (55.4%) |
| 19 to 25 Years | 78 (16.7%) | 355 (76.2%) |
| 25 to 34 Years | 244 (41.2%) | 344 (58.1%) |
| 35 to 44 Years | 149 (29.2%) | 382 (74.9%) |
| 45 to 54 Years | 142 (23.4%) | 491 (81.0%) |
| 55 to 64 Years | 191 (28.3%) | 530 (78.5%) |
| 65 to 74 Years | 605 (99.3%) | 331 (54.3%) |
| 75 Years and over | 195 (100.0%) | 132 (67.7%) |
| Total | 2,166 (45.0%) | 3,268 (67.9%) |
Disability Status by Sex by Age in Chittenango
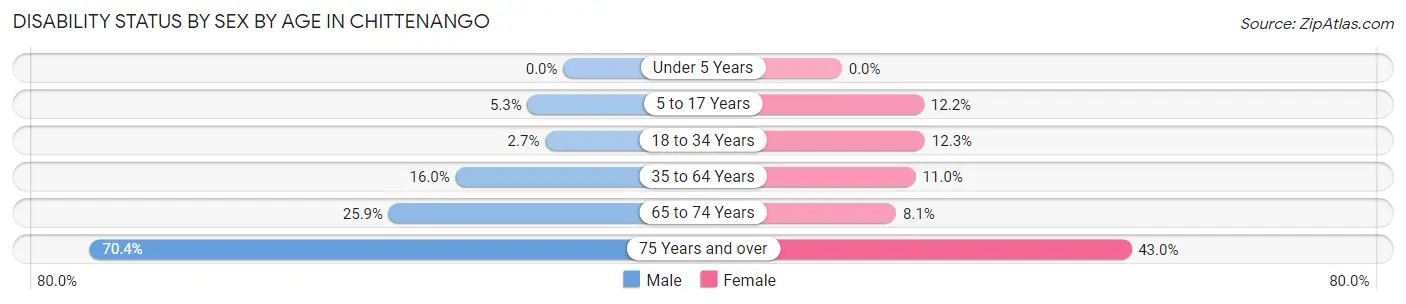
| Age Bracket | Male | Female |
| Under 5 Years | 0 (0.0%) | 0 (0.0%) |
| 5 to 17 Years | 31 (5.3%) | 44 (12.2%) |
| 18 to 34 Years | 19 (2.7%) | 47 (12.3%) |
| 35 to 64 Years | 148 (16.0%) | 95 (11.0%) |
| 65 to 74 Years | 71 (25.9%) | 27 (8.1%) |
| 75 Years and over | 57 (70.4%) | 49 (43.0%) |
Disability Class by Sex by Age in Chittenango
Disability Class: Hearing Difficulty
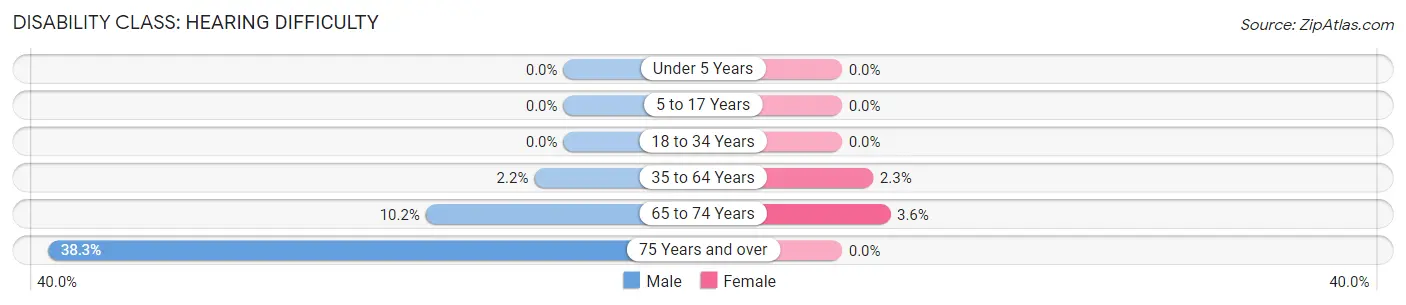
| Age Bracket | Male | Female |
| Under 5 Years | 0 (0.0%) | 0 (0.0%) |
| 5 to 17 Years | 0 (0.0%) | 0 (0.0%) |
| 18 to 34 Years | 0 (0.0%) | 0 (0.0%) |
| 35 to 64 Years | 20 (2.2%) | 20 (2.3%) |
| 65 to 74 Years | 28 (10.2%) | 12 (3.6%) |
| 75 Years and over | 31 (38.3%) | 0 (0.0%) |
Disability Class: Vision Difficulty
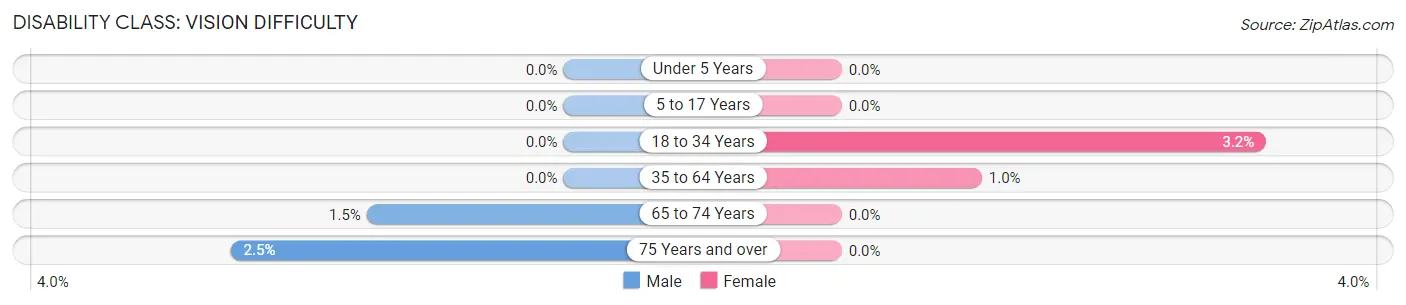
| Age Bracket | Male | Female |
| Under 5 Years | 0 (0.0%) | 0 (0.0%) |
| 5 to 17 Years | 0 (0.0%) | 0 (0.0%) |
| 18 to 34 Years | 0 (0.0%) | 12 (3.2%) |
| 35 to 64 Years | 0 (0.0%) | 9 (1.0%) |
| 65 to 74 Years | 4 (1.5%) | 0 (0.0%) |
| 75 Years and over | 2 (2.5%) | 0 (0.0%) |
Disability Class: Cognitive Difficulty
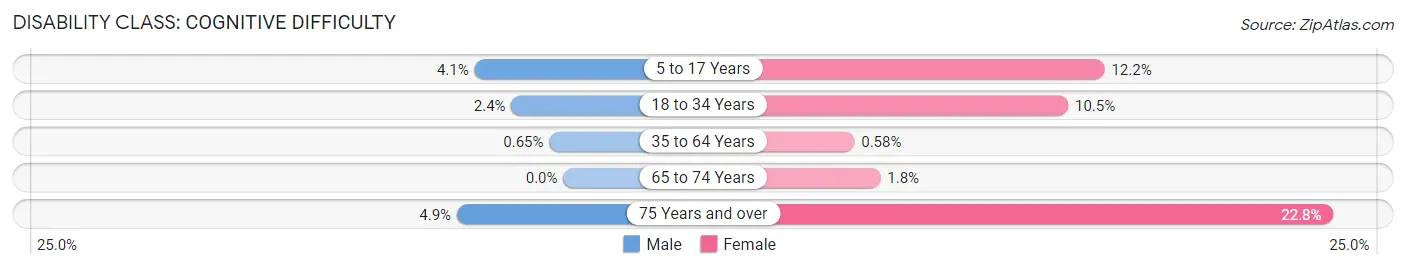
| Age Bracket | Male | Female |
| 5 to 17 Years | 24 (4.1%) | 44 (12.2%) |
| 18 to 34 Years | 17 (2.4%) | 40 (10.5%) |
| 35 to 64 Years | 6 (0.6%) | 5 (0.6%) |
| 65 to 74 Years | 0 (0.0%) | 6 (1.8%) |
| 75 Years and over | 4 (4.9%) | 26 (22.8%) |
Disability Class: Ambulatory Difficulty
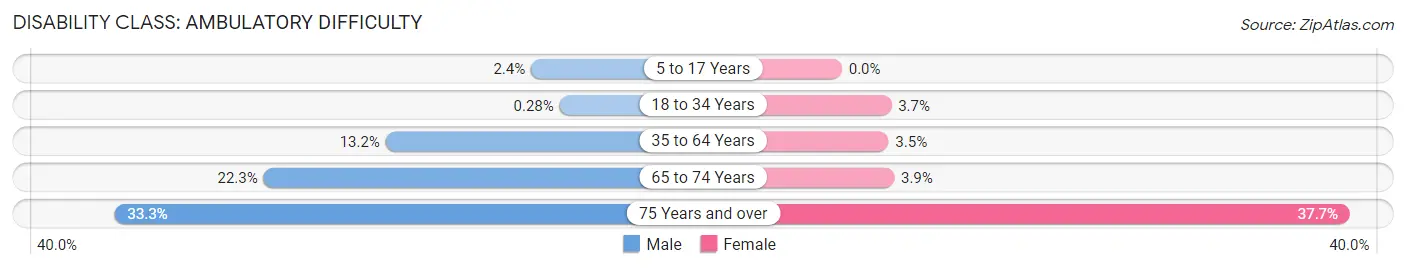
| Age Bracket | Male | Female |
| 5 to 17 Years | 14 (2.4%) | 0 (0.0%) |
| 18 to 34 Years | 2 (0.3%) | 14 (3.7%) |
| 35 to 64 Years | 122 (13.2%) | 30 (3.5%) |
| 65 to 74 Years | 61 (22.3%) | 13 (3.9%) |
| 75 Years and over | 27 (33.3%) | 43 (37.7%) |
Disability Class: Self-Care Difficulty
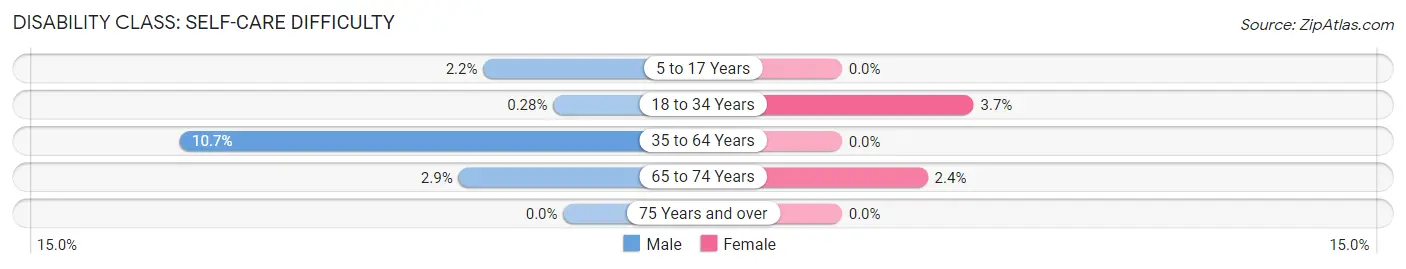
| Age Bracket | Male | Female |
| 5 to 17 Years | 13 (2.2%) | 0 (0.0%) |
| 18 to 34 Years | 2 (0.3%) | 14 (3.7%) |
| 35 to 64 Years | 99 (10.7%) | 0 (0.0%) |
| 65 to 74 Years | 8 (2.9%) | 8 (2.4%) |
| 75 Years and over | 0 (0.0%) | 0 (0.0%) |
Technology Access in Chittenango
Computing Device Access in Chittenango
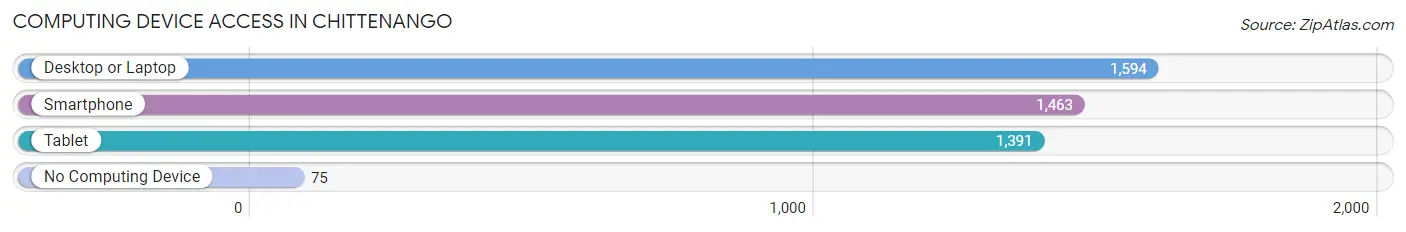
| Device Type | # Households | % Households |
| Desktop or Laptop | 1,594 | 85.6% |
| Smartphone | 1,463 | 78.6% |
| Tablet | 1,391 | 74.7% |
| No Computing Device | 75 | 4.0% |
| Total | 1,862 | 100.0% |
Internet Access in Chittenango
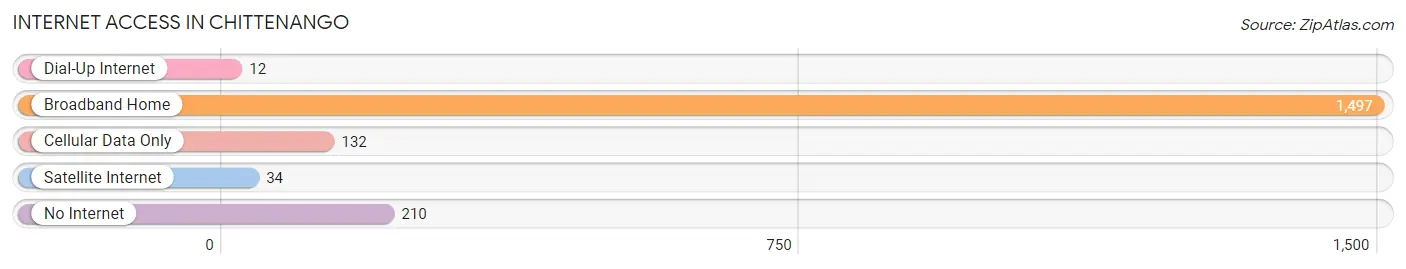
| Internet Type | # Households | % Households |
| Dial-Up Internet | 12 | 0.6% |
| Broadband Home | 1,497 | 80.4% |
| Cellular Data Only | 132 | 7.1% |
| Satellite Internet | 34 | 1.8% |
| No Internet | 210 | 11.3% |
| Total | 1,862 | 100.0% |
Chittenango Summary
Chittenango, New York is a small village located in Madison County, New York. It is situated on the banks of Chittenango Creek, a tributary of the Oneida River. The village is located approximately 15 miles east of Syracuse and is part of the Syracuse Metropolitan Statistical Area. The village has a population of approximately 5,000 people and is the home of the Chittenango High School.
History
The area that is now Chittenango was originally inhabited by the Oneida Nation. The first European settlers arrived in the area in the late 1700s and the village was officially incorporated in 1833. The village was named after the creek that runs through it, which was named after a Native American chief.
The village was an important stop on the Erie Canal, which was completed in 1825. The canal provided a transportation route for goods and people between the Great Lakes and the Hudson River. The village was also an important stop on the New York Central Railroad, which was completed in 1851.
The village was home to several industries, including a paper mill, a flour mill, a tannery, and a brewery. The village also had a large number of farms, which provided food for the local population.
Geography
Chittenango is located in Madison County, New York. It is situated on the banks of Chittenango Creek, a tributary of the Oneida River. The village is located approximately 15 miles east of Syracuse and is part of the Syracuse Metropolitan Statistical Area. The village has a total area of 2.2 square miles, all of which is land.
The village is located in a hilly region of central New York. The highest point in the village is located at an elevation of 890 feet above sea level. The village is located in a humid continental climate zone, with cold winters and warm summers.
Economy
The economy of Chittenango is largely based on agriculture and tourism. The village is home to several farms, which produce a variety of crops, including corn, soybeans, and hay. The village is also home to several wineries, which produce a variety of wines.
The village is also home to several small businesses, including restaurants, retail stores, and service providers. The village is also home to several manufacturing companies, which produce a variety of products, including furniture, clothing, and electronics.
Demographics
As of the 2010 census, the village had a population of 5,085 people. The racial makeup of the village was 94.3% White, 1.3% African American, 0.3% Native American, 0.7% Asian, 0.1% Pacific Islander, 1.2% from other races, and 2.3% from two or more races. Hispanic or Latino of any race were 3.3% of the population.
The median household income in the village was $50,945, and the median family income was $60,917. The per capita income in the village was $24,945. About 6.3% of families and 8.2% of the population were below the poverty line, including 10.3% of those under age 18 and 5.2% of those age 65 or over.
Common Questions
What is Per Capita Income in Chittenango?
Per Capita income in Chittenango is $33,209.
What is the Median Family Income in Chittenango?
Median Family Income in Chittenango is $82,596.
What is the Median Household income in Chittenango?
Median Household Income in Chittenango is $63,966.
What is Income or Wage Gap in Chittenango?
Income or Wage Gap in Chittenango is 26.1%.
Women in Chittenango earn 73.9 cents for every dollar earned by a man.
What is Inequality or Gini Index in Chittenango?
Inequality or Gini Index in Chittenango is 0.46.
What is the Total Population of Chittenango?
Total Population of Chittenango is 4,884.
What is the Total Male Population of Chittenango?
Total Male Population of Chittenango is 2,703.
What is the Total Female Population of Chittenango?
Total Female Population of Chittenango is 2,181.
What is the Ratio of Males per 100 Females in Chittenango?
There are 123.93 Males per 100 Females in Chittenango.
What is the Ratio of Females per 100 Males in Chittenango?
There are 80.69 Females per 100 Males in Chittenango.
What is the Median Population Age in Chittenango?
Median Population Age in Chittenango is 39.3 Years.
What is the Average Family Size in Chittenango
Average Family Size in Chittenango is 3.1 People.
What is the Average Household Size in Chittenango
Average Household Size in Chittenango is 2.6 People.
How Large is the Labor Force in Chittenango?
There are 2,188 People in the Labor Forcein in Chittenango.
What is the Percentage of People in the Labor Force in Chittenango?
55.6% of People are in the Labor Force in Chittenango.
What is the Unemployment Rate in Chittenango?
Unemployment Rate in Chittenango is 4.7%.