Highland, NY Map & Demographics
Highland Map
Highland Overview
$45,924
PER CAPITA INCOME
$122,434
AVG FAMILY INCOME
$97,296
AVG HOUSEHOLD INCOME
0.5%
WAGE / INCOME GAP [ % ]
99.5¢/ $1
WAGE / INCOME GAP [ $ ]
0.39
INEQUALITY / GINI INDEX
6,545
TOTAL POPULATION
2,823
MALE POPULATION
3,722
FEMALE POPULATION
75.85
MALES / 100 FEMALES
131.85
FEMALES / 100 MALES
40.1
MEDIAN AGE
3.2
AVG FAMILY SIZE
2.5
AVG HOUSEHOLD SIZE
3,541
LABOR FORCE [ PEOPLE ]
65.7%
PERCENT IN LABOR FORCE
4.2%
UNEMPLOYMENT RATE
Highland Zip Codes
Highland Area Codes
Income in Highland
Income Overview in Highland
Per Capita Income in Highland is $45,924, while median incomes of families and households are $122,434 and $97,296 respectively.
| Characteristic | Number | Measure |
| Per Capita Income | 6,545 | $45,924 |
| Median Family Income | 1,513 | $122,434 |
| Mean Family Income | 1,513 | $144,272 |
| Median Household Income | 2,516 | $97,296 |
| Mean Household Income | 2,516 | $117,086 |
| Income Deficit | 1,513 | $0 |
| Wage / Income Gap (%) | 6,545 | 0.49% |
| Wage / Income Gap ($) | 6,545 | 99.51¢ per $1 |
| Gini / Inequality Index | 6,545 | 0.39 |
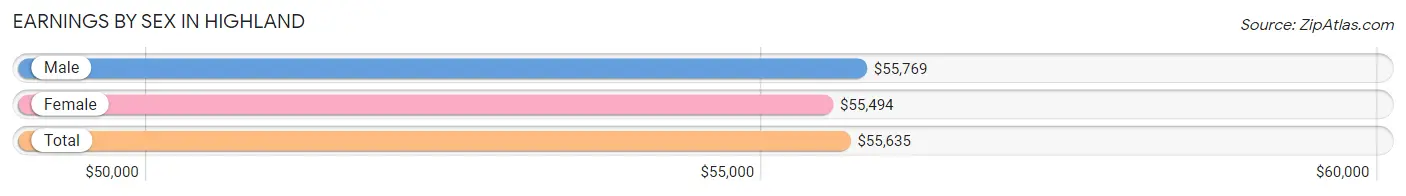
Earnings by Sex in Highland
Average Earnings in Highland are $55,635, $55,769 for men and $55,494 for women, a difference of 0.5%.
| Sex | Number | Average Earnings |
| Male | 1,754 (49.0%) | $55,769 |
| Female | 1,825 (51.0%) | $55,494 |
| Total | 3,579 (100.0%) | $55,635 |
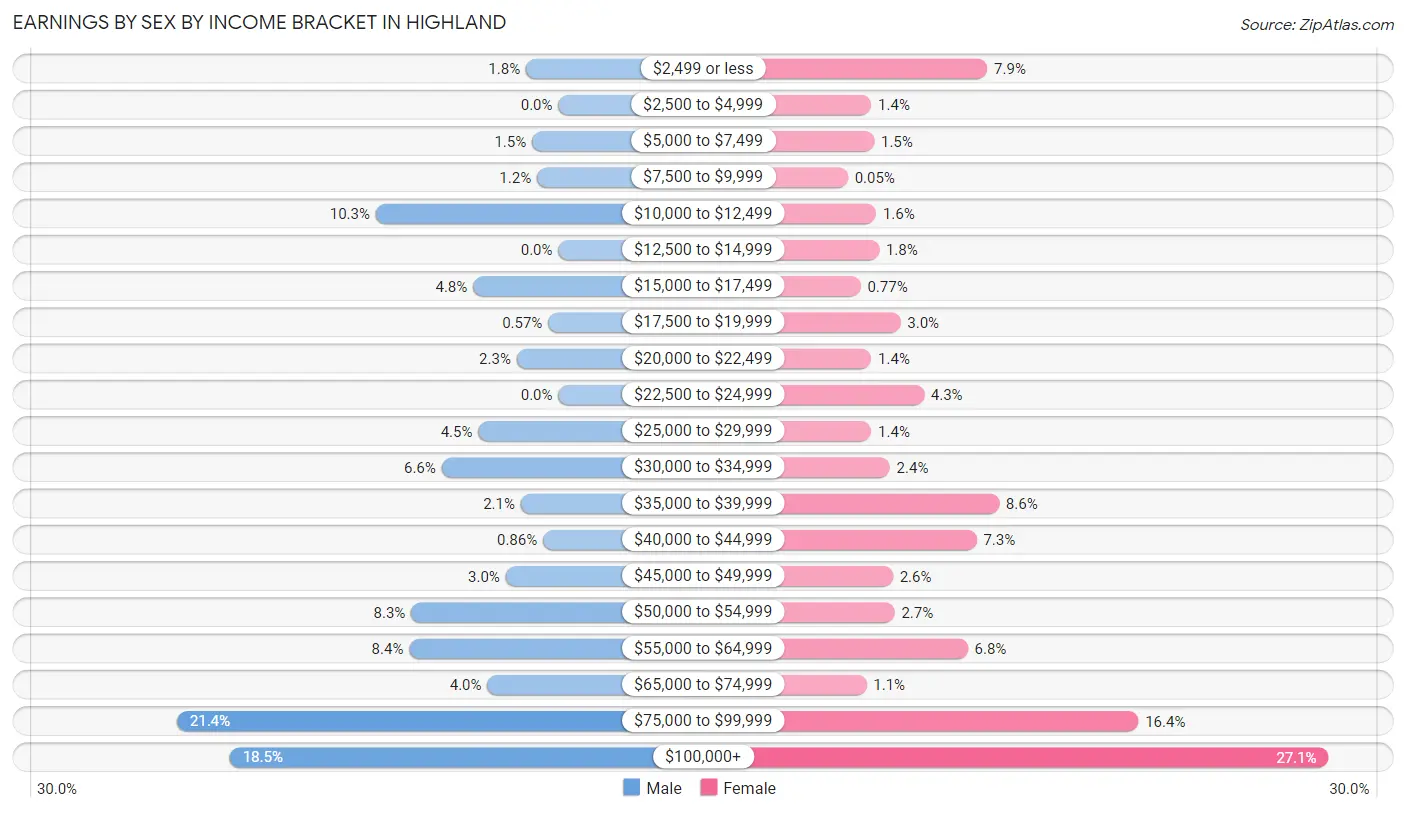
Earnings by Sex by Income Bracket in Highland
The most common earnings brackets in Highland are $75,000 to $99,999 for men (376 | 21.4%) and $100,000+ for women (494 | 27.1%).
| Income | Male | Female |
| $2,499 or less | 32 (1.8%) | 144 (7.9%) |
| $2,500 to $4,999 | 0 (0.0%) | 25 (1.4%) |
| $5,000 to $7,499 | 26 (1.5%) | 28 (1.5%) |
| $7,500 to $9,999 | 21 (1.2%) | 1 (0.1%) |
| $10,000 to $12,499 | 180 (10.3%) | 30 (1.6%) |
| $12,500 to $14,999 | 0 (0.0%) | 33 (1.8%) |
| $15,000 to $17,499 | 84 (4.8%) | 14 (0.8%) |
| $17,500 to $19,999 | 10 (0.6%) | 55 (3.0%) |
| $20,000 to $22,499 | 41 (2.3%) | 25 (1.4%) |
| $22,500 to $24,999 | 0 (0.0%) | 79 (4.3%) |
| $25,000 to $29,999 | 79 (4.5%) | 25 (1.4%) |
| $30,000 to $34,999 | 115 (6.6%) | 44 (2.4%) |
| $35,000 to $39,999 | 37 (2.1%) | 156 (8.6%) |
| $40,000 to $44,999 | 15 (0.9%) | 133 (7.3%) |
| $45,000 to $49,999 | 52 (3.0%) | 47 (2.6%) |
| $50,000 to $54,999 | 145 (8.3%) | 49 (2.7%) |
| $55,000 to $64,999 | 147 (8.4%) | 124 (6.8%) |
| $65,000 to $74,999 | 70 (4.0%) | 20 (1.1%) |
| $75,000 to $99,999 | 376 (21.4%) | 299 (16.4%) |
| $100,000+ | 324 (18.5%) | 494 (27.1%) |
| Total | 1,754 (100.0%) | 1,825 (100.0%) |
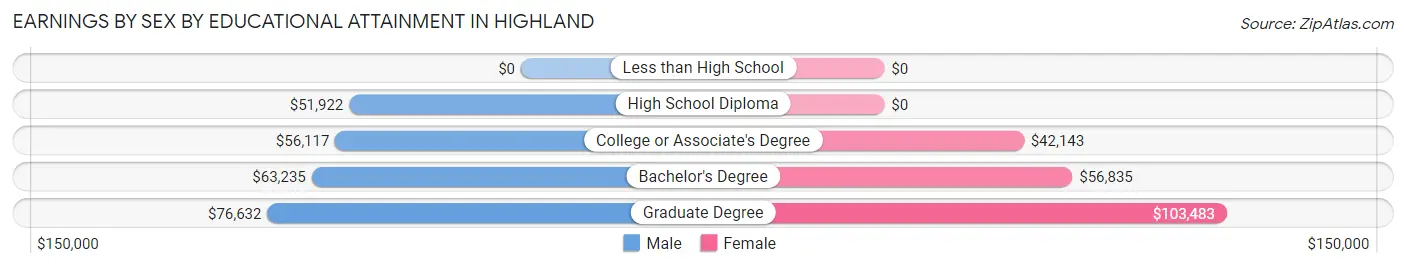
Earnings by Sex by Educational Attainment in Highland
Average earnings in Highland are $57,144 for men and $75,167 for women, a difference of 24.0%. Men with an educational attainment of graduate degree enjoy the highest average annual earnings of $76,632, while those with high school diploma education earn the least with $51,922. Women with an educational attainment of graduate degree earn the most with the average annual earnings of $103,483, while those with college or associate's degree education have the smallest earnings of $42,143.
| Educational Attainment | Male Income | Female Income |
| Less than High School | - | - |
| High School Diploma | $51,922 | $0 |
| College or Associate's Degree | $56,117 | $42,143 |
| Bachelor's Degree | $63,235 | $56,835 |
| Graduate Degree | $76,632 | $103,483 |
| Total | $57,144 | $75,167 |
Family Income in Highland
Family Income Brackets in Highland
According to the Highland family income data, there are 409 families falling into the $100,000 to $149,999 income range, which is the most common income bracket and makes up 27.0% of all families.
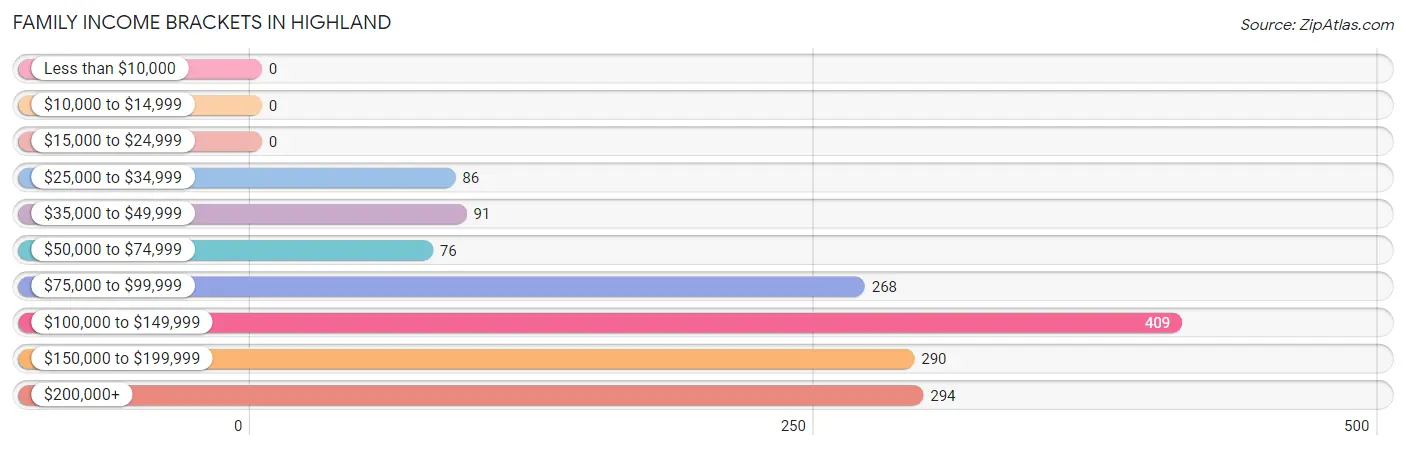
| Income Bracket | # Families | % Families |
| Less than $10,000 | 0 | 0.0% |
| $10,000 to $14,999 | 0 | 0.0% |
| $15,000 to $24,999 | 0 | 0.0% |
| $25,000 to $34,999 | 86 | 5.7% |
| $35,000 to $49,999 | 91 | 6.0% |
| $50,000 to $74,999 | 76 | 5.0% |
| $75,000 to $99,999 | 268 | 17.7% |
| $100,000 to $149,999 | 409 | 27.0% |
| $150,000 to $199,999 | 290 | 19.2% |
| $200,000+ | 294 | 19.4% |
Family Income by Famaliy Size in Highland
4-person families (341 | 22.5%) account for the highest median family income in Highland with $158,903 per family, while 2-person families (702 | 46.4%) have the highest median income of $50,288 per family member.
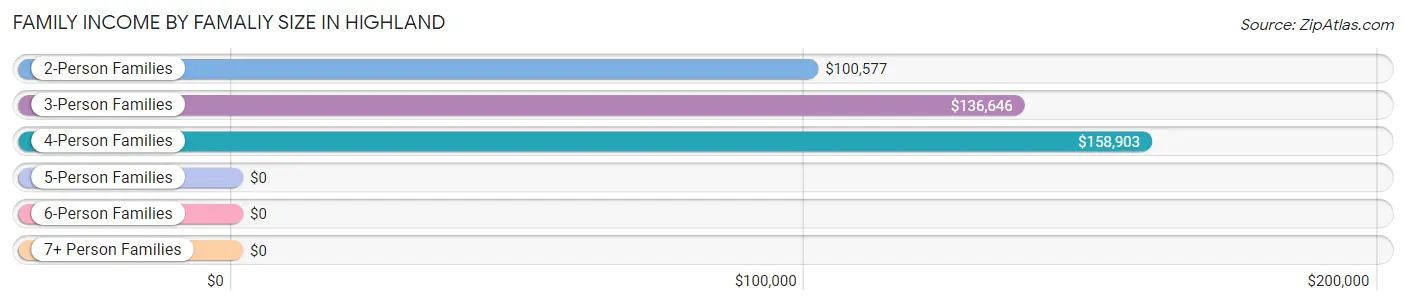
| Income Bracket | # Families | Median Income |
| 2-Person Families | 702 (46.4%) | $100,577 |
| 3-Person Families | 247 (16.3%) | $136,646 |
| 4-Person Families | 341 (22.5%) | $158,903 |
| 5-Person Families | 100 (6.6%) | $0 |
| 6-Person Families | 123 (8.1%) | $0 |
| 7+ Person Families | 0 (0.0%) | $0 |
| Total | 1,513 (100.0%) | $122,434 |
Family Income by Number of Earners in Highland
The median family income in Highland is $122,434, with families comprising 2 earners (830) having the highest median family income of $157,558, while families with no earners (179) have the lowest median family income of $90,852, accounting for 54.9% and 11.8% of families, respectively.
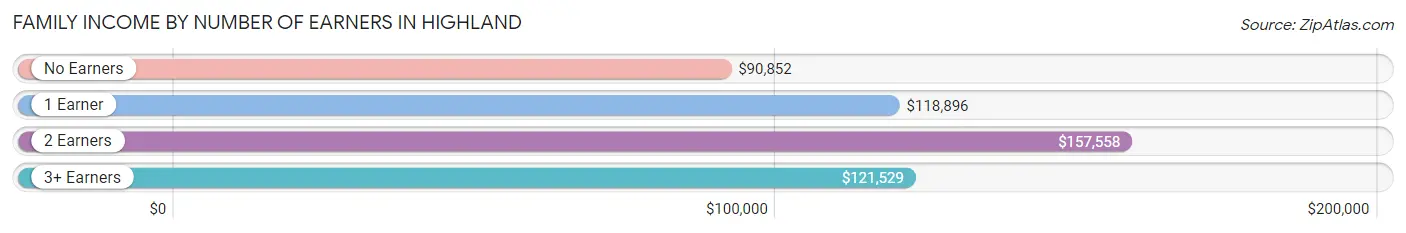
| Number of Earners | # Families | Median Income |
| No Earners | 179 (11.8%) | $90,852 |
| 1 Earner | 296 (19.6%) | $118,896 |
| 2 Earners | 830 (54.9%) | $157,558 |
| 3+ Earners | 208 (13.8%) | $121,529 |
| Total | 1,513 (100.0%) | $122,434 |
Household Income in Highland
Household Income Brackets in Highland
With 440 households falling in the category, the $75,000 to $99,999 income range is the most frequent in Highland, accounting for 17.5% of all households. In contrast, only 81 households (3.2%) fall into the $10,000 to $14,999 income bracket, making it the least populous group.
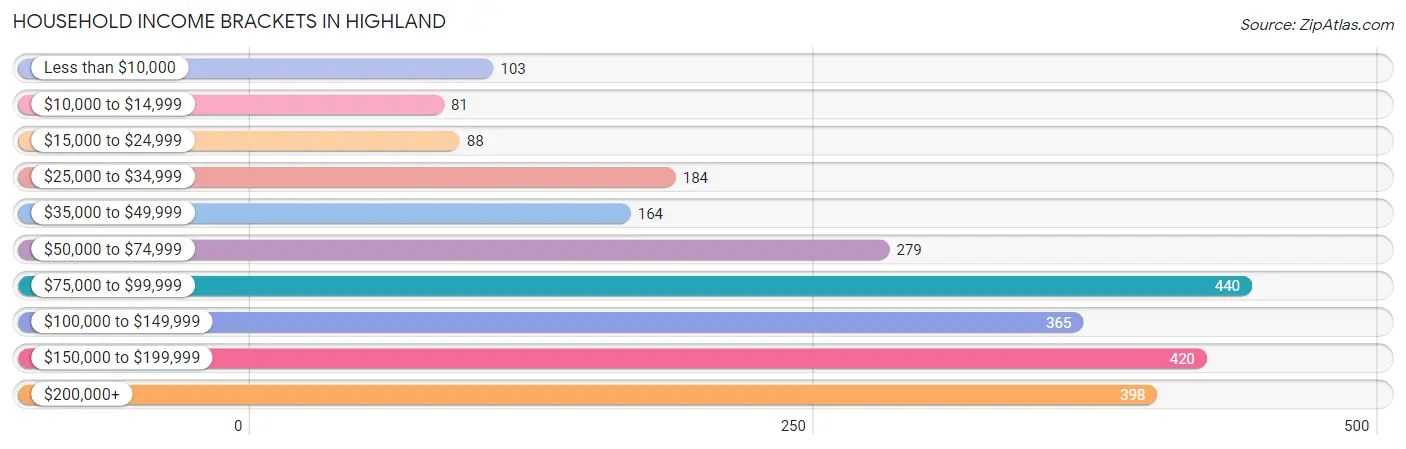
| Income Bracket | # Households | % Households |
| Less than $10,000 | 103 | 4.1% |
| $10,000 to $14,999 | 81 | 3.2% |
| $15,000 to $24,999 | 88 | 3.5% |
| $25,000 to $34,999 | 184 | 7.3% |
| $35,000 to $49,999 | 164 | 6.5% |
| $50,000 to $74,999 | 279 | 11.1% |
| $75,000 to $99,999 | 440 | 17.5% |
| $100,000 to $149,999 | 365 | 14.5% |
| $150,000 to $199,999 | 420 | 16.7% |
| $200,000+ | 398 | 15.8% |
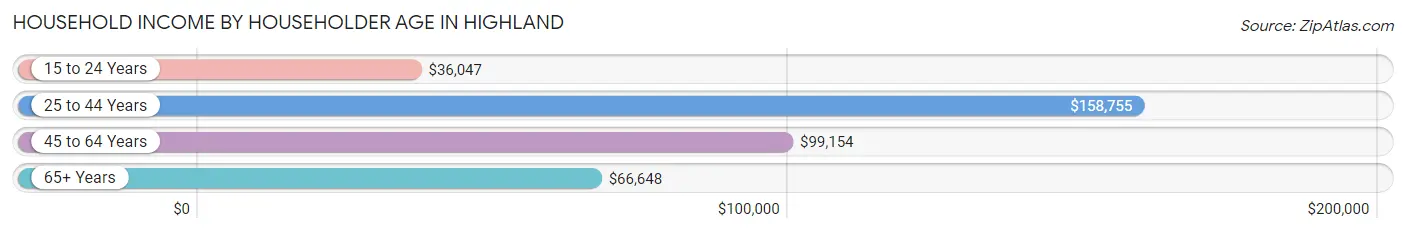
Household Income by Householder Age in Highland
The median household income in Highland is $97,296, with the highest median household income of $158,755 found in the 25 to 44 years age bracket for the primary householder. A total of 821 households (32.6%) fall into this category. Meanwhile, the 15 to 24 years age bracket for the primary householder has the lowest median household income of $36,047, with 113 households (4.5%) in this group.
| Income Bracket | # Households | Median Income |
| 15 to 24 Years | 113 (4.5%) | $36,047 |
| 25 to 44 Years | 821 (32.6%) | $158,755 |
| 45 to 64 Years | 737 (29.3%) | $99,154 |
| 65+ Years | 845 (33.6%) | $66,648 |
| Total | 2,516 (100.0%) | $97,296 |
Poverty in Highland
Income Below Poverty by Sex and Age in Highland
With 3.5% poverty level for males and 4.5% for females among the residents of Highland, 25 to 34 year old males and 65 to 74 year old females are the most vulnerable to poverty, with 44 males (10.1%) and 96 females (21.3%) in their respective age groups living below the poverty level.
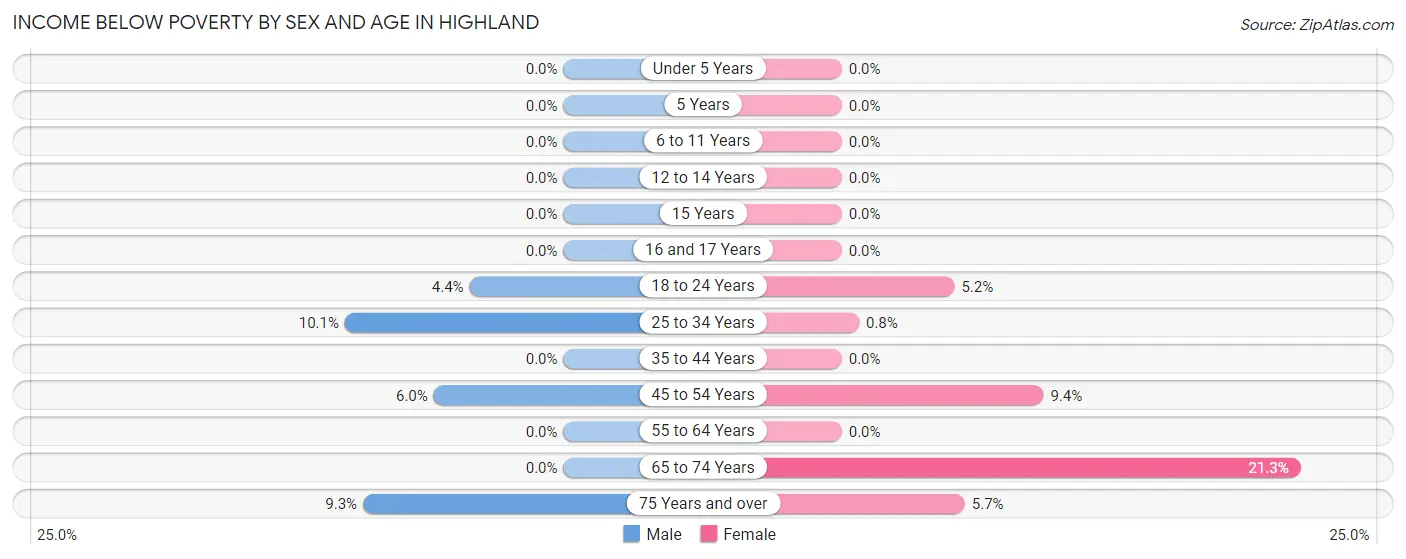
| Age Bracket | Male | Female |
| Under 5 Years | 0 (0.0%) | 0 (0.0%) |
| 5 Years | 0 (0.0%) | 0 (0.0%) |
| 6 to 11 Years | 0 (0.0%) | 0 (0.0%) |
| 12 to 14 Years | 0 (0.0%) | 0 (0.0%) |
| 15 Years | 0 (0.0%) | 0 (0.0%) |
| 16 and 17 Years | 0 (0.0%) | 0 (0.0%) |
| 18 to 24 Years | 13 (4.4%) | 17 (5.2%) |
| 25 to 34 Years | 44 (10.1%) | 3 (0.8%) |
| 35 to 44 Years | 0 (0.0%) | 0 (0.0%) |
| 45 to 54 Years | 24 (6.0%) | 32 (9.4%) |
| 55 to 64 Years | 0 (0.0%) | 0 (0.0%) |
| 65 to 74 Years | 0 (0.0%) | 96 (21.3%) |
| 75 Years and over | 12 (9.3%) | 12 (5.7%) |
| Total | 93 (3.5%) | 160 (4.5%) |
Income Above Poverty by Sex and Age in Highland
According to the poverty statistics in Highland, males aged under 5 years and females aged under 5 years are the age groups that are most secure financially, with 100.0% of males and 100.0% of females in these age groups living above the poverty line.
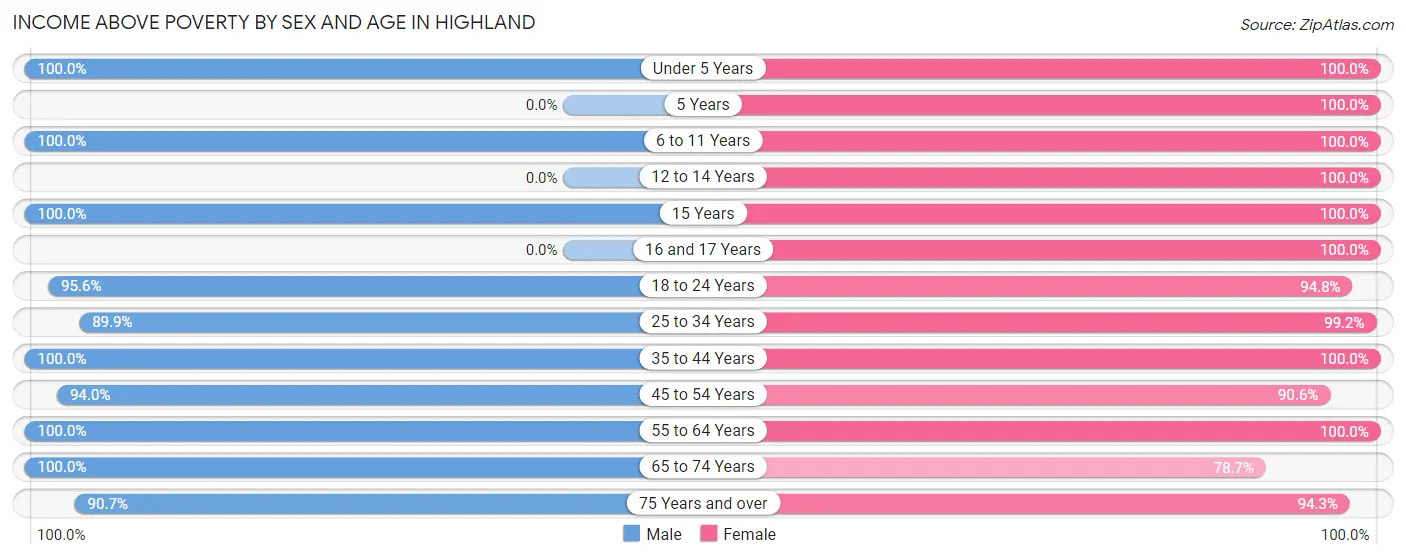
| Age Bracket | Male | Female |
| Under 5 Years | 41 (100.0%) | 410 (100.0%) |
| 5 Years | 0 (0.0%) | 220 (100.0%) |
| 6 to 11 Years | 139 (100.0%) | 146 (100.0%) |
| 12 to 14 Years | 0 (0.0%) | 21 (100.0%) |
| 15 Years | 109 (100.0%) | 60 (100.0%) |
| 16 and 17 Years | 0 (0.0%) | 84 (100.0%) |
| 18 to 24 Years | 285 (95.6%) | 308 (94.8%) |
| 25 to 34 Years | 390 (89.9%) | 372 (99.2%) |
| 35 to 44 Years | 390 (100.0%) | 486 (100.0%) |
| 45 to 54 Years | 375 (94.0%) | 310 (90.6%) |
| 55 to 64 Years | 345 (100.0%) | 424 (100.0%) |
| 65 to 74 Years | 392 (100.0%) | 355 (78.7%) |
| 75 Years and over | 117 (90.7%) | 198 (94.3%) |
| Total | 2,583 (96.5%) | 3,394 (95.5%) |
Income Below Poverty Among Married-Couple Families in Highland
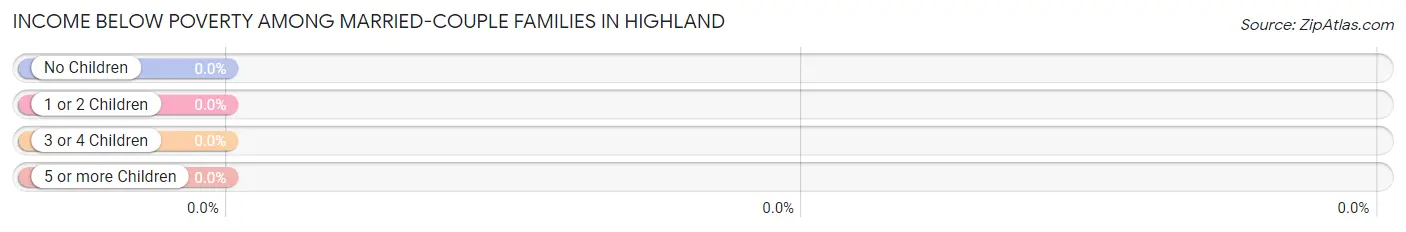
| Children | Above Poverty | Below Poverty |
| No Children | 578 (100.0%) | 0 (0.0%) |
| 1 or 2 Children | 519 (100.0%) | 0 (0.0%) |
| 3 or 4 Children | 0 (0.0%) | 0 (0.0%) |
| 5 or more Children | 0 (0.0%) | 0 (0.0%) |
| Total | 1,097 (100.0%) | 0 (0.0%) |
Income Below Poverty Among Single-Parent Households in Highland
| Children | Single Father | Single Mother |
| No Children | 0 (0.0%) | 0 (0.0%) |
| 1 or 2 Children | 0 (0.0%) | 0 (0.0%) |
| 3 or 4 Children | 0 (0.0%) | 0 (0.0%) |
| 5 or more Children | 0 (0.0%) | 0 (0.0%) |
| Total | 0 (0.0%) | 0 (0.0%) |
Income Below Poverty Among Married-Couple vs Single-Parent Households in Highland
| Children | Married-Couple Families | Single-Parent Households |
| No Children | 0 (0.0%) | 0 (0.0%) |
| 1 or 2 Children | 0 (0.0%) | 0 (0.0%) |
| 3 or 4 Children | 0 (0.0%) | 0 (0.0%) |
| 5 or more Children | 0 (0.0%) | 0 (0.0%) |
| Total | 0 (0.0%) | 0 (0.0%) |
Race in Highland
The most populous races in Highland are White / Caucasian (4,427 | 67.6%), Asian (906 | 13.8%), and Two or more Races (684 | 10.4%).
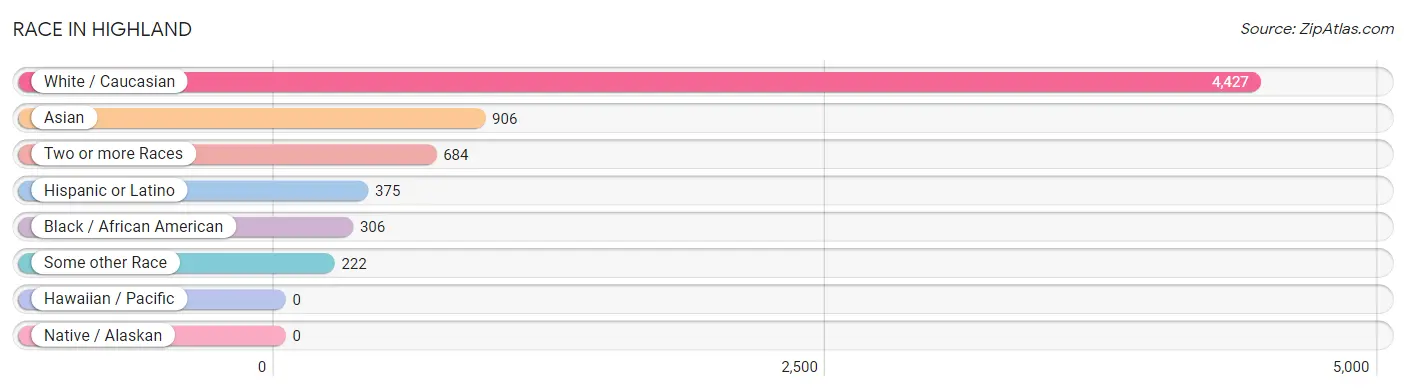
| Race | # Population | % Population |
| Asian | 906 | 13.8% |
| Black / African American | 306 | 4.7% |
| Hawaiian / Pacific | 0 | 0.0% |
| Hispanic or Latino | 375 | 5.7% |
| Native / Alaskan | 0 | 0.0% |
| White / Caucasian | 4,427 | 67.6% |
| Two or more Races | 684 | 10.4% |
| Some other Race | 222 | 3.4% |
| Total | 6,545 | 100.0% |
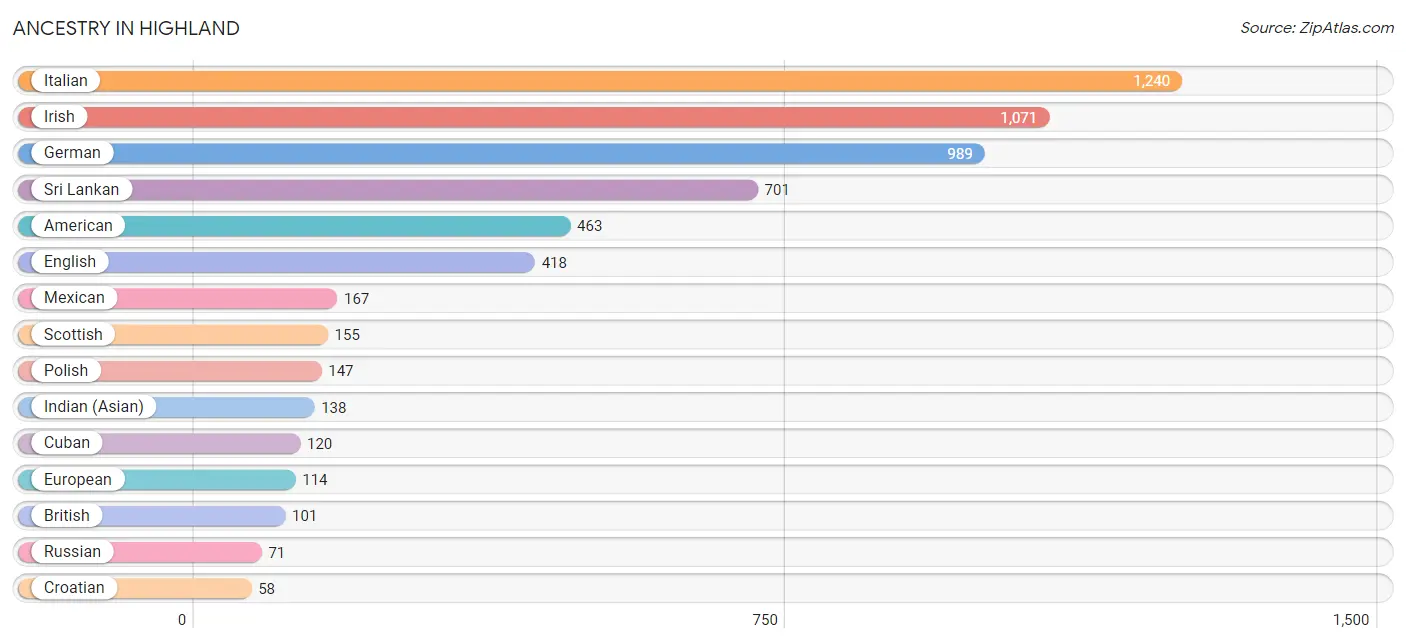
Ancestry in Highland
The most populous ancestries reported in Highland are Italian (1,240 | 19.0%), Irish (1,071 | 16.4%), German (989 | 15.1%), Sri Lankan (701 | 10.7%), and American (463 | 7.1%), together accounting for 68.2% of all Highland residents.
| Ancestry | # Population | % Population |
| African | 19 | 0.3% |
| American | 463 | 7.1% |
| Arab | 47 | 0.7% |
| Austrian | 48 | 0.7% |
| Barbadian | 15 | 0.2% |
| British | 101 | 1.5% |
| British West Indian | 41 | 0.6% |
| Burmese | 7 | 0.1% |
| Canadian | 22 | 0.3% |
| Central American | 31 | 0.5% |
| Cherokee | 23 | 0.4% |
| Croatian | 58 | 0.9% |
| Cuban | 120 | 1.8% |
| Czech | 18 | 0.3% |
| Czechoslovakian | 17 | 0.3% |
| Danish | 31 | 0.5% |
| Eastern European | 51 | 0.8% |
| English | 418 | 6.4% |
| European | 114 | 1.7% |
| French | 25 | 0.4% |
| French Canadian | 56 | 0.9% |
| German | 989 | 15.1% |
| Guatemalan | 28 | 0.4% |
| Hungarian | 32 | 0.5% |
| Indian (Asian) | 138 | 2.1% |
| Iranian | 42 | 0.6% |
| Irish | 1,071 | 16.4% |
| Italian | 1,240 | 19.0% |
| Jamaican | 16 | 0.2% |
| Lithuanian | 24 | 0.4% |
| Mexican | 167 | 2.5% |
| Northern European | 11 | 0.2% |
| Norwegian | 17 | 0.3% |
| Panamanian | 3 | 0.1% |
| Polish | 147 | 2.2% |
| Puerto Rican | 45 | 0.7% |
| Russian | 71 | 1.1% |
| Scottish | 155 | 2.4% |
| Slovak | 32 | 0.5% |
| Sri Lankan | 701 | 10.7% |
| Subsaharan African | 19 | 0.3% |
| Thai | 56 | 0.9% |
| Yugoslavian | 3 | 0.1% | View All 43 Rows |
Immigrants in Highland
The most numerous immigrant groups reported in Highland came from Asia (589 | 9.0%), South Eastern Asia (433 | 6.6%), Vietnam (433 | 6.6%), Latin America (227 | 3.5%), and Caribbean (135 | 2.1%), together accounting for 27.8% of all Highland residents.
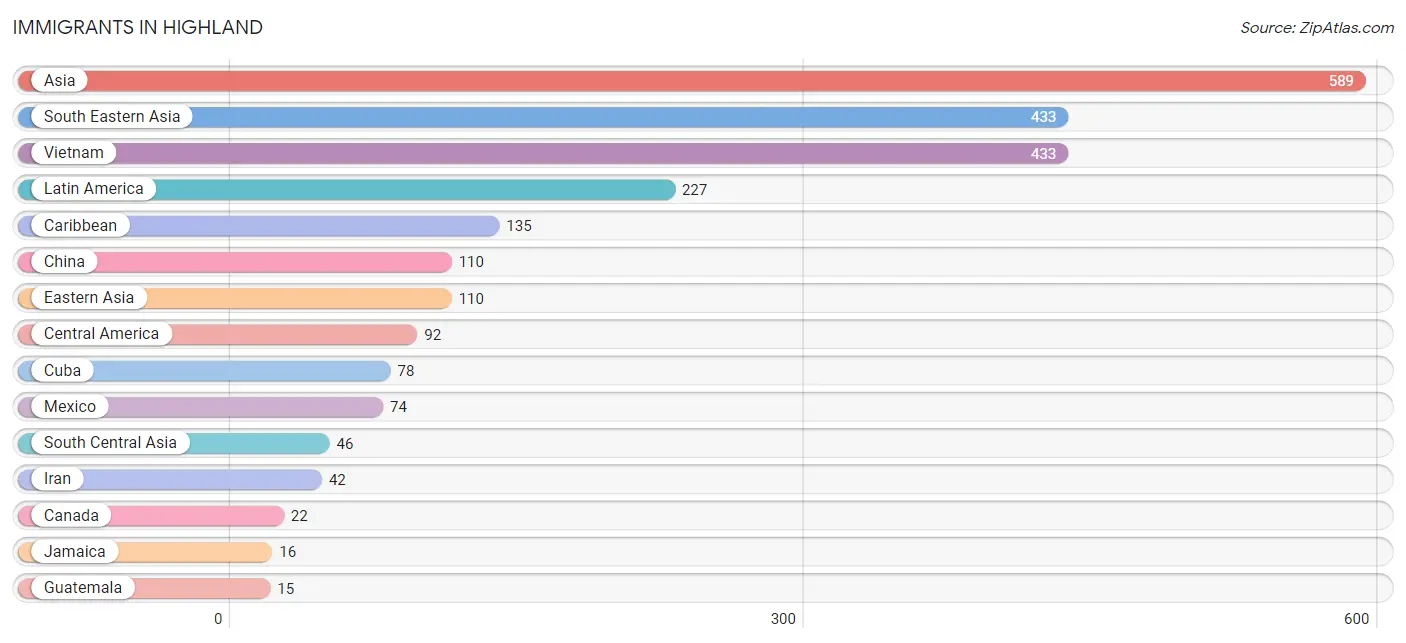
| Immigration Origin | # Population | % Population |
| Asia | 589 | 9.0% |
| Canada | 22 | 0.3% |
| Caribbean | 135 | 2.1% |
| Central America | 92 | 1.4% |
| China | 110 | 1.7% |
| Cuba | 78 | 1.2% |
| Eastern Asia | 110 | 1.7% |
| Eastern Europe | 6 | 0.1% |
| Europe | 6 | 0.1% |
| Guatemala | 15 | 0.2% |
| Hungary | 3 | 0.1% |
| Iran | 42 | 0.6% |
| Jamaica | 16 | 0.2% |
| Latin America | 227 | 3.5% |
| Mexico | 74 | 1.1% |
| Pakistan | 4 | 0.1% |
| Panama | 3 | 0.1% |
| South Central Asia | 46 | 0.7% |
| South Eastern Asia | 433 | 6.6% |
| Vietnam | 433 | 6.6% | View All 20 Rows |
Sex and Age in Highland
Sex and Age in Highland
The most populous age groups in Highland are 65 to 69 Years (252 | 8.9%) for men and Under 5 Years (410 | 11.0%) for women.
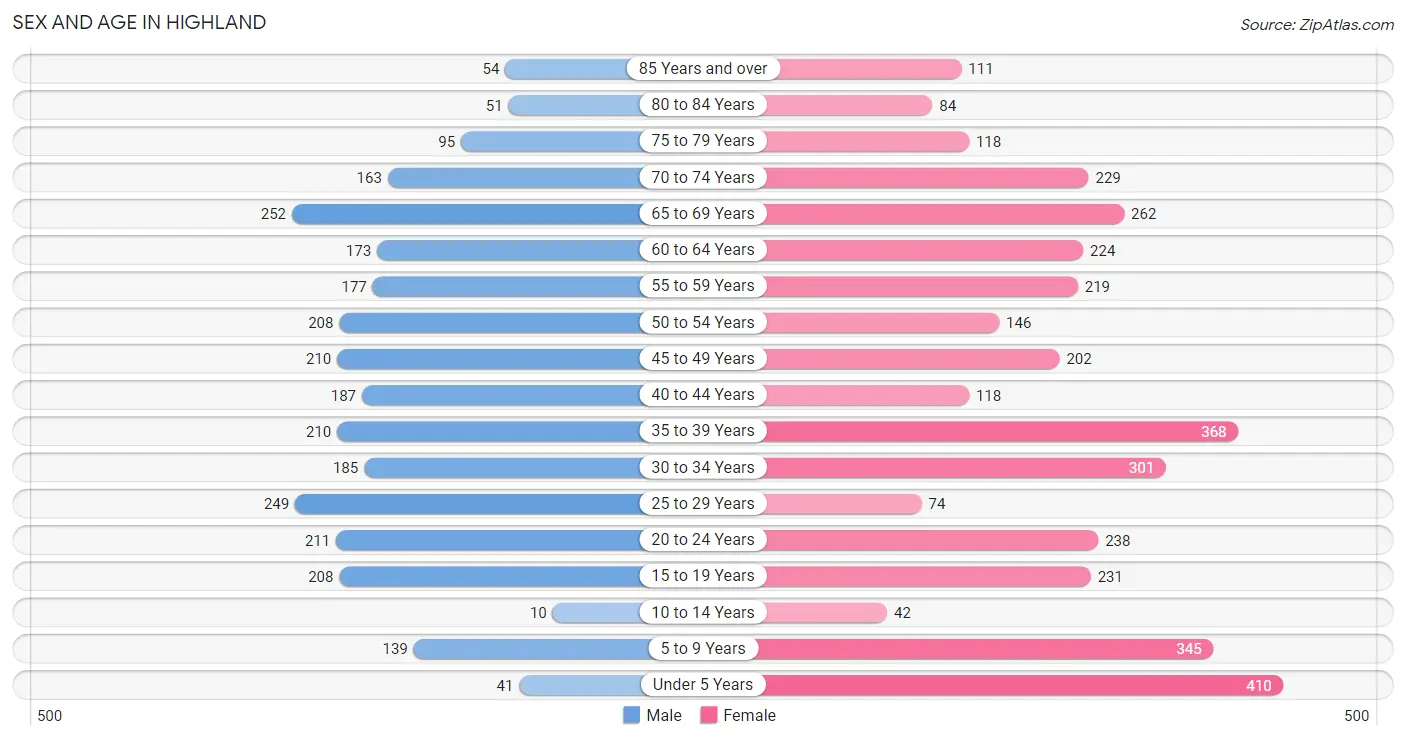
| Age Bracket | Male | Female |
| Under 5 Years | 41 (1.5%) | 410 (11.0%) |
| 5 to 9 Years | 139 (4.9%) | 345 (9.3%) |
| 10 to 14 Years | 10 (0.4%) | 42 (1.1%) |
| 15 to 19 Years | 208 (7.4%) | 231 (6.2%) |
| 20 to 24 Years | 211 (7.5%) | 238 (6.4%) |
| 25 to 29 Years | 249 (8.8%) | 74 (2.0%) |
| 30 to 34 Years | 185 (6.6%) | 301 (8.1%) |
| 35 to 39 Years | 210 (7.4%) | 368 (9.9%) |
| 40 to 44 Years | 187 (6.6%) | 118 (3.2%) |
| 45 to 49 Years | 210 (7.4%) | 202 (5.4%) |
| 50 to 54 Years | 208 (7.4%) | 146 (3.9%) |
| 55 to 59 Years | 177 (6.3%) | 219 (5.9%) |
| 60 to 64 Years | 173 (6.1%) | 224 (6.0%) |
| 65 to 69 Years | 252 (8.9%) | 262 (7.0%) |
| 70 to 74 Years | 163 (5.8%) | 229 (6.1%) |
| 75 to 79 Years | 95 (3.4%) | 118 (3.2%) |
| 80 to 84 Years | 51 (1.8%) | 84 (2.3%) |
| 85 Years and over | 54 (1.9%) | 111 (3.0%) |
| Total | 2,823 (100.0%) | 3,722 (100.0%) |
Families and Households in Highland
Median Family Size in Highland
The median family size in Highland is 3.21 persons per family, with single male/father families (186 | 12.3%) accounting for the largest median family size of 4.07 persons per family. On the other hand, married-couple families (1,097 | 72.5%) represent the smallest median family size with 3.04 persons per family.
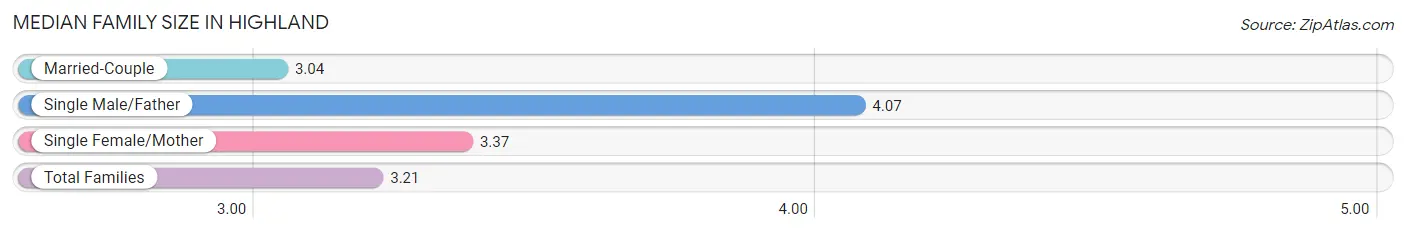
| Family Type | # Families | Family Size |
| Married-Couple | 1,097 (72.5%) | 3.04 |
| Single Male/Father | 186 (12.3%) | 4.07 |
| Single Female/Mother | 230 (15.2%) | 3.37 |
| Total Families | 1,513 (100.0%) | 3.21 |
Median Household Size in Highland
The median household size in Highland is 2.46 persons per household, with single male/father households (186 | 7.4%) accounting for the largest median household size of 4.83 persons per household. non-family households (1,003 | 39.9%) represent the smallest median household size with 1.13 persons per household.
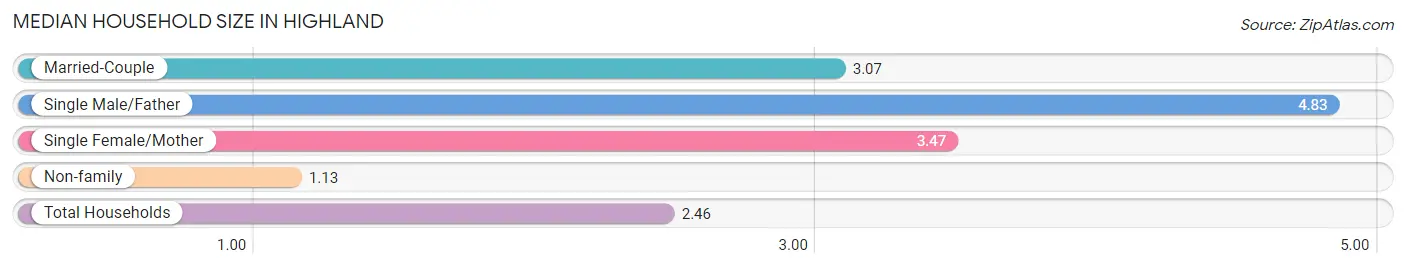
| Household Type | # Households | Household Size |
| Married-Couple | 1,097 (43.6%) | 3.07 |
| Single Male/Father | 186 (7.4%) | 4.83 |
| Single Female/Mother | 230 (9.1%) | 3.47 |
| Non-family | 1,003 (39.9%) | 1.13 |
| Total Households | 2,516 (100.0%) | 2.46 |
Household Size by Marriage Status in Highland
Out of a total of 2,516 households in Highland, 1,513 (60.1%) are family households, while 1,003 (39.9%) are nonfamily households. The most numerous type of family households are 2-person households, comprising 623, and the most common type of nonfamily households are 1-person households, comprising 869.
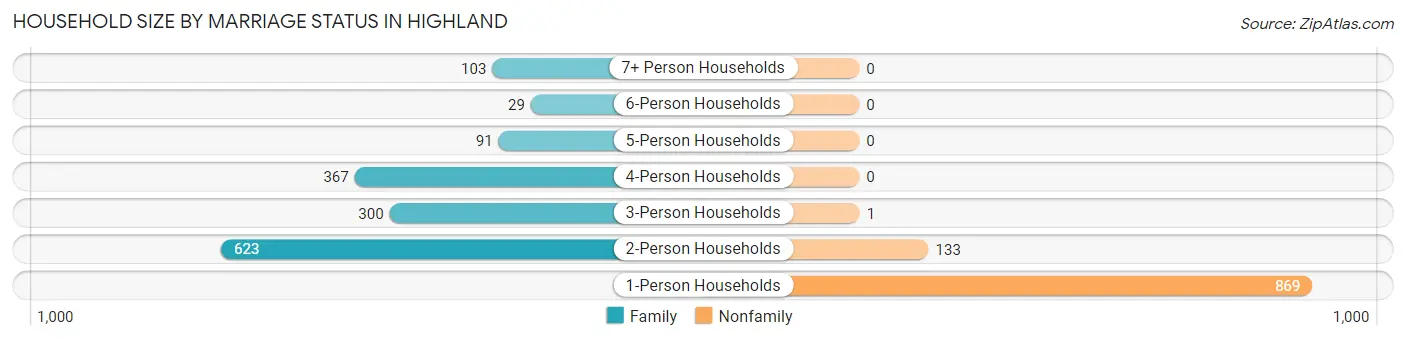
| Household Size | Family Households | Nonfamily Households |
| 1-Person Households | - | 869 (34.5%) |
| 2-Person Households | 623 (24.8%) | 133 (5.3%) |
| 3-Person Households | 300 (11.9%) | 1 (0.0%) |
| 4-Person Households | 367 (14.6%) | 0 (0.0%) |
| 5-Person Households | 91 (3.6%) | 0 (0.0%) |
| 6-Person Households | 29 (1.1%) | 0 (0.0%) |
| 7+ Person Households | 103 (4.1%) | 0 (0.0%) |
| Total | 1,513 (60.1%) | 1,003 (39.9%) |
Female Fertility in Highland
Fertility by Age in Highland
| Age Bracket | Women with Births | Births / 1,000 Women |
| 15 to 19 years | 0 (0.0%) | 0.0 |
| 20 to 34 years | 0 (0.0%) | 0.0 |
| 35 to 50 years | 0 (0.0%) | 0.0 |
| Total | 0 (0.0%) | 0.0 |
Fertility by Age by Marriage Status in Highland
| Age Bracket | Married | Unmarried |
| 15 to 19 years | 0 (0.0%) | 0 (0.0%) |
| 20 to 34 years | 0 (0.0%) | 0 (0.0%) |
| 35 to 50 years | 0 (0.0%) | 0 (0.0%) |
| Total | 0 (0.0%) | 0 (0.0%) |
Fertility by Education in Highland
| Educational Attainment | Women with Births | Births / 1,000 Women |
| Less than High School | 0 (0.0%) | 0.0 |
| High School Diploma | 0 (0.0%) | 0.0 |
| College or Associate's Degree | 0 (0.0%) | 0.0 |
| Bachelor's Degree | 0 (0.0%) | 0.0 |
| Graduate Degree | 0 (0.0%) | 0.0 |
| Total | 0 (0.0%) | 0.0 |
Fertility by Education by Marriage Status in Highland
| Educational Attainment | Married | Unmarried |
| Less than High School | 0 (0.0%) | 0 (0.0%) |
| High School Diploma | 0 (0.0%) | 0 (0.0%) |
| College or Associate's Degree | 0 (0.0%) | 0 (0.0%) |
| Bachelor's Degree | 0 (0.0%) | 0 (0.0%) |
| Graduate Degree | 0 (0.0%) | 0 (0.0%) |
| Total | 0 (0.0%) | 0 (0.0%) |
Employment Characteristics in Highland
Employment by Class of Employer in Highland
Among the 3,347 employed individuals in Highland, private company employees (2,098 | 62.7%), not-for-profit organizations (573 | 17.1%), and local government employees (259 | 7.7%) make up the most common classes of employment.
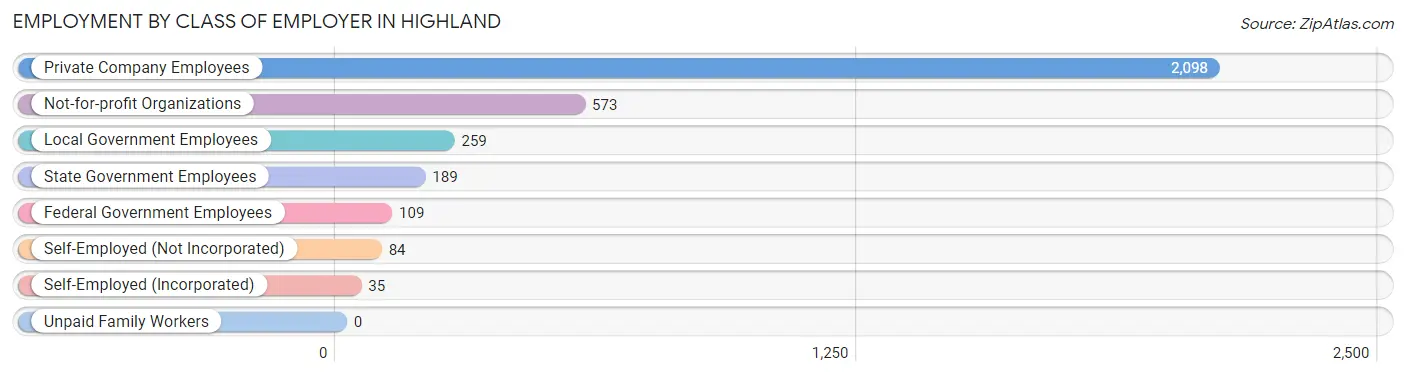
| Employer Class | # Employees | % Employees |
| Private Company Employees | 2,098 | 62.7% |
| Self-Employed (Incorporated) | 35 | 1.1% |
| Self-Employed (Not Incorporated) | 84 | 2.5% |
| Not-for-profit Organizations | 573 | 17.1% |
| Local Government Employees | 259 | 7.7% |
| State Government Employees | 189 | 5.7% |
| Federal Government Employees | 109 | 3.3% |
| Unpaid Family Workers | 0 | 0.0% |
| Total | 3,347 | 100.0% |
Employment Status by Age in Highland
According to the labor force statistics for Highland, out of the total population over 16 years of age (5,389), 65.7% or 3,541 individuals are in the labor force, with 4.2% or 149 of them unemployed. The age group with the highest labor force participation rate is 35 to 44 years, with 97.5% or 861 individuals in the labor force. Within the labor force, the 25 to 29 years age range has the highest percentage of unemployed individuals, with 35.7% or 99 of them being unemployed.
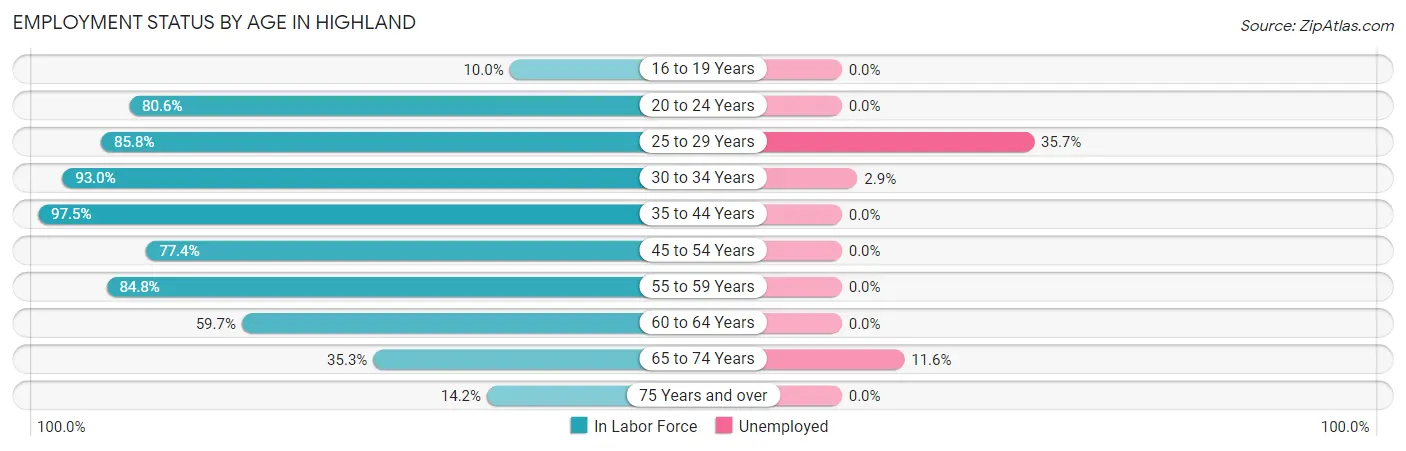
| Age Bracket | In Labor Force | Unemployed |
| 16 to 19 Years | 27 (10.0%) | 0 (0.0%) |
| 20 to 24 Years | 362 (80.6%) | 0 (0.0%) |
| 25 to 29 Years | 277 (85.8%) | 99 (35.7%) |
| 30 to 34 Years | 452 (93.0%) | 13 (2.9%) |
| 35 to 44 Years | 861 (97.5%) | 0 (0.0%) |
| 45 to 54 Years | 593 (77.4%) | 0 (0.0%) |
| 55 to 59 Years | 336 (84.8%) | 0 (0.0%) |
| 60 to 64 Years | 237 (59.7%) | 0 (0.0%) |
| 65 to 74 Years | 320 (35.3%) | 37 (11.6%) |
| 75 Years and over | 73 (14.2%) | 0 (0.0%) |
| Total | 3,541 (65.7%) | 149 (4.2%) |
Employment Status by Educational Attainment in Highland
According to labor force statistics for Highland, 84.8% of individuals (2,757) out of the total population between 25 and 64 years of age (3,251) are in the labor force, with 4.1% or 113 of them being unemployed. The group with the highest labor force participation rate are those with the educational attainment of college / associate degree, with 89.3% or 718 individuals in the labor force. Within the labor force, individuals with less than high school education have the highest percentage of unemployment, with 26.7% or 23 of them being unemployed.
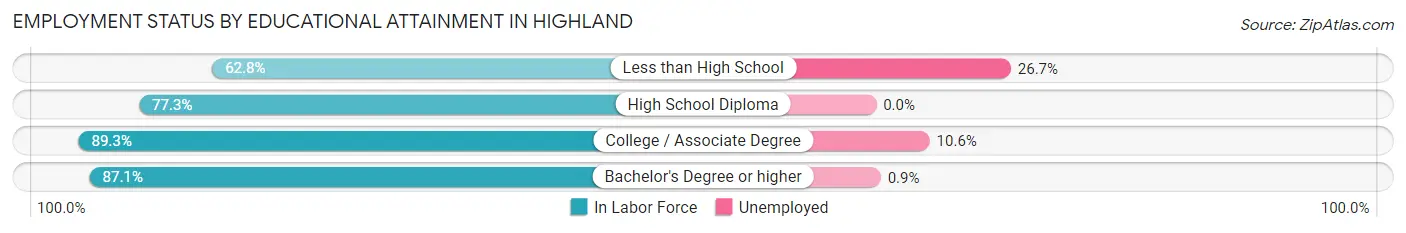
| Educational Attainment | In Labor Force | Unemployed |
| Less than High School | 86 (62.8%) | 37 (26.7%) |
| High School Diploma | 471 (77.3%) | 0 (0.0%) |
| College / Associate Degree | 718 (89.3%) | 85 (10.6%) |
| Bachelor's Degree or higher | 1,482 (87.1%) | 15 (0.9%) |
| Total | 2,757 (84.8%) | 133 (4.1%) |
Employment Occupations by Sex in Highland
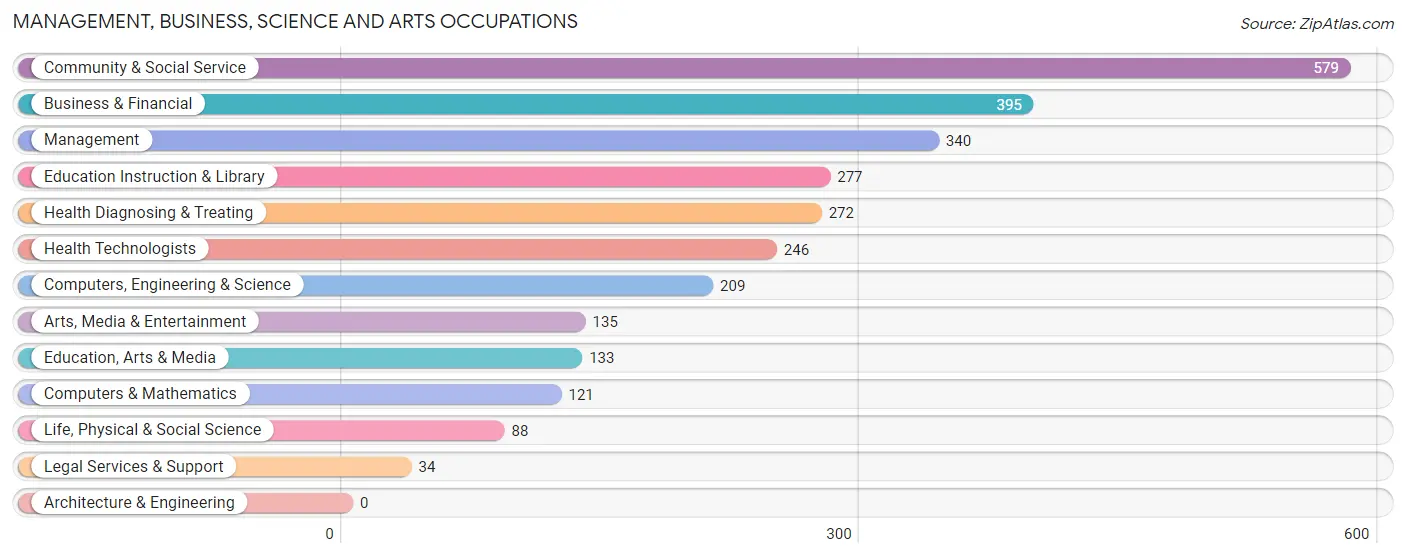
Management, Business, Science and Arts Occupations
The most common Management, Business, Science and Arts occupations in Highland are Community & Social Service (579 | 17.1%), Business & Financial (395 | 11.7%), Management (340 | 10.0%), Education Instruction & Library (277 | 8.2%), and Health Diagnosing & Treating (272 | 8.0%).
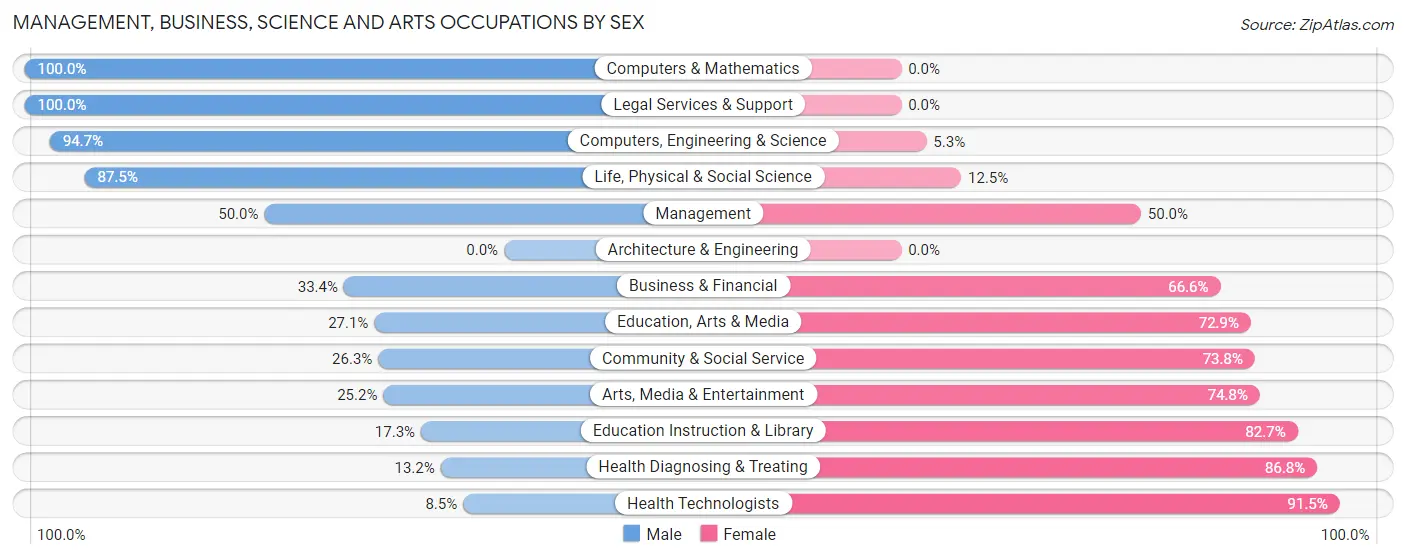
Management, Business, Science and Arts Occupations by Sex
Within the Management, Business, Science and Arts occupations in Highland, the most male-oriented occupations are Computers & Mathematics (100.0%), Legal Services & Support (100.0%), and Computers, Engineering & Science (94.7%), while the most female-oriented occupations are Health Technologists (91.5%), Health Diagnosing & Treating (86.8%), and Education Instruction & Library (82.7%).
| Occupation | Male | Female |
| Management | 170 (50.0%) | 170 (50.0%) |
| Business & Financial | 132 (33.4%) | 263 (66.6%) |
| Computers, Engineering & Science | 198 (94.7%) | 11 (5.3%) |
| Computers & Mathematics | 121 (100.0%) | 0 (0.0%) |
| Architecture & Engineering | 0 (0.0%) | 0 (0.0%) |
| Life, Physical & Social Science | 77 (87.5%) | 11 (12.5%) |
| Community & Social Service | 152 (26.3%) | 427 (73.8%) |
| Education, Arts & Media | 36 (27.1%) | 97 (72.9%) |
| Legal Services & Support | 34 (100.0%) | 0 (0.0%) |
| Education Instruction & Library | 48 (17.3%) | 229 (82.7%) |
| Arts, Media & Entertainment | 34 (25.2%) | 101 (74.8%) |
| Health Diagnosing & Treating | 36 (13.2%) | 236 (86.8%) |
| Health Technologists | 21 (8.5%) | 225 (91.5%) |
| Total (Category) | 688 (38.3%) | 1,107 (61.7%) |
| Total (Overall) | 1,673 (49.4%) | 1,716 (50.6%) |
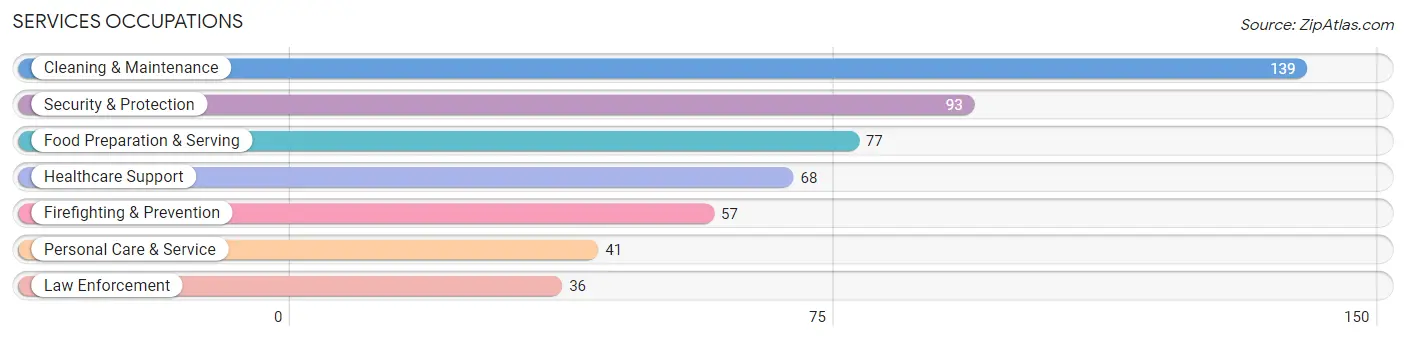
Services Occupations
The most common Services occupations in Highland are Cleaning & Maintenance (139 | 4.1%), Security & Protection (93 | 2.7%), Food Preparation & Serving (77 | 2.3%), Healthcare Support (68 | 2.0%), and Firefighting & Prevention (57 | 1.7%).
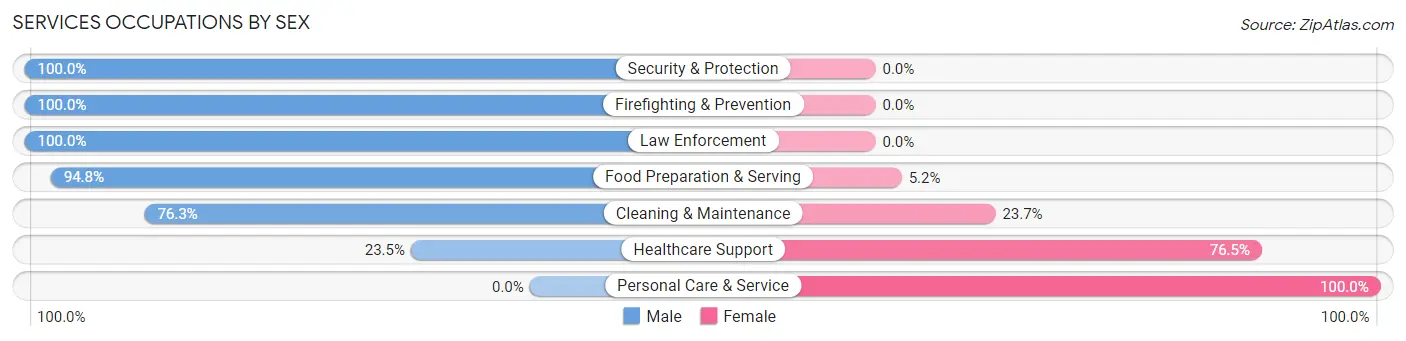
Services Occupations by Sex
Within the Services occupations in Highland, the most male-oriented occupations are Security & Protection (100.0%), Firefighting & Prevention (100.0%), and Law Enforcement (100.0%), while the most female-oriented occupations are Personal Care & Service (100.0%), Healthcare Support (76.5%), and Cleaning & Maintenance (23.7%).
| Occupation | Male | Female |
| Healthcare Support | 16 (23.5%) | 52 (76.5%) |
| Security & Protection | 93 (100.0%) | 0 (0.0%) |
| Firefighting & Prevention | 57 (100.0%) | 0 (0.0%) |
| Law Enforcement | 36 (100.0%) | 0 (0.0%) |
| Food Preparation & Serving | 73 (94.8%) | 4 (5.2%) |
| Cleaning & Maintenance | 106 (76.3%) | 33 (23.7%) |
| Personal Care & Service | 0 (0.0%) | 41 (100.0%) |
| Total (Category) | 288 (68.9%) | 130 (31.1%) |
| Total (Overall) | 1,673 (49.4%) | 1,716 (50.6%) |
Sales and Office Occupations
The most common Sales and Office occupations in Highland are Office & Administration (283 | 8.4%), and Sales & Related (227 | 6.7%).
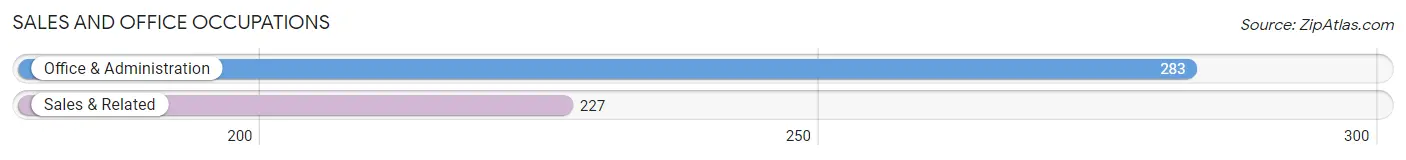
Sales and Office Occupations by Sex
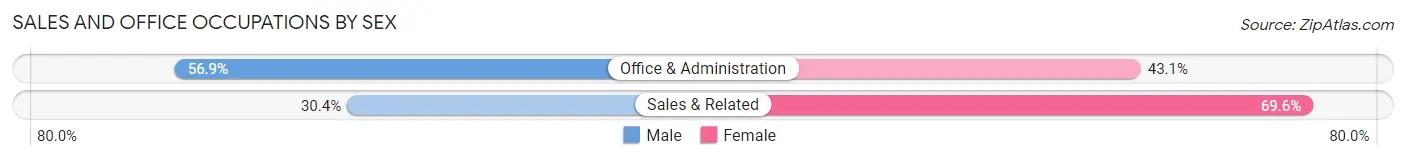
| Occupation | Male | Female |
| Sales & Related | 69 (30.4%) | 158 (69.6%) |
| Office & Administration | 161 (56.9%) | 122 (43.1%) |
| Total (Category) | 230 (45.1%) | 280 (54.9%) |
| Total (Overall) | 1,673 (49.4%) | 1,716 (50.6%) |
Natural Resources, Construction and Maintenance Occupations
The most common Natural Resources, Construction and Maintenance occupations in Highland are Construction & Extraction (205 | 6.0%), Installation, Maintenance & Repair (95 | 2.8%), and Farming, Fishing & Forestry (83 | 2.5%).
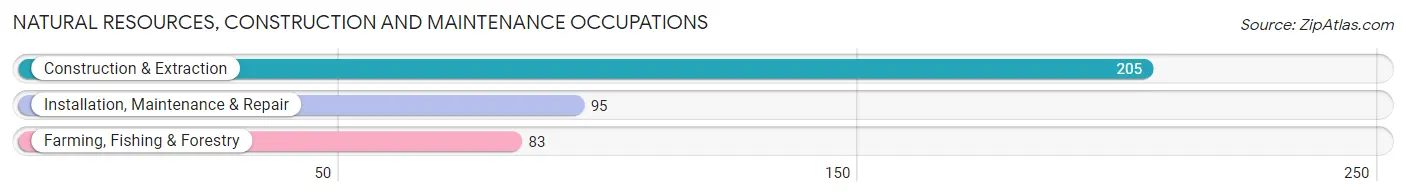
Natural Resources, Construction and Maintenance Occupations by Sex
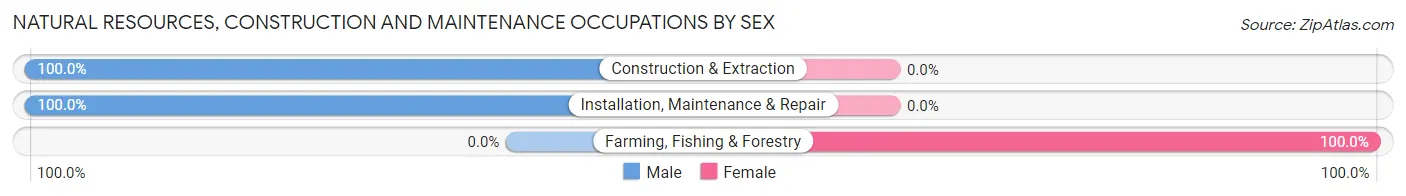
| Occupation | Male | Female |
| Farming, Fishing & Forestry | 0 (0.0%) | 83 (100.0%) |
| Construction & Extraction | 205 (100.0%) | 0 (0.0%) |
| Installation, Maintenance & Repair | 95 (100.0%) | 0 (0.0%) |
| Total (Category) | 300 (78.3%) | 83 (21.7%) |
| Total (Overall) | 1,673 (49.4%) | 1,716 (50.6%) |
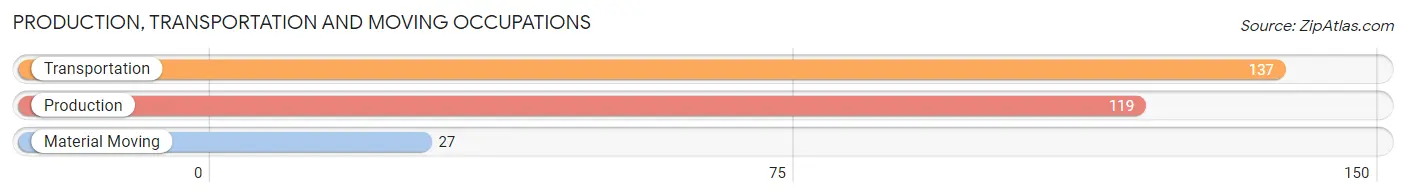
Production, Transportation and Moving Occupations
The most common Production, Transportation and Moving occupations in Highland are Transportation (137 | 4.0%), Production (119 | 3.5%), and Material Moving (27 | 0.8%).
Production, Transportation and Moving Occupations by Sex
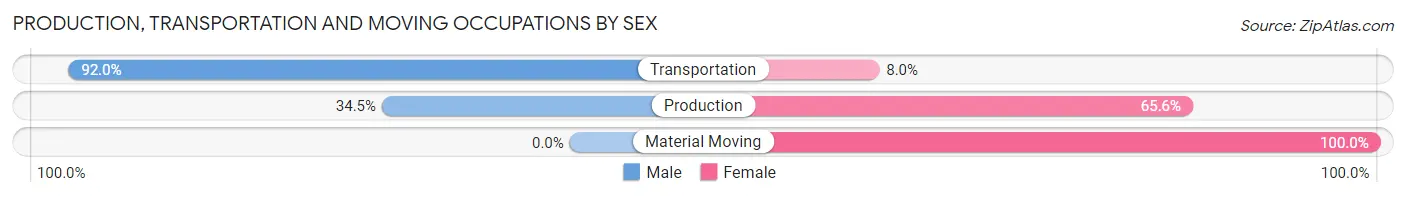
| Occupation | Male | Female |
| Production | 41 (34.4%) | 78 (65.5%) |
| Transportation | 126 (92.0%) | 11 (8.0%) |
| Material Moving | 0 (0.0%) | 27 (100.0%) |
| Total (Category) | 167 (59.0%) | 116 (41.0%) |
| Total (Overall) | 1,673 (49.4%) | 1,716 (50.6%) |
Employment Industries by Sex in Highland
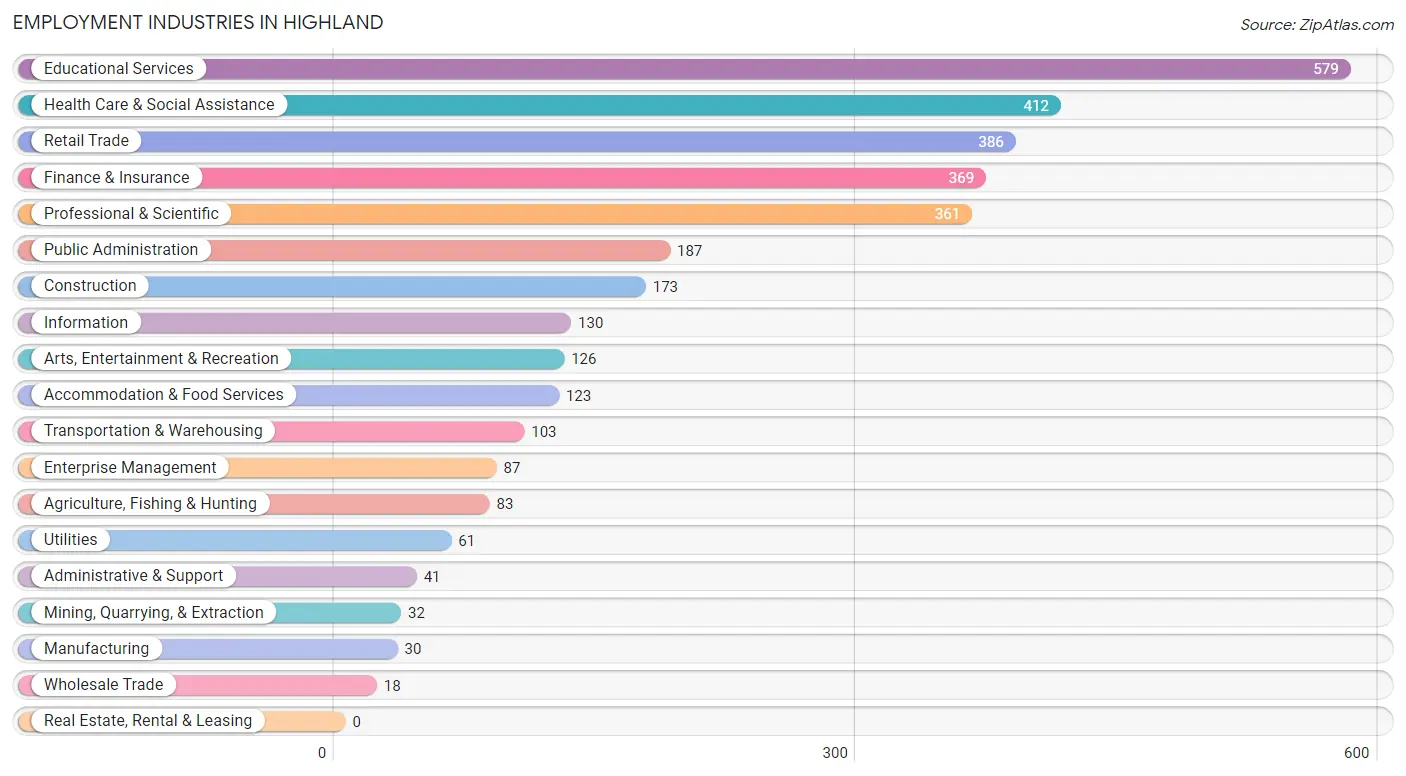
Employment Industries in Highland
The major employment industries in Highland include Educational Services (579 | 17.1%), Health Care & Social Assistance (412 | 12.2%), Retail Trade (386 | 11.4%), Finance & Insurance (369 | 10.9%), and Professional & Scientific (361 | 10.6%).
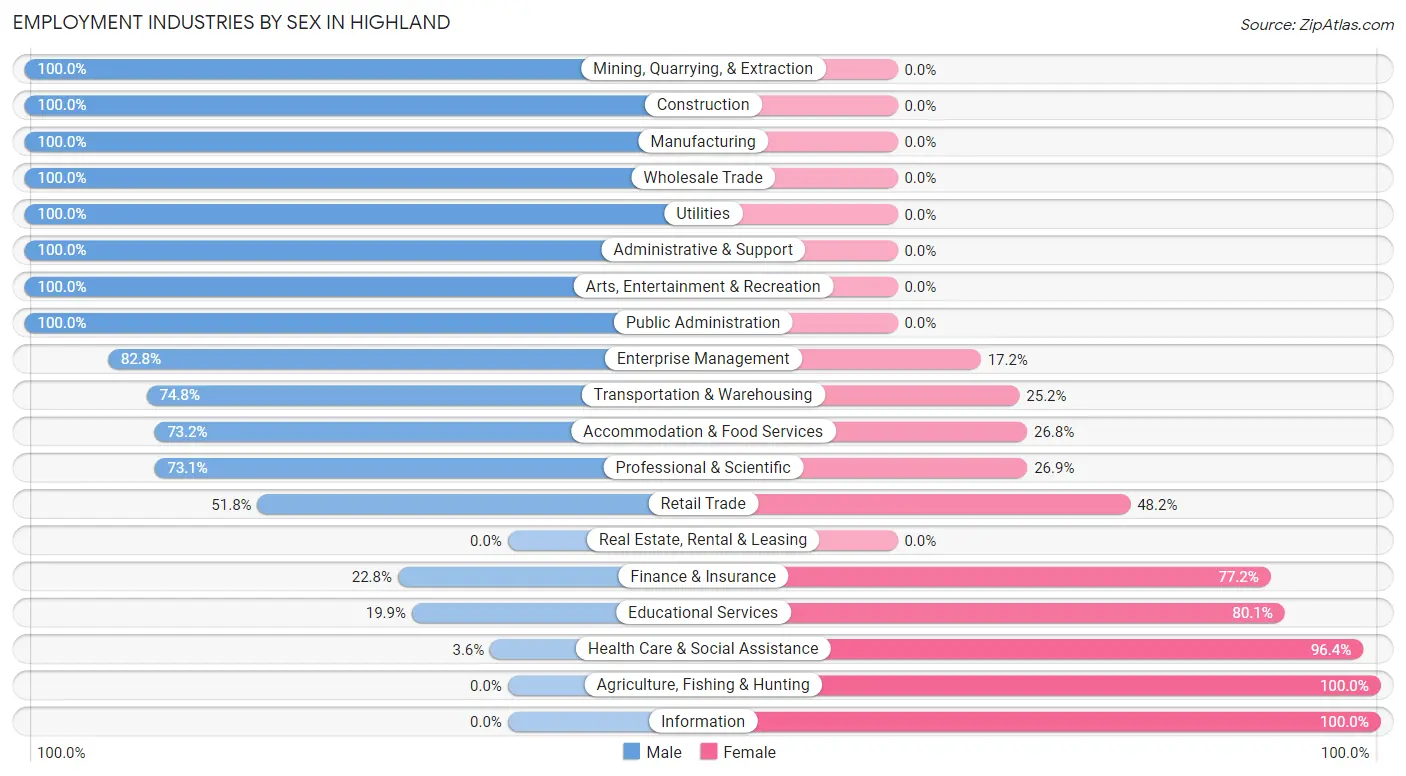
Employment Industries by Sex in Highland
The Highland industries that see more men than women are Mining, Quarrying, & Extraction (100.0%), Construction (100.0%), and Manufacturing (100.0%), whereas the industries that tend to have a higher number of women are Agriculture, Fishing & Hunting (100.0%), Information (100.0%), and Health Care & Social Assistance (96.4%).
| Industry | Male | Female |
| Agriculture, Fishing & Hunting | 0 (0.0%) | 83 (100.0%) |
| Mining, Quarrying, & Extraction | 32 (100.0%) | 0 (0.0%) |
| Construction | 173 (100.0%) | 0 (0.0%) |
| Manufacturing | 30 (100.0%) | 0 (0.0%) |
| Wholesale Trade | 18 (100.0%) | 0 (0.0%) |
| Retail Trade | 200 (51.8%) | 186 (48.2%) |
| Transportation & Warehousing | 77 (74.8%) | 26 (25.2%) |
| Utilities | 61 (100.0%) | 0 (0.0%) |
| Information | 0 (0.0%) | 130 (100.0%) |
| Finance & Insurance | 84 (22.8%) | 285 (77.2%) |
| Real Estate, Rental & Leasing | 0 (0.0%) | 0 (0.0%) |
| Professional & Scientific | 264 (73.1%) | 97 (26.9%) |
| Enterprise Management | 72 (82.8%) | 15 (17.2%) |
| Administrative & Support | 41 (100.0%) | 0 (0.0%) |
| Educational Services | 115 (19.9%) | 464 (80.1%) |
| Health Care & Social Assistance | 15 (3.6%) | 397 (96.4%) |
| Arts, Entertainment & Recreation | 126 (100.0%) | 0 (0.0%) |
| Accommodation & Food Services | 90 (73.2%) | 33 (26.8%) |
| Public Administration | 187 (100.0%) | 0 (0.0%) |
| Total | 1,673 (49.4%) | 1,716 (50.6%) |
Education in Highland
School Enrollment in Highland
The most common levels of schooling among the 1,070 students in Highland are elementary school (393 | 36.7%), high school (273 | 25.5%), and college / undergraduate (107 | 10.0%).
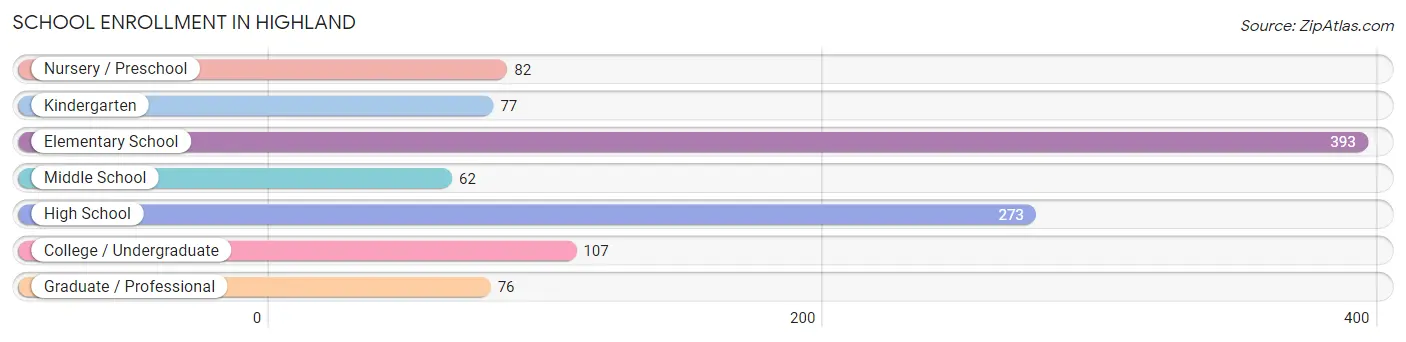
| School Level | # Students | % Students |
| Nursery / Preschool | 82 | 7.7% |
| Kindergarten | 77 | 7.2% |
| Elementary School | 393 | 36.7% |
| Middle School | 62 | 5.8% |
| High School | 273 | 25.5% |
| College / Undergraduate | 107 | 10.0% |
| Graduate / Professional | 76 | 7.1% |
| Total | 1,070 | 100.0% |
School Enrollment by Age by Funding Source in Highland
Out of a total of 1,070 students who are enrolled in schools in Highland, 247 (23.1%) attend a private institution, while the remaining 823 (76.9%) are enrolled in public schools. The age group of 35 years and over has the highest likelihood of being enrolled in private schools, with 51 (100.0% in the age bracket) enrolled. Conversely, the age group of 3 to 4 year olds has the lowest likelihood of being enrolled in a private school, with 113 (100.0% in the age bracket) attending a public institution.
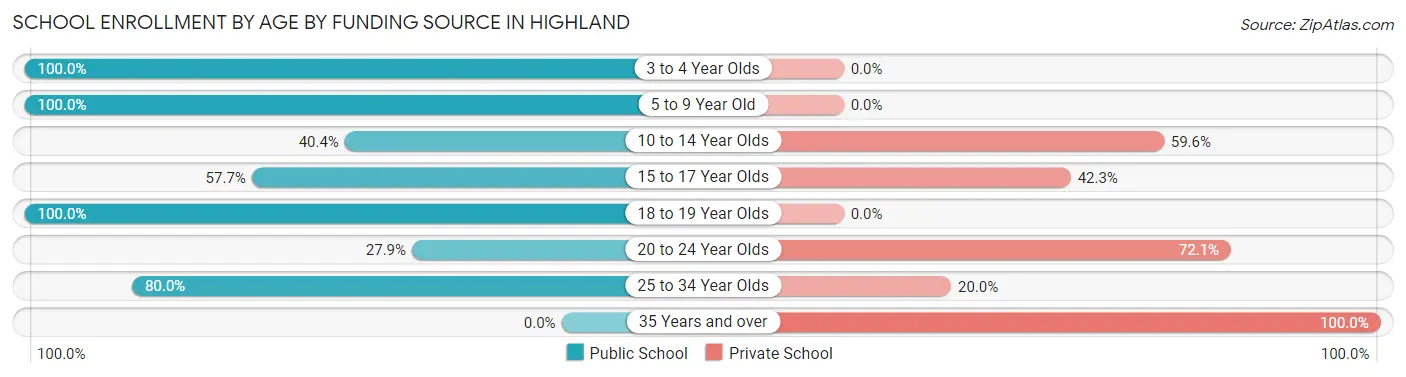
| Age Bracket | Public School | Private School |
| 3 to 4 Year Olds | 113 (100.0%) | 0 (0.0%) |
| 5 to 9 Year Old | 439 (100.0%) | 0 (0.0%) |
| 10 to 14 Year Olds | 21 (40.4%) | 31 (59.6%) |
| 15 to 17 Year Olds | 146 (57.7%) | 107 (42.3%) |
| 18 to 19 Year Olds | 31 (100.0%) | 0 (0.0%) |
| 20 to 24 Year Olds | 17 (27.9%) | 44 (72.1%) |
| 25 to 34 Year Olds | 56 (80.0%) | 14 (20.0%) |
| 35 Years and over | 0 (0.0%) | 51 (100.0%) |
| Total | 823 (76.9%) | 247 (23.1%) |
Educational Attainment by Field of Study in Highland
Business (610 | 25.1%), social sciences (267 | 11.0%), visual & performing arts (212 | 8.7%), education (193 | 7.9%), and arts & humanities (191 | 7.9%) are the most common fields of study among 2,432 individuals in Highland who have obtained a bachelor's degree or higher.
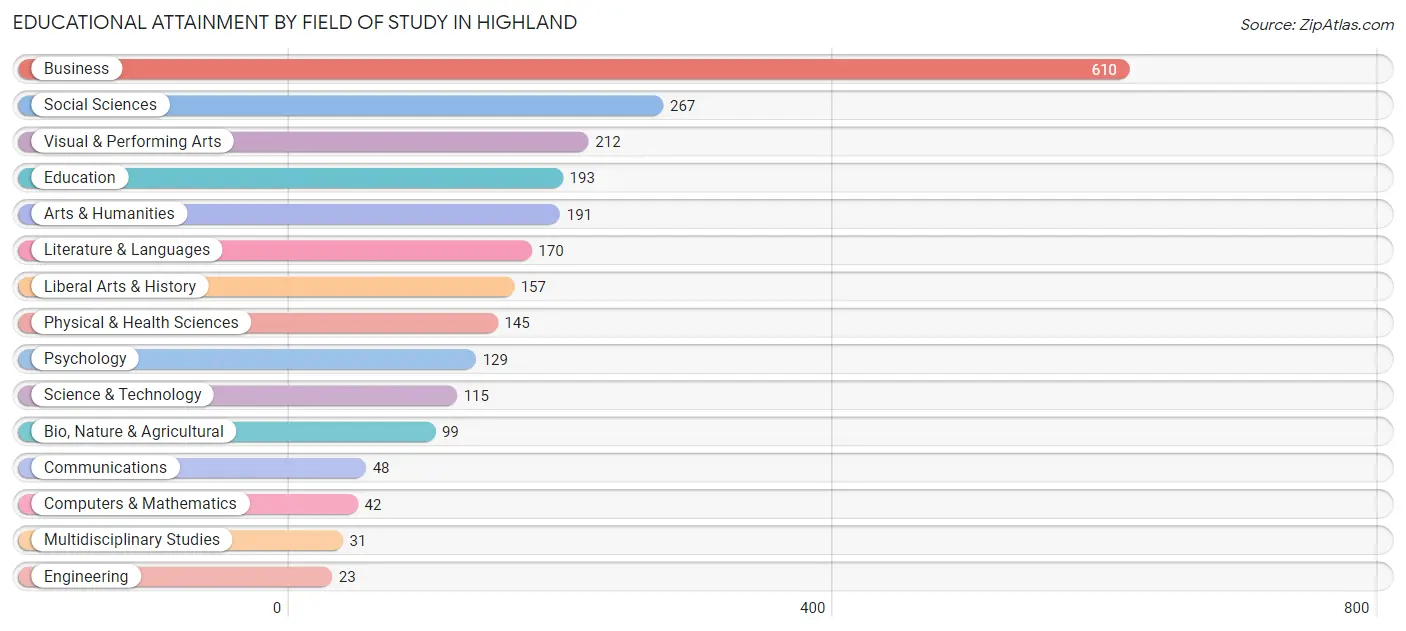
| Field of Study | # Graduates | % Graduates |
| Computers & Mathematics | 42 | 1.7% |
| Bio, Nature & Agricultural | 99 | 4.1% |
| Physical & Health Sciences | 145 | 6.0% |
| Psychology | 129 | 5.3% |
| Social Sciences | 267 | 11.0% |
| Engineering | 23 | 0.9% |
| Multidisciplinary Studies | 31 | 1.3% |
| Science & Technology | 115 | 4.7% |
| Business | 610 | 25.1% |
| Education | 193 | 7.9% |
| Literature & Languages | 170 | 7.0% |
| Liberal Arts & History | 157 | 6.5% |
| Visual & Performing Arts | 212 | 8.7% |
| Communications | 48 | 2.0% |
| Arts & Humanities | 191 | 7.9% |
| Total | 2,432 | 100.0% |
Transportation & Commute in Highland
Vehicle Availability by Sex in Highland
The most prevalent vehicle ownership categories in Highland are males with 2 vehicles (686, accounting for 42.1%) and females with 2 vehicles (657, making up 40.0%).
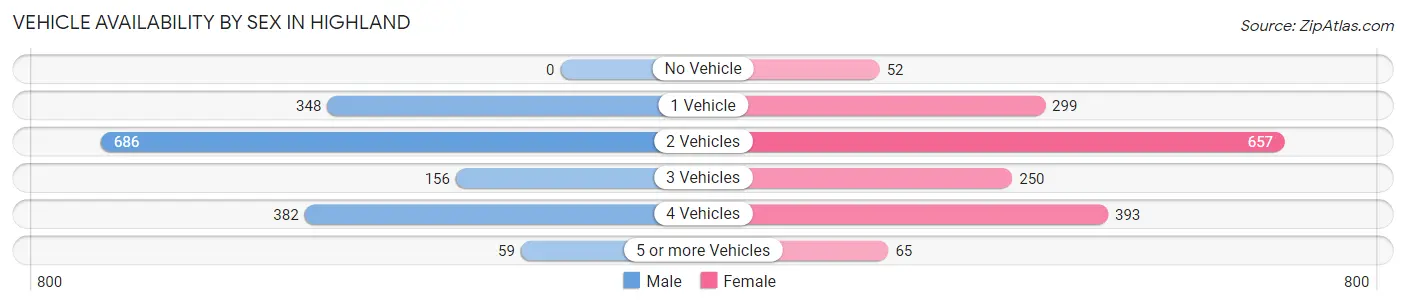
| Vehicles Available | Male | Female |
| No Vehicle | 0 (0.0%) | 52 (3.0%) |
| 1 Vehicle | 348 (21.3%) | 299 (17.4%) |
| 2 Vehicles | 686 (42.1%) | 657 (38.3%) |
| 3 Vehicles | 156 (9.6%) | 250 (14.6%) |
| 4 Vehicles | 382 (23.4%) | 393 (22.9%) |
| 5 or more Vehicles | 59 (3.6%) | 65 (3.8%) |
| Total | 1,631 (100.0%) | 1,716 (100.0%) |
Commute Time in Highland
The most frequently occuring commute durations in Highland are 10 to 14 minutes (530 commuters, 19.2%), 15 to 19 minutes (502 commuters, 18.2%), and 20 to 24 minutes (410 commuters, 14.9%).
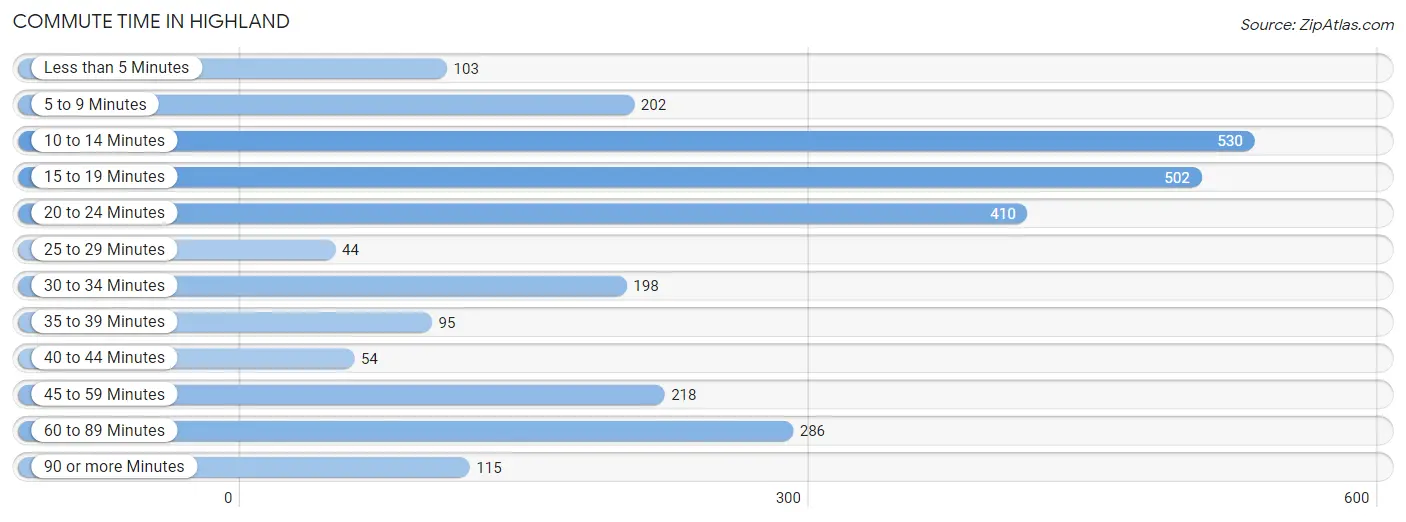
| Commute Time | # Commuters | % Commuters |
| Less than 5 Minutes | 103 | 3.7% |
| 5 to 9 Minutes | 202 | 7.3% |
| 10 to 14 Minutes | 530 | 19.2% |
| 15 to 19 Minutes | 502 | 18.2% |
| 20 to 24 Minutes | 410 | 14.9% |
| 25 to 29 Minutes | 44 | 1.6% |
| 30 to 34 Minutes | 198 | 7.2% |
| 35 to 39 Minutes | 95 | 3.5% |
| 40 to 44 Minutes | 54 | 2.0% |
| 45 to 59 Minutes | 218 | 7.9% |
| 60 to 89 Minutes | 286 | 10.4% |
| 90 or more Minutes | 115 | 4.2% |
Commute Time by Sex in Highland
The most common commute times in Highland are 10 to 14 minutes (254 commuters, 16.9%) for males and 10 to 14 minutes (276 commuters, 22.0%) for females.
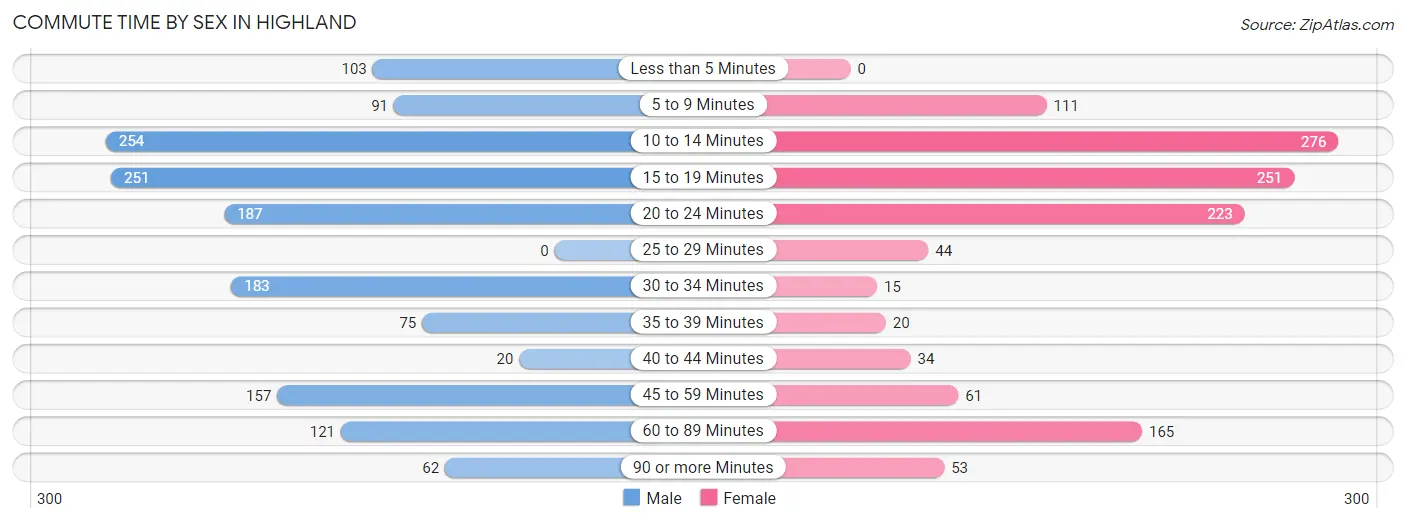
| Commute Time | Male | Female |
| Less than 5 Minutes | 103 (6.9%) | 0 (0.0%) |
| 5 to 9 Minutes | 91 (6.0%) | 111 (8.9%) |
| 10 to 14 Minutes | 254 (16.9%) | 276 (22.0%) |
| 15 to 19 Minutes | 251 (16.7%) | 251 (20.0%) |
| 20 to 24 Minutes | 187 (12.4%) | 223 (17.8%) |
| 25 to 29 Minutes | 0 (0.0%) | 44 (3.5%) |
| 30 to 34 Minutes | 183 (12.2%) | 15 (1.2%) |
| 35 to 39 Minutes | 75 (5.0%) | 20 (1.6%) |
| 40 to 44 Minutes | 20 (1.3%) | 34 (2.7%) |
| 45 to 59 Minutes | 157 (10.4%) | 61 (4.9%) |
| 60 to 89 Minutes | 121 (8.1%) | 165 (13.2%) |
| 90 or more Minutes | 62 (4.1%) | 53 (4.2%) |
Time of Departure to Work by Sex in Highland
The most frequent times of departure to work in Highland are 8:00 AM to 8:29 AM (281, 18.7%) for males and 7:30 AM to 7:59 AM (260, 20.7%) for females.
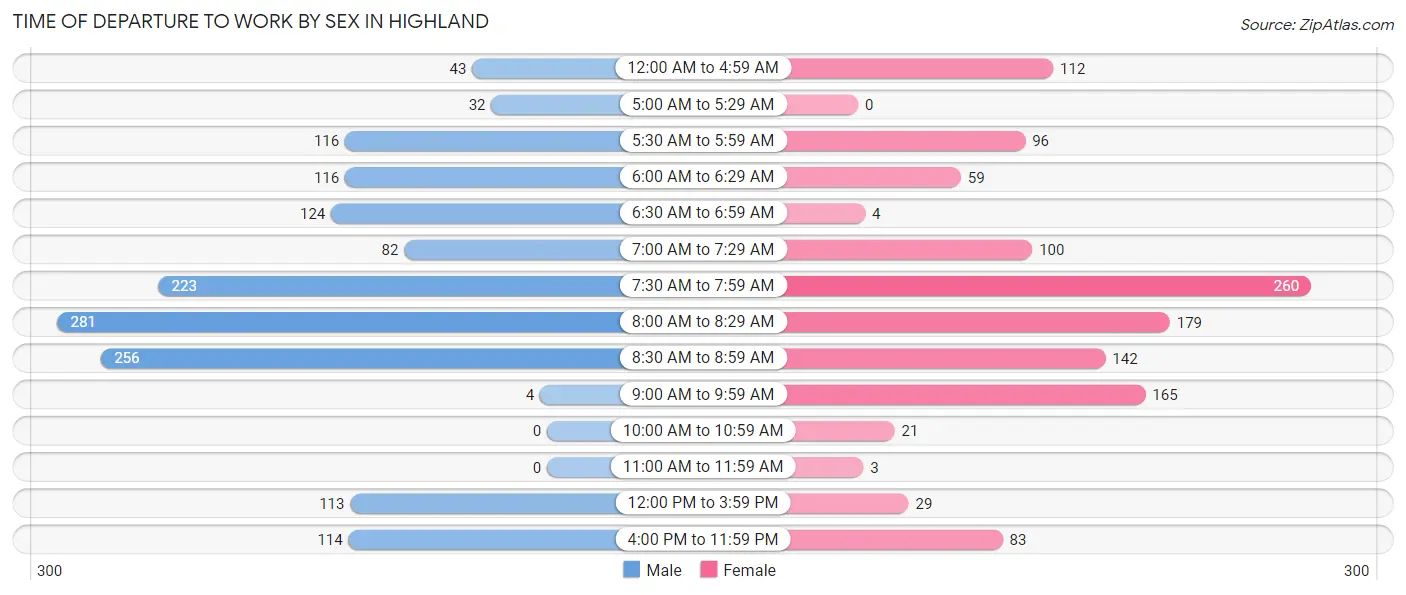
| Time of Departure | Male | Female |
| 12:00 AM to 4:59 AM | 43 (2.9%) | 112 (8.9%) |
| 5:00 AM to 5:29 AM | 32 (2.1%) | 0 (0.0%) |
| 5:30 AM to 5:59 AM | 116 (7.7%) | 96 (7.7%) |
| 6:00 AM to 6:29 AM | 116 (7.7%) | 59 (4.7%) |
| 6:30 AM to 6:59 AM | 124 (8.2%) | 4 (0.3%) |
| 7:00 AM to 7:29 AM | 82 (5.4%) | 100 (8.0%) |
| 7:30 AM to 7:59 AM | 223 (14.8%) | 260 (20.7%) |
| 8:00 AM to 8:29 AM | 281 (18.7%) | 179 (14.3%) |
| 8:30 AM to 8:59 AM | 256 (17.0%) | 142 (11.3%) |
| 9:00 AM to 9:59 AM | 4 (0.3%) | 165 (13.2%) |
| 10:00 AM to 10:59 AM | 0 (0.0%) | 21 (1.7%) |
| 11:00 AM to 11:59 AM | 0 (0.0%) | 3 (0.2%) |
| 12:00 PM to 3:59 PM | 113 (7.5%) | 29 (2.3%) |
| 4:00 PM to 11:59 PM | 114 (7.6%) | 83 (6.6%) |
| Total | 1,504 (100.0%) | 1,253 (100.0%) |
Housing Occupancy in Highland
Occupancy by Ownership in Highland
Of the total 2,516 dwellings in Highland, owner-occupied units account for 1,521 (60.5%), while renter-occupied units make up 995 (39.6%).
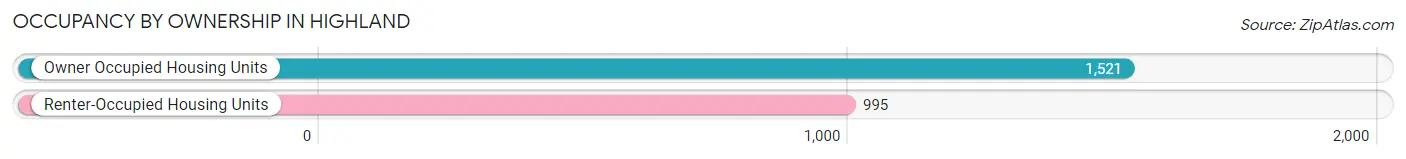
| Occupancy | # Housing Units | % Housing Units |
| Owner Occupied Housing Units | 1,521 | 60.5% |
| Renter-Occupied Housing Units | 995 | 39.6% |
| Total Occupied Housing Units | 2,516 | 100.0% |
Occupancy by Household Size in Highland
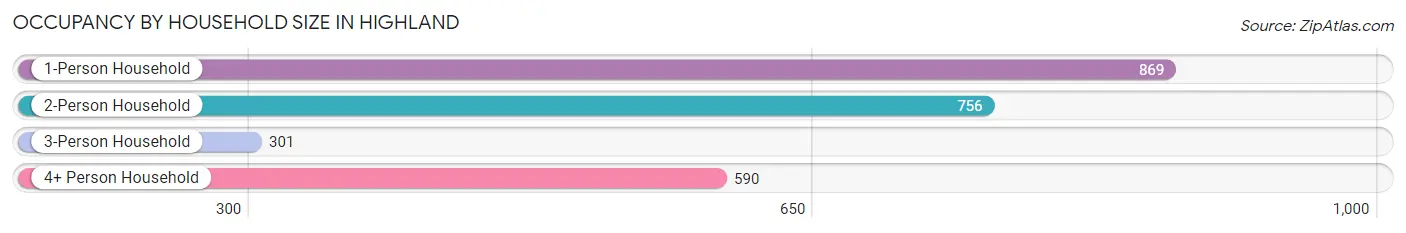
| Household Size | # Housing Units | % Housing Units |
| 1-Person Household | 869 | 34.5% |
| 2-Person Household | 756 | 30.0% |
| 3-Person Household | 301 | 12.0% |
| 4+ Person Household | 590 | 23.4% |
| Total Housing Units | 2,516 | 100.0% |
Occupancy by Ownership by Household Size in Highland
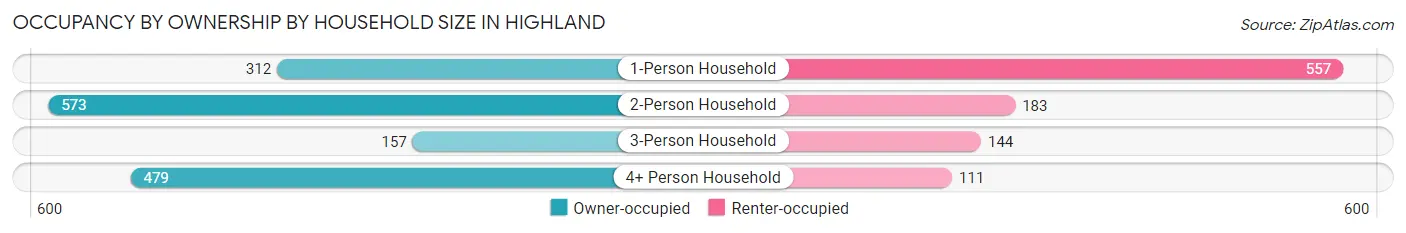
| Household Size | Owner-occupied | Renter-occupied |
| 1-Person Household | 312 (35.9%) | 557 (64.1%) |
| 2-Person Household | 573 (75.8%) | 183 (24.2%) |
| 3-Person Household | 157 (52.2%) | 144 (47.8%) |
| 4+ Person Household | 479 (81.2%) | 111 (18.8%) |
| Total Housing Units | 1,521 (60.5%) | 995 (39.6%) |
Occupancy by Educational Attainment in Highland
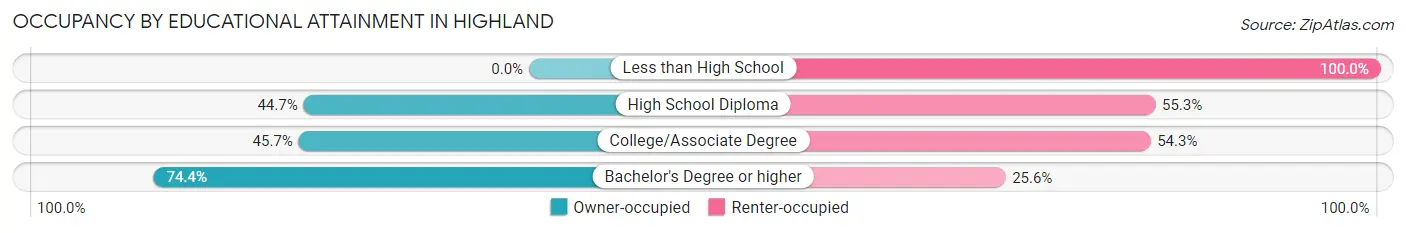
| Household Size | Owner-occupied | Renter-occupied |
| Less than High School | 0 (0.0%) | 48 (100.0%) |
| High School Diploma | 186 (44.7%) | 230 (55.3%) |
| College/Associate Degree | 305 (45.7%) | 363 (54.3%) |
| Bachelor's Degree or higher | 1,030 (74.4%) | 354 (25.6%) |
Occupancy by Age of Householder in Highland
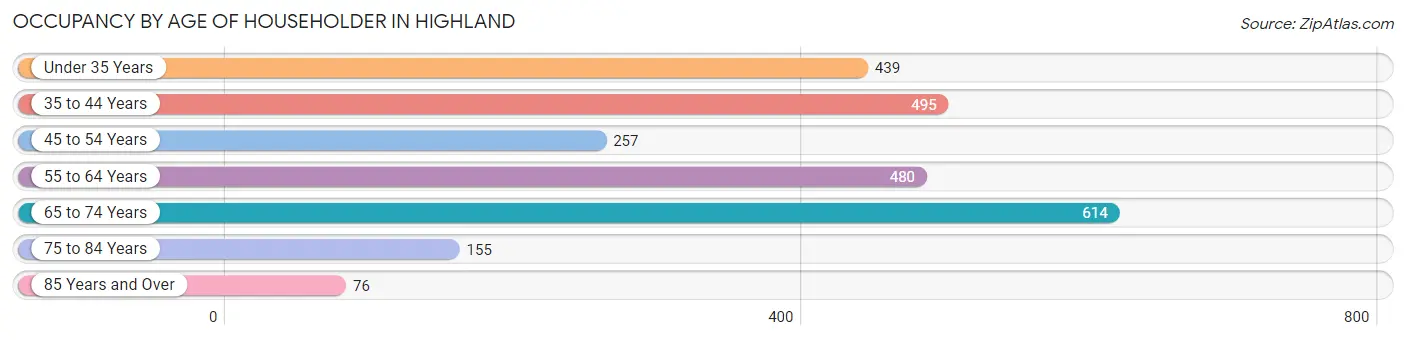
| Age Bracket | # Households | % Households |
| Under 35 Years | 439 | 17.4% |
| 35 to 44 Years | 495 | 19.7% |
| 45 to 54 Years | 257 | 10.2% |
| 55 to 64 Years | 480 | 19.1% |
| 65 to 74 Years | 614 | 24.4% |
| 75 to 84 Years | 155 | 6.2% |
| 85 Years and Over | 76 | 3.0% |
| Total | 2,516 | 100.0% |
Housing Finances in Highland
Median Income by Occupancy in Highland
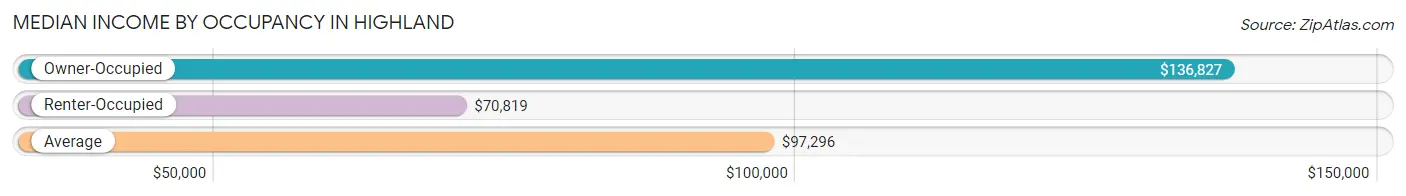
| Occupancy Type | # Households | Median Income |
| Owner-Occupied | 1,521 (60.5%) | $136,827 |
| Renter-Occupied | 995 (39.6%) | $70,819 |
| Average | 2,516 (100.0%) | $97,296 |
Occupancy by Householder Income Bracket in Highland
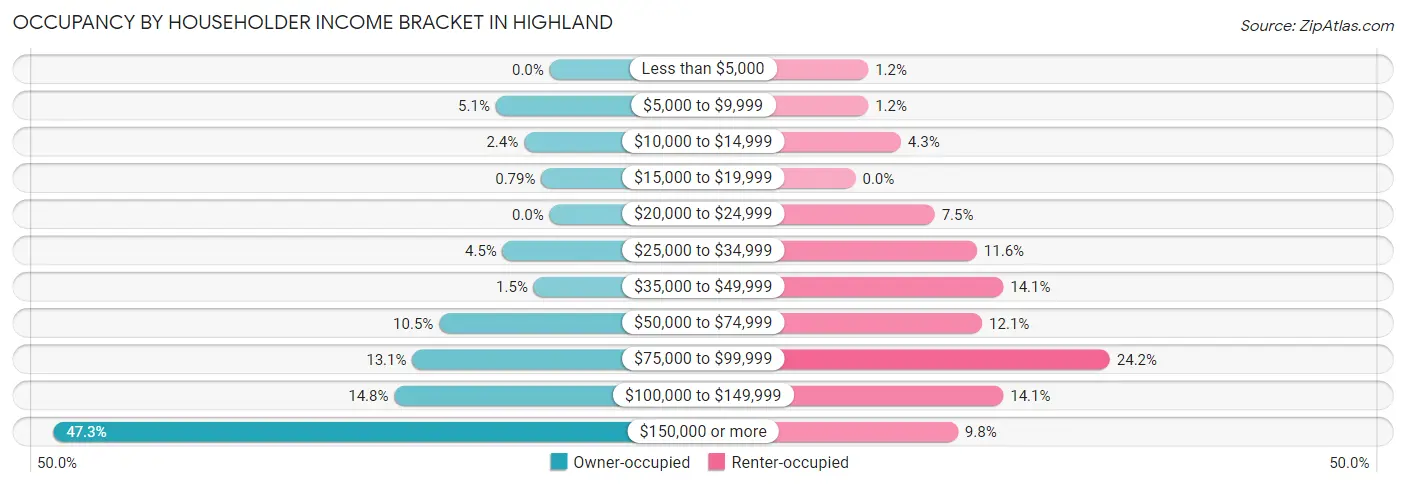
| Income Bracket | Owner-occupied | Renter-occupied |
| Less than $5,000 | 0 (0.0%) | 12 (1.2%) |
| $5,000 to $9,999 | 78 (5.1%) | 12 (1.2%) |
| $10,000 to $14,999 | 37 (2.4%) | 43 (4.3%) |
| $15,000 to $19,999 | 12 (0.8%) | 0 (0.0%) |
| $20,000 to $24,999 | 0 (0.0%) | 75 (7.5%) |
| $25,000 to $34,999 | 68 (4.5%) | 115 (11.6%) |
| $35,000 to $49,999 | 23 (1.5%) | 140 (14.1%) |
| $50,000 to $74,999 | 160 (10.5%) | 120 (12.1%) |
| $75,000 to $99,999 | 199 (13.1%) | 241 (24.2%) |
| $100,000 to $149,999 | 225 (14.8%) | 140 (14.1%) |
| $150,000 or more | 719 (47.3%) | 97 (9.8%) |
| Total | 1,521 (100.0%) | 995 (100.0%) |
Monthly Housing Cost Tiers in Highland
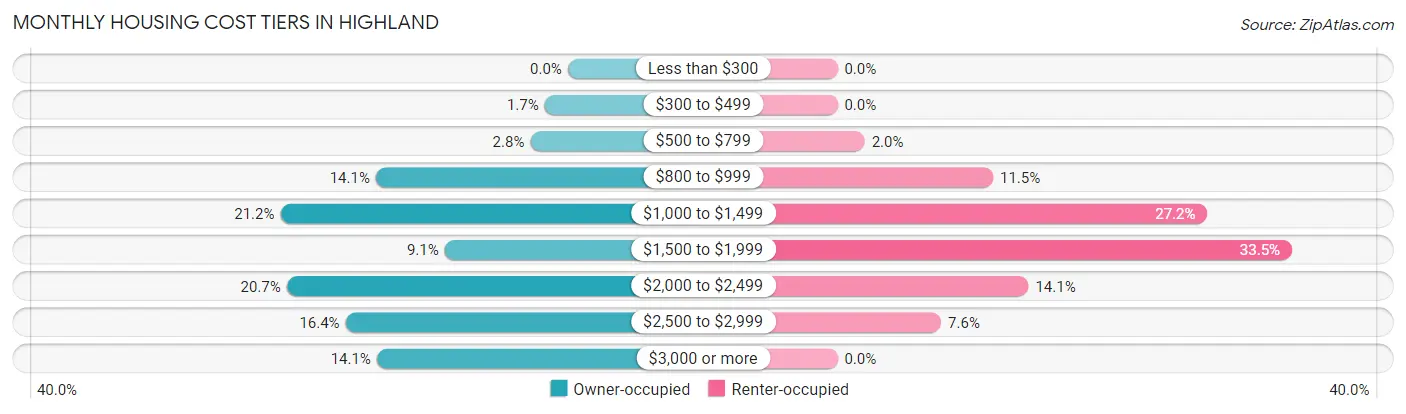
| Monthly Cost | Owner-occupied | Renter-occupied |
| Less than $300 | 0 (0.0%) | 0 (0.0%) |
| $300 to $499 | 26 (1.7%) | 0 (0.0%) |
| $500 to $799 | 42 (2.8%) | 20 (2.0%) |
| $800 to $999 | 215 (14.1%) | 114 (11.5%) |
| $1,000 to $1,499 | 322 (21.2%) | 271 (27.2%) |
| $1,500 to $1,999 | 138 (9.1%) | 333 (33.5%) |
| $2,000 to $2,499 | 315 (20.7%) | 140 (14.1%) |
| $2,500 to $2,999 | 249 (16.4%) | 76 (7.6%) |
| $3,000 or more | 214 (14.1%) | 0 (0.0%) |
| Total | 1,521 (100.0%) | 995 (100.0%) |
Physical Housing Characteristics in Highland
Housing Structures in Highland
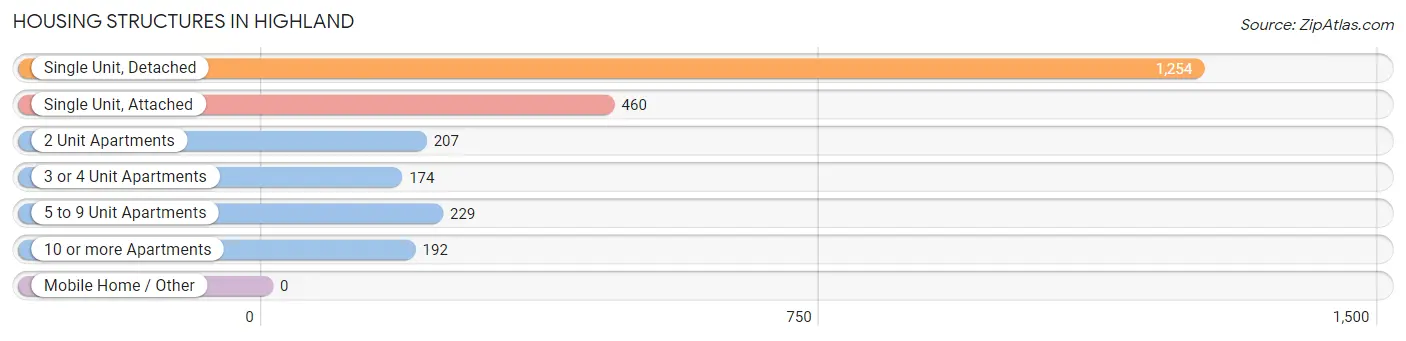
| Structure Type | # Housing Units | % Housing Units |
| Single Unit, Detached | 1,254 | 49.8% |
| Single Unit, Attached | 460 | 18.3% |
| 2 Unit Apartments | 207 | 8.2% |
| 3 or 4 Unit Apartments | 174 | 6.9% |
| 5 to 9 Unit Apartments | 229 | 9.1% |
| 10 or more Apartments | 192 | 7.6% |
| Mobile Home / Other | 0 | 0.0% |
| Total | 2,516 | 100.0% |
Housing Structures by Occupancy in Highland
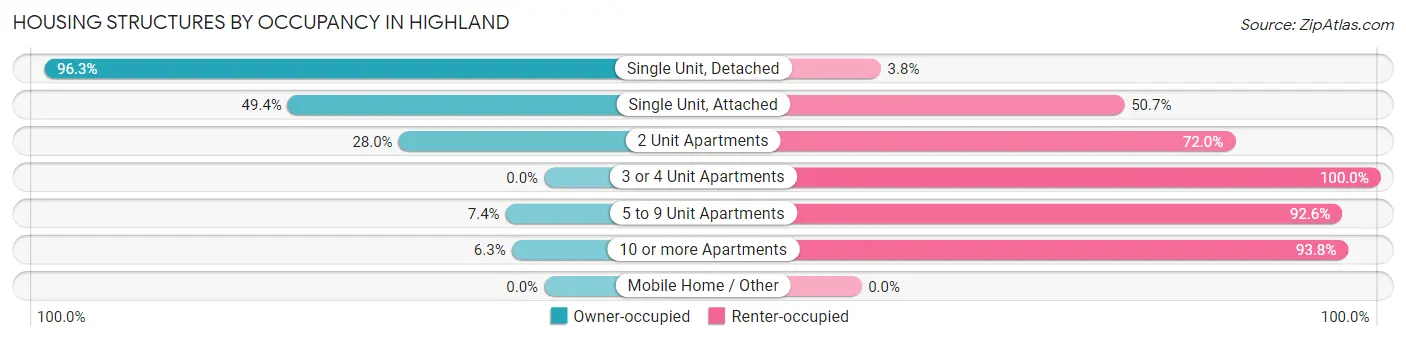
| Structure Type | Owner-occupied | Renter-occupied |
| Single Unit, Detached | 1,207 (96.3%) | 47 (3.7%) |
| Single Unit, Attached | 227 (49.3%) | 233 (50.6%) |
| 2 Unit Apartments | 58 (28.0%) | 149 (72.0%) |
| 3 or 4 Unit Apartments | 0 (0.0%) | 174 (100.0%) |
| 5 to 9 Unit Apartments | 17 (7.4%) | 212 (92.6%) |
| 10 or more Apartments | 12 (6.2%) | 180 (93.8%) |
| Mobile Home / Other | 0 (0.0%) | 0 (0.0%) |
| Total | 1,521 (60.5%) | 995 (39.6%) |
Housing Structures by Number of Rooms in Highland
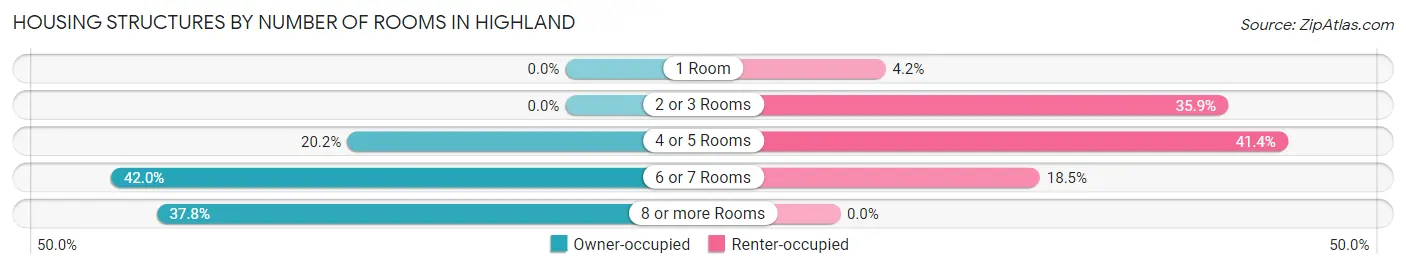
| Number of Rooms | Owner-occupied | Renter-occupied |
| 1 Room | 0 (0.0%) | 42 (4.2%) |
| 2 or 3 Rooms | 0 (0.0%) | 357 (35.9%) |
| 4 or 5 Rooms | 307 (20.2%) | 412 (41.4%) |
| 6 or 7 Rooms | 639 (42.0%) | 184 (18.5%) |
| 8 or more Rooms | 575 (37.8%) | 0 (0.0%) |
| Total | 1,521 (100.0%) | 995 (100.0%) |
Housing Structure by Heating Type in Highland
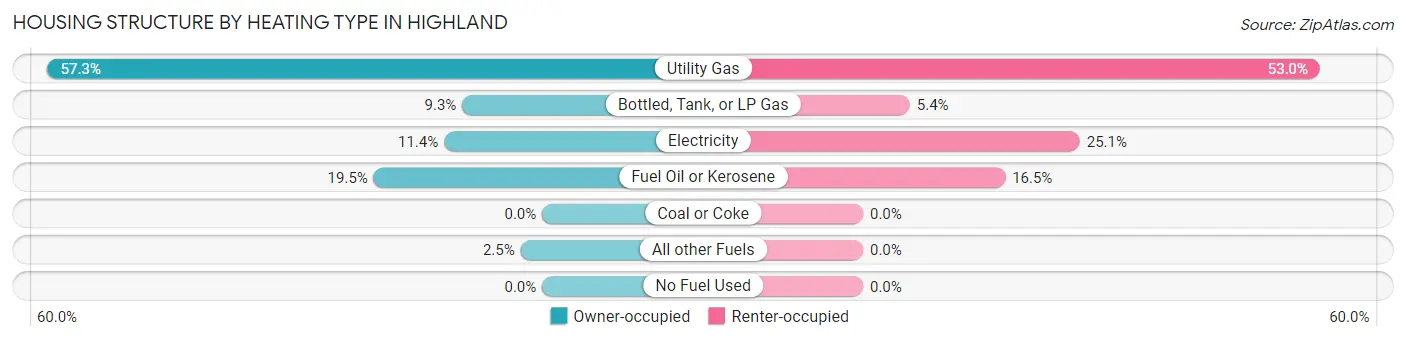
| Heating Type | Owner-occupied | Renter-occupied |
| Utility Gas | 872 (57.3%) | 527 (53.0%) |
| Bottled, Tank, or LP Gas | 141 (9.3%) | 54 (5.4%) |
| Electricity | 173 (11.4%) | 250 (25.1%) |
| Fuel Oil or Kerosene | 297 (19.5%) | 164 (16.5%) |
| Coal or Coke | 0 (0.0%) | 0 (0.0%) |
| All other Fuels | 38 (2.5%) | 0 (0.0%) |
| No Fuel Used | 0 (0.0%) | 0 (0.0%) |
| Total | 1,521 (100.0%) | 995 (100.0%) |
Household Vehicle Usage in Highland
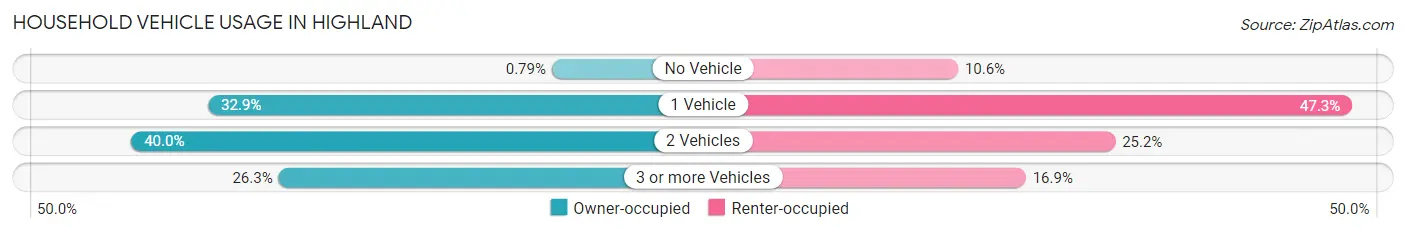
| Vehicles per Household | Owner-occupied | Renter-occupied |
| No Vehicle | 12 (0.8%) | 105 (10.5%) |
| 1 Vehicle | 500 (32.9%) | 471 (47.3%) |
| 2 Vehicles | 609 (40.0%) | 251 (25.2%) |
| 3 or more Vehicles | 400 (26.3%) | 168 (16.9%) |
| Total | 1,521 (100.0%) | 995 (100.0%) |
Real Estate & Mortgages in Highland
Real Estate and Mortgage Overview in Highland
| Characteristic | Without Mortgage | With Mortgage |
| Housing Units | 602 | 919 |
| Median Property Value | $296,800 | $359,800 |
| Median Household Income | $78,846 | $546 |
| Monthly Housing Costs | $1,037 | $214 |
| Real Estate Taxes | $7,151 | $0 |
Property Value by Mortgage Status in Highland
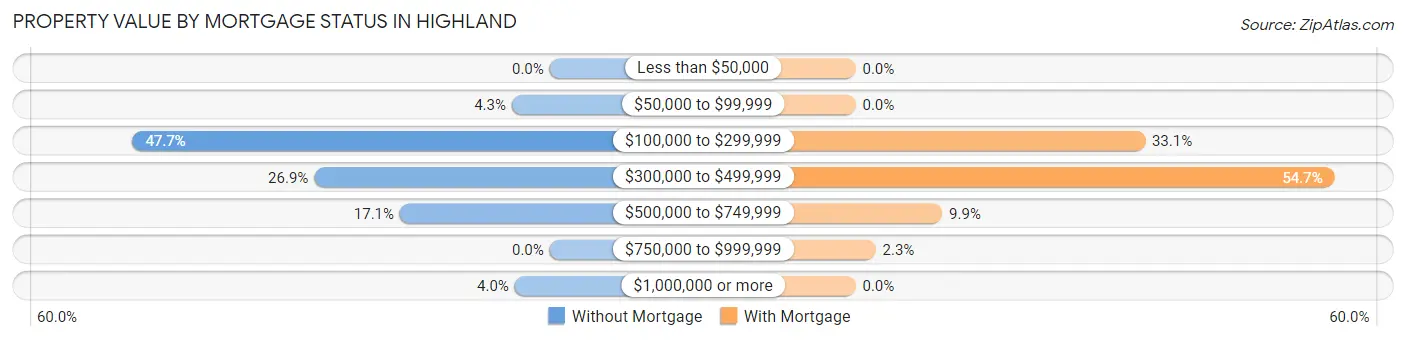
| Property Value | Without Mortgage | With Mortgage |
| Less than $50,000 | 0 (0.0%) | 0 (0.0%) |
| $50,000 to $99,999 | 26 (4.3%) | 0 (0.0%) |
| $100,000 to $299,999 | 287 (47.7%) | 304 (33.1%) |
| $300,000 to $499,999 | 162 (26.9%) | 503 (54.7%) |
| $500,000 to $749,999 | 103 (17.1%) | 91 (9.9%) |
| $750,000 to $999,999 | 0 (0.0%) | 21 (2.3%) |
| $1,000,000 or more | 24 (4.0%) | 0 (0.0%) |
| Total | 602 (100.0%) | 919 (100.0%) |
Household Income by Mortgage Status in Highland
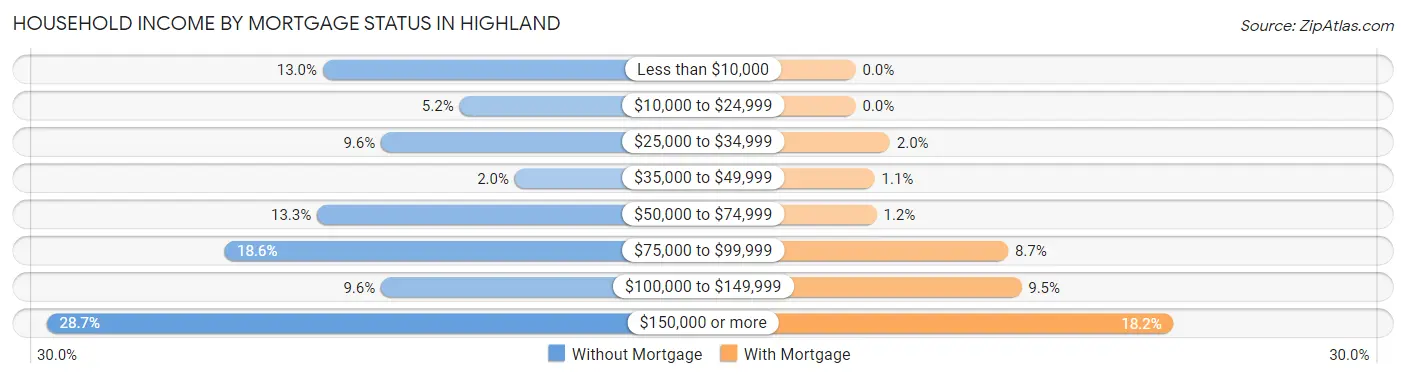
| Household Income | Without Mortgage | With Mortgage |
| Less than $10,000 | 78 (13.0%) | 0 (0.0%) |
| $10,000 to $24,999 | 31 (5.1%) | 0 (0.0%) |
| $25,000 to $34,999 | 58 (9.6%) | 18 (2.0%) |
| $35,000 to $49,999 | 12 (2.0%) | 10 (1.1%) |
| $50,000 to $74,999 | 80 (13.3%) | 11 (1.2%) |
| $75,000 to $99,999 | 112 (18.6%) | 80 (8.7%) |
| $100,000 to $149,999 | 58 (9.6%) | 87 (9.5%) |
| $150,000 or more | 173 (28.7%) | 167 (18.2%) |
| Total | 602 (100.0%) | 919 (100.0%) |
Property Value to Household Income Ratio in Highland
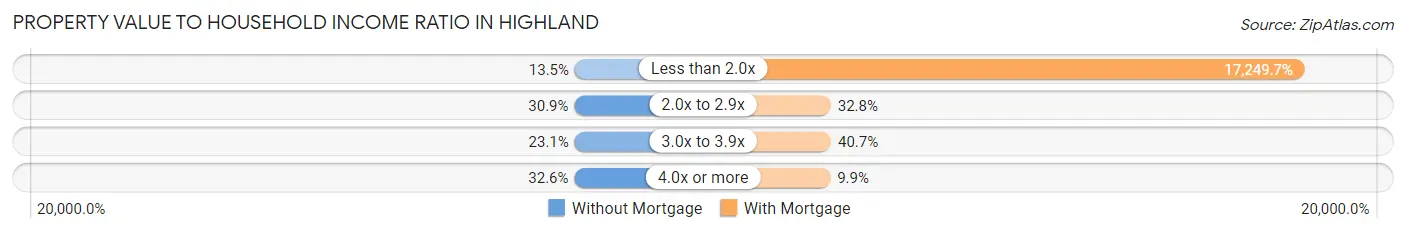
| Value-to-Income Ratio | Without Mortgage | With Mortgage |
| Less than 2.0x | 81 (13.5%) | 158,525 (17,249.7%) |
| 2.0x to 2.9x | 186 (30.9%) | 301 (32.8%) |
| 3.0x to 3.9x | 139 (23.1%) | 374 (40.7%) |
| 4.0x or more | 196 (32.6%) | 91 (9.9%) |
| Total | 602 (100.0%) | 919 (100.0%) |
Real Estate Taxes by Mortgage Status in Highland
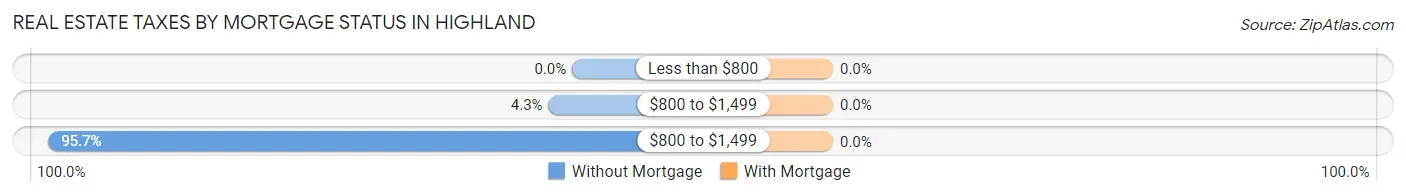
| Property Taxes | Without Mortgage | With Mortgage |
| Less than $800 | 0 (0.0%) | 0 (0.0%) |
| $800 to $1,499 | 26 (4.3%) | 0 (0.0%) |
| $800 to $1,499 | 576 (95.7%) | 0 (0.0%) |
| Total | 602 (100.0%) | 919 (100.0%) |
Health & Disability in Highland
Health Insurance Coverage by Age in Highland
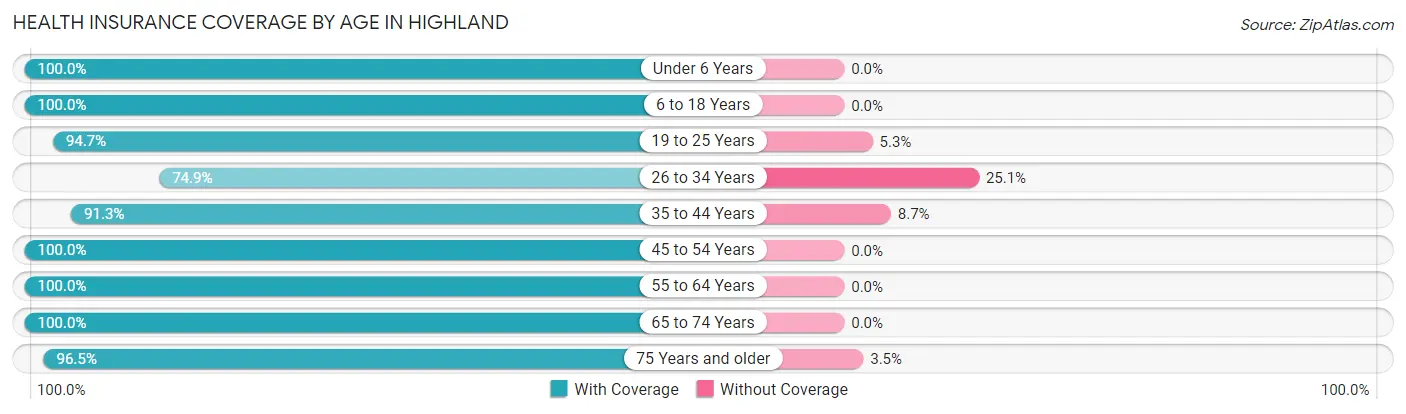
| Age Bracket | With Coverage | Without Coverage |
| Under 6 Years | 671 (100.0%) | 0 (0.0%) |
| 6 to 18 Years | 635 (100.0%) | 0 (0.0%) |
| 19 to 25 Years | 664 (94.7%) | 37 (5.3%) |
| 26 to 34 Years | 498 (74.9%) | 167 (25.1%) |
| 35 to 44 Years | 800 (91.3%) | 76 (8.7%) |
| 45 to 54 Years | 741 (100.0%) | 0 (0.0%) |
| 55 to 64 Years | 769 (100.0%) | 0 (0.0%) |
| 65 to 74 Years | 843 (100.0%) | 0 (0.0%) |
| 75 Years and older | 327 (96.5%) | 12 (3.5%) |
| Total | 5,948 (95.3%) | 292 (4.7%) |
Health Insurance Coverage by Citizenship Status in Highland
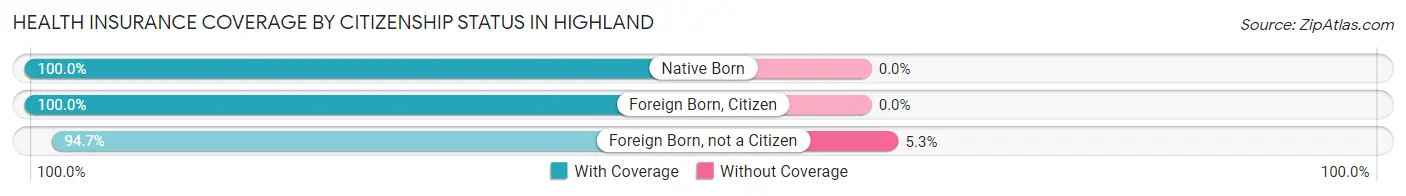
| Citizenship Status | With Coverage | Without Coverage |
| Native Born | 671 (100.0%) | 0 (0.0%) |
| Foreign Born, Citizen | 635 (100.0%) | 0 (0.0%) |
| Foreign Born, not a Citizen | 664 (94.7%) | 37 (5.3%) |
Health Insurance Coverage by Household Income in Highland
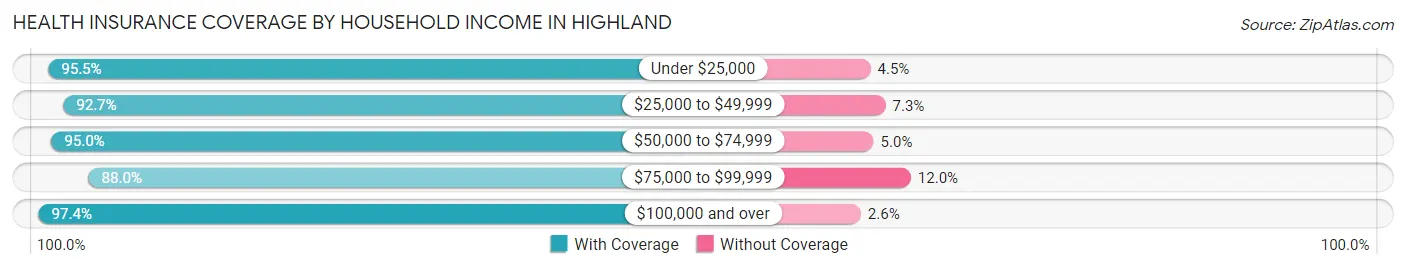
| Household Income | With Coverage | Without Coverage |
| Under $25,000 | 257 (95.5%) | 12 (4.5%) |
| $25,000 to $49,999 | 472 (92.7%) | 37 (7.3%) |
| $50,000 to $74,999 | 566 (95.0%) | 30 (5.0%) |
| $75,000 to $99,999 | 806 (88.0%) | 110 (12.0%) |
| $100,000 and over | 3,803 (97.4%) | 103 (2.6%) |
Public vs Private Health Insurance Coverage by Age in Highland
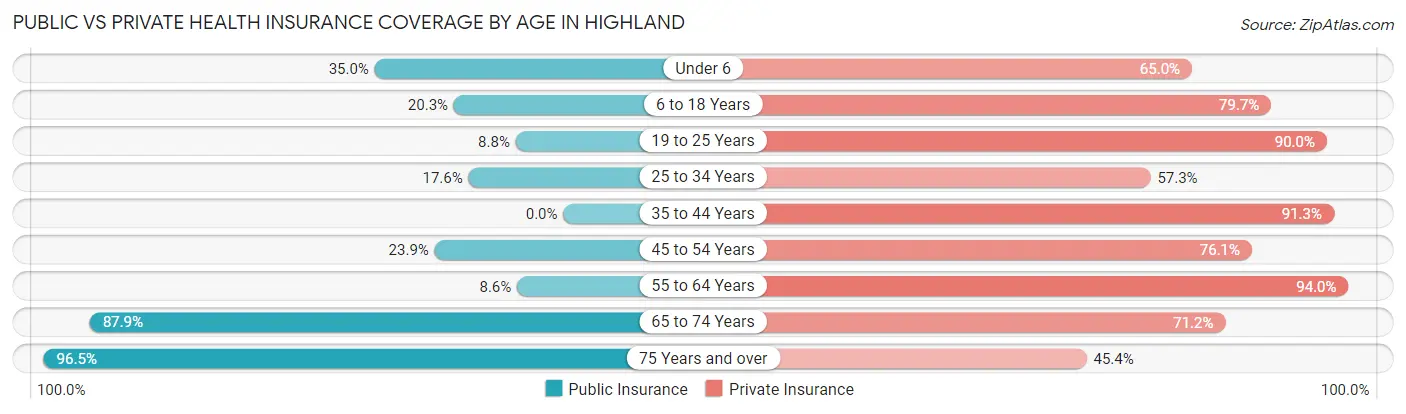
| Age Bracket | Public Insurance | Private Insurance |
| Under 6 | 235 (35.0%) | 436 (65.0%) |
| 6 to 18 Years | 129 (20.3%) | 506 (79.7%) |
| 19 to 25 Years | 62 (8.8%) | 631 (90.0%) |
| 25 to 34 Years | 117 (17.6%) | 381 (57.3%) |
| 35 to 44 Years | 0 (0.0%) | 800 (91.3%) |
| 45 to 54 Years | 177 (23.9%) | 564 (76.1%) |
| 55 to 64 Years | 66 (8.6%) | 723 (94.0%) |
| 65 to 74 Years | 741 (87.9%) | 600 (71.2%) |
| 75 Years and over | 327 (96.5%) | 154 (45.4%) |
| Total | 1,854 (29.7%) | 4,795 (76.8%) |
Disability Status by Sex by Age in Highland
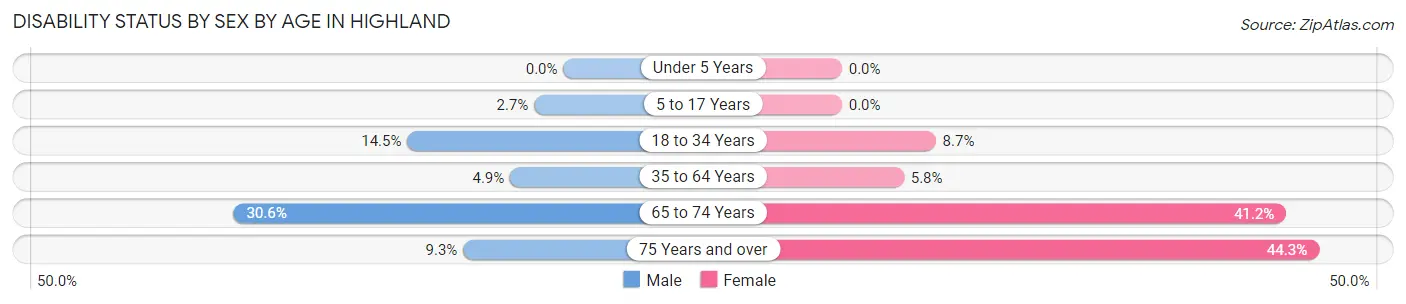
| Age Bracket | Male | Female |
| Under 5 Years | 0 (0.0%) | 0 (0.0%) |
| 5 to 17 Years | 7 (2.7%) | 0 (0.0%) |
| 18 to 34 Years | 106 (14.5%) | 61 (8.7%) |
| 35 to 64 Years | 56 (4.9%) | 72 (5.8%) |
| 65 to 74 Years | 120 (30.6%) | 186 (41.2%) |
| 75 Years and over | 12 (9.3%) | 93 (44.3%) |
Disability Class by Sex by Age in Highland
Disability Class: Hearing Difficulty
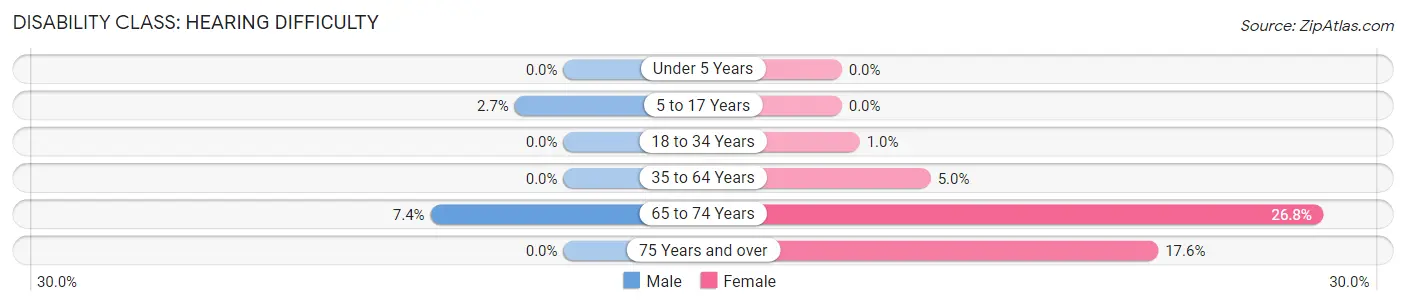
| Age Bracket | Male | Female |
| Under 5 Years | 0 (0.0%) | 0 (0.0%) |
| 5 to 17 Years | 7 (2.7%) | 0 (0.0%) |
| 18 to 34 Years | 0 (0.0%) | 7 (1.0%) |
| 35 to 64 Years | 0 (0.0%) | 62 (5.0%) |
| 65 to 74 Years | 29 (7.4%) | 121 (26.8%) |
| 75 Years and over | 0 (0.0%) | 37 (17.6%) |
Disability Class: Vision Difficulty
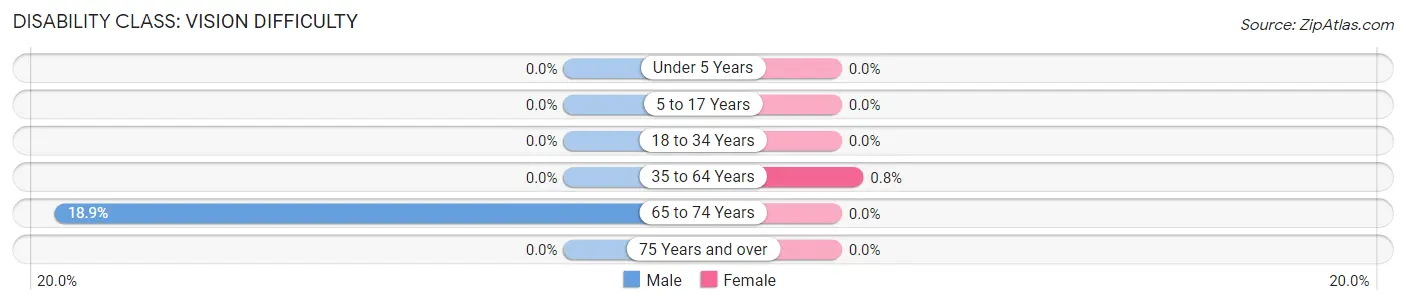
| Age Bracket | Male | Female |
| Under 5 Years | 0 (0.0%) | 0 (0.0%) |
| 5 to 17 Years | 0 (0.0%) | 0 (0.0%) |
| 18 to 34 Years | 0 (0.0%) | 0 (0.0%) |
| 35 to 64 Years | 0 (0.0%) | 10 (0.8%) |
| 65 to 74 Years | 74 (18.9%) | 0 (0.0%) |
| 75 Years and over | 0 (0.0%) | 0 (0.0%) |
Disability Class: Cognitive Difficulty
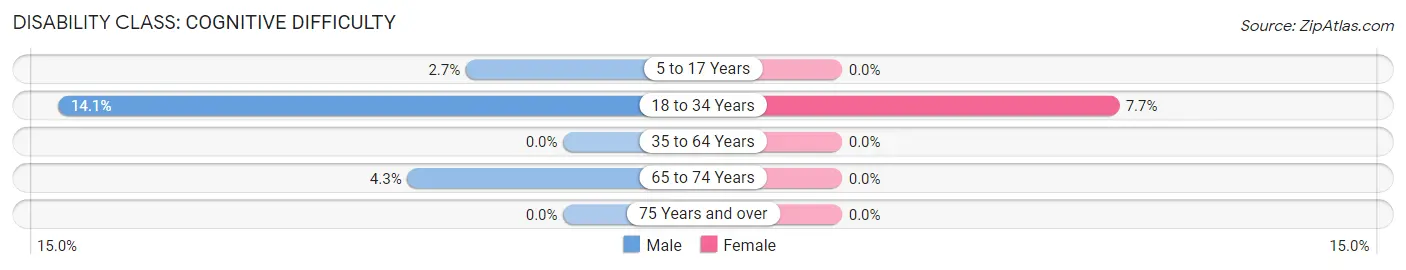
| Age Bracket | Male | Female |
| 5 to 17 Years | 7 (2.7%) | 0 (0.0%) |
| 18 to 34 Years | 103 (14.1%) | 54 (7.7%) |
| 35 to 64 Years | 0 (0.0%) | 0 (0.0%) |
| 65 to 74 Years | 17 (4.3%) | 0 (0.0%) |
| 75 Years and over | 0 (0.0%) | 0 (0.0%) |
Disability Class: Ambulatory Difficulty
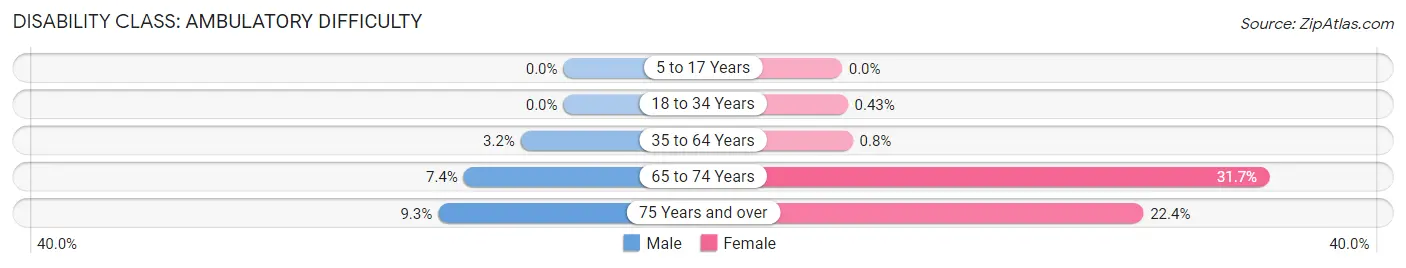
| Age Bracket | Male | Female |
| 5 to 17 Years | 0 (0.0%) | 0 (0.0%) |
| 18 to 34 Years | 0 (0.0%) | 3 (0.4%) |
| 35 to 64 Years | 36 (3.2%) | 10 (0.8%) |
| 65 to 74 Years | 29 (7.4%) | 143 (31.7%) |
| 75 Years and over | 12 (9.3%) | 47 (22.4%) |
Disability Class: Self-Care Difficulty
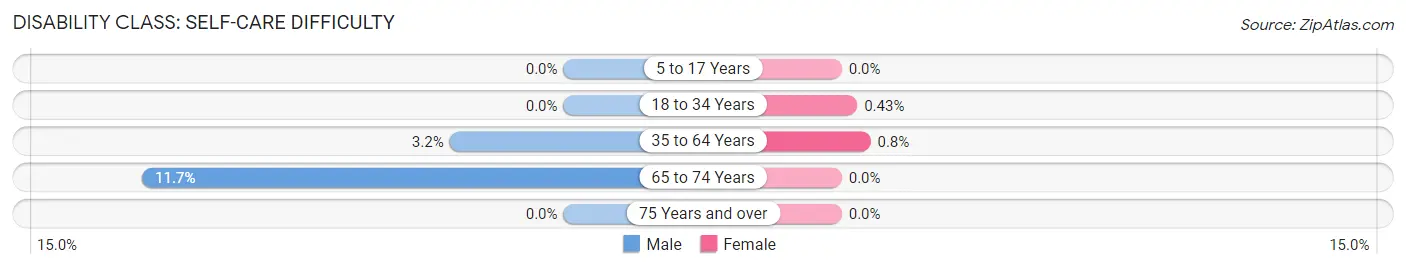
| Age Bracket | Male | Female |
| 5 to 17 Years | 0 (0.0%) | 0 (0.0%) |
| 18 to 34 Years | 0 (0.0%) | 3 (0.4%) |
| 35 to 64 Years | 36 (3.2%) | 10 (0.8%) |
| 65 to 74 Years | 46 (11.7%) | 0 (0.0%) |
| 75 Years and over | 0 (0.0%) | 0 (0.0%) |
Technology Access in Highland
Computing Device Access in Highland
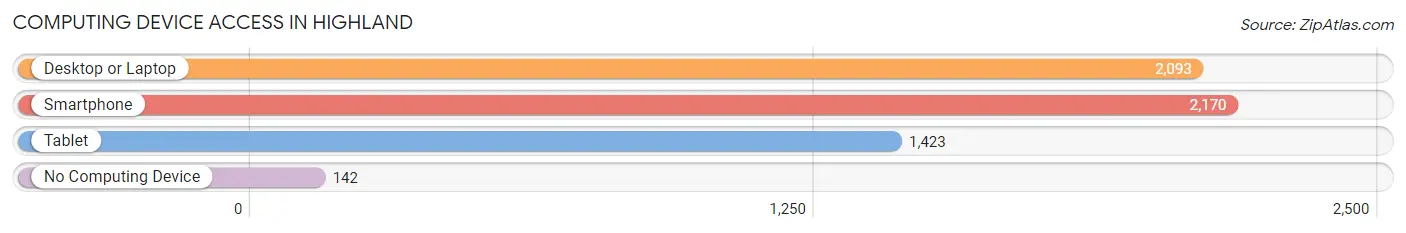
| Device Type | # Households | % Households |
| Desktop or Laptop | 2,093 | 83.2% |
| Smartphone | 2,170 | 86.3% |
| Tablet | 1,423 | 56.6% |
| No Computing Device | 142 | 5.6% |
| Total | 2,516 | 100.0% |
Internet Access in Highland
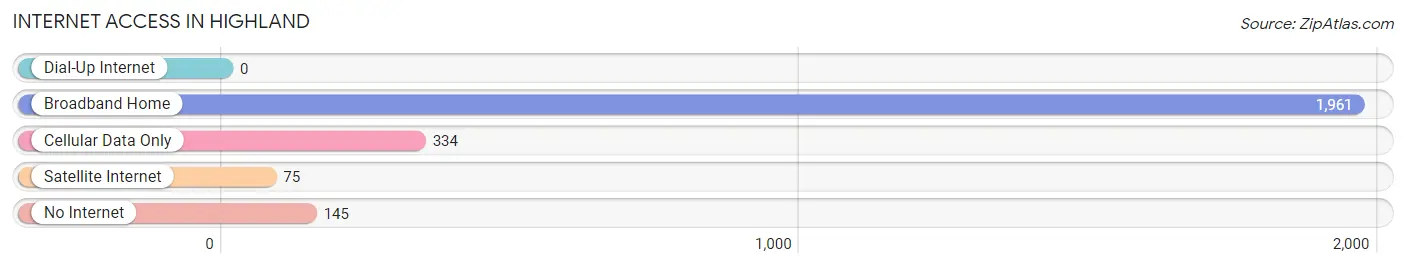
| Internet Type | # Households | % Households |
| Dial-Up Internet | 0 | 0.0% |
| Broadband Home | 1,961 | 77.9% |
| Cellular Data Only | 334 | 13.3% |
| Satellite Internet | 75 | 3.0% |
| No Internet | 145 | 5.8% |
| Total | 2,516 | 100.0% |
Highland Summary
Highland is a town located in Ulster County, New York, United States. It is part of the Hudson Valley region and is situated in the Catskill Mountains. The town is located in the northwest corner of the county, bordered by the towns of Lloyd, Marlborough, and Plattekill. As of the 2010 census, the town had a population of 11,780.
History
The area that is now Highland was originally inhabited by the Esopus tribe of the Lenape Native Americans. The first European settlers arrived in the area in the late 17th century, and the town was officially established in 1788. The town was named after the high elevation of the land, which was a result of the Catskill Mountains.
The town was an agricultural community for much of its history, with dairy farming being the primary industry. In the late 19th century, the town began to develop as a resort destination, with many hotels and resorts being built in the area. The town also became a popular destination for artists and writers, who were drawn to the area's natural beauty.
Geography
Highland is located in the northwest corner of Ulster County, bordered by the towns of Lloyd, Marlborough, and Plattekill. The town is situated in the Catskill Mountains, with an elevation ranging from 1,000 to 2,000 feet. The town is home to several lakes, including Lake Minnewaska, Lake Awosting, and Lake Mohonk.
The town is home to several state parks, including Minnewaska State Park, Mohonk Preserve, and Sam's Point Preserve. The town is also home to the Shawangunk Ridge, a ridge of mountains that stretches from the Hudson River to the Delaware River.
Economy
Highland's economy is largely based on tourism and recreation. The town is home to several resorts and hotels, as well as numerous restaurants and shops. The town is also home to several wineries and breweries, which attract visitors from all over the region.
The town is also home to several manufacturing companies, including a paper mill and a plastics factory. The town is also home to several farms, which produce dairy products, fruits, and vegetables.
Demographics
As of the 2010 census, the town had a population of 11,780. The racial makeup of the town was 94.3% White, 2.2% African American, 0.5% Native American, 0.7% Asian, 0.1% Pacific Islander, and 1.2% from other races. Hispanic or Latino of any race were 4.2% of the population.
The median household income in the town was $50,945, and the median family income was $60,945. The per capita income in the town was $25,945. About 8.3% of the population was below the poverty line.
Common Questions
What is Per Capita Income in Highland?
Per Capita income in Highland is $45,924.
What is the Median Family Income in Highland?
Median Family Income in Highland is $122,434.
What is the Median Household income in Highland?
Median Household Income in Highland is $97,296.
What is Income or Wage Gap in Highland?
Income or Wage Gap in Highland is 0.5%.
Women in Highland earn 99.5 cents for every dollar earned by a man.
What is Inequality or Gini Index in Highland?
Inequality or Gini Index in Highland is 0.39.
What is the Total Population of Highland?
Total Population of Highland is 6,545.
What is the Total Male Population of Highland?
Total Male Population of Highland is 2,823.
What is the Total Female Population of Highland?
Total Female Population of Highland is 3,722.
What is the Ratio of Males per 100 Females in Highland?
There are 75.85 Males per 100 Females in Highland.
What is the Ratio of Females per 100 Males in Highland?
There are 131.85 Females per 100 Males in Highland.
What is the Median Population Age in Highland?
Median Population Age in Highland is 40.1 Years.
What is the Average Family Size in Highland
Average Family Size in Highland is 3.2 People.
What is the Average Household Size in Highland
Average Household Size in Highland is 2.5 People.
How Large is the Labor Force in Highland?
There are 3,541 People in the Labor Forcein in Highland.
What is the Percentage of People in the Labor Force in Highland?
65.7% of People are in the Labor Force in Highland.
What is the Unemployment Rate in Highland?
Unemployment Rate in Highland is 4.2%.