Northville, NY Map & Demographics
Northville Map
Northville Overview
$55,936
PER CAPITA INCOME
$116,786
AVG FAMILY INCOME
$114,635
AVG HOUSEHOLD INCOME
13.4%
WAGE / INCOME GAP [ % ]
86.6¢/ $1
WAGE / INCOME GAP [ $ ]
0.42
INEQUALITY / GINI INDEX
1,829
TOTAL POPULATION
1,058
MALE POPULATION
771
FEMALE POPULATION
137.22
MALES / 100 FEMALES
72.87
FEMALES / 100 MALES
57.8
MEDIAN AGE
2.9
AVG FAMILY SIZE
2.8
AVG HOUSEHOLD SIZE
766
LABOR FORCE [ PEOPLE ]
46.1%
PERCENT IN LABOR FORCE
Northville Zip Codes
Northville Area Codes
Income in Northville
Income Overview in Northville
Per Capita Income in Northville is $55,936, while median incomes of families and households are $116,786 and $114,635 respectively.
| Characteristic | Number | Measure |
| Per Capita Income | 1,829 | $55,936 |
| Median Family Income | 578 | $116,786 |
| Mean Family Income | 578 | $155,648 |
| Median Household Income | 633 | $114,635 |
| Mean Household Income | 633 | $161,383 |
| Income Deficit | 578 | $0 |
| Wage / Income Gap (%) | 1,829 | 13.42% |
| Wage / Income Gap ($) | 1,829 | 86.58¢ per $1 |
| Gini / Inequality Index | 1,829 | 0.42 |
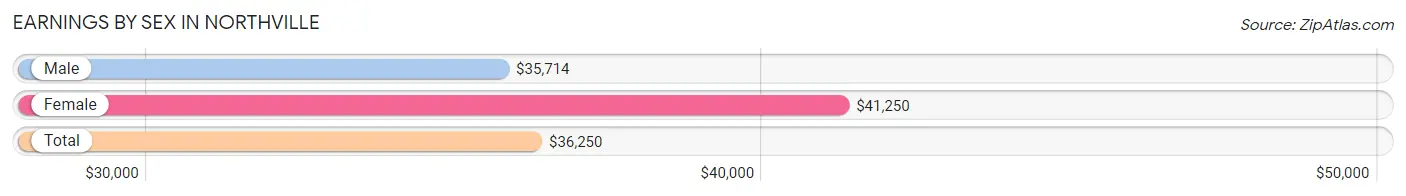
Earnings by Sex in Northville
Average Earnings in Northville are $36,250, $35,714 for men and $41,250 for women, a difference of 13.4%.
| Sex | Number | Average Earnings |
| Male | 583 (73.1%) | $35,714 |
| Female | 215 (26.9%) | $41,250 |
| Total | 798 (100.0%) | $36,250 |
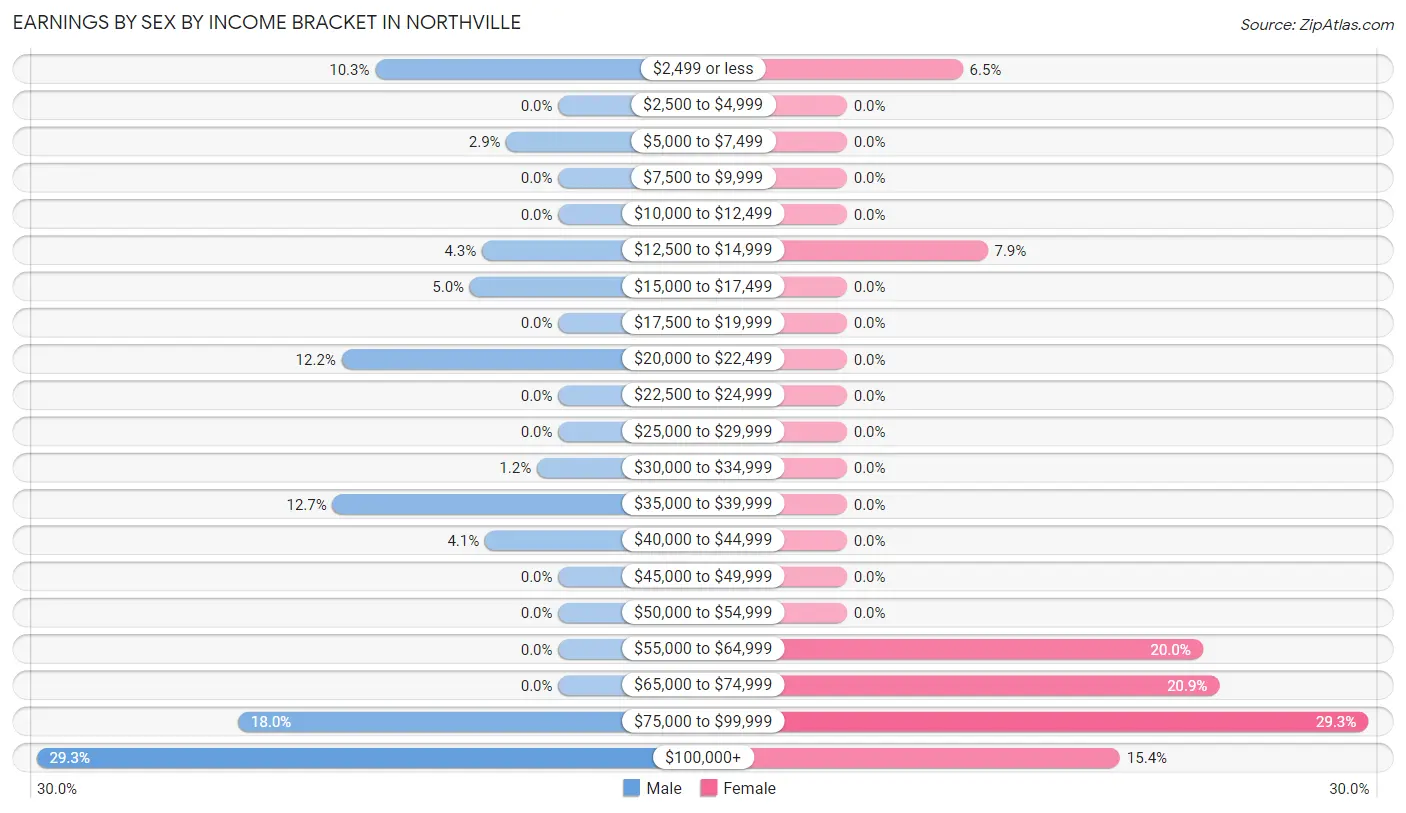
Earnings by Sex by Income Bracket in Northville
The most common earnings brackets in Northville are $100,000+ for men (171 | 29.3%) and $75,000 to $99,999 for women (63 | 29.3%).
| Income | Male | Female |
| $2,499 or less | 60 (10.3%) | 14 (6.5%) |
| $2,500 to $4,999 | 0 (0.0%) | 0 (0.0%) |
| $5,000 to $7,499 | 17 (2.9%) | 0 (0.0%) |
| $7,500 to $9,999 | 0 (0.0%) | 0 (0.0%) |
| $10,000 to $12,499 | 0 (0.0%) | 0 (0.0%) |
| $12,500 to $14,999 | 25 (4.3%) | 17 (7.9%) |
| $15,000 to $17,499 | 29 (5.0%) | 0 (0.0%) |
| $17,500 to $19,999 | 0 (0.0%) | 0 (0.0%) |
| $20,000 to $22,499 | 71 (12.2%) | 0 (0.0%) |
| $22,500 to $24,999 | 0 (0.0%) | 0 (0.0%) |
| $25,000 to $29,999 | 0 (0.0%) | 0 (0.0%) |
| $30,000 to $34,999 | 7 (1.2%) | 0 (0.0%) |
| $35,000 to $39,999 | 74 (12.7%) | 0 (0.0%) |
| $40,000 to $44,999 | 24 (4.1%) | 0 (0.0%) |
| $45,000 to $49,999 | 0 (0.0%) | 0 (0.0%) |
| $50,000 to $54,999 | 0 (0.0%) | 0 (0.0%) |
| $55,000 to $64,999 | 0 (0.0%) | 43 (20.0%) |
| $65,000 to $74,999 | 0 (0.0%) | 45 (20.9%) |
| $75,000 to $99,999 | 105 (18.0%) | 63 (29.3%) |
| $100,000+ | 171 (29.3%) | 33 (15.3%) |
| Total | 583 (100.0%) | 215 (100.0%) |
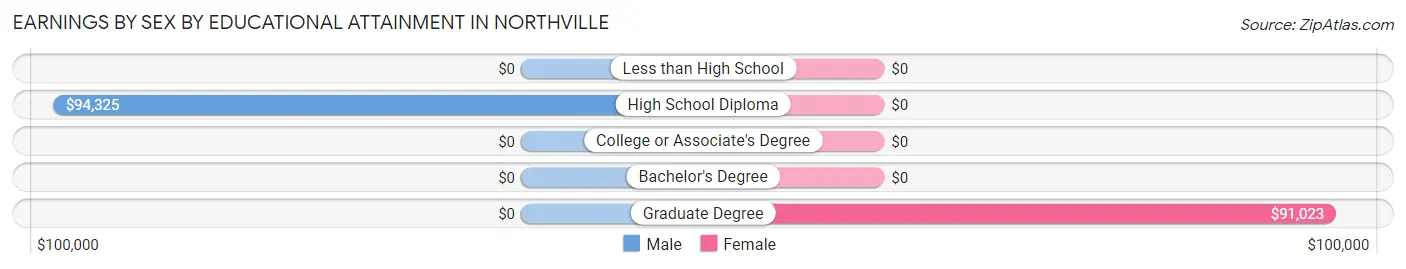
Earnings by Sex by Educational Attainment in Northville
Average earnings in Northville are $86,607 for men and $74,361 for women, a difference of 14.1%. Men with an educational attainment of high school diploma enjoy the highest average annual earnings of $94,325, while those with high school diploma education earn the least with $94,325. Women with an educational attainment of graduate degree earn the most with the average annual earnings of $91,023, while those with graduate degree education have the smallest earnings of $91,023.
| Educational Attainment | Male Income | Female Income |
| Less than High School | - | - |
| High School Diploma | $94,325 | $0 |
| College or Associate's Degree | - | - |
| Bachelor's Degree | - | - |
| Graduate Degree | - | - |
| Total | $86,607 | $74,361 |
Family Income in Northville
Family Income Brackets in Northville
According to the Northville family income data, there are 174 families falling into the $100,000 to $149,999 income range, which is the most common income bracket and makes up 30.1% of all families.
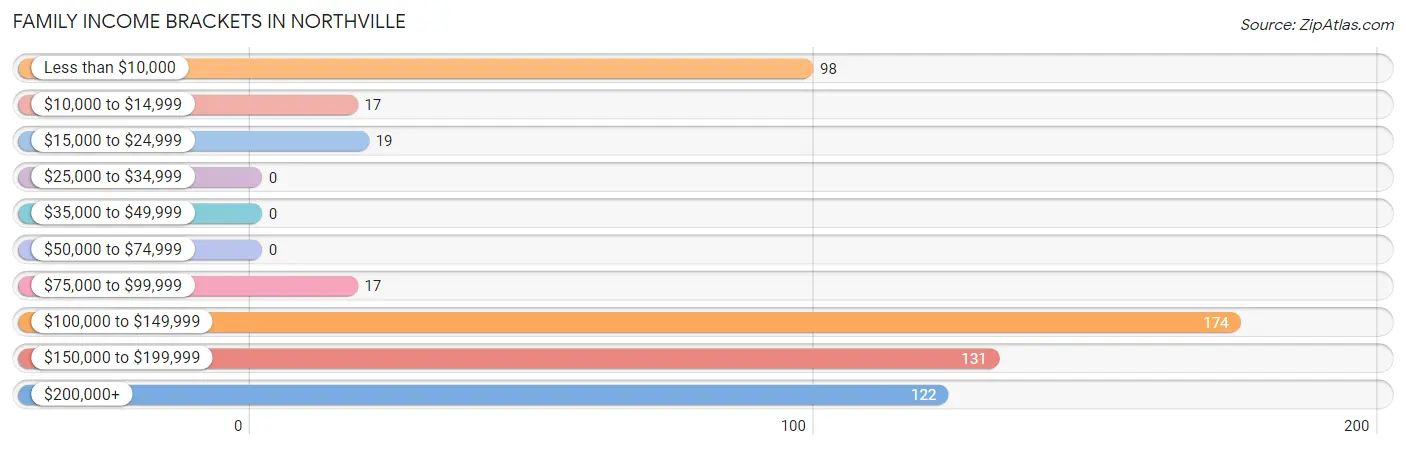
| Income Bracket | # Families | % Families |
| Less than $10,000 | 98 | 17.0% |
| $10,000 to $14,999 | 17 | 2.9% |
| $15,000 to $24,999 | 19 | 3.3% |
| $25,000 to $34,999 | 0 | 0.0% |
| $35,000 to $49,999 | 0 | 0.0% |
| $50,000 to $74,999 | 0 | 0.0% |
| $75,000 to $99,999 | 17 | 2.9% |
| $100,000 to $149,999 | 174 | 30.1% |
| $150,000 to $199,999 | 131 | 22.7% |
| $200,000+ | 122 | 21.1% |
Family Income by Famaliy Size in Northville
3-person families (147 | 25.4%) account for the highest median family income in Northville with $113,802 per family, while 2-person families (333 | 57.6%) have the highest median income of $55,605 per family member.
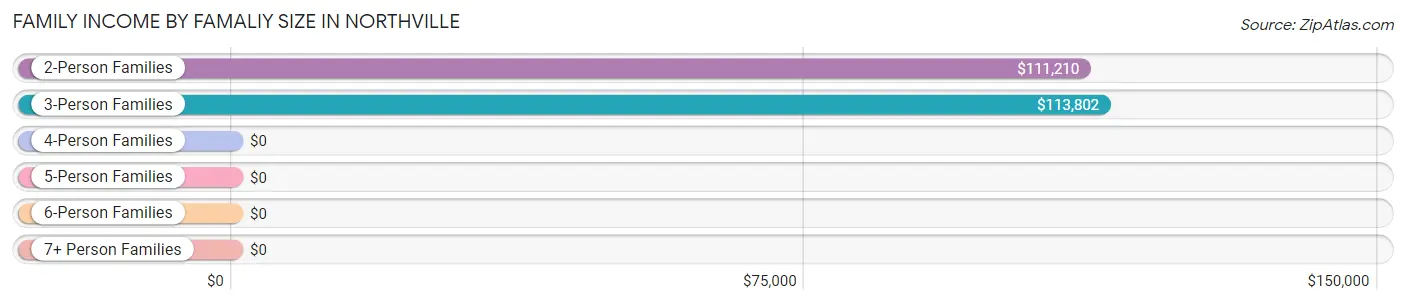
| Income Bracket | # Families | Median Income |
| 2-Person Families | 333 (57.6%) | $111,210 |
| 3-Person Families | 147 (25.4%) | $113,802 |
| 4-Person Families | 53 (9.2%) | $0 |
| 5-Person Families | 0 (0.0%) | $0 |
| 6-Person Families | 0 (0.0%) | $0 |
| 7+ Person Families | 45 (7.8%) | $0 |
| Total | 578 (100.0%) | $116,786 |
Family Income by Number of Earners in Northville
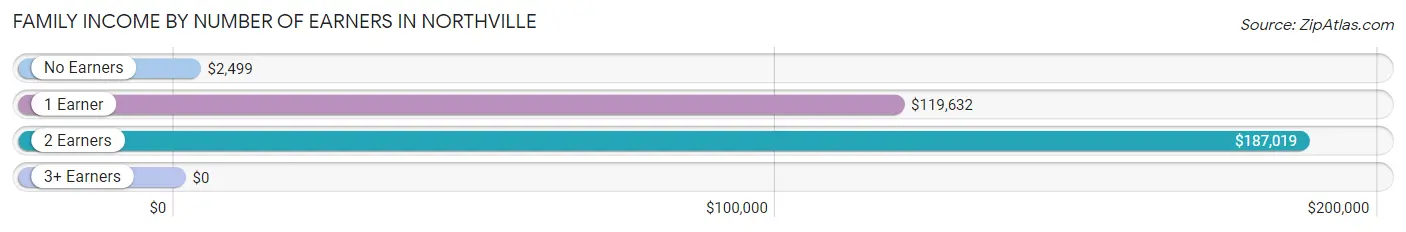
| Number of Earners | # Families | Median Income |
| No Earners | 185 (32.0%) | $2,499 |
| 1 Earner | 229 (39.6%) | $119,632 |
| 2 Earners | 101 (17.5%) | $187,019 |
| 3+ Earners | 63 (10.9%) | $0 |
| Total | 578 (100.0%) | $116,786 |
Household Income in Northville
Household Income Brackets in Northville
With 174 households falling in the category, the $100,000 to $149,999 income range is the most frequent in Northville, accounting for 27.5% of all households.
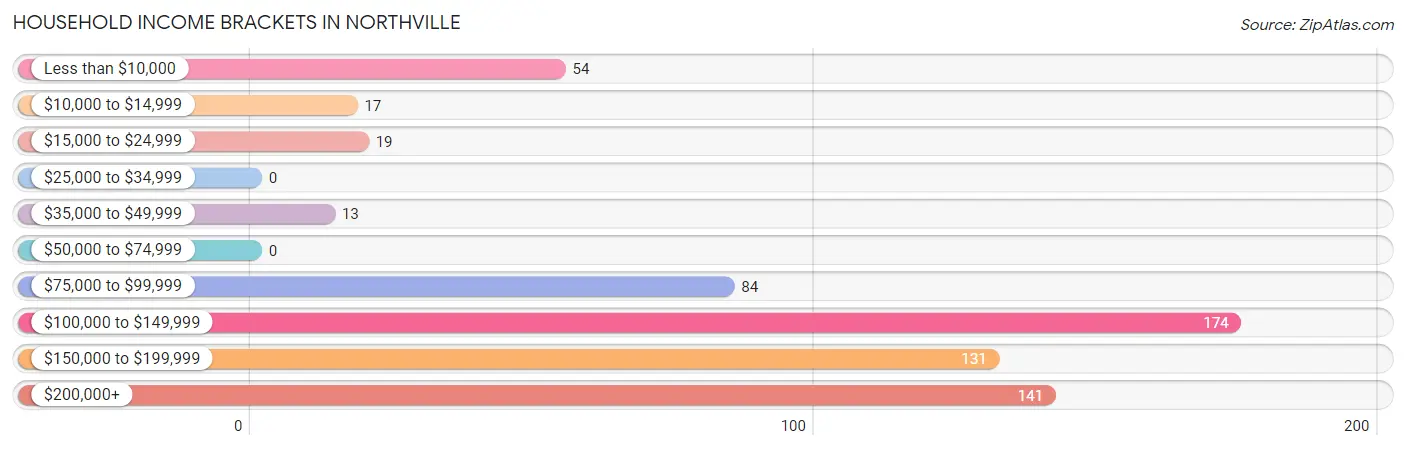
| Income Bracket | # Households | % Households |
| Less than $10,000 | 54 | 8.5% |
| $10,000 to $14,999 | 17 | 2.7% |
| $15,000 to $24,999 | 19 | 3.0% |
| $25,000 to $34,999 | 0 | 0.0% |
| $35,000 to $49,999 | 13 | 2.1% |
| $50,000 to $74,999 | 0 | 0.0% |
| $75,000 to $99,999 | 84 | 13.3% |
| $100,000 to $149,999 | 174 | 27.5% |
| $150,000 to $199,999 | 131 | 20.7% |
| $200,000+ | 141 | 22.3% |
Household Income by Householder Age in Northville
The median household income in Northville is $114,635, with the highest median household income of $161,580 found in the 45 to 64 years age bracket for the primary householder. A total of 287 households (45.3%) fall into this category.
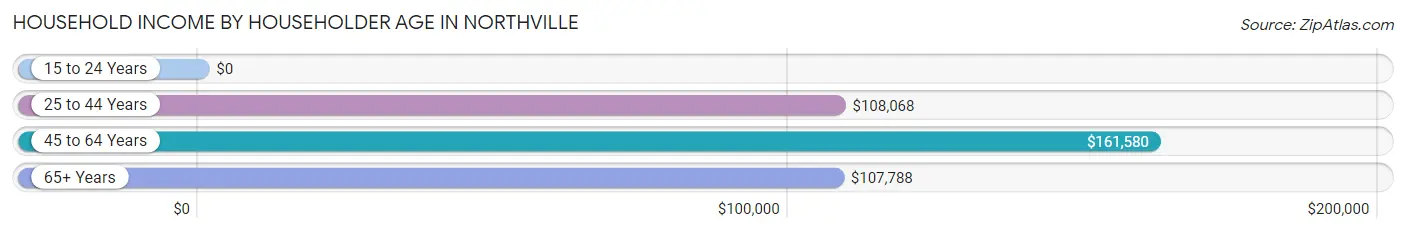
| Income Bracket | # Households | Median Income |
| 15 to 24 Years | 0 (0.0%) | $0 |
| 25 to 44 Years | 103 (16.3%) | $108,068 |
| 45 to 64 Years | 287 (45.3%) | $161,580 |
| 65+ Years | 243 (38.4%) | $107,788 |
| Total | 633 (100.0%) | $114,635 |
Poverty in Northville
Income Below Poverty by Sex and Age in Northville
With 12.1% poverty level for males and 21.7% for females among the residents of Northville, under 5 year old males and 25 to 34 year old females are the most vulnerable to poverty, with 42 males (100.0%) and 44 females (100.0%) in their respective age groups living below the poverty level.
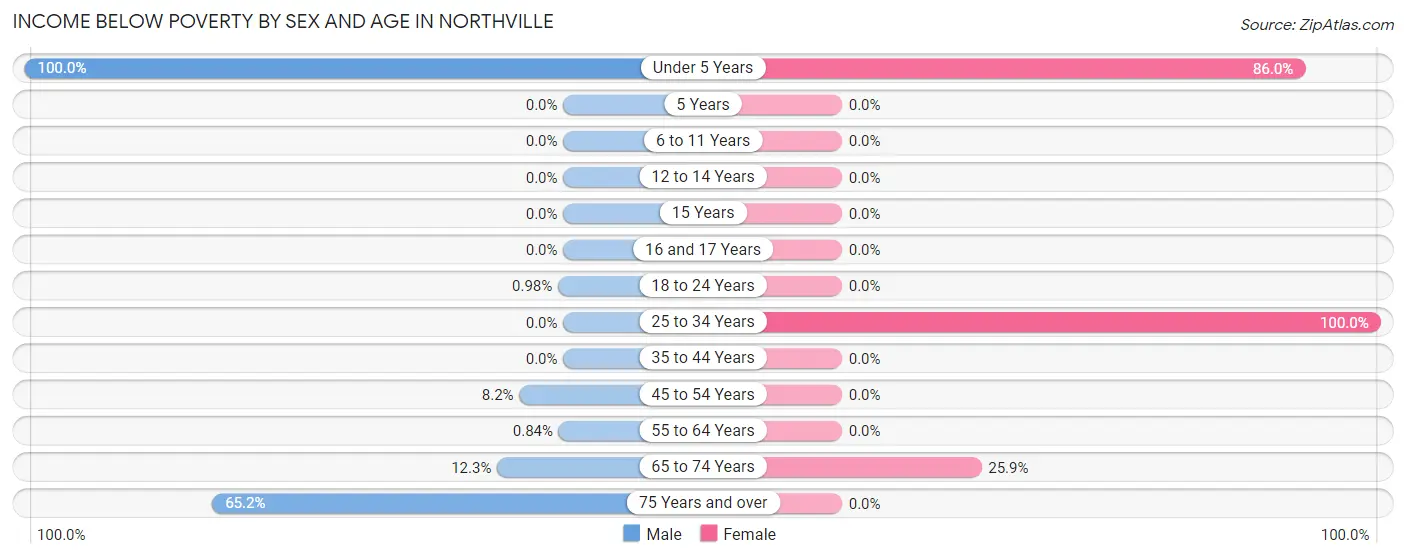
| Age Bracket | Male | Female |
| Under 5 Years | 42 (100.0%) | 43 (86.0%) |
| 5 Years | 0 (0.0%) | 0 (0.0%) |
| 6 to 11 Years | 0 (0.0%) | 0 (0.0%) |
| 12 to 14 Years | 0 (0.0%) | 0 (0.0%) |
| 15 Years | 0 (0.0%) | 0 (0.0%) |
| 16 and 17 Years | 0 (0.0%) | 0 (0.0%) |
| 18 to 24 Years | 2 (1.0%) | 0 (0.0%) |
| 25 to 34 Years | 0 (0.0%) | 44 (100.0%) |
| 35 to 44 Years | 0 (0.0%) | 0 (0.0%) |
| 45 to 54 Years | 4 (8.2%) | 0 (0.0%) |
| 55 to 64 Years | 2 (0.8%) | 0 (0.0%) |
| 65 to 74 Years | 20 (12.3%) | 80 (25.9%) |
| 75 Years and over | 58 (65.2%) | 0 (0.0%) |
| Total | 128 (12.1%) | 167 (21.7%) |
Income Above Poverty by Sex and Age in Northville
According to the poverty statistics in Northville, males aged 16 and 17 years and females aged 6 to 11 years are the age groups that are most secure financially, with 100.0% of males and 100.0% of females in these age groups living above the poverty line.
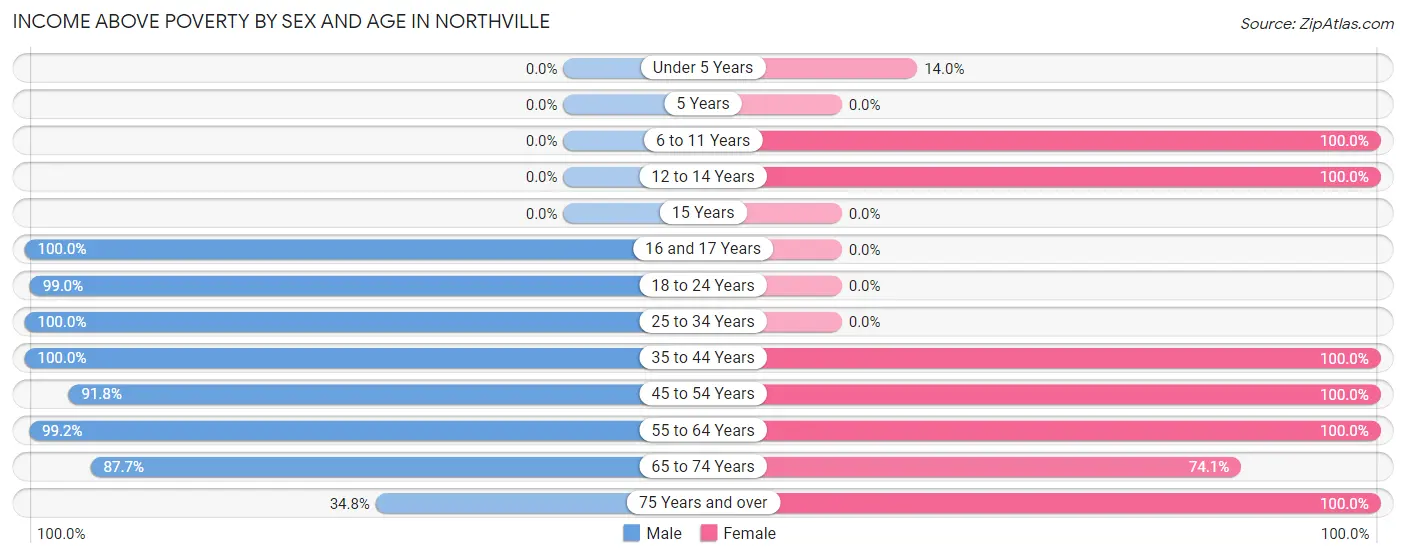
| Age Bracket | Male | Female |
| Under 5 Years | 0 (0.0%) | 7 (14.0%) |
| 5 Years | 0 (0.0%) | 0 (0.0%) |
| 6 to 11 Years | 0 (0.0%) | 22 (100.0%) |
| 12 to 14 Years | 0 (0.0%) | 54 (100.0%) |
| 15 Years | 0 (0.0%) | 0 (0.0%) |
| 16 and 17 Years | 101 (100.0%) | 0 (0.0%) |
| 18 to 24 Years | 203 (99.0%) | 0 (0.0%) |
| 25 to 34 Years | 55 (100.0%) | 0 (0.0%) |
| 35 to 44 Years | 117 (100.0%) | 55 (100.0%) |
| 45 to 54 Years | 45 (91.8%) | 18 (100.0%) |
| 55 to 64 Years | 235 (99.2%) | 162 (100.0%) |
| 65 to 74 Years | 143 (87.7%) | 229 (74.1%) |
| 75 Years and over | 31 (34.8%) | 57 (100.0%) |
| Total | 930 (87.9%) | 604 (78.3%) |
Income Below Poverty Among Married-Couple Families in Northville
The poverty statistics for married-couple families in Northville show that 13.6% or 71 of the total 521 families live below the poverty line. Families with no children have the highest poverty rate of 17.8%, comprising of 71 families. On the other hand, families with 1 or 2 children have the lowest poverty rate of 0.0%, which includes 0 families.
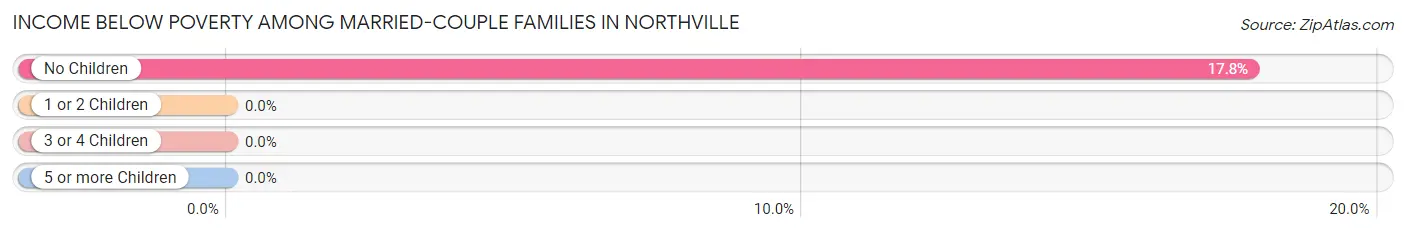
| Children | Above Poverty | Below Poverty |
| No Children | 328 (82.2%) | 71 (17.8%) |
| 1 or 2 Children | 122 (100.0%) | 0 (0.0%) |
| 3 or 4 Children | 0 (0.0%) | 0 (0.0%) |
| 5 or more Children | 0 (0.0%) | 0 (0.0%) |
| Total | 450 (86.4%) | 71 (13.6%) |
Income Below Poverty Among Single-Parent Households in Northville
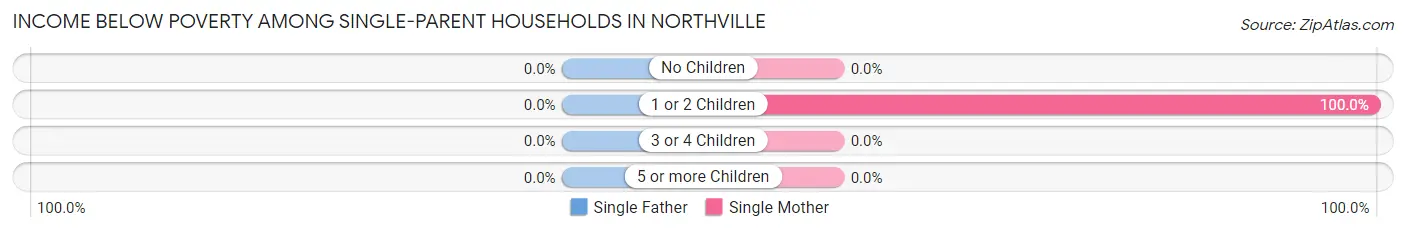
| Children | Single Father | Single Mother |
| No Children | 0 (0.0%) | 0 (0.0%) |
| 1 or 2 Children | 0 (0.0%) | 44 (100.0%) |
| 3 or 4 Children | 0 (0.0%) | 0 (0.0%) |
| 5 or more Children | 0 (0.0%) | 0 (0.0%) |
| Total | 0 (0.0%) | 44 (77.2%) |
Income Below Poverty Among Married-Couple vs Single-Parent Households in Northville
The poverty data for Northville shows that 71 of the married-couple family households (13.6%) and 44 of the single-parent households (77.2%) are living below the poverty level. Within the married-couple family households, those with no children have the highest poverty rate, with 71 households (17.8%) falling below the poverty line. Among the single-parent households, those with 1 or 2 children have the highest poverty rate, with 44 household (100.0%) living below poverty.
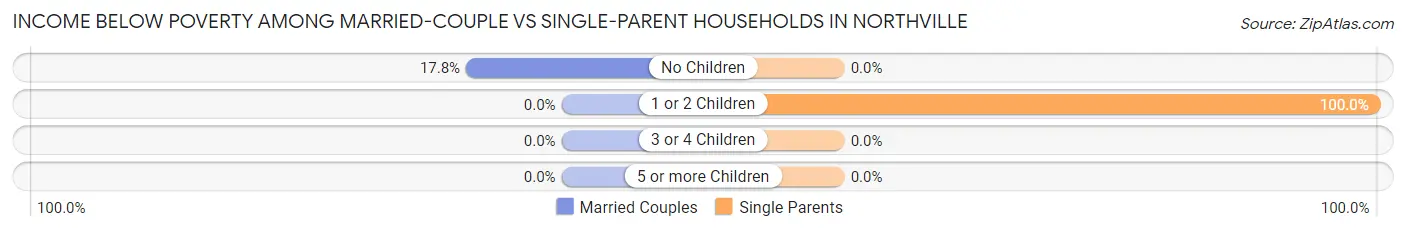
| Children | Married-Couple Families | Single-Parent Households |
| No Children | 71 (17.8%) | 0 (0.0%) |
| 1 or 2 Children | 0 (0.0%) | 44 (100.0%) |
| 3 or 4 Children | 0 (0.0%) | 0 (0.0%) |
| 5 or more Children | 0 (0.0%) | 0 (0.0%) |
| Total | 71 (13.6%) | 44 (77.2%) |
Race in Northville
The most populous races in Northville are White / Caucasian (1,802 | 98.5%), Asian (22 | 1.2%), and Hispanic or Latino (22 | 1.2%).
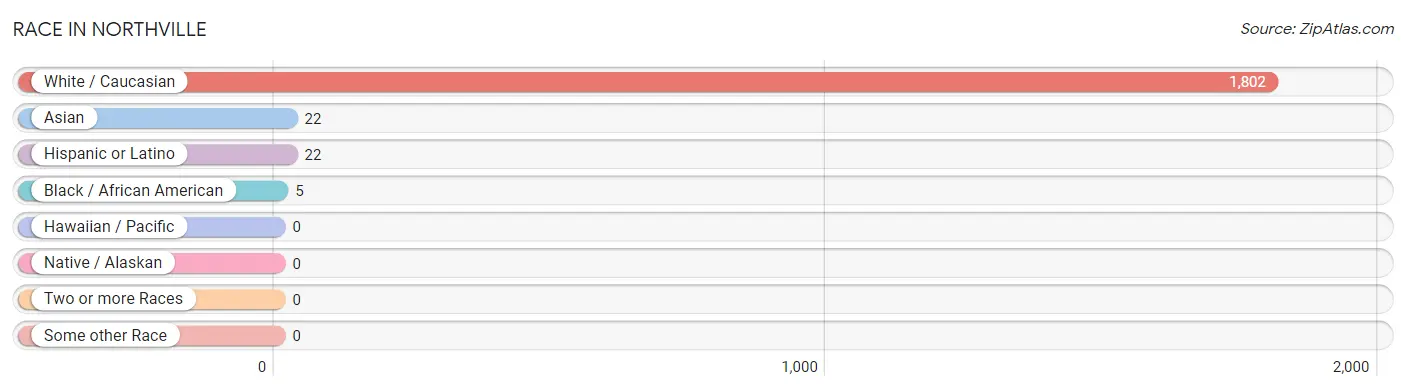
| Race | # Population | % Population |
| Asian | 22 | 1.2% |
| Black / African American | 5 | 0.3% |
| Hawaiian / Pacific | 0 | 0.0% |
| Hispanic or Latino | 22 | 1.2% |
| Native / Alaskan | 0 | 0.0% |
| White / Caucasian | 1,802 | 98.5% |
| Two or more Races | 0 | 0.0% |
| Some other Race | 0 | 0.0% |
| Total | 1,829 | 100.0% |
Ancestry in Northville
The most populous ancestries reported in Northville are German (624 | 34.1%), Irish (539 | 29.5%), Italian (384 | 21.0%), American (308 | 16.8%), and English (263 | 14.4%), together accounting for 115.8% of all Northville residents.
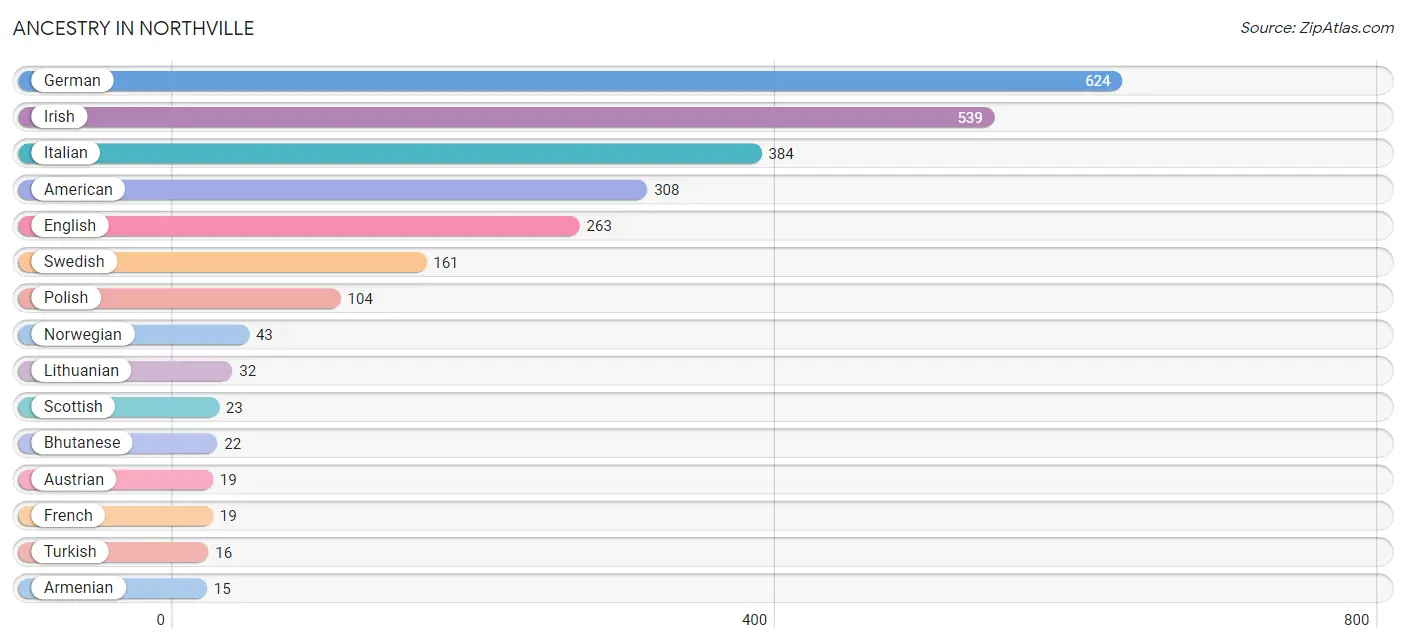
| Ancestry | # Population | % Population |
| American | 308 | 16.8% |
| Armenian | 15 | 0.8% |
| Austrian | 19 | 1.0% |
| Bhutanese | 22 | 1.2% |
| English | 263 | 14.4% |
| French | 19 | 1.0% |
| German | 624 | 34.1% |
| Irish | 539 | 29.5% |
| Italian | 384 | 21.0% |
| Lithuanian | 32 | 1.8% |
| Norwegian | 43 | 2.4% |
| Polish | 104 | 5.7% |
| Scottish | 23 | 1.3% |
| Swedish | 161 | 8.8% |
| Turkish | 16 | 0.9% | View All 15 Rows |
Immigrants in Northville

| Immigration Origin | # Population | % Population | View All 0 Rows |
Sex and Age in Northville
Sex and Age in Northville
The most populous age groups in Northville are 15 to 19 Years (159 | 15.0%) for men and 70 to 74 Years (169 | 21.9%) for women.
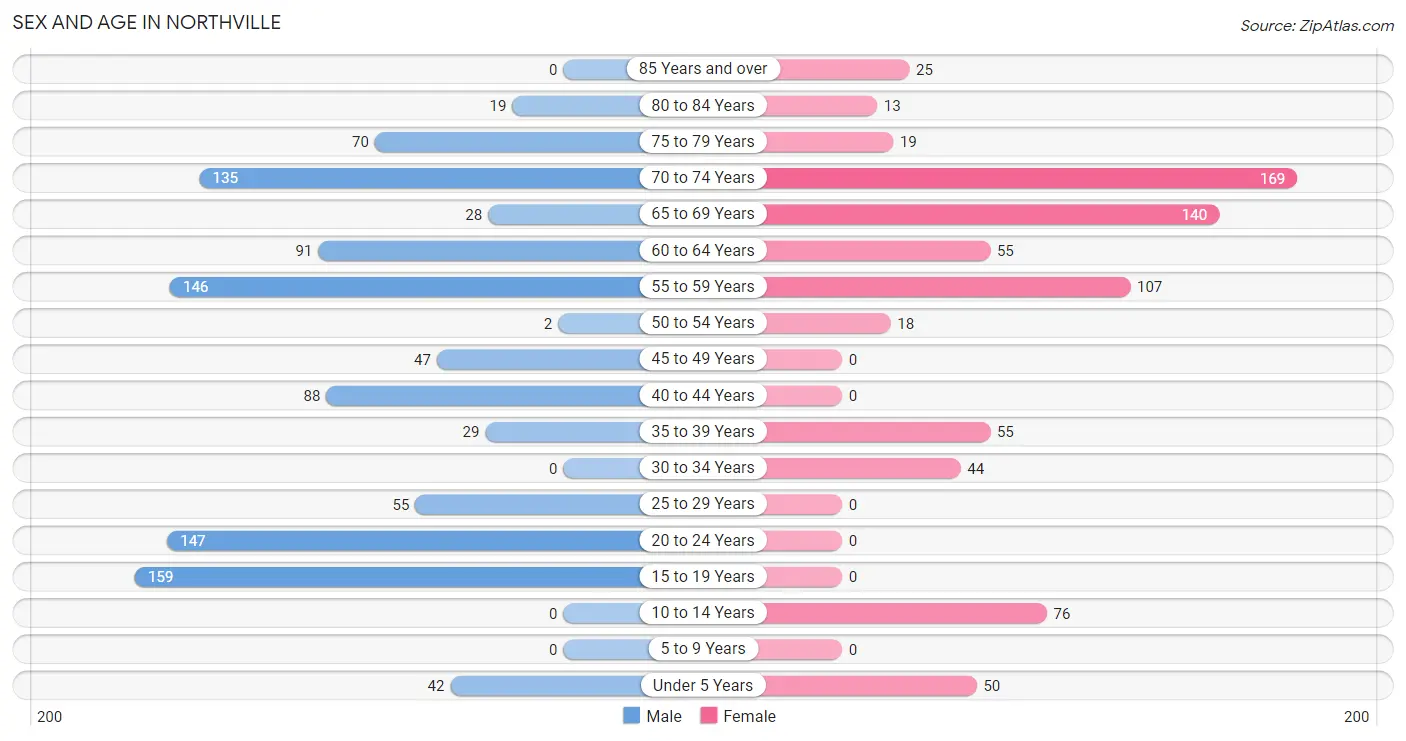
| Age Bracket | Male | Female |
| Under 5 Years | 42 (4.0%) | 50 (6.5%) |
| 5 to 9 Years | 0 (0.0%) | 0 (0.0%) |
| 10 to 14 Years | 0 (0.0%) | 76 (9.9%) |
| 15 to 19 Years | 159 (15.0%) | 0 (0.0%) |
| 20 to 24 Years | 147 (13.9%) | 0 (0.0%) |
| 25 to 29 Years | 55 (5.2%) | 0 (0.0%) |
| 30 to 34 Years | 0 (0.0%) | 44 (5.7%) |
| 35 to 39 Years | 29 (2.7%) | 55 (7.1%) |
| 40 to 44 Years | 88 (8.3%) | 0 (0.0%) |
| 45 to 49 Years | 47 (4.4%) | 0 (0.0%) |
| 50 to 54 Years | 2 (0.2%) | 18 (2.3%) |
| 55 to 59 Years | 146 (13.8%) | 107 (13.9%) |
| 60 to 64 Years | 91 (8.6%) | 55 (7.1%) |
| 65 to 69 Years | 28 (2.6%) | 140 (18.2%) |
| 70 to 74 Years | 135 (12.8%) | 169 (21.9%) |
| 75 to 79 Years | 70 (6.6%) | 19 (2.5%) |
| 80 to 84 Years | 19 (1.8%) | 13 (1.7%) |
| 85 Years and over | 0 (0.0%) | 25 (3.2%) |
| Total | 1,058 (100.0%) | 771 (100.0%) |
Families and Households in Northville
Median Family Size in Northville
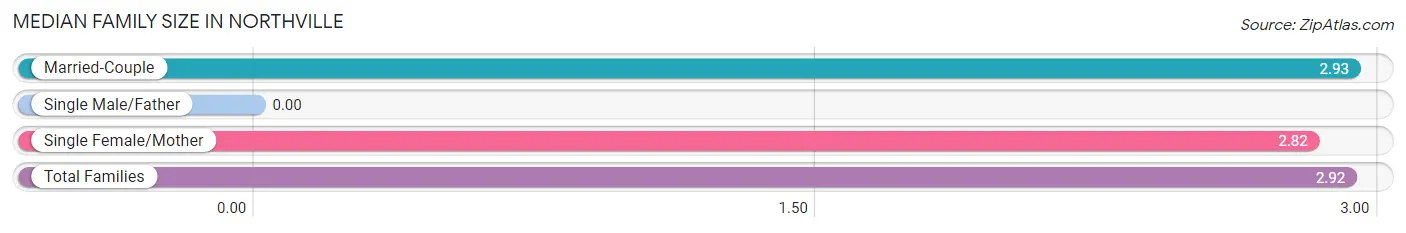
| Family Type | # Families | Family Size |
| Married-Couple | 521 (90.1%) | 2.93 |
| Single Male/Father | 0 (0.0%) | - |
| Single Female/Mother | 57 (9.9%) | 2.82 |
| Total Families | 578 (100.0%) | 2.92 |
Median Household Size in Northville
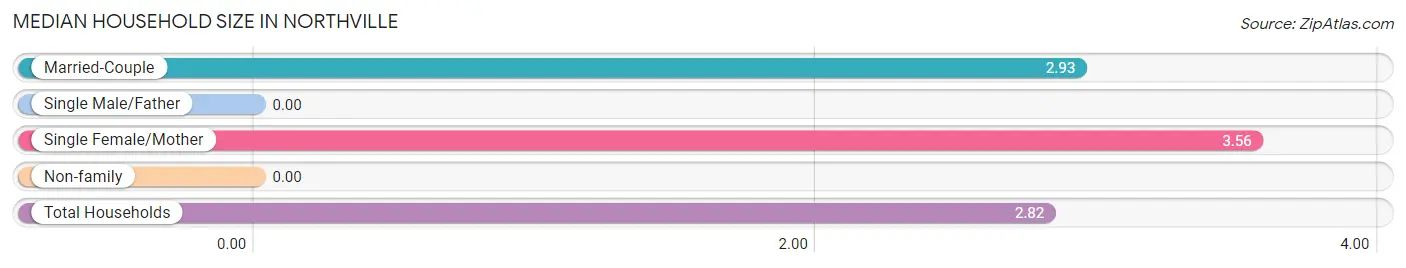
| Household Type | # Households | Household Size |
| Married-Couple | 521 (82.3%) | 2.93 |
| Single Male/Father | 0 (0.0%) | - |
| Single Female/Mother | 57 (9.0%) | 3.56 |
| Non-family | 55 (8.7%) | - |
| Total Households | 633 (100.0%) | 2.82 |
Household Size by Marriage Status in Northville
Out of a total of 633 households in Northville, 578 (91.3%) are family households, while 55 (8.7%) are nonfamily households. The most numerous type of family households are 2-person households, comprising 333, and the most common type of nonfamily households are 1-person households, comprising 55.
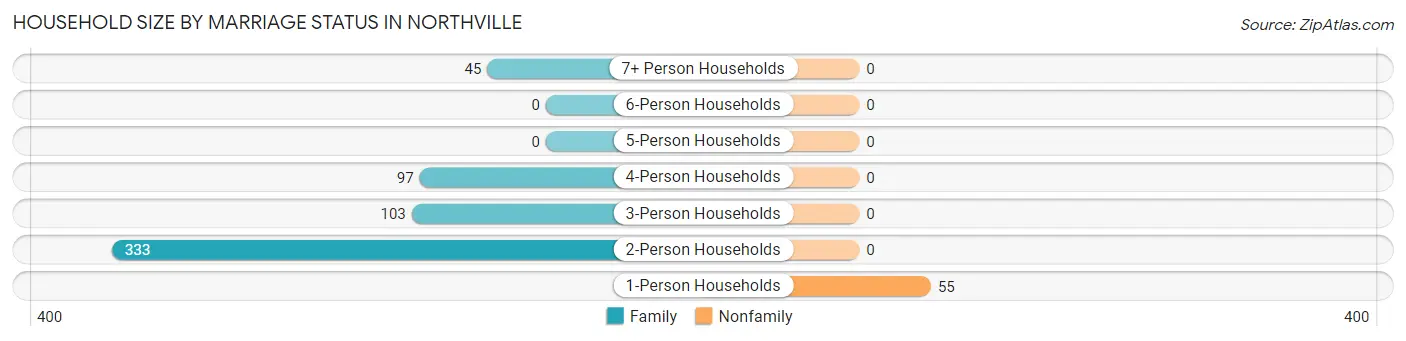
| Household Size | Family Households | Nonfamily Households |
| 1-Person Households | - | 55 (8.7%) |
| 2-Person Households | 333 (52.6%) | 0 (0.0%) |
| 3-Person Households | 103 (16.3%) | 0 (0.0%) |
| 4-Person Households | 97 (15.3%) | 0 (0.0%) |
| 5-Person Households | 0 (0.0%) | 0 (0.0%) |
| 6-Person Households | 0 (0.0%) | 0 (0.0%) |
| 7+ Person Households | 45 (7.1%) | 0 (0.0%) |
| Total | 578 (91.3%) | 55 (8.7%) |
Female Fertility in Northville
Fertility by Age in Northville
Average fertility rate in Northville is 71.0 births per 1,000 women. Women in the age bracket of 35 to 50 years have the highest fertility rate with 127.0 births per 1,000 women. Women in the age bracket of 35 to 50 years acount for 100.0% of all women with births.
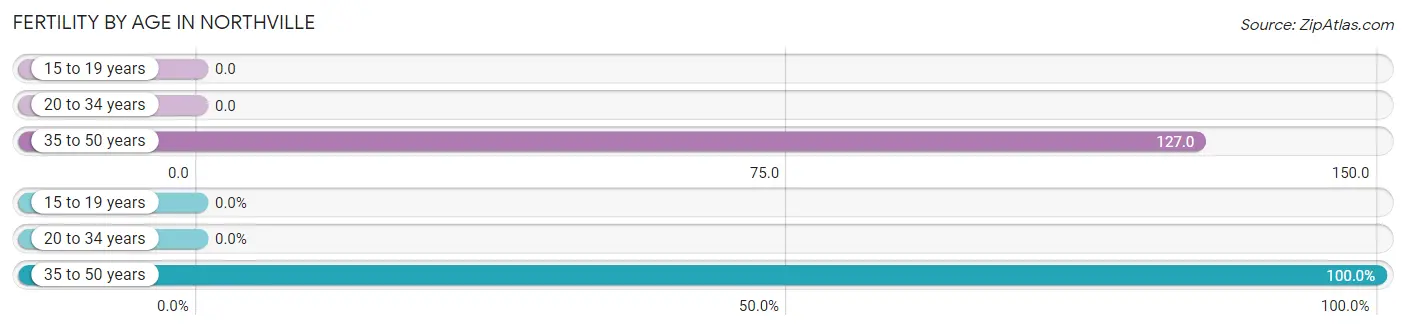
| Age Bracket | Women with Births | Births / 1,000 Women |
| 15 to 19 years | 0 (0.0%) | 0.0 |
| 20 to 34 years | 0 (0.0%) | 0.0 |
| 35 to 50 years | 7 (100.0%) | 127.0 |
| Total | 7 (100.0%) | 71.0 |
Fertility by Age by Marriage Status in Northville
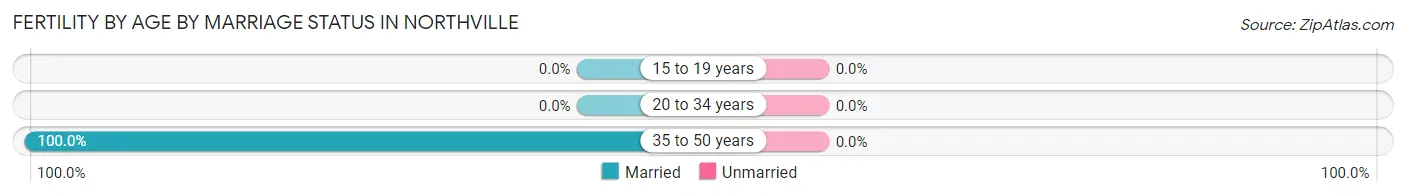
| Age Bracket | Married | Unmarried |
| 15 to 19 years | 0 (0.0%) | 0 (0.0%) |
| 20 to 34 years | 0 (0.0%) | 0 (0.0%) |
| 35 to 50 years | 7 (100.0%) | 0 (0.0%) |
| Total | 7 (100.0%) | 0 (0.0%) |
Fertility by Education in Northville
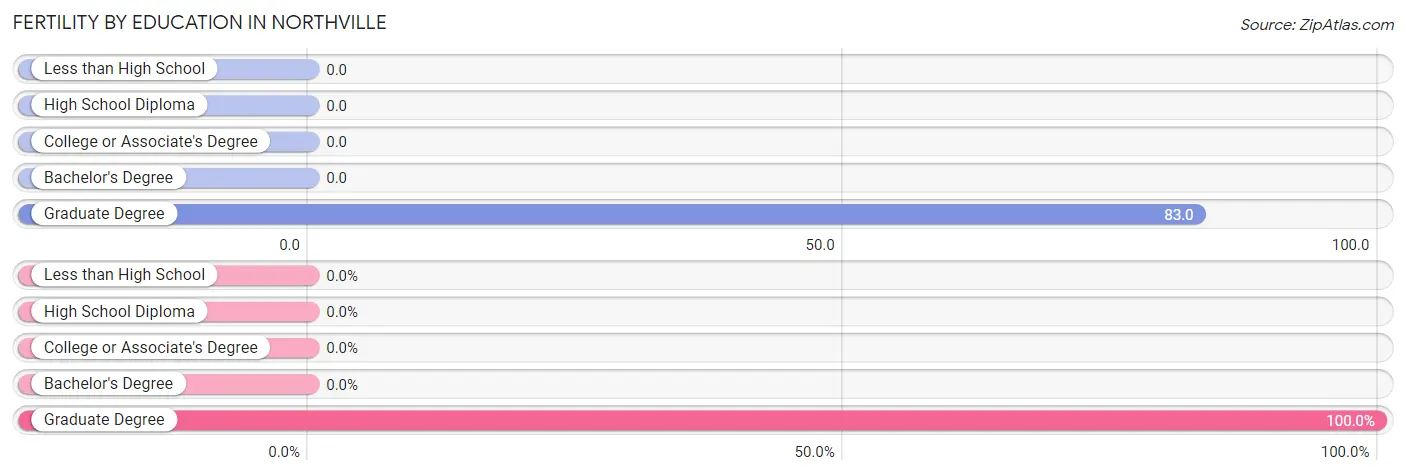
| Educational Attainment | Women with Births | Births / 1,000 Women |
| Less than High School | 0 (0.0%) | 0.0 |
| High School Diploma | 0 (0.0%) | 0.0 |
| College or Associate's Degree | 0 (0.0%) | 0.0 |
| Bachelor's Degree | 0 (0.0%) | 0.0 |
| Graduate Degree | 7 (100.0%) | 83.0 |
| Total | 7 (100.0%) | 71.0 |
Fertility by Education by Marriage Status in Northville
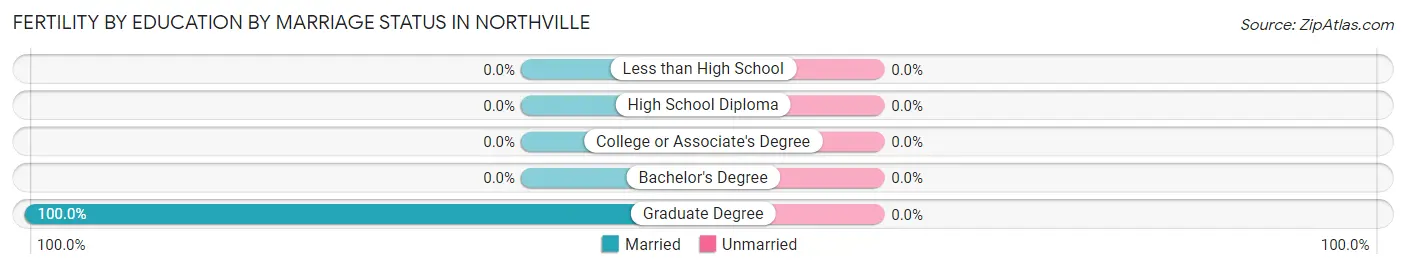
| Educational Attainment | Married | Unmarried |
| Less than High School | 0 (0.0%) | 0 (0.0%) |
| High School Diploma | 0 (0.0%) | 0 (0.0%) |
| College or Associate's Degree | 0 (0.0%) | 0 (0.0%) |
| Bachelor's Degree | 0 (0.0%) | 0 (0.0%) |
| Graduate Degree | 7 (100.0%) | 0 (0.0%) |
| Total | 7 (100.0%) | 0 (0.0%) |
Employment Characteristics in Northville
Employment by Class of Employer in Northville
Among the 703 employed individuals in Northville, private company employees (314 | 44.7%), self-employed (incorporated) (140 | 19.9%), and local government employees (121 | 17.2%) make up the most common classes of employment.
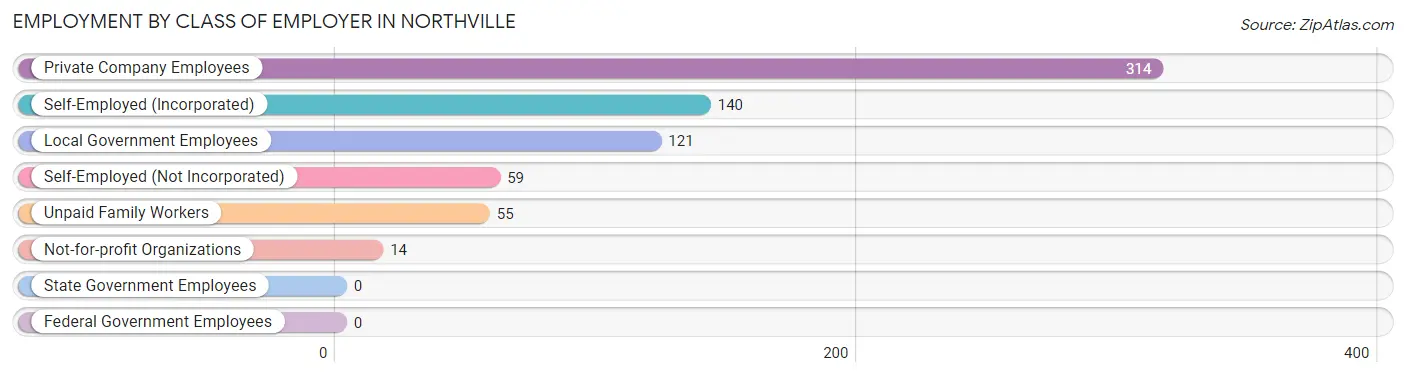
| Employer Class | # Employees | % Employees |
| Private Company Employees | 314 | 44.7% |
| Self-Employed (Incorporated) | 140 | 19.9% |
| Self-Employed (Not Incorporated) | 59 | 8.4% |
| Not-for-profit Organizations | 14 | 2.0% |
| Local Government Employees | 121 | 17.2% |
| State Government Employees | 0 | 0.0% |
| Federal Government Employees | 0 | 0.0% |
| Unpaid Family Workers | 55 | 7.8% |
| Total | 703 | 100.0% |
Employment Status by Age in Northville
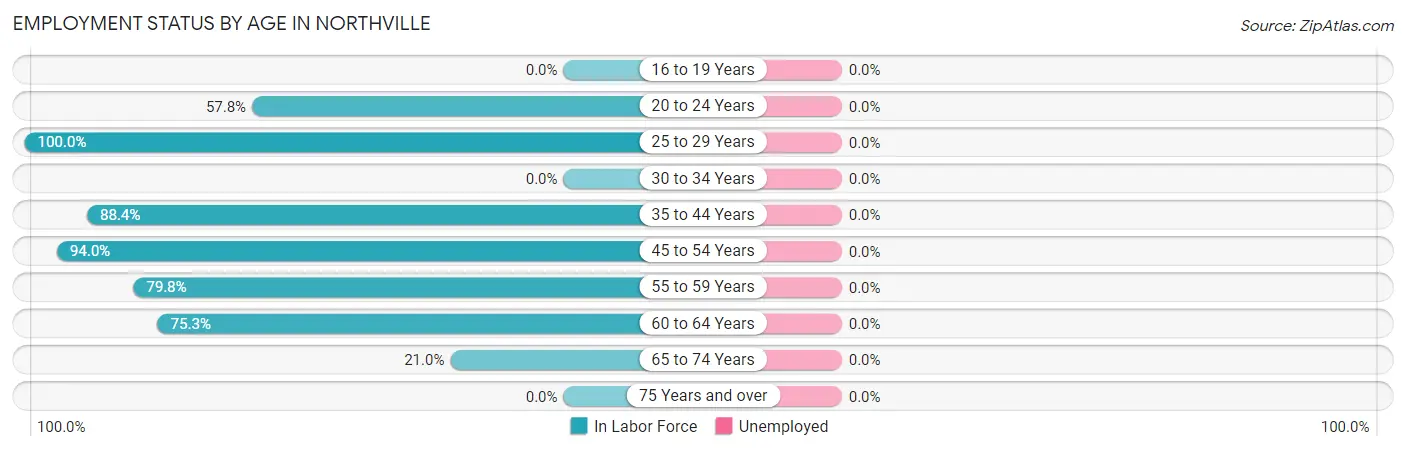
| Age Bracket | In Labor Force | Unemployed |
| 16 to 19 Years | 0 (0.0%) | 0 (0.0%) |
| 20 to 24 Years | 85 (57.8%) | 0 (0.0%) |
| 25 to 29 Years | 55 (100.0%) | 0 (0.0%) |
| 30 to 34 Years | 0 (0.0%) | 0 (0.0%) |
| 35 to 44 Years | 152 (88.4%) | 0 (0.0%) |
| 45 to 54 Years | 63 (94.0%) | 0 (0.0%) |
| 55 to 59 Years | 202 (79.8%) | 0 (0.0%) |
| 60 to 64 Years | 110 (75.3%) | 0 (0.0%) |
| 65 to 74 Years | 99 (21.0%) | 0 (0.0%) |
| 75 Years and over | 0 (0.0%) | 0 (0.0%) |
| Total | 766 (46.1%) | 0 (0.0%) |
Employment Status by Educational Attainment in Northville
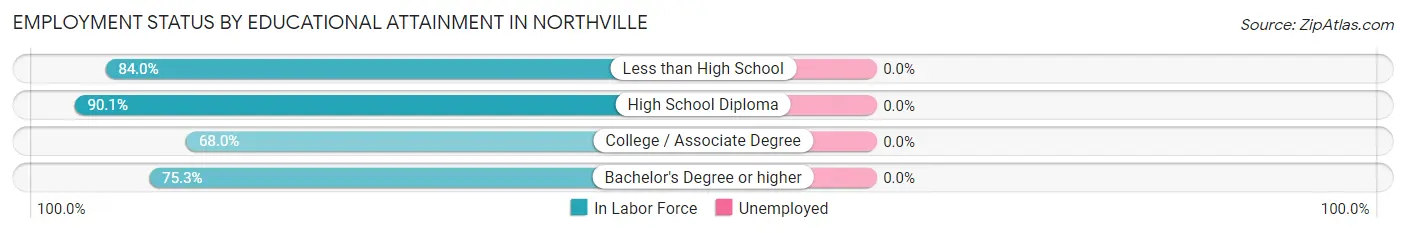
| Educational Attainment | In Labor Force | Unemployed |
| Less than High School | 42 (84.0%) | 0 (0.0%) |
| High School Diploma | 183 (90.1%) | 0 (0.0%) |
| College / Associate Degree | 68 (68.0%) | 0 (0.0%) |
| Bachelor's Degree or higher | 289 (75.3%) | 0 (0.0%) |
| Total | 582 (79.0%) | 0 (0.0%) |
Employment Occupations by Sex in Northville
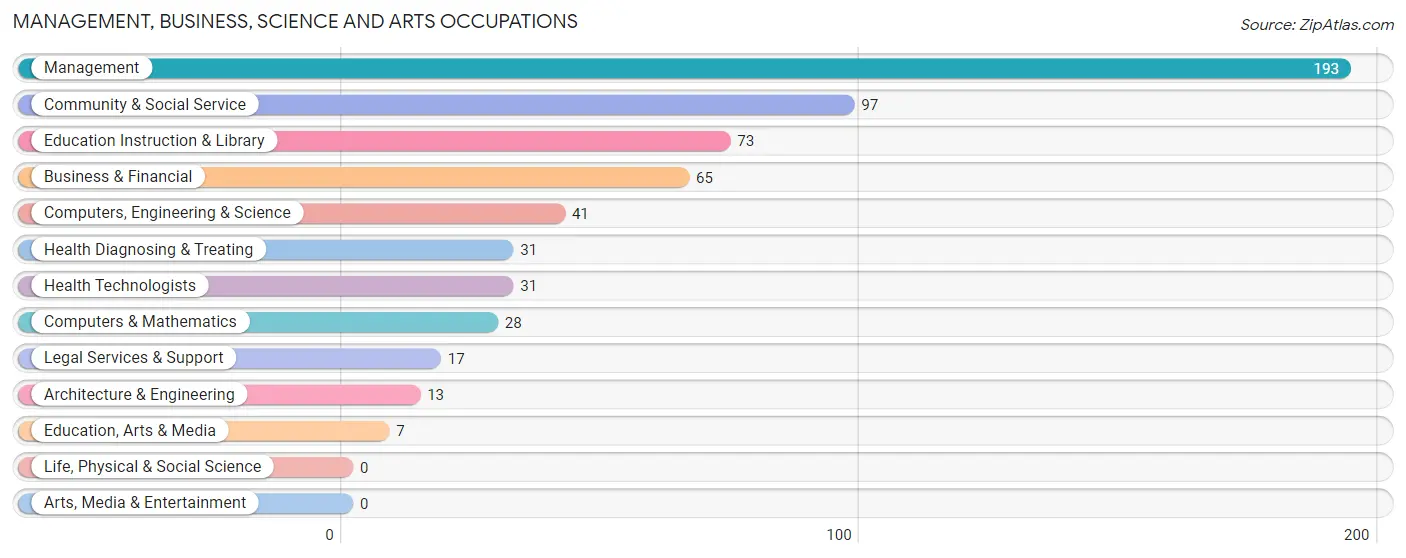
Management, Business, Science and Arts Occupations
The most common Management, Business, Science and Arts occupations in Northville are Management (193 | 25.2%), Community & Social Service (97 | 12.7%), Education Instruction & Library (73 | 9.5%), Business & Financial (65 | 8.5%), and Computers, Engineering & Science (41 | 5.3%).
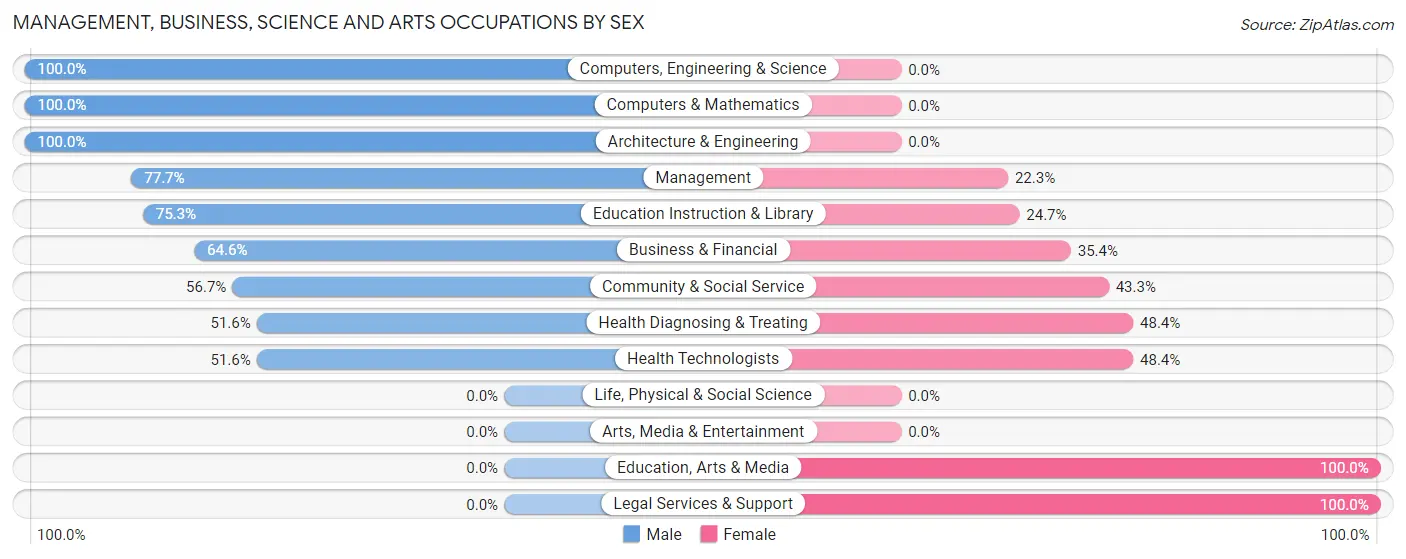
Management, Business, Science and Arts Occupations by Sex
Within the Management, Business, Science and Arts occupations in Northville, the most male-oriented occupations are Computers, Engineering & Science (100.0%), Computers & Mathematics (100.0%), and Architecture & Engineering (100.0%), while the most female-oriented occupations are Education, Arts & Media (100.0%), Legal Services & Support (100.0%), and Health Diagnosing & Treating (48.4%).
| Occupation | Male | Female |
| Management | 150 (77.7%) | 43 (22.3%) |
| Business & Financial | 42 (64.6%) | 23 (35.4%) |
| Computers, Engineering & Science | 41 (100.0%) | 0 (0.0%) |
| Computers & Mathematics | 28 (100.0%) | 0 (0.0%) |
| Architecture & Engineering | 13 (100.0%) | 0 (0.0%) |
| Life, Physical & Social Science | 0 (0.0%) | 0 (0.0%) |
| Community & Social Service | 55 (56.7%) | 42 (43.3%) |
| Education, Arts & Media | 0 (0.0%) | 7 (100.0%) |
| Legal Services & Support | 0 (0.0%) | 17 (100.0%) |
| Education Instruction & Library | 55 (75.3%) | 18 (24.7%) |
| Arts, Media & Entertainment | 0 (0.0%) | 0 (0.0%) |
| Health Diagnosing & Treating | 16 (51.6%) | 15 (48.4%) |
| Health Technologists | 16 (51.6%) | 15 (48.4%) |
| Total (Category) | 304 (71.2%) | 123 (28.8%) |
| Total (Overall) | 583 (76.1%) | 183 (23.9%) |
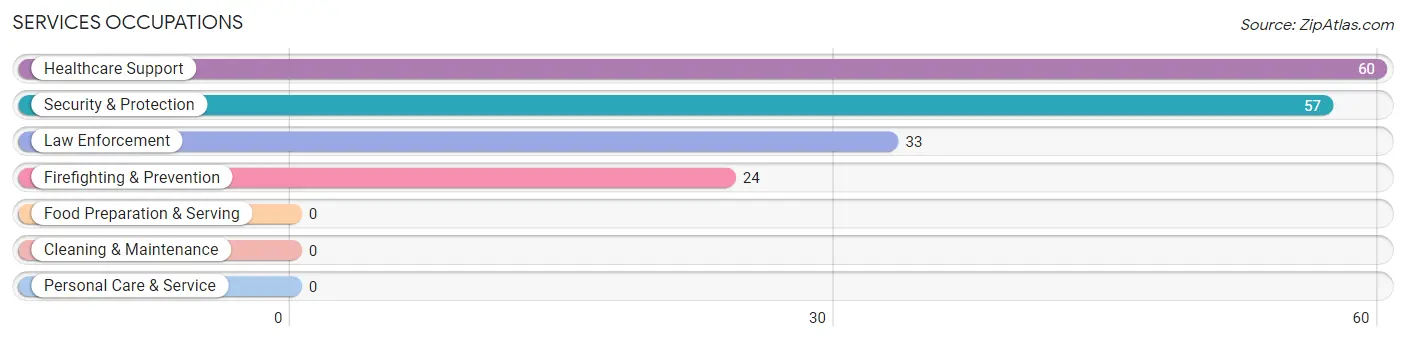
Services Occupations
The most common Services occupations in Northville are Healthcare Support (60 | 7.8%), Security & Protection (57 | 7.4%), Law Enforcement (33 | 4.3%), and Firefighting & Prevention (24 | 3.1%).
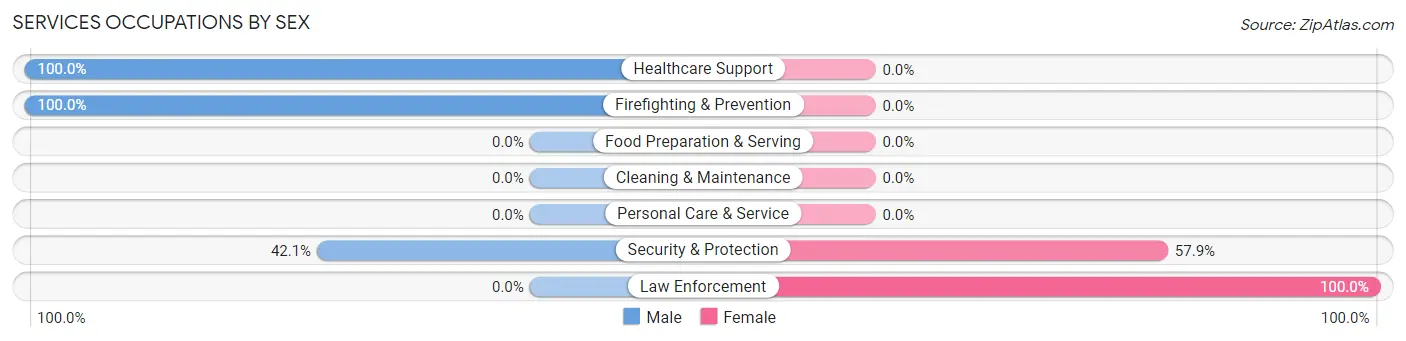
Services Occupations by Sex
Within the Services occupations in Northville, the most male-oriented occupations are Healthcare Support (100.0%), Firefighting & Prevention (100.0%), and Security & Protection (42.1%), while the most female-oriented occupations are Law Enforcement (100.0%), and Security & Protection (57.9%).
| Occupation | Male | Female |
| Healthcare Support | 60 (100.0%) | 0 (0.0%) |
| Security & Protection | 24 (42.1%) | 33 (57.9%) |
| Firefighting & Prevention | 24 (100.0%) | 0 (0.0%) |
| Law Enforcement | 0 (0.0%) | 33 (100.0%) |
| Food Preparation & Serving | 0 (0.0%) | 0 (0.0%) |
| Cleaning & Maintenance | 0 (0.0%) | 0 (0.0%) |
| Personal Care & Service | 0 (0.0%) | 0 (0.0%) |
| Total (Category) | 84 (71.8%) | 33 (28.2%) |
| Total (Overall) | 583 (76.1%) | 183 (23.9%) |
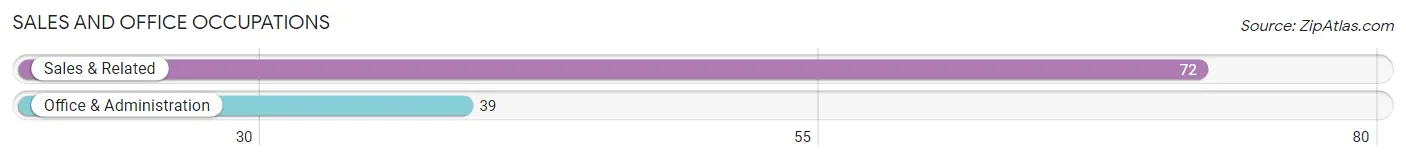
Sales and Office Occupations
The most common Sales and Office occupations in Northville are Sales & Related (72 | 9.4%), and Office & Administration (39 | 5.1%).
Sales and Office Occupations by Sex
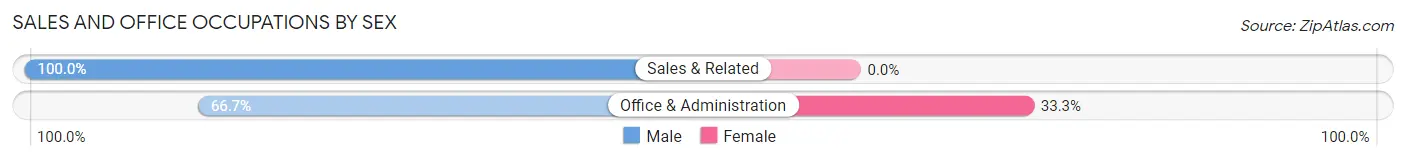
| Occupation | Male | Female |
| Sales & Related | 72 (100.0%) | 0 (0.0%) |
| Office & Administration | 26 (66.7%) | 13 (33.3%) |
| Total (Category) | 98 (88.3%) | 13 (11.7%) |
| Total (Overall) | 583 (76.1%) | 183 (23.9%) |
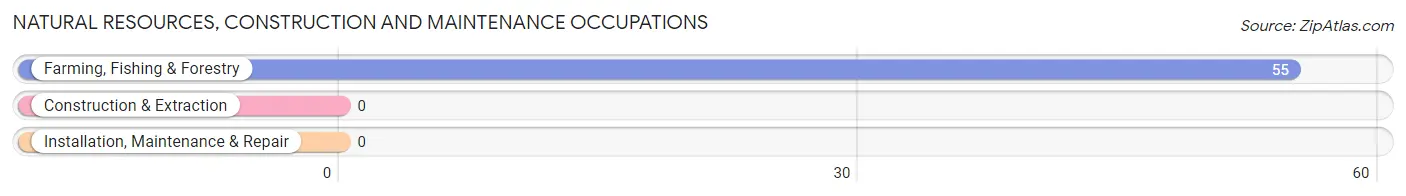
Natural Resources, Construction and Maintenance Occupations
The most common Natural Resources, Construction and Maintenance occupations in Northville are , and Farming, Fishing & Forestry (55 | 7.2%).
Natural Resources, Construction and Maintenance Occupations by Sex
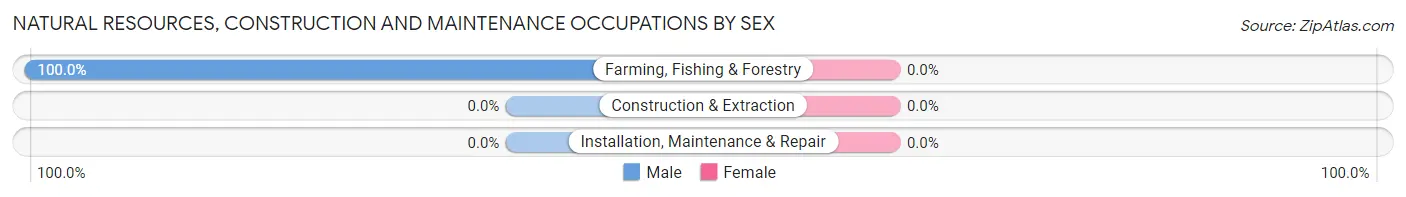
| Occupation | Male | Female |
| Farming, Fishing & Forestry | 55 (100.0%) | 0 (0.0%) |
| Construction & Extraction | 0 (0.0%) | 0 (0.0%) |
| Installation, Maintenance & Repair | 0 (0.0%) | 0 (0.0%) |
| Total (Category) | 55 (100.0%) | 0 (0.0%) |
| Total (Overall) | 583 (76.1%) | 183 (23.9%) |
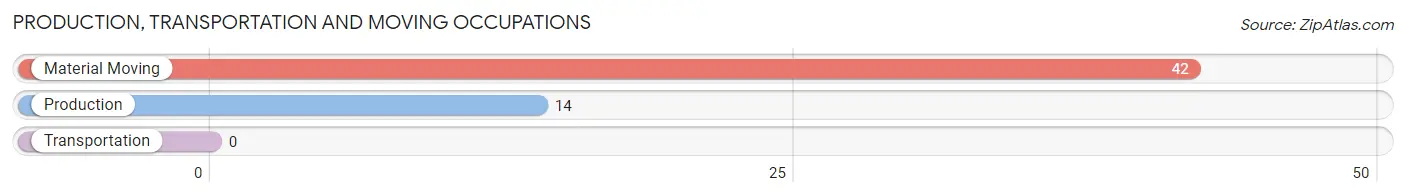
Production, Transportation and Moving Occupations
The most common Production, Transportation and Moving occupations in Northville are Material Moving (42 | 5.5%), and Production (14 | 1.8%).
Production, Transportation and Moving Occupations by Sex
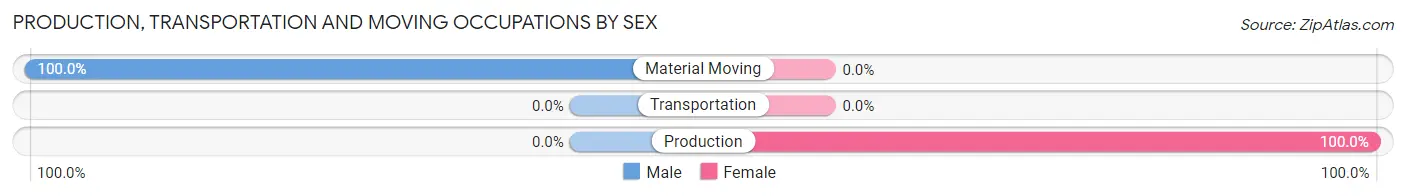
| Occupation | Male | Female |
| Production | 0 (0.0%) | 14 (100.0%) |
| Transportation | 0 (0.0%) | 0 (0.0%) |
| Material Moving | 42 (100.0%) | 0 (0.0%) |
| Total (Category) | 42 (75.0%) | 14 (25.0%) |
| Total (Overall) | 583 (76.1%) | 183 (23.9%) |
Employment Industries by Sex in Northville
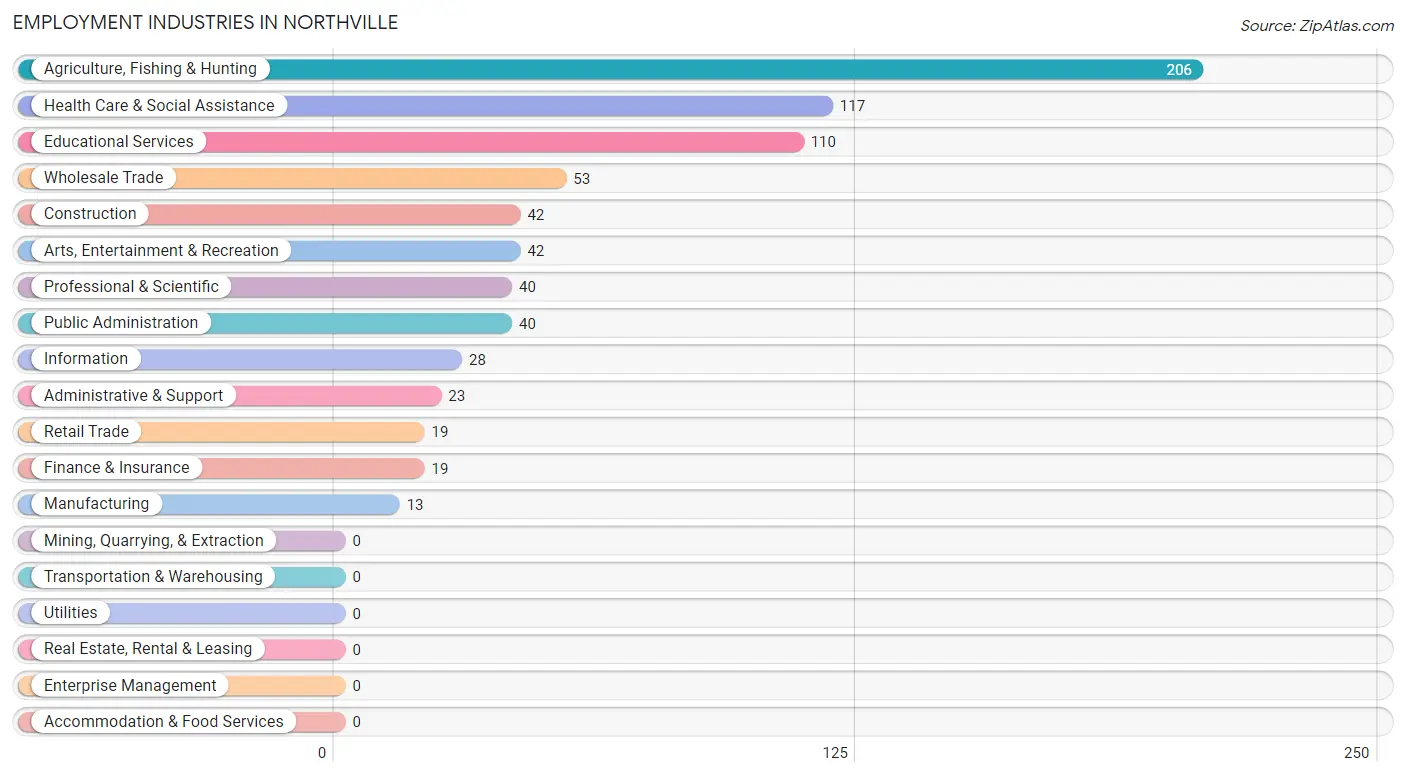
Employment Industries in Northville
The major employment industries in Northville include Agriculture, Fishing & Hunting (206 | 26.9%), Health Care & Social Assistance (117 | 15.3%), Educational Services (110 | 14.4%), Wholesale Trade (53 | 6.9%), and Construction (42 | 5.5%).
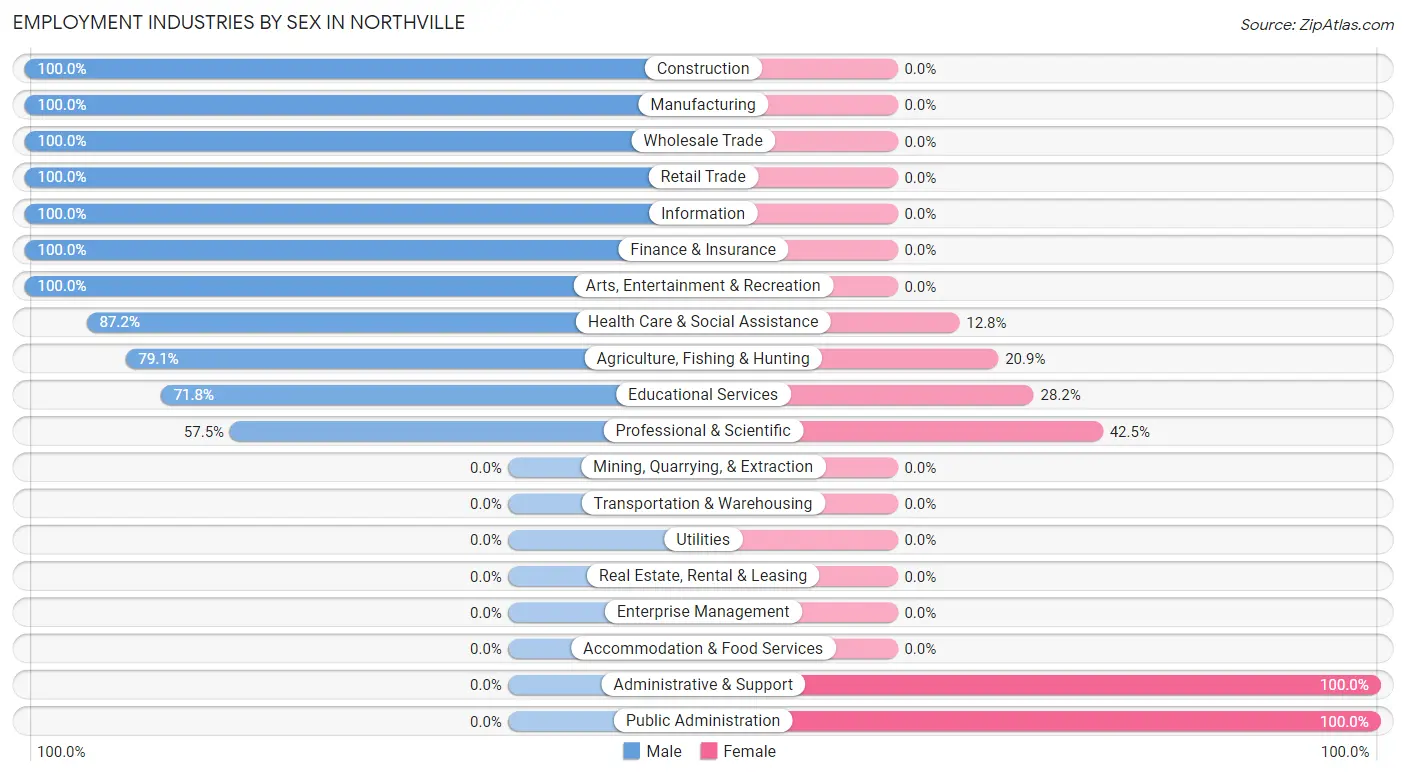
Employment Industries by Sex in Northville
The Northville industries that see more men than women are Construction (100.0%), Manufacturing (100.0%), and Wholesale Trade (100.0%), whereas the industries that tend to have a higher number of women are Administrative & Support (100.0%), Public Administration (100.0%), and Professional & Scientific (42.5%).
| Industry | Male | Female |
| Agriculture, Fishing & Hunting | 163 (79.1%) | 43 (20.9%) |
| Mining, Quarrying, & Extraction | 0 (0.0%) | 0 (0.0%) |
| Construction | 42 (100.0%) | 0 (0.0%) |
| Manufacturing | 13 (100.0%) | 0 (0.0%) |
| Wholesale Trade | 53 (100.0%) | 0 (0.0%) |
| Retail Trade | 19 (100.0%) | 0 (0.0%) |
| Transportation & Warehousing | 0 (0.0%) | 0 (0.0%) |
| Utilities | 0 (0.0%) | 0 (0.0%) |
| Information | 28 (100.0%) | 0 (0.0%) |
| Finance & Insurance | 19 (100.0%) | 0 (0.0%) |
| Real Estate, Rental & Leasing | 0 (0.0%) | 0 (0.0%) |
| Professional & Scientific | 23 (57.5%) | 17 (42.5%) |
| Enterprise Management | 0 (0.0%) | 0 (0.0%) |
| Administrative & Support | 0 (0.0%) | 23 (100.0%) |
| Educational Services | 79 (71.8%) | 31 (28.2%) |
| Health Care & Social Assistance | 102 (87.2%) | 15 (12.8%) |
| Arts, Entertainment & Recreation | 42 (100.0%) | 0 (0.0%) |
| Accommodation & Food Services | 0 (0.0%) | 0 (0.0%) |
| Public Administration | 0 (0.0%) | 40 (100.0%) |
| Total | 583 (76.1%) | 183 (23.9%) |
Education in Northville
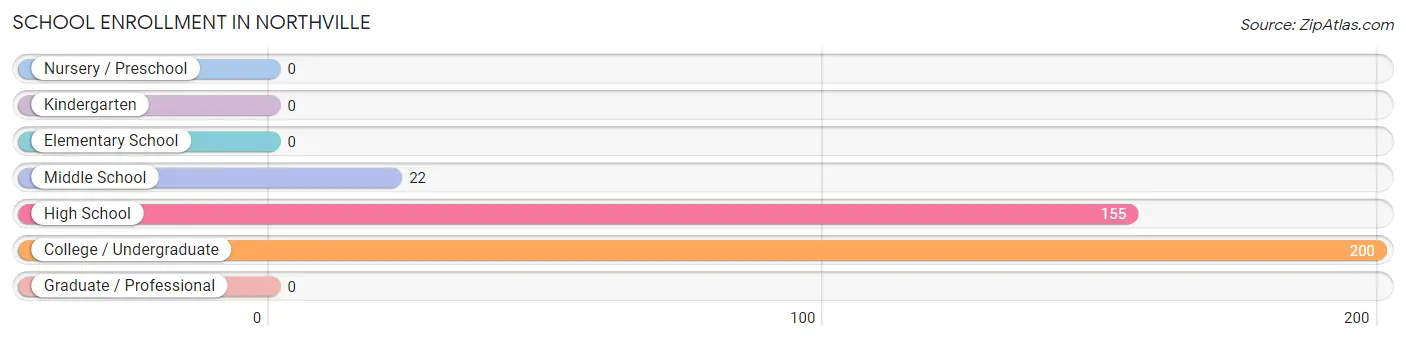
School Enrollment in Northville
The most common levels of schooling among the 377 students in Northville are college / undergraduate (200 | 53.0%), high school (155 | 41.1%), and middle school (22 | 5.8%).
| School Level | # Students | % Students |
| Nursery / Preschool | 0 | 0.0% |
| Kindergarten | 0 | 0.0% |
| Elementary School | 0 | 0.0% |
| Middle School | 22 | 5.8% |
| High School | 155 | 41.1% |
| College / Undergraduate | 200 | 53.0% |
| Graduate / Professional | 0 | 0.0% |
| Total | 377 | 100.0% |
School Enrollment by Age by Funding Source in Northville
Out of a total of 377 students who are enrolled in schools in Northville, 114 (30.2%) attend a private institution, while the remaining 263 (69.8%) are enrolled in public schools. The age group of 10 to 14 year olds has the highest likelihood of being enrolled in private schools, with 54 (71.1% in the age bracket) enrolled. Conversely, the age group of 15 to 17 year olds has the lowest likelihood of being enrolled in a private school, with 101 (100.0% in the age bracket) attending a public institution.
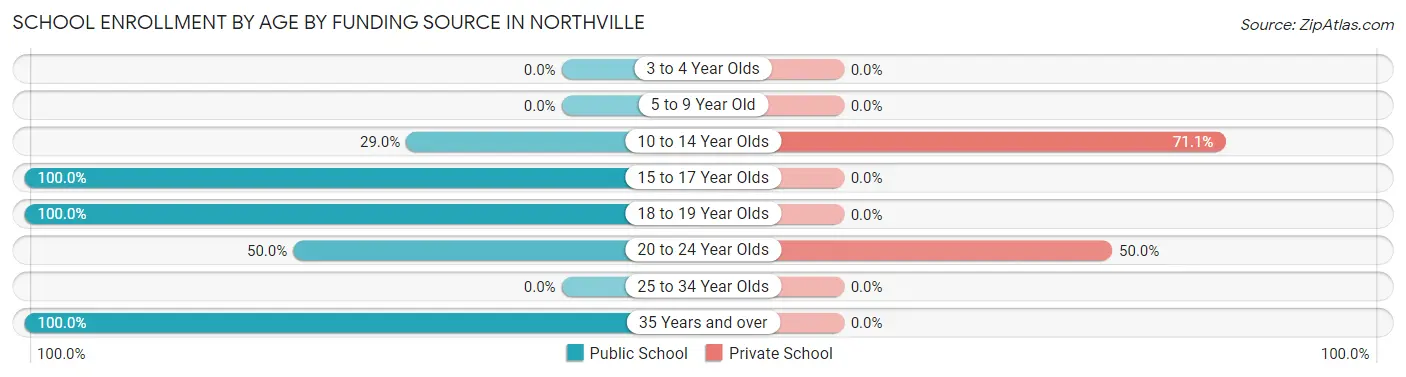
| Age Bracket | Public School | Private School |
| 3 to 4 Year Olds | 0 (0.0%) | 0 (0.0%) |
| 5 to 9 Year Old | 0 (0.0%) | 0 (0.0%) |
| 10 to 14 Year Olds | 22 (28.9%) | 54 (71.1%) |
| 15 to 17 Year Olds | 101 (100.0%) | 0 (0.0%) |
| 18 to 19 Year Olds | 58 (100.0%) | 0 (0.0%) |
| 20 to 24 Year Olds | 60 (50.0%) | 60 (50.0%) |
| 25 to 34 Year Olds | 0 (0.0%) | 0 (0.0%) |
| 35 Years and over | 22 (100.0%) | 0 (0.0%) |
| Total | 263 (69.8%) | 114 (30.2%) |
Educational Attainment by Field of Study in Northville
Education (162 | 25.9%), social sciences (96 | 15.4%), liberal arts & history (92 | 14.7%), bio, nature & agricultural (69 | 11.0%), and business (59 | 9.4%) are the most common fields of study among 625 individuals in Northville who have obtained a bachelor's degree or higher.
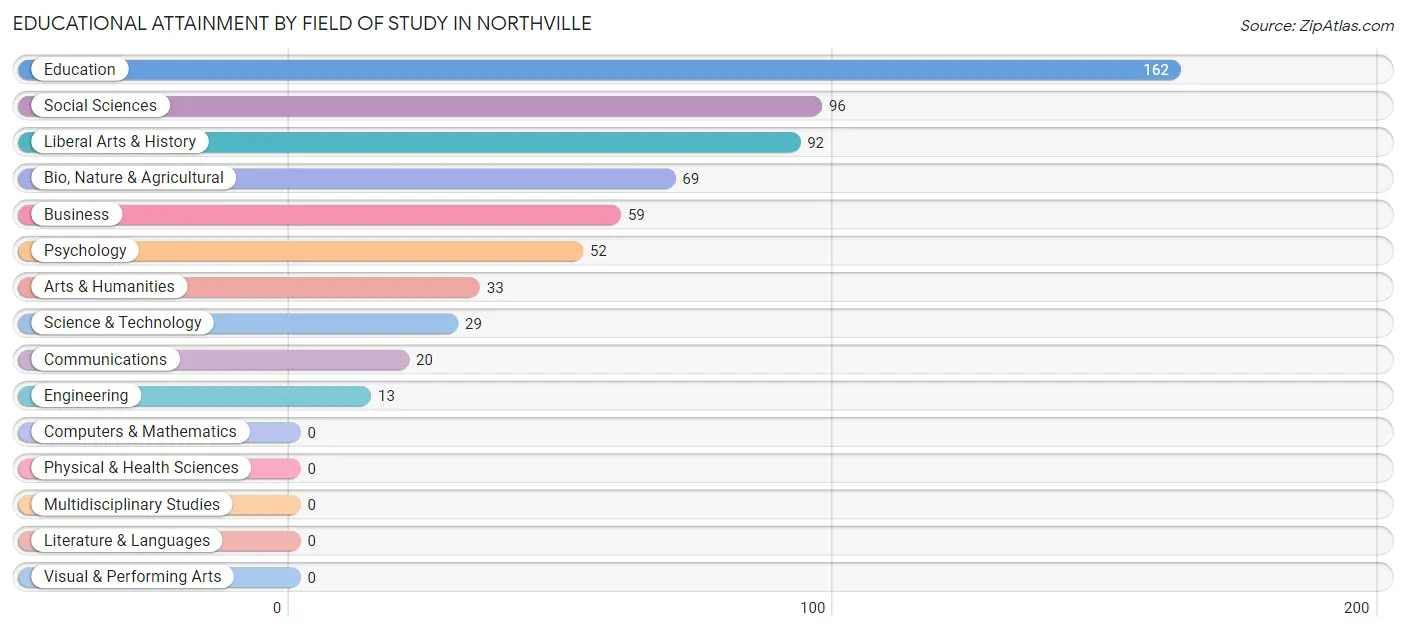
| Field of Study | # Graduates | % Graduates |
| Computers & Mathematics | 0 | 0.0% |
| Bio, Nature & Agricultural | 69 | 11.0% |
| Physical & Health Sciences | 0 | 0.0% |
| Psychology | 52 | 8.3% |
| Social Sciences | 96 | 15.4% |
| Engineering | 13 | 2.1% |
| Multidisciplinary Studies | 0 | 0.0% |
| Science & Technology | 29 | 4.6% |
| Business | 59 | 9.4% |
| Education | 162 | 25.9% |
| Literature & Languages | 0 | 0.0% |
| Liberal Arts & History | 92 | 14.7% |
| Visual & Performing Arts | 0 | 0.0% |
| Communications | 20 | 3.2% |
| Arts & Humanities | 33 | 5.3% |
| Total | 625 | 100.0% |
Transportation & Commute in Northville
Vehicle Availability by Sex in Northville
The most prevalent vehicle ownership categories in Northville are males with 2 vehicles (181, accounting for 34.8%) and females with 2 vehicles (65, making up 107.1%).
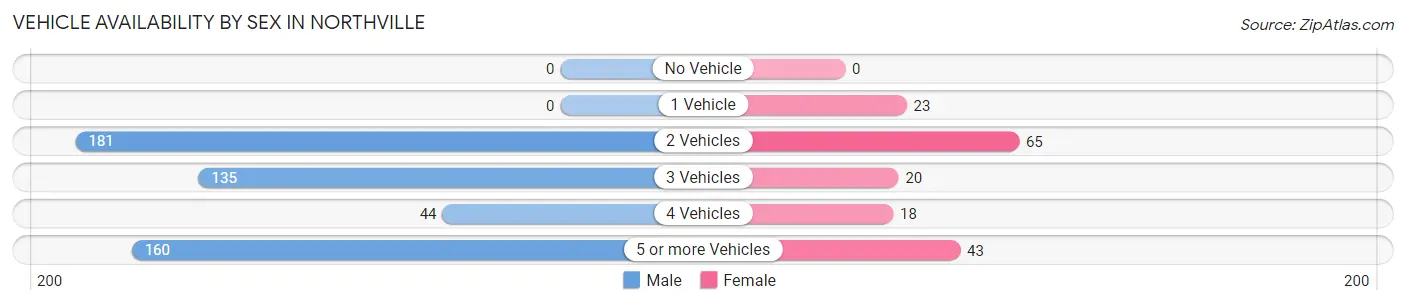
| Vehicles Available | Male | Female |
| No Vehicle | 0 (0.0%) | 0 (0.0%) |
| 1 Vehicle | 0 (0.0%) | 23 (13.6%) |
| 2 Vehicles | 181 (34.8%) | 65 (38.5%) |
| 3 Vehicles | 135 (26.0%) | 20 (11.8%) |
| 4 Vehicles | 44 (8.5%) | 18 (10.6%) |
| 5 or more Vehicles | 160 (30.8%) | 43 (25.4%) |
| Total | 520 (100.0%) | 169 (100.0%) |
Commute Time in Northville
The most frequently occuring commute durations in Northville are less than 5 minutes (180 commuters, 28.6%), 5 to 9 minutes (95 commuters, 15.1%), and 30 to 34 minutes (95 commuters, 15.1%).
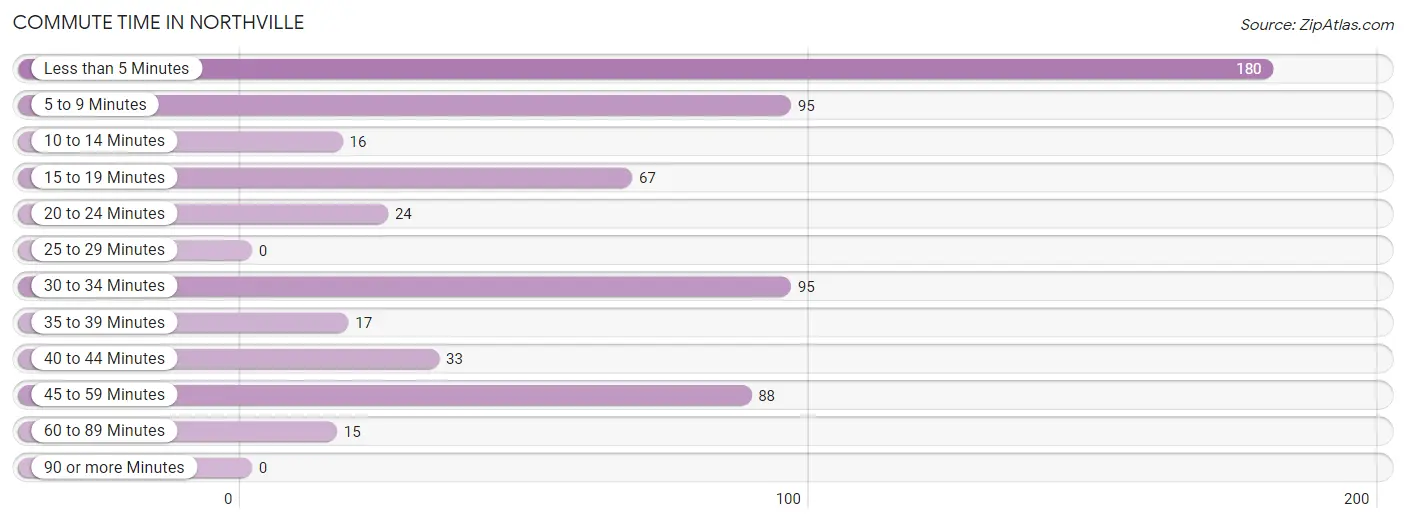
| Commute Time | # Commuters | % Commuters |
| Less than 5 Minutes | 180 | 28.6% |
| 5 to 9 Minutes | 95 | 15.1% |
| 10 to 14 Minutes | 16 | 2.5% |
| 15 to 19 Minutes | 67 | 10.6% |
| 20 to 24 Minutes | 24 | 3.8% |
| 25 to 29 Minutes | 0 | 0.0% |
| 30 to 34 Minutes | 95 | 15.1% |
| 35 to 39 Minutes | 17 | 2.7% |
| 40 to 44 Minutes | 33 | 5.2% |
| 45 to 59 Minutes | 88 | 14.0% |
| 60 to 89 Minutes | 15 | 2.4% |
| 90 or more Minutes | 0 | 0.0% |
Commute Time by Sex in Northville
The most common commute times in Northville are less than 5 minutes (119 commuters, 22.9%) for males and less than 5 minutes (61 commuters, 55.4%) for females.
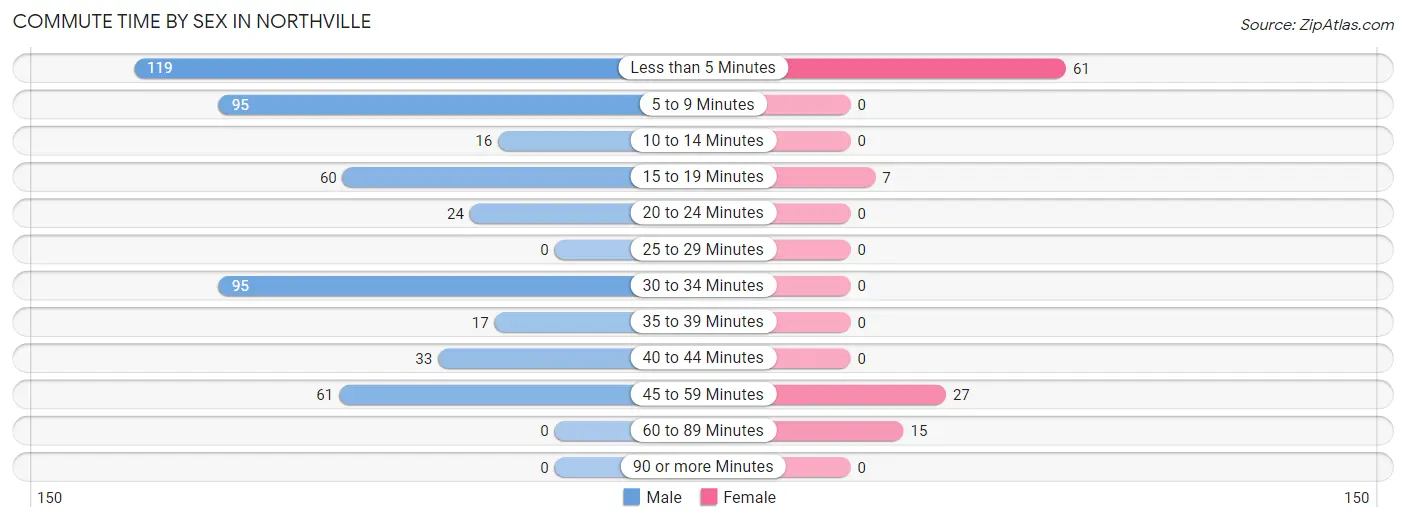
| Commute Time | Male | Female |
| Less than 5 Minutes | 119 (22.9%) | 61 (55.4%) |
| 5 to 9 Minutes | 95 (18.3%) | 0 (0.0%) |
| 10 to 14 Minutes | 16 (3.1%) | 0 (0.0%) |
| 15 to 19 Minutes | 60 (11.5%) | 7 (6.4%) |
| 20 to 24 Minutes | 24 (4.6%) | 0 (0.0%) |
| 25 to 29 Minutes | 0 (0.0%) | 0 (0.0%) |
| 30 to 34 Minutes | 95 (18.3%) | 0 (0.0%) |
| 35 to 39 Minutes | 17 (3.3%) | 0 (0.0%) |
| 40 to 44 Minutes | 33 (6.4%) | 0 (0.0%) |
| 45 to 59 Minutes | 61 (11.7%) | 27 (24.5%) |
| 60 to 89 Minutes | 0 (0.0%) | 15 (13.6%) |
| 90 or more Minutes | 0 (0.0%) | 0 (0.0%) |
Time of Departure to Work by Sex in Northville
The most frequent times of departure to work in Northville are 8:00 AM to 8:29 AM (173, 33.3%) for males and 8:00 AM to 8:29 AM (68, 61.8%) for females.
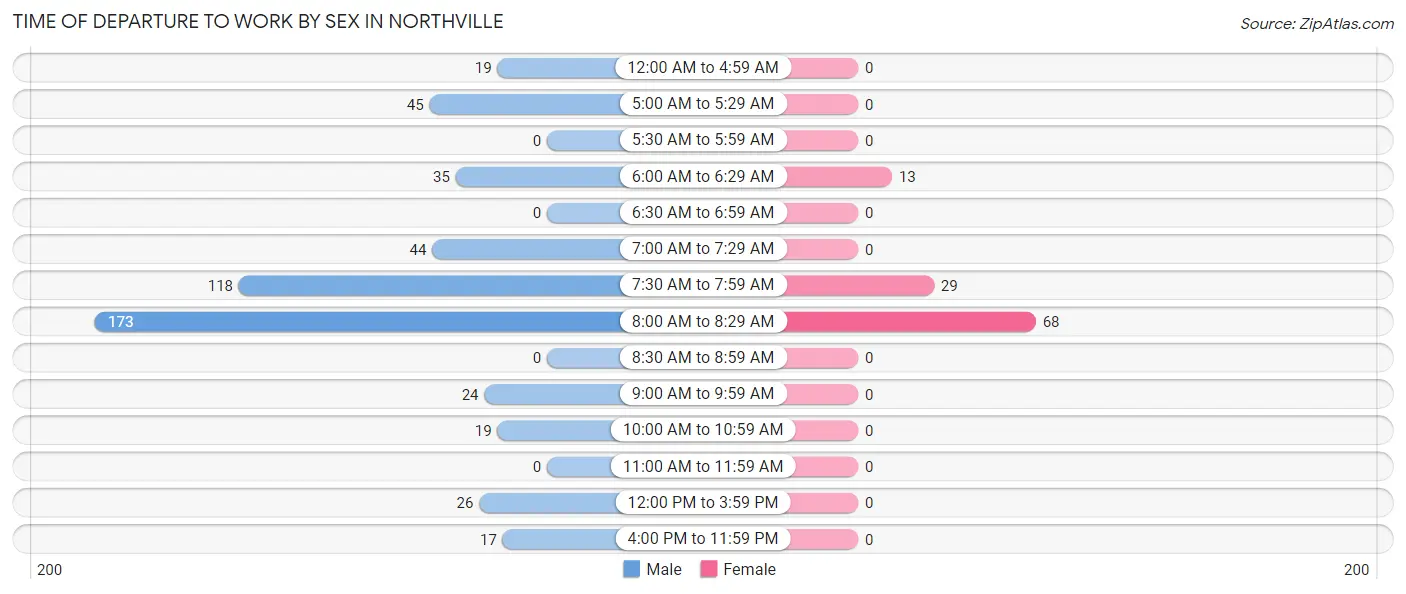
| Time of Departure | Male | Female |
| 12:00 AM to 4:59 AM | 19 (3.6%) | 0 (0.0%) |
| 5:00 AM to 5:29 AM | 45 (8.6%) | 0 (0.0%) |
| 5:30 AM to 5:59 AM | 0 (0.0%) | 0 (0.0%) |
| 6:00 AM to 6:29 AM | 35 (6.7%) | 13 (11.8%) |
| 6:30 AM to 6:59 AM | 0 (0.0%) | 0 (0.0%) |
| 7:00 AM to 7:29 AM | 44 (8.5%) | 0 (0.0%) |
| 7:30 AM to 7:59 AM | 118 (22.7%) | 29 (26.4%) |
| 8:00 AM to 8:29 AM | 173 (33.3%) | 68 (61.8%) |
| 8:30 AM to 8:59 AM | 0 (0.0%) | 0 (0.0%) |
| 9:00 AM to 9:59 AM | 24 (4.6%) | 0 (0.0%) |
| 10:00 AM to 10:59 AM | 19 (3.6%) | 0 (0.0%) |
| 11:00 AM to 11:59 AM | 0 (0.0%) | 0 (0.0%) |
| 12:00 PM to 3:59 PM | 26 (5.0%) | 0 (0.0%) |
| 4:00 PM to 11:59 PM | 17 (3.3%) | 0 (0.0%) |
| Total | 520 (100.0%) | 110 (100.0%) |
Housing Occupancy in Northville
Occupancy by Ownership in Northville
Of the total 633 dwellings in Northville, owner-occupied units account for 593 (93.7%), while renter-occupied units make up 40 (6.3%).
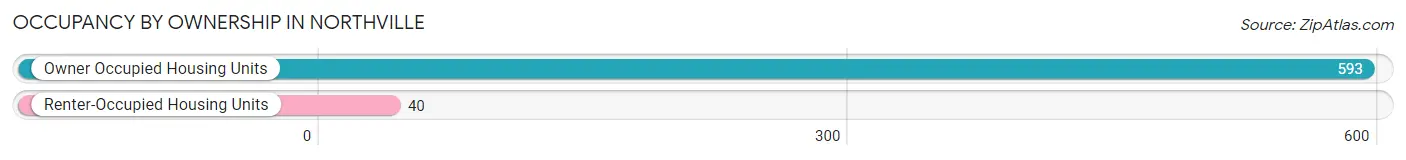
| Occupancy | # Housing Units | % Housing Units |
| Owner Occupied Housing Units | 593 | 93.7% |
| Renter-Occupied Housing Units | 40 | 6.3% |
| Total Occupied Housing Units | 633 | 100.0% |
Occupancy by Household Size in Northville
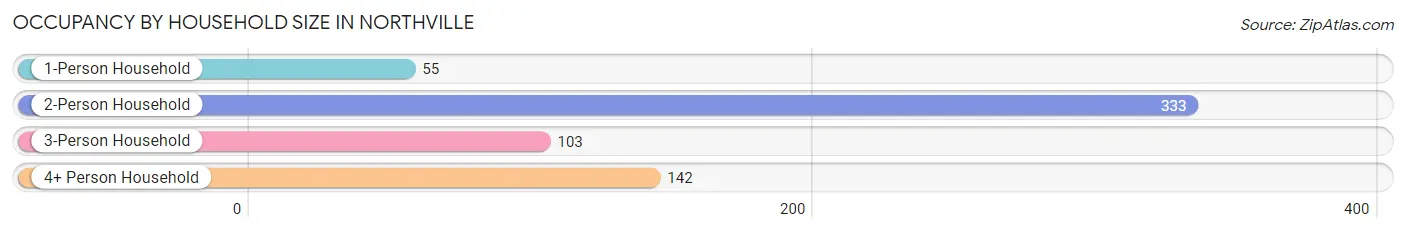
| Household Size | # Housing Units | % Housing Units |
| 1-Person Household | 55 | 8.7% |
| 2-Person Household | 333 | 52.6% |
| 3-Person Household | 103 | 16.3% |
| 4+ Person Household | 142 | 22.4% |
| Total Housing Units | 633 | 100.0% |
Occupancy by Ownership by Household Size in Northville
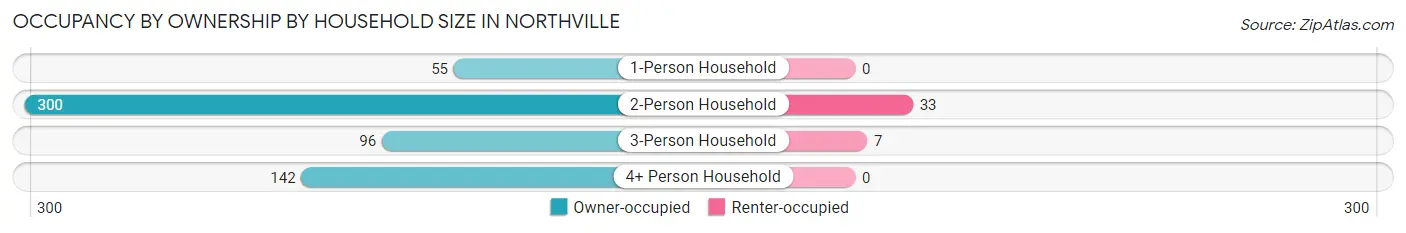
| Household Size | Owner-occupied | Renter-occupied |
| 1-Person Household | 55 (100.0%) | 0 (0.0%) |
| 2-Person Household | 300 (90.1%) | 33 (9.9%) |
| 3-Person Household | 96 (93.2%) | 7 (6.8%) |
| 4+ Person Household | 142 (100.0%) | 0 (0.0%) |
| Total Housing Units | 593 (93.7%) | 40 (6.3%) |
Occupancy by Educational Attainment in Northville
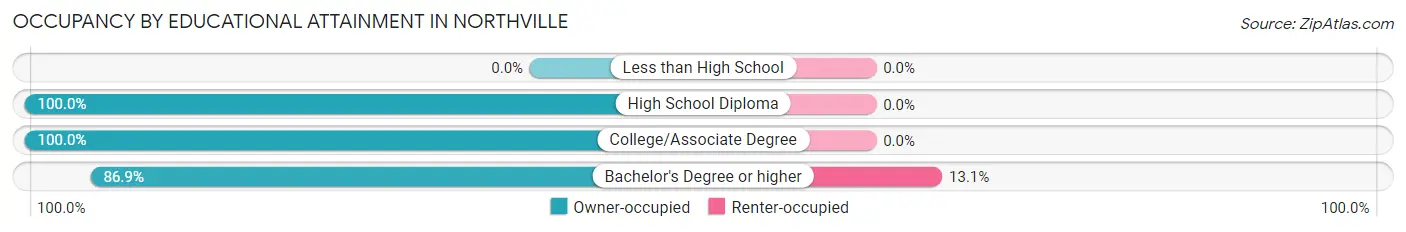
| Household Size | Owner-occupied | Renter-occupied |
| Less than High School | 0 (0.0%) | 0 (0.0%) |
| High School Diploma | 153 (100.0%) | 0 (0.0%) |
| College/Associate Degree | 174 (100.0%) | 0 (0.0%) |
| Bachelor's Degree or higher | 266 (86.9%) | 40 (13.1%) |
Occupancy by Age of Householder in Northville
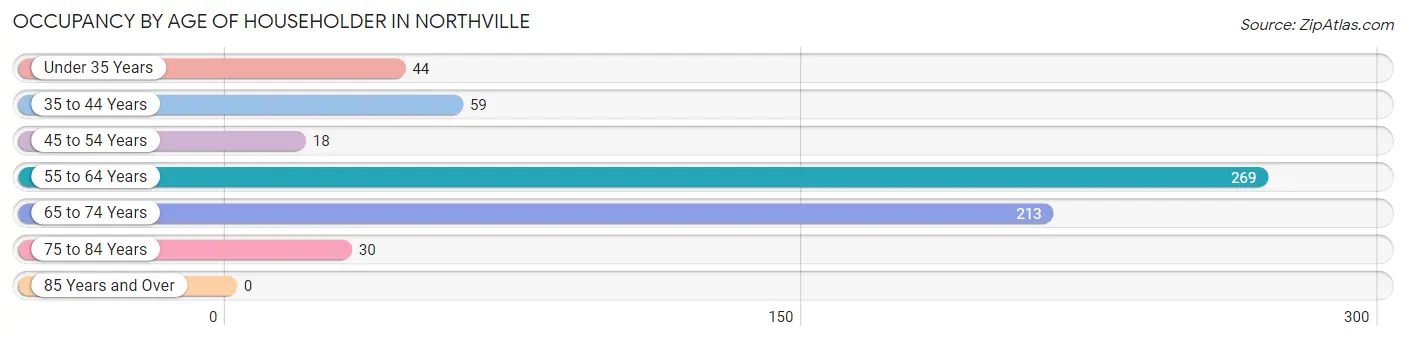
| Age Bracket | # Households | % Households |
| Under 35 Years | 44 | 7.0% |
| 35 to 44 Years | 59 | 9.3% |
| 45 to 54 Years | 18 | 2.8% |
| 55 to 64 Years | 269 | 42.5% |
| 65 to 74 Years | 213 | 33.7% |
| 75 to 84 Years | 30 | 4.7% |
| 85 Years and Over | 0 | 0.0% |
| Total | 633 | 100.0% |
Housing Finances in Northville
Median Income by Occupancy in Northville
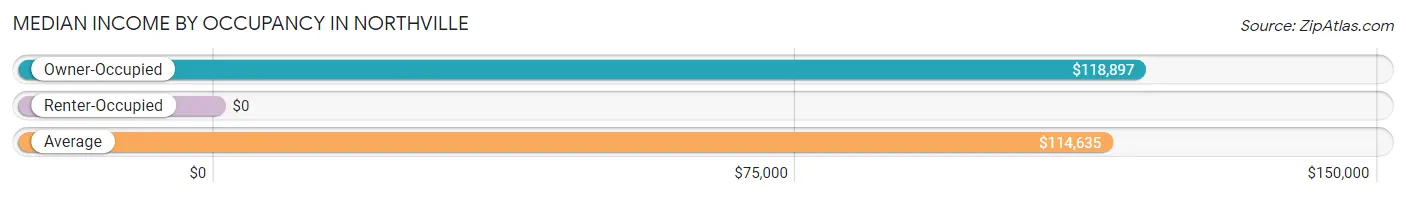
| Occupancy Type | # Households | Median Income |
| Owner-Occupied | 593 (93.7%) | $118,897 |
| Renter-Occupied | 40 (6.3%) | $0 |
| Average | 633 (100.0%) | $114,635 |
Occupancy by Householder Income Bracket in Northville
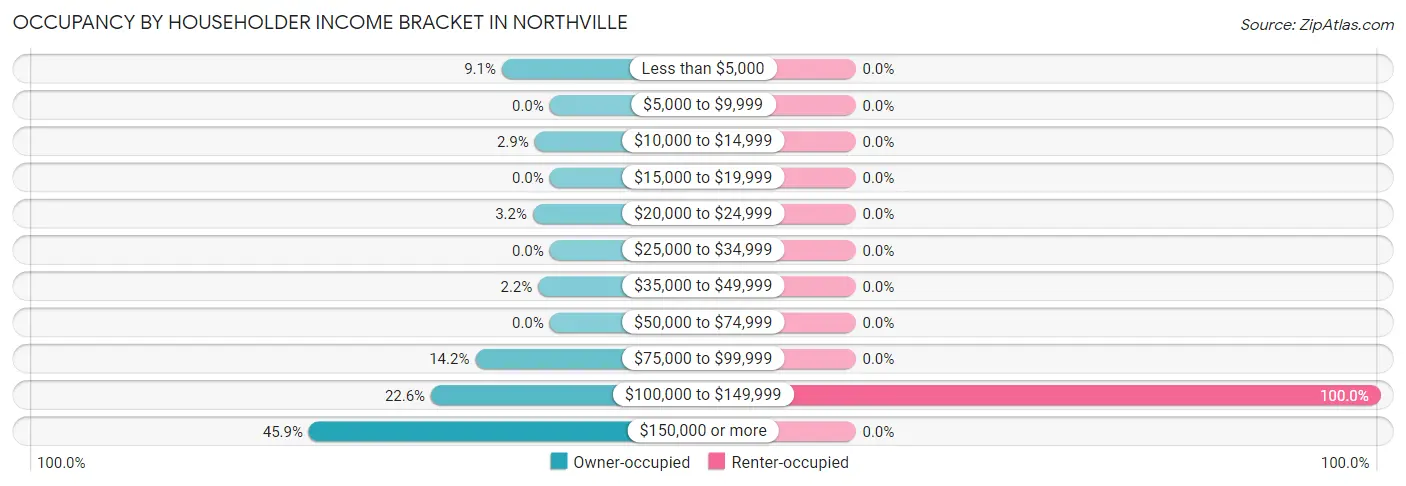
| Income Bracket | Owner-occupied | Renter-occupied |
| Less than $5,000 | 54 (9.1%) | 0 (0.0%) |
| $5,000 to $9,999 | 0 (0.0%) | 0 (0.0%) |
| $10,000 to $14,999 | 17 (2.9%) | 0 (0.0%) |
| $15,000 to $19,999 | 0 (0.0%) | 0 (0.0%) |
| $20,000 to $24,999 | 19 (3.2%) | 0 (0.0%) |
| $25,000 to $34,999 | 0 (0.0%) | 0 (0.0%) |
| $35,000 to $49,999 | 13 (2.2%) | 0 (0.0%) |
| $50,000 to $74,999 | 0 (0.0%) | 0 (0.0%) |
| $75,000 to $99,999 | 84 (14.2%) | 0 (0.0%) |
| $100,000 to $149,999 | 134 (22.6%) | 40 (100.0%) |
| $150,000 or more | 272 (45.9%) | 0 (0.0%) |
| Total | 593 (100.0%) | 40 (100.0%) |
Monthly Housing Cost Tiers in Northville
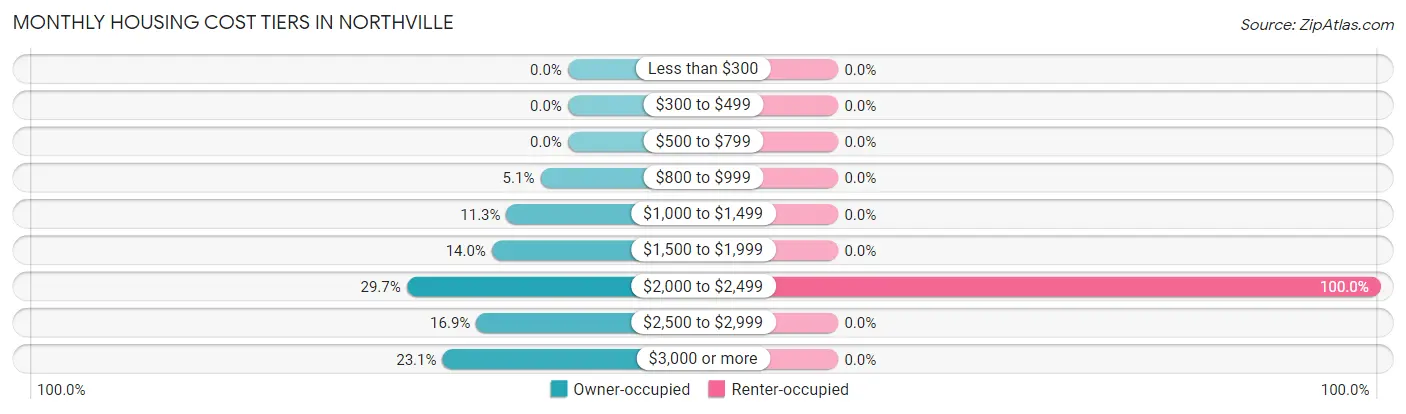
| Monthly Cost | Owner-occupied | Renter-occupied |
| Less than $300 | 0 (0.0%) | 0 (0.0%) |
| $300 to $499 | 0 (0.0%) | 0 (0.0%) |
| $500 to $799 | 0 (0.0%) | 0 (0.0%) |
| $800 to $999 | 30 (5.1%) | 0 (0.0%) |
| $1,000 to $1,499 | 67 (11.3%) | 0 (0.0%) |
| $1,500 to $1,999 | 83 (14.0%) | 0 (0.0%) |
| $2,000 to $2,499 | 176 (29.7%) | 40 (100.0%) |
| $2,500 to $2,999 | 100 (16.9%) | 0 (0.0%) |
| $3,000 or more | 137 (23.1%) | 0 (0.0%) |
| Total | 593 (100.0%) | 40 (100.0%) |
Physical Housing Characteristics in Northville
Housing Structures in Northville
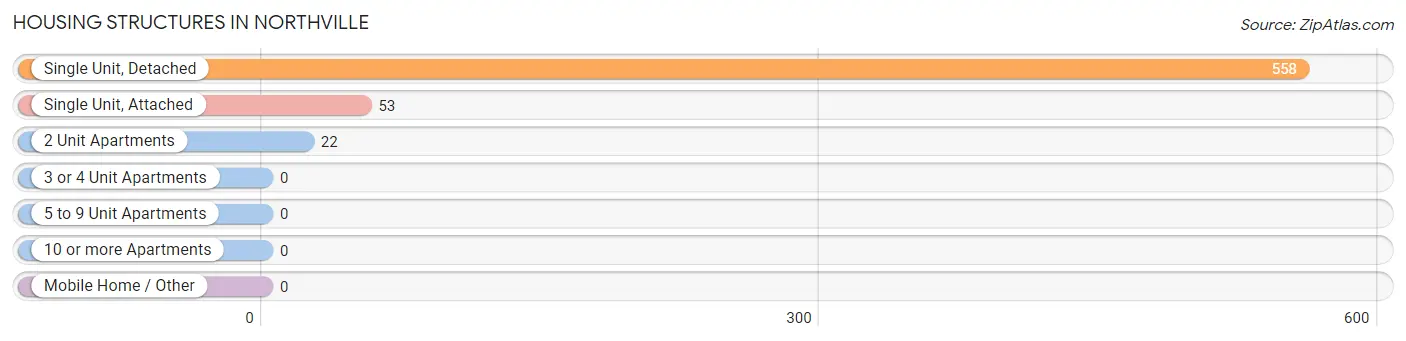
| Structure Type | # Housing Units | % Housing Units |
| Single Unit, Detached | 558 | 88.1% |
| Single Unit, Attached | 53 | 8.4% |
| 2 Unit Apartments | 22 | 3.5% |
| 3 or 4 Unit Apartments | 0 | 0.0% |
| 5 to 9 Unit Apartments | 0 | 0.0% |
| 10 or more Apartments | 0 | 0.0% |
| Mobile Home / Other | 0 | 0.0% |
| Total | 633 | 100.0% |
Housing Structures by Occupancy in Northville
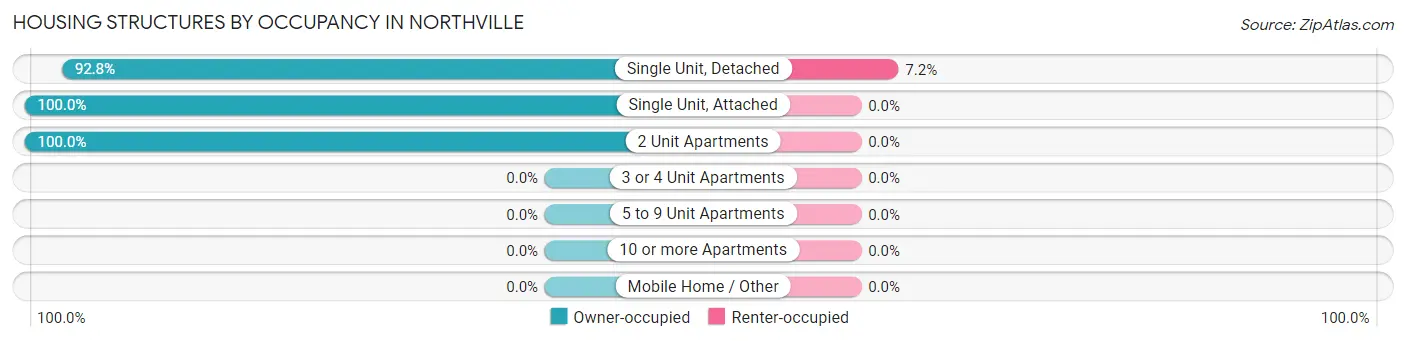
| Structure Type | Owner-occupied | Renter-occupied |
| Single Unit, Detached | 518 (92.8%) | 40 (7.2%) |
| Single Unit, Attached | 53 (100.0%) | 0 (0.0%) |
| 2 Unit Apartments | 22 (100.0%) | 0 (0.0%) |
| 3 or 4 Unit Apartments | 0 (0.0%) | 0 (0.0%) |
| 5 to 9 Unit Apartments | 0 (0.0%) | 0 (0.0%) |
| 10 or more Apartments | 0 (0.0%) | 0 (0.0%) |
| Mobile Home / Other | 0 (0.0%) | 0 (0.0%) |
| Total | 593 (93.7%) | 40 (6.3%) |
Housing Structures by Number of Rooms in Northville
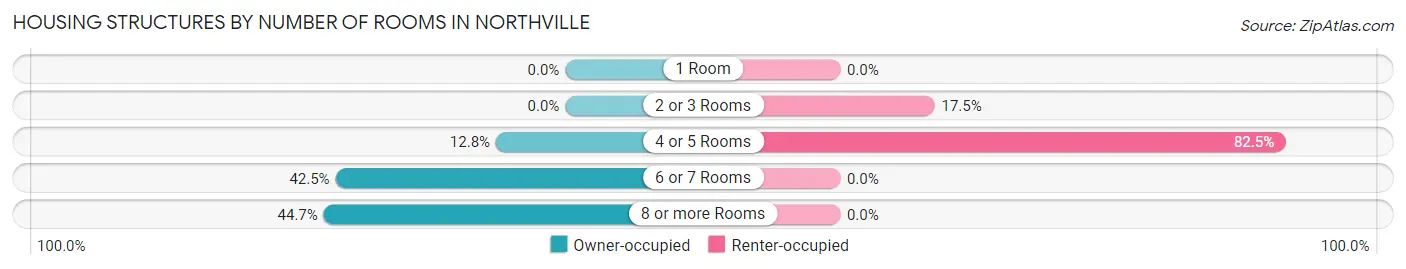
| Number of Rooms | Owner-occupied | Renter-occupied |
| 1 Room | 0 (0.0%) | 0 (0.0%) |
| 2 or 3 Rooms | 0 (0.0%) | 7 (17.5%) |
| 4 or 5 Rooms | 76 (12.8%) | 33 (82.5%) |
| 6 or 7 Rooms | 252 (42.5%) | 0 (0.0%) |
| 8 or more Rooms | 265 (44.7%) | 0 (0.0%) |
| Total | 593 (100.0%) | 40 (100.0%) |
Housing Structure by Heating Type in Northville
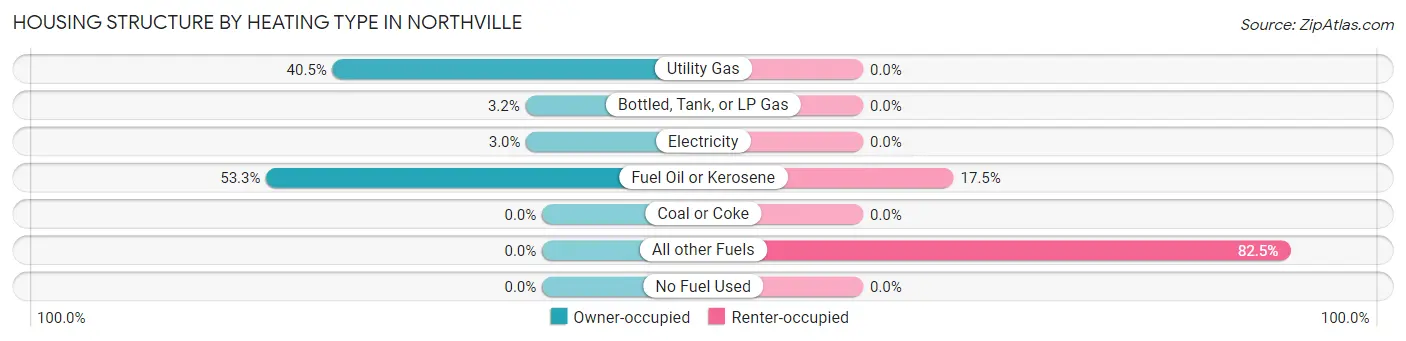
| Heating Type | Owner-occupied | Renter-occupied |
| Utility Gas | 240 (40.5%) | 0 (0.0%) |
| Bottled, Tank, or LP Gas | 19 (3.2%) | 0 (0.0%) |
| Electricity | 18 (3.0%) | 0 (0.0%) |
| Fuel Oil or Kerosene | 316 (53.3%) | 7 (17.5%) |
| Coal or Coke | 0 (0.0%) | 0 (0.0%) |
| All other Fuels | 0 (0.0%) | 33 (82.5%) |
| No Fuel Used | 0 (0.0%) | 0 (0.0%) |
| Total | 593 (100.0%) | 40 (100.0%) |
Household Vehicle Usage in Northville
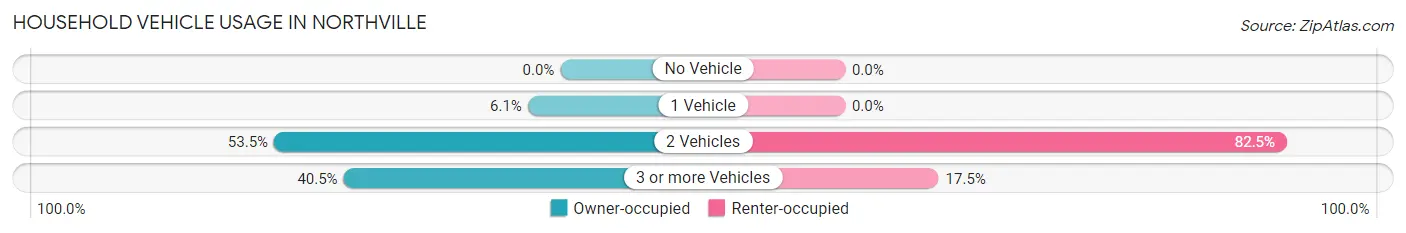
| Vehicles per Household | Owner-occupied | Renter-occupied |
| No Vehicle | 0 (0.0%) | 0 (0.0%) |
| 1 Vehicle | 36 (6.1%) | 0 (0.0%) |
| 2 Vehicles | 317 (53.5%) | 33 (82.5%) |
| 3 or more Vehicles | 240 (40.5%) | 7 (17.5%) |
| Total | 593 (100.0%) | 40 (100.0%) |
Real Estate & Mortgages in Northville
Real Estate and Mortgage Overview in Northville
| Characteristic | Without Mortgage | With Mortgage |
| Housing Units | 95 | 250 |
| Median Property Value | $103,500 | $638,300 |
| Median Household Income | $51,806 | $125 |
| Monthly Housing Costs | $379 | $137 |
| Real Estate Taxes | $3,054 | $0 |
Property Value by Mortgage Status in Northville
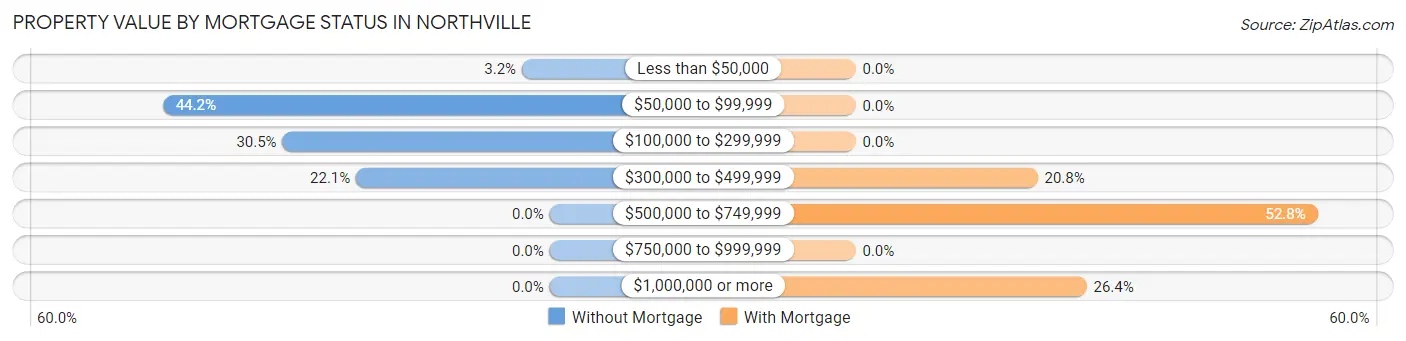
| Property Value | Without Mortgage | With Mortgage |
| Less than $50,000 | 3 (3.2%) | 0 (0.0%) |
| $50,000 to $99,999 | 42 (44.2%) | 0 (0.0%) |
| $100,000 to $299,999 | 29 (30.5%) | 0 (0.0%) |
| $300,000 to $499,999 | 21 (22.1%) | 52 (20.8%) |
| $500,000 to $749,999 | 0 (0.0%) | 132 (52.8%) |
| $750,000 to $999,999 | 0 (0.0%) | 0 (0.0%) |
| $1,000,000 or more | 0 (0.0%) | 66 (26.4%) |
| Total | 95 (100.0%) | 250 (100.0%) |
Household Income by Mortgage Status in Northville
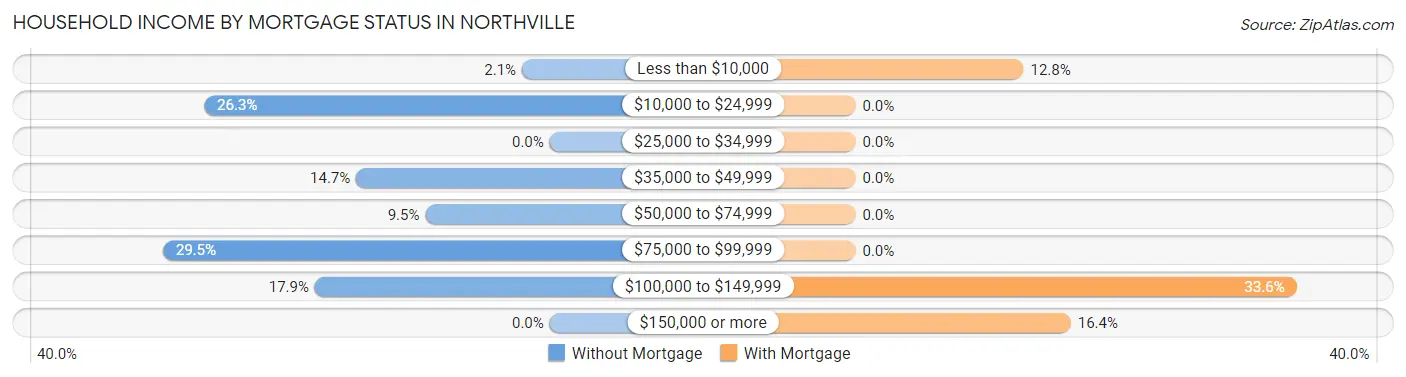
| Household Income | Without Mortgage | With Mortgage |
| Less than $10,000 | 2 (2.1%) | 32 (12.8%) |
| $10,000 to $24,999 | 25 (26.3%) | 0 (0.0%) |
| $25,000 to $34,999 | 0 (0.0%) | 0 (0.0%) |
| $35,000 to $49,999 | 14 (14.7%) | 0 (0.0%) |
| $50,000 to $74,999 | 9 (9.5%) | 0 (0.0%) |
| $75,000 to $99,999 | 28 (29.5%) | 0 (0.0%) |
| $100,000 to $149,999 | 17 (17.9%) | 84 (33.6%) |
| $150,000 or more | 0 (0.0%) | 41 (16.4%) |
| Total | 95 (100.0%) | 250 (100.0%) |
Property Value to Household Income Ratio in Northville
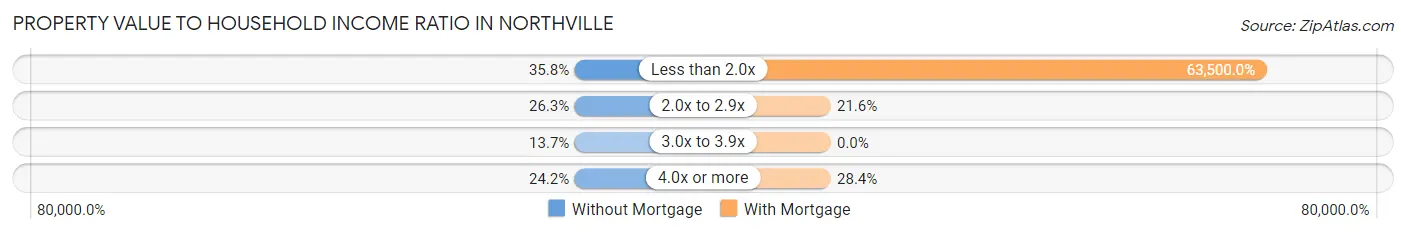
| Value-to-Income Ratio | Without Mortgage | With Mortgage |
| Less than 2.0x | 34 (35.8%) | 158,750 (63,500.0%) |
| 2.0x to 2.9x | 25 (26.3%) | 54 (21.6%) |
| 3.0x to 3.9x | 13 (13.7%) | 0 (0.0%) |
| 4.0x or more | 23 (24.2%) | 71 (28.4%) |
| Total | 95 (100.0%) | 250 (100.0%) |
Real Estate Taxes by Mortgage Status in Northville
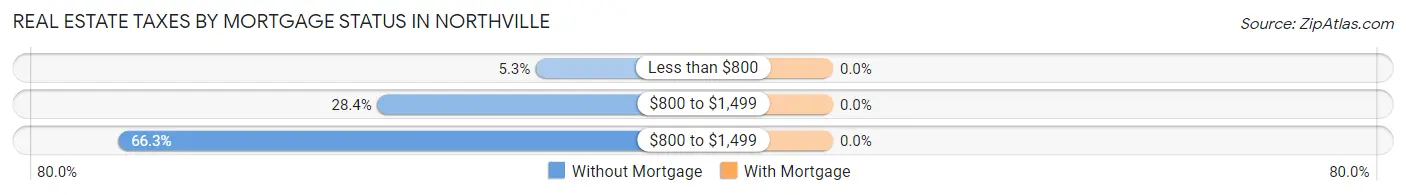
| Property Taxes | Without Mortgage | With Mortgage |
| Less than $800 | 5 (5.3%) | 0 (0.0%) |
| $800 to $1,499 | 27 (28.4%) | 0 (0.0%) |
| $800 to $1,499 | 63 (66.3%) | 0 (0.0%) |
| Total | 95 (100.0%) | 250 (100.0%) |
Health & Disability in Northville
Health Insurance Coverage by Age in Northville
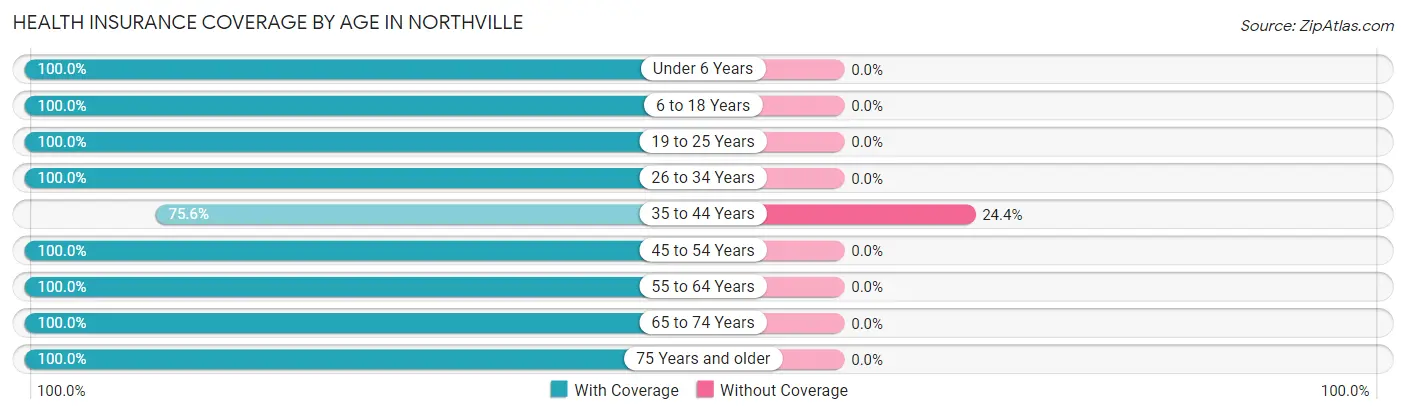
| Age Bracket | With Coverage | Without Coverage |
| Under 6 Years | 92 (100.0%) | 0 (0.0%) |
| 6 to 18 Years | 177 (100.0%) | 0 (0.0%) |
| 19 to 25 Years | 260 (100.0%) | 0 (0.0%) |
| 26 to 34 Years | 44 (100.0%) | 0 (0.0%) |
| 35 to 44 Years | 130 (75.6%) | 42 (24.4%) |
| 45 to 54 Years | 67 (100.0%) | 0 (0.0%) |
| 55 to 64 Years | 399 (100.0%) | 0 (0.0%) |
| 65 to 74 Years | 472 (100.0%) | 0 (0.0%) |
| 75 Years and older | 146 (100.0%) | 0 (0.0%) |
| Total | 1,787 (97.7%) | 42 (2.3%) |
Health Insurance Coverage by Citizenship Status in Northville
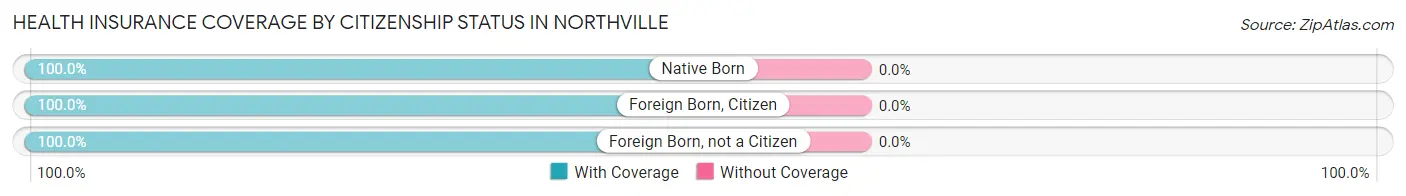
| Citizenship Status | With Coverage | Without Coverage |
| Native Born | 92 (100.0%) | 0 (0.0%) |
| Foreign Born, Citizen | 177 (100.0%) | 0 (0.0%) |
| Foreign Born, not a Citizen | 260 (100.0%) | 0 (0.0%) |
Health Insurance Coverage by Household Income in Northville
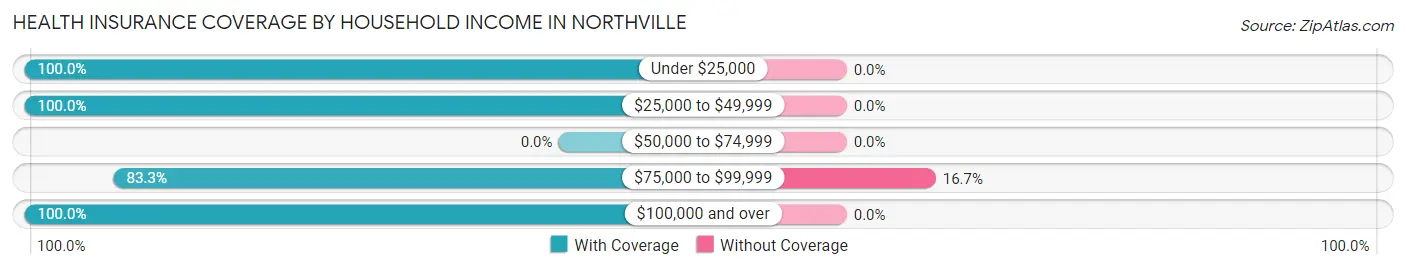
| Household Income | With Coverage | Without Coverage |
| Under $25,000 | 176 (100.0%) | 0 (0.0%) |
| $25,000 to $49,999 | 13 (100.0%) | 0 (0.0%) |
| $50,000 to $74,999 | 0 (0.0%) | 0 (0.0%) |
| $75,000 to $99,999 | 210 (83.3%) | 42 (16.7%) |
| $100,000 and over | 1,342 (100.0%) | 0 (0.0%) |
Public vs Private Health Insurance Coverage by Age in Northville
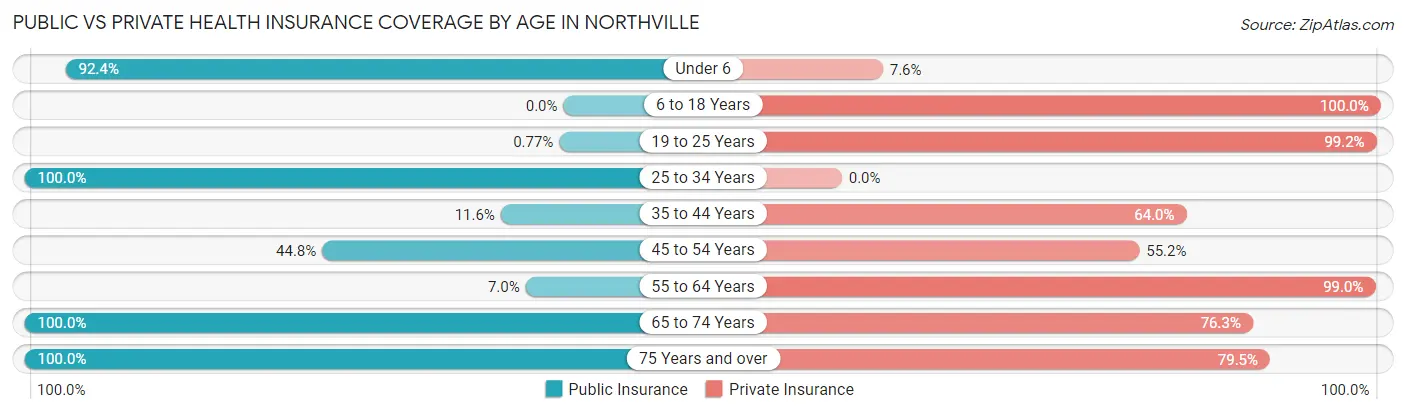
| Age Bracket | Public Insurance | Private Insurance |
| Under 6 | 85 (92.4%) | 7 (7.6%) |
| 6 to 18 Years | 0 (0.0%) | 177 (100.0%) |
| 19 to 25 Years | 2 (0.8%) | 258 (99.2%) |
| 25 to 34 Years | 44 (100.0%) | 0 (0.0%) |
| 35 to 44 Years | 20 (11.6%) | 110 (63.9%) |
| 45 to 54 Years | 30 (44.8%) | 37 (55.2%) |
| 55 to 64 Years | 28 (7.0%) | 395 (99.0%) |
| 65 to 74 Years | 472 (100.0%) | 360 (76.3%) |
| 75 Years and over | 146 (100.0%) | 116 (79.4%) |
| Total | 827 (45.2%) | 1,460 (79.8%) |
Disability Status by Sex by Age in Northville
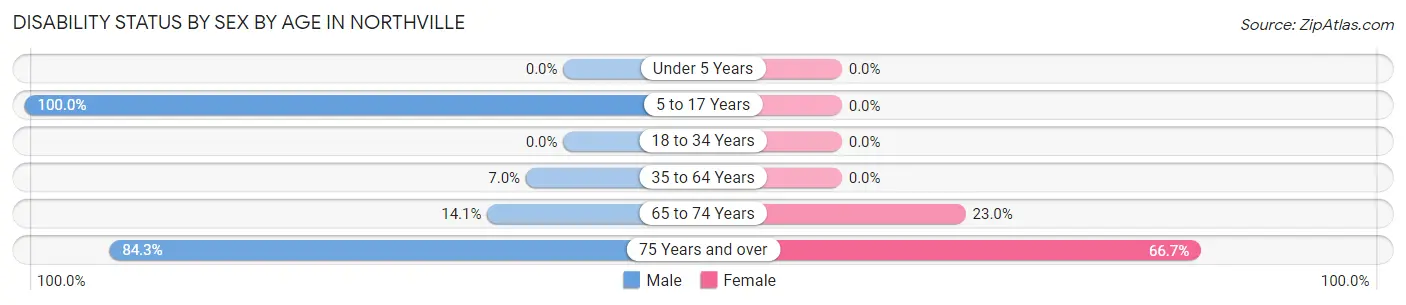
| Age Bracket | Male | Female |
| Under 5 Years | 0 (0.0%) | 0 (0.0%) |
| 5 to 17 Years | 101 (100.0%) | 0 (0.0%) |
| 18 to 34 Years | 0 (0.0%) | 0 (0.0%) |
| 35 to 64 Years | 28 (7.0%) | 0 (0.0%) |
| 65 to 74 Years | 23 (14.1%) | 71 (23.0%) |
| 75 Years and over | 75 (84.3%) | 38 (66.7%) |
Disability Class by Sex by Age in Northville
Disability Class: Hearing Difficulty
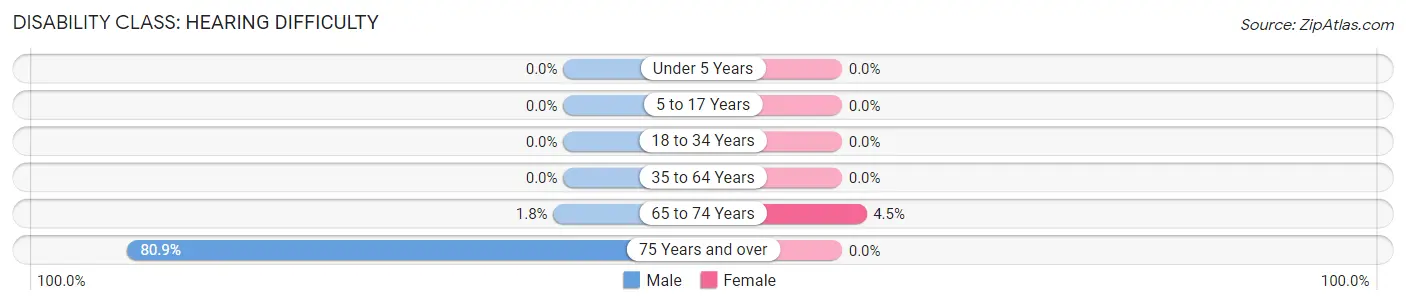
| Age Bracket | Male | Female |
| Under 5 Years | 0 (0.0%) | 0 (0.0%) |
| 5 to 17 Years | 0 (0.0%) | 0 (0.0%) |
| 18 to 34 Years | 0 (0.0%) | 0 (0.0%) |
| 35 to 64 Years | 0 (0.0%) | 0 (0.0%) |
| 65 to 74 Years | 3 (1.8%) | 14 (4.5%) |
| 75 Years and over | 72 (80.9%) | 0 (0.0%) |
Disability Class: Vision Difficulty
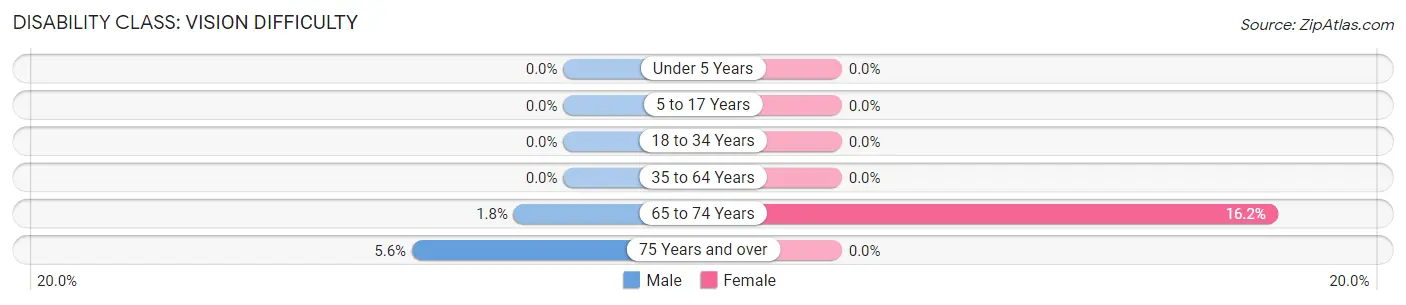
| Age Bracket | Male | Female |
| Under 5 Years | 0 (0.0%) | 0 (0.0%) |
| 5 to 17 Years | 0 (0.0%) | 0 (0.0%) |
| 18 to 34 Years | 0 (0.0%) | 0 (0.0%) |
| 35 to 64 Years | 0 (0.0%) | 0 (0.0%) |
| 65 to 74 Years | 3 (1.8%) | 50 (16.2%) |
| 75 Years and over | 5 (5.6%) | 0 (0.0%) |
Disability Class: Cognitive Difficulty
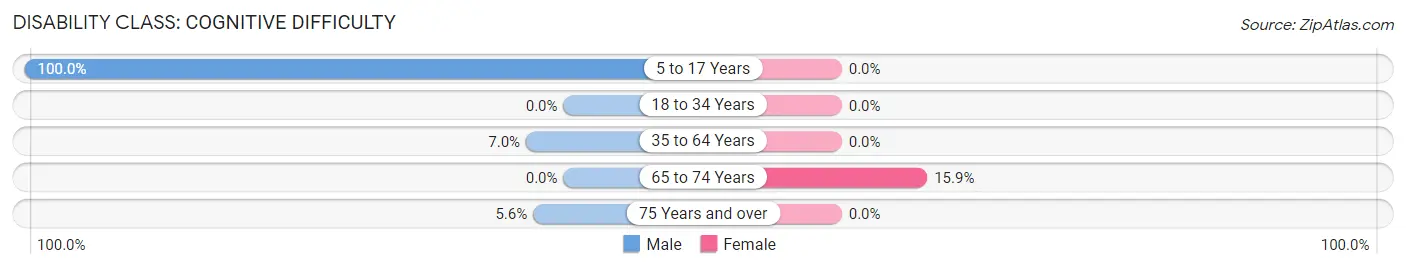
| Age Bracket | Male | Female |
| 5 to 17 Years | 101 (100.0%) | 0 (0.0%) |
| 18 to 34 Years | 0 (0.0%) | 0 (0.0%) |
| 35 to 64 Years | 28 (7.0%) | 0 (0.0%) |
| 65 to 74 Years | 0 (0.0%) | 49 (15.9%) |
| 75 Years and over | 5 (5.6%) | 0 (0.0%) |
Disability Class: Ambulatory Difficulty
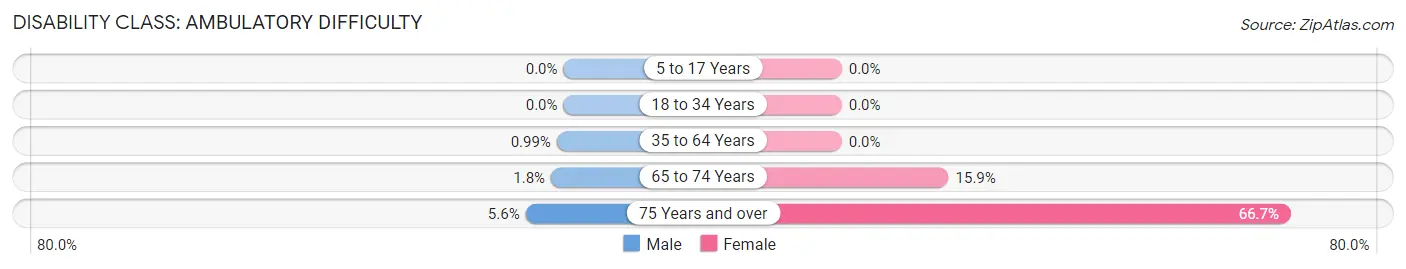
| Age Bracket | Male | Female |
| 5 to 17 Years | 0 (0.0%) | 0 (0.0%) |
| 18 to 34 Years | 0 (0.0%) | 0 (0.0%) |
| 35 to 64 Years | 4 (1.0%) | 0 (0.0%) |
| 65 to 74 Years | 3 (1.8%) | 49 (15.9%) |
| 75 Years and over | 5 (5.6%) | 38 (66.7%) |
Disability Class: Self-Care Difficulty
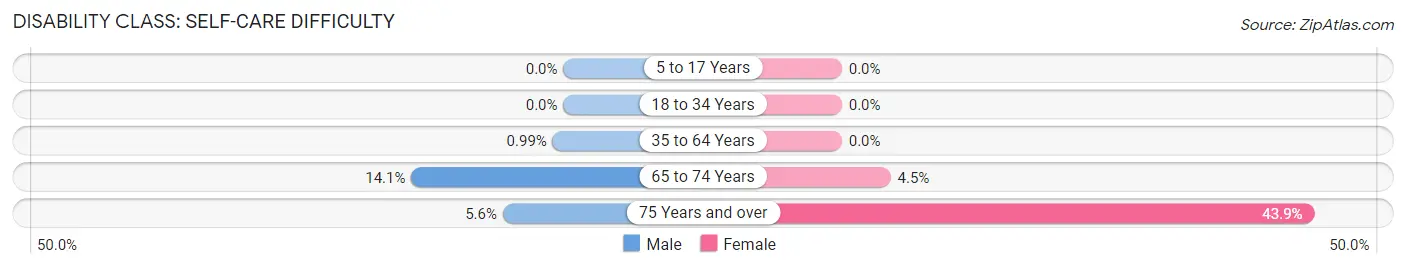
| Age Bracket | Male | Female |
| 5 to 17 Years | 0 (0.0%) | 0 (0.0%) |
| 18 to 34 Years | 0 (0.0%) | 0 (0.0%) |
| 35 to 64 Years | 4 (1.0%) | 0 (0.0%) |
| 65 to 74 Years | 23 (14.1%) | 14 (4.5%) |
| 75 Years and over | 5 (5.6%) | 25 (43.9%) |
Technology Access in Northville
Computing Device Access in Northville
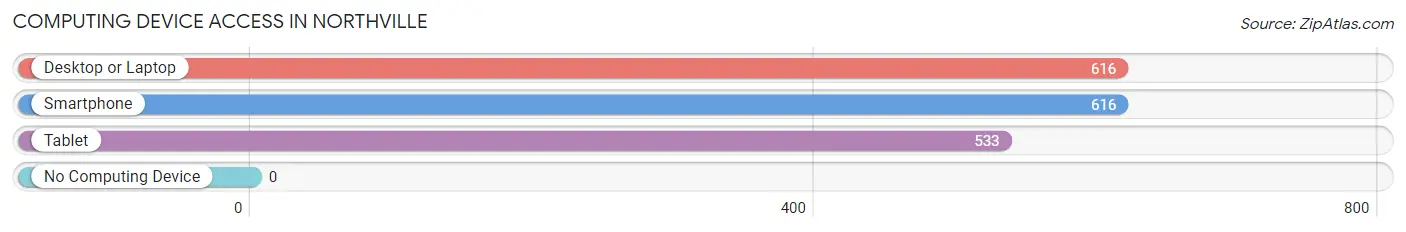
| Device Type | # Households | % Households |
| Desktop or Laptop | 616 | 97.3% |
| Smartphone | 616 | 97.3% |
| Tablet | 533 | 84.2% |
| No Computing Device | 0 | 0.0% |
| Total | 633 | 100.0% |
Internet Access in Northville
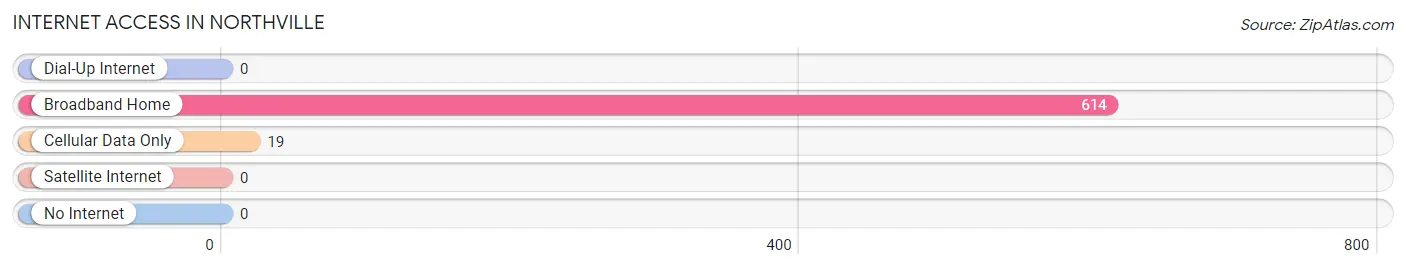
| Internet Type | # Households | % Households |
| Dial-Up Internet | 0 | 0.0% |
| Broadband Home | 614 | 97.0% |
| Cellular Data Only | 19 | 3.0% |
| Satellite Internet | 0 | 0.0% |
| No Internet | 0 | 0.0% |
| Total | 633 | 100.0% |
Northville Summary
History
Northville is a small village located in the town of Northampton in Fulton County, New York. The village was first settled in 1790 by a group of settlers from Connecticut. The village was originally known as “Northville” due to its location north of the Mohawk River. The village was incorporated in 1845 and has since grown to a population of 1,845 as of the 2010 census.
The village of Northville has a rich history that dates back to the early 19th century. The village was a major stop on the Erie Canal, which was completed in 1825. The canal was a major transportation route for goods and people, and it helped to spur the growth of the village. The village was also home to a number of mills, including a paper mill, a grist mill, and a saw mill. These mills provided employment for many of the village’s residents.
The village was also home to a number of churches, including the First Presbyterian Church, which was founded in 1820. The village also had a number of schools, including the Northville Academy, which was founded in 1845. The village was also home to a number of businesses, including a hotel, a general store, and a blacksmith shop.
Geography
Northville is located in the town of Northampton in Fulton County, New York. The village is situated on the banks of the Mohawk River, which is a major tributary of the Hudson River. The village is located approximately 30 miles northwest of Albany, the state capital.
The village is located in a rural area and is surrounded by rolling hills and farmland. The village is located at an elevation of approximately 500 feet above sea level. The climate in the area is generally mild, with cold winters and warm summers.
Economy
The economy of Northville is largely based on agriculture and tourism. The village is home to a number of farms, which produce a variety of crops, including corn, soybeans, and hay. The village is also home to a number of wineries, which produce a variety of wines.
The village is also home to a number of businesses, including a hotel, a general store, and a blacksmith shop. The village is also home to a number of restaurants, which serve a variety of cuisines.
Demographics
As of the 2010 census, the population of Northville was 1,845. The population is largely white, with approximately 95% of the population being white. The median household income in the village is $45,000, and the median age is 44. The village is home to a number of churches, including the First Presbyterian Church, which was founded in 1820.
Common Questions
What is Per Capita Income in Northville?
Per Capita income in Northville is $55,936.
What is the Median Family Income in Northville?
Median Family Income in Northville is $116,786.
What is the Median Household income in Northville?
Median Household Income in Northville is $114,635.
What is Income or Wage Gap in Northville?
Income or Wage Gap in Northville is 13.4%.
Women in Northville earn 86.6 cents for every dollar earned by a man.
What is Inequality or Gini Index in Northville?
Inequality or Gini Index in Northville is 0.42.
What is the Total Population of Northville?
Total Population of Northville is 1,829.
What is the Total Male Population of Northville?
Total Male Population of Northville is 1,058.
What is the Total Female Population of Northville?
Total Female Population of Northville is 771.
What is the Ratio of Males per 100 Females in Northville?
There are 137.22 Males per 100 Females in Northville.
What is the Ratio of Females per 100 Males in Northville?
There are 72.87 Females per 100 Males in Northville.
What is the Median Population Age in Northville?
Median Population Age in Northville is 57.8 Years.
What is the Average Family Size in Northville
Average Family Size in Northville is 2.9 People.
What is the Average Household Size in Northville
Average Household Size in Northville is 2.8 People.
How Large is the Labor Force in Northville?
There are 766 People in the Labor Forcein in Northville.
What is the Percentage of People in the Labor Force in Northville?
46.1% of People are in the Labor Force in Northville.