Ocean Grove, NJ Map & Demographics
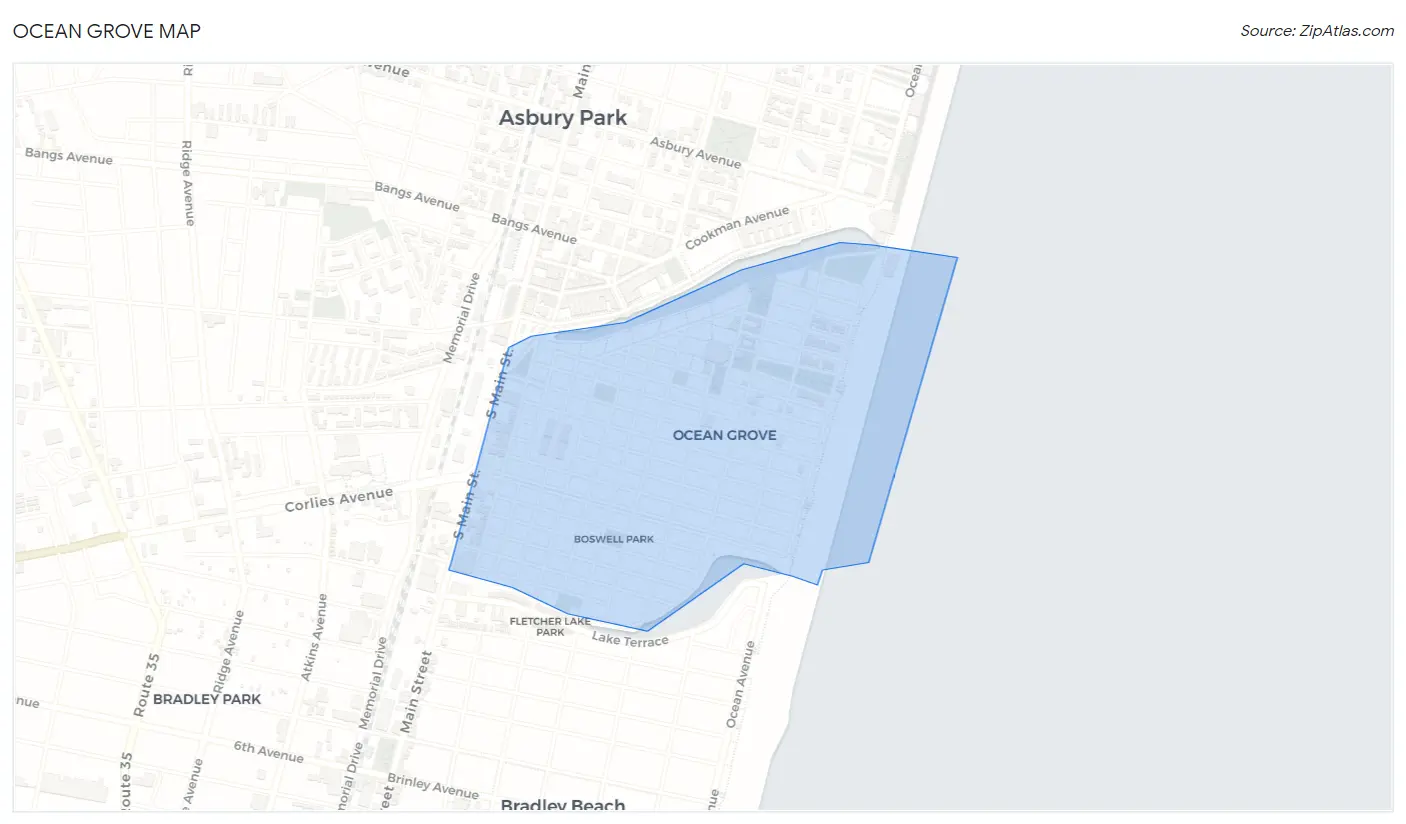
Ocean Grove Map
Ocean Grove Overview
$73,156
PER CAPITA INCOME
$88,674
AVG FAMILY INCOME
$72,500
AVG HOUSEHOLD INCOME
26.1%
WAGE / INCOME GAP [ % ]
73.9¢/ $1
WAGE / INCOME GAP [ $ ]
0.52
INEQUALITY / GINI INDEX
3,129
TOTAL POPULATION
1,464
MALE POPULATION
1,665
FEMALE POPULATION
87.93
MALES / 100 FEMALES
113.73
FEMALES / 100 MALES
61.0
MEDIAN AGE
2.2
AVG FAMILY SIZE
1.7
AVG HOUSEHOLD SIZE
1,767
LABOR FORCE [ PEOPLE ]
58.1%
PERCENT IN LABOR FORCE
7.2%
UNEMPLOYMENT RATE
Ocean Grove Zip Codes
Income in Ocean Grove
Income Overview in Ocean Grove
Per Capita Income in Ocean Grove is $73,156, while median incomes of families and households are $88,674 and $72,500 respectively.
| Characteristic | Number | Measure |
| Per Capita Income | 3,129 | $73,156 |
| Median Family Income | 803 | $88,674 |
| Mean Family Income | 803 | $174,555 |
| Median Household Income | 1,838 | $72,500 |
| Mean Household Income | 1,838 | $125,293 |
| Income Deficit | 803 | $0 |
| Wage / Income Gap (%) | 3,129 | 26.15% |
| Wage / Income Gap ($) | 3,129 | 73.85¢ per $1 |
| Gini / Inequality Index | 3,129 | 0.52 |
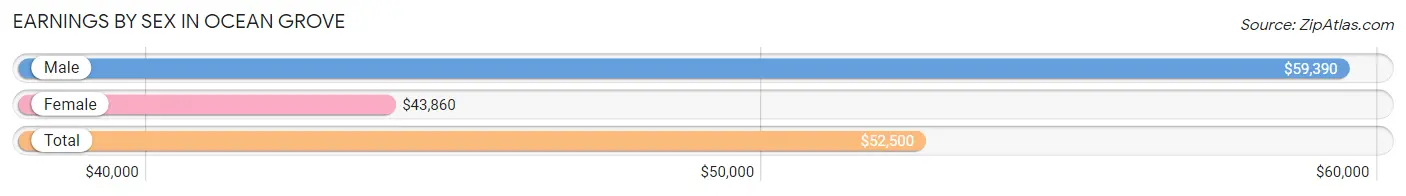
Earnings by Sex in Ocean Grove
Average Earnings in Ocean Grove are $52,500, $59,390 for men and $43,860 for women, a difference of 26.2%.
| Sex | Number | Average Earnings |
| Male | 853 (48.3%) | $59,390 |
| Female | 913 (51.7%) | $43,860 |
| Total | 1,766 (100.0%) | $52,500 |
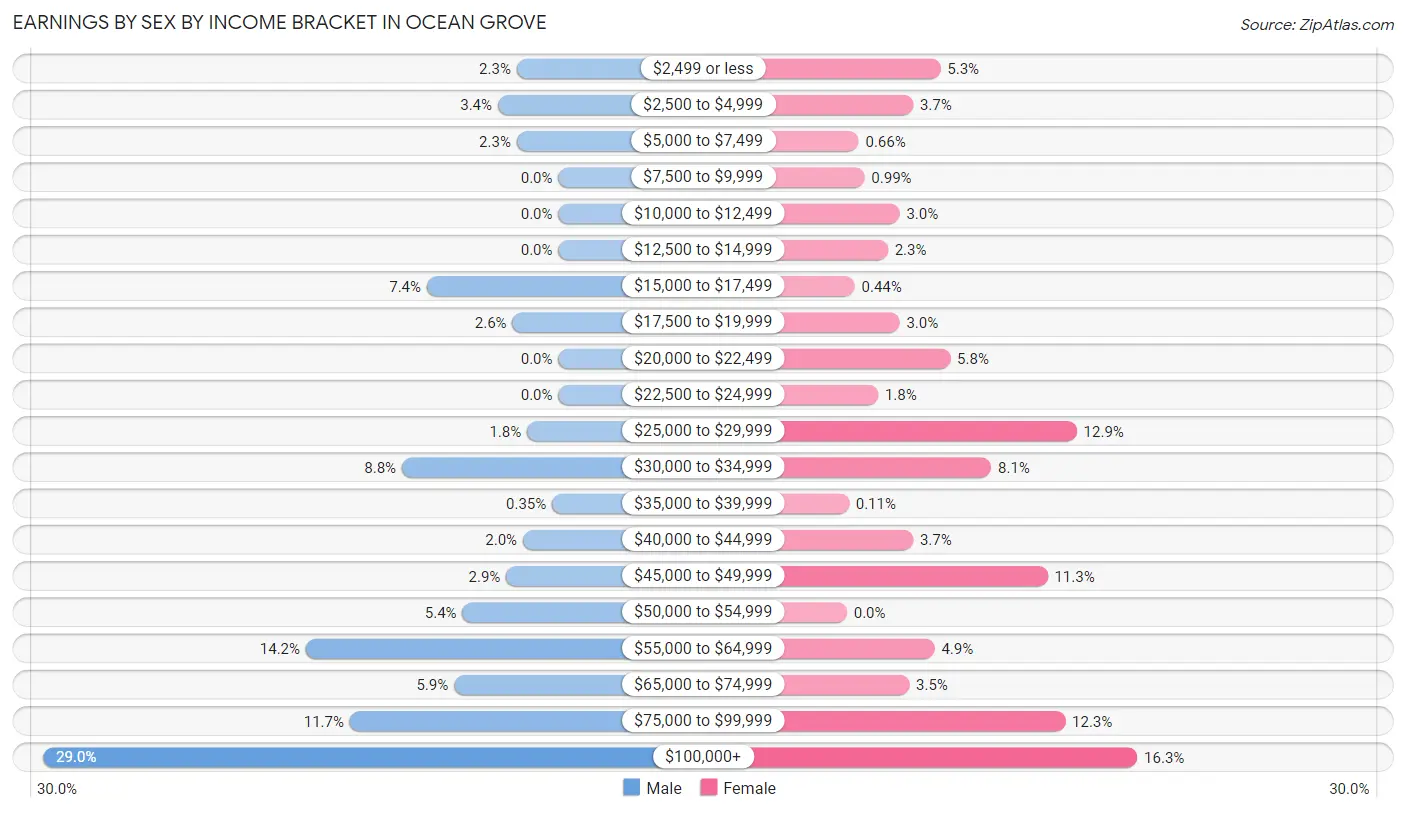
Earnings by Sex by Income Bracket in Ocean Grove
The most common earnings brackets in Ocean Grove are $100,000+ for men (247 | 29.0%) and $100,000+ for women (149 | 16.3%).
| Income | Male | Female |
| $2,499 or less | 20 (2.3%) | 48 (5.3%) |
| $2,500 to $4,999 | 29 (3.4%) | 34 (3.7%) |
| $5,000 to $7,499 | 20 (2.3%) | 6 (0.7%) |
| $7,500 to $9,999 | 0 (0.0%) | 9 (1.0%) |
| $10,000 to $12,499 | 0 (0.0%) | 27 (3.0%) |
| $12,500 to $14,999 | 0 (0.0%) | 21 (2.3%) |
| $15,000 to $17,499 | 63 (7.4%) | 4 (0.4%) |
| $17,500 to $19,999 | 22 (2.6%) | 27 (3.0%) |
| $20,000 to $22,499 | 0 (0.0%) | 53 (5.8%) |
| $22,500 to $24,999 | 0 (0.0%) | 16 (1.8%) |
| $25,000 to $29,999 | 15 (1.8%) | 118 (12.9%) |
| $30,000 to $34,999 | 75 (8.8%) | 74 (8.1%) |
| $35,000 to $39,999 | 3 (0.4%) | 1 (0.1%) |
| $40,000 to $44,999 | 17 (2.0%) | 34 (3.7%) |
| $45,000 to $49,999 | 25 (2.9%) | 103 (11.3%) |
| $50,000 to $54,999 | 46 (5.4%) | 0 (0.0%) |
| $55,000 to $64,999 | 121 (14.2%) | 45 (4.9%) |
| $65,000 to $74,999 | 50 (5.9%) | 32 (3.5%) |
| $75,000 to $99,999 | 100 (11.7%) | 112 (12.3%) |
| $100,000+ | 247 (29.0%) | 149 (16.3%) |
| Total | 853 (100.0%) | 913 (100.0%) |
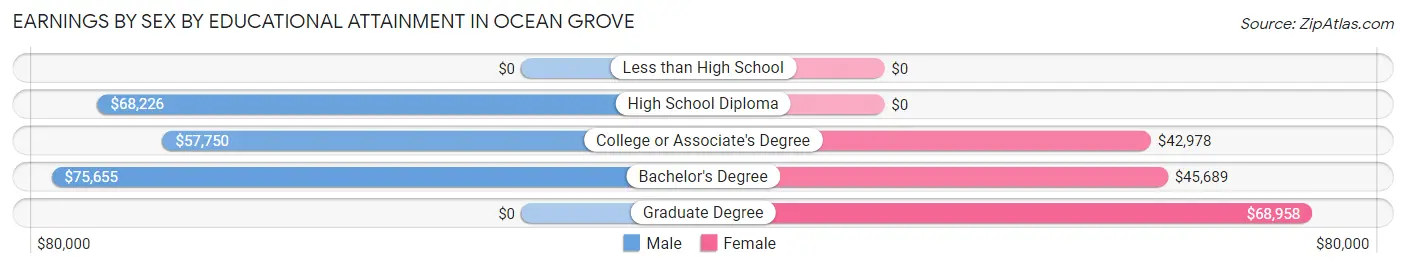
Earnings by Sex by Educational Attainment in Ocean Grove
Average earnings in Ocean Grove are $59,824 for men and $44,596 for women, a difference of 25.5%. Men with an educational attainment of bachelor's degree enjoy the highest average annual earnings of $75,655, while those with college or associate's degree education earn the least with $57,750. Women with an educational attainment of graduate degree earn the most with the average annual earnings of $68,958, while those with college or associate's degree education have the smallest earnings of $42,978.
| Educational Attainment | Male Income | Female Income |
| Less than High School | - | - |
| High School Diploma | $68,226 | $0 |
| College or Associate's Degree | $57,750 | $42,978 |
| Bachelor's Degree | $75,655 | $45,689 |
| Graduate Degree | - | - |
| Total | $59,824 | $44,596 |
Family Income in Ocean Grove
Family Income Brackets in Ocean Grove
According to the Ocean Grove family income data, there are 201 families falling into the $200,000+ income range, which is the most common income bracket and makes up 25.0% of all families.
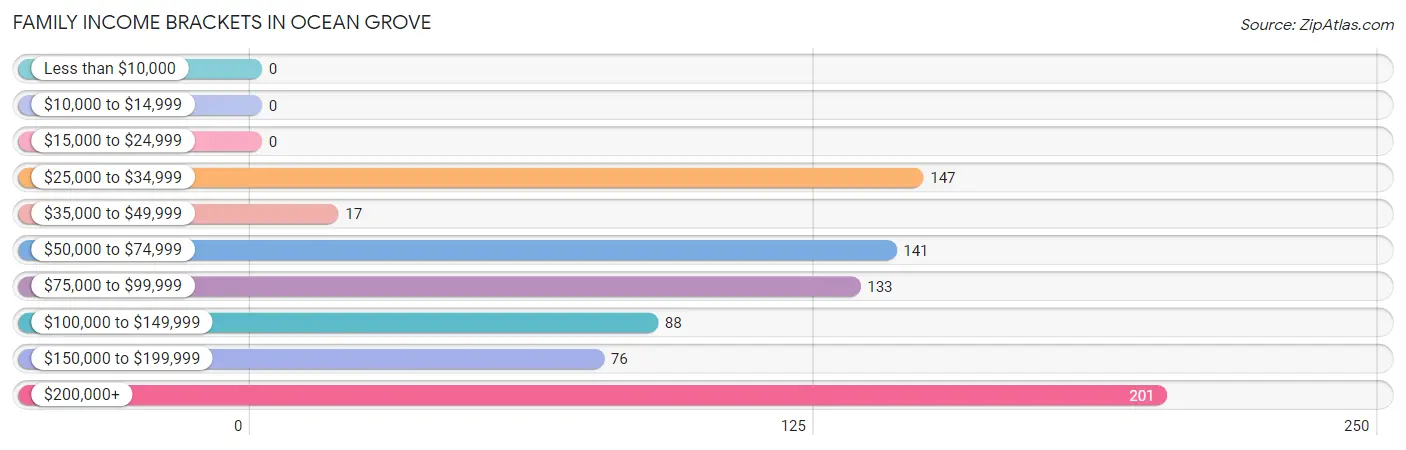
| Income Bracket | # Families | % Families |
| Less than $10,000 | 0 | 0.0% |
| $10,000 to $14,999 | 0 | 0.0% |
| $15,000 to $24,999 | 0 | 0.0% |
| $25,000 to $34,999 | 147 | 18.3% |
| $35,000 to $49,999 | 17 | 2.1% |
| $50,000 to $74,999 | 141 | 17.6% |
| $75,000 to $99,999 | 133 | 16.6% |
| $100,000 to $149,999 | 88 | 11.0% |
| $150,000 to $199,999 | 76 | 9.5% |
| $200,000+ | 201 | 25.0% |
Family Income by Famaliy Size in Ocean Grove
3-person families (135 | 16.8%) account for the highest median family income in Ocean Grove with $119,583 per family, while 2-person families (651 | 81.1%) have the highest median income of $43,438 per family member.
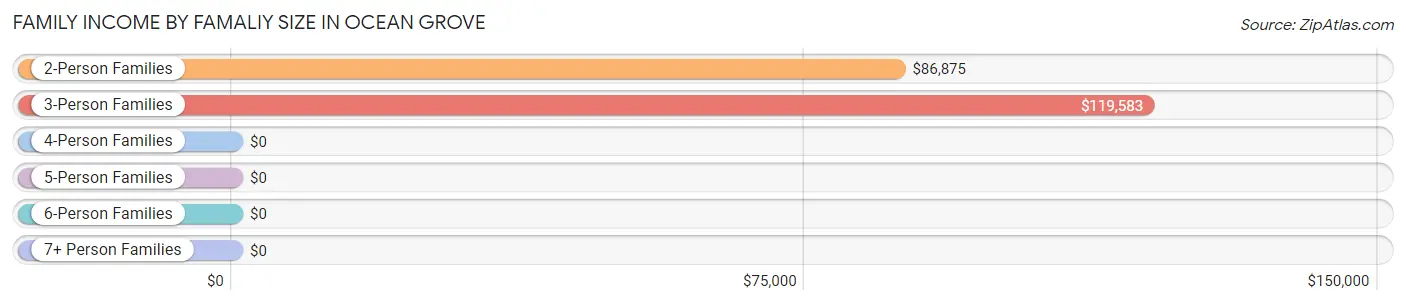
| Income Bracket | # Families | Median Income |
| 2-Person Families | 651 (81.1%) | $86,875 |
| 3-Person Families | 135 (16.8%) | $119,583 |
| 4-Person Families | 17 (2.1%) | $0 |
| 5-Person Families | 0 (0.0%) | $0 |
| 6-Person Families | 0 (0.0%) | $0 |
| 7+ Person Families | 0 (0.0%) | $0 |
| Total | 803 (100.0%) | $88,674 |
Family Income by Number of Earners in Ocean Grove
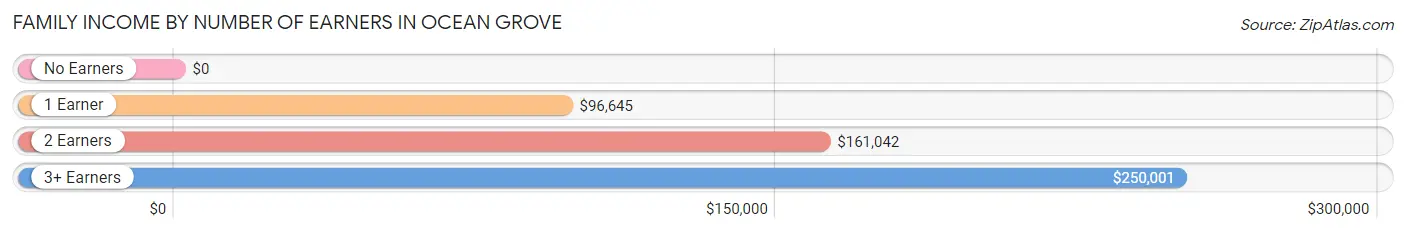
| Number of Earners | # Families | Median Income |
| No Earners | 326 (40.6%) | $0 |
| 1 Earner | 163 (20.3%) | $96,645 |
| 2 Earners | 263 (32.8%) | $161,042 |
| 3+ Earners | 51 (6.4%) | $250,001 |
| Total | 803 (100.0%) | $88,674 |
Household Income in Ocean Grove
Household Income Brackets in Ocean Grove
With 485 households falling in the category, the $50,000 to $74,999 income range is the most frequent in Ocean Grove, accounting for 26.4% of all households. In contrast, only 31 households (1.7%) fall into the less than $10,000 income bracket, making it the least populous group.
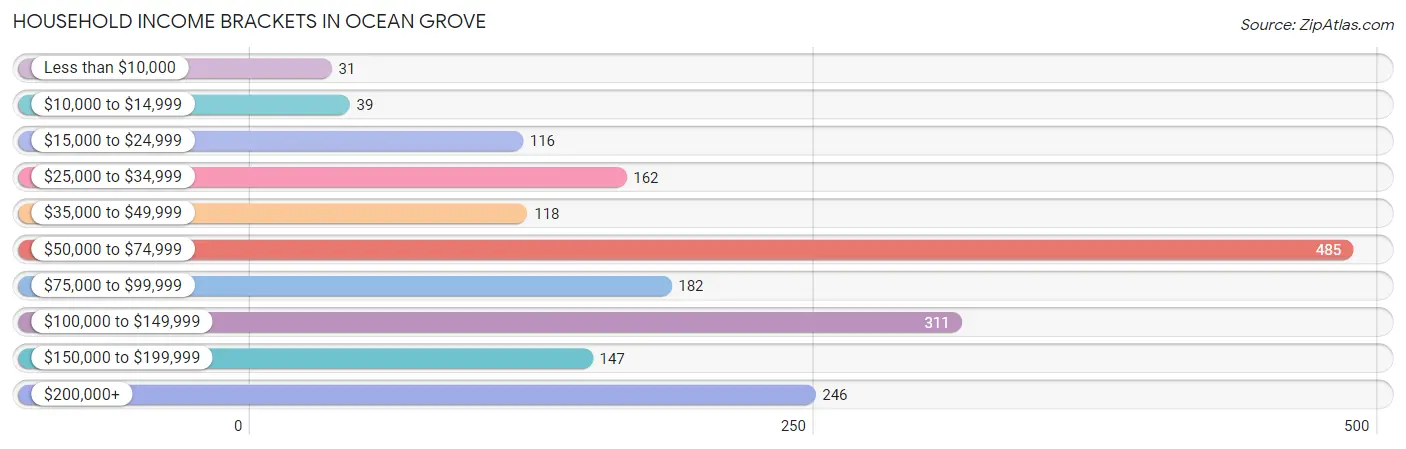
| Income Bracket | # Households | % Households |
| Less than $10,000 | 31 | 1.7% |
| $10,000 to $14,999 | 39 | 2.1% |
| $15,000 to $24,999 | 116 | 6.3% |
| $25,000 to $34,999 | 162 | 8.8% |
| $35,000 to $49,999 | 118 | 6.4% |
| $50,000 to $74,999 | 485 | 26.4% |
| $75,000 to $99,999 | 182 | 9.9% |
| $100,000 to $149,999 | 311 | 16.9% |
| $150,000 to $199,999 | 147 | 8.0% |
| $200,000+ | 246 | 13.4% |
Household Income by Householder Age in Ocean Grove
The median household income in Ocean Grove is $72,500, with the highest median household income of $89,000 found in the 65+ years age bracket for the primary householder. A total of 724 households (39.4%) fall into this category. Meanwhile, the 15 to 24 years age bracket for the primary householder has the lowest median household income of $0, with 22 households (1.2%) in this group.
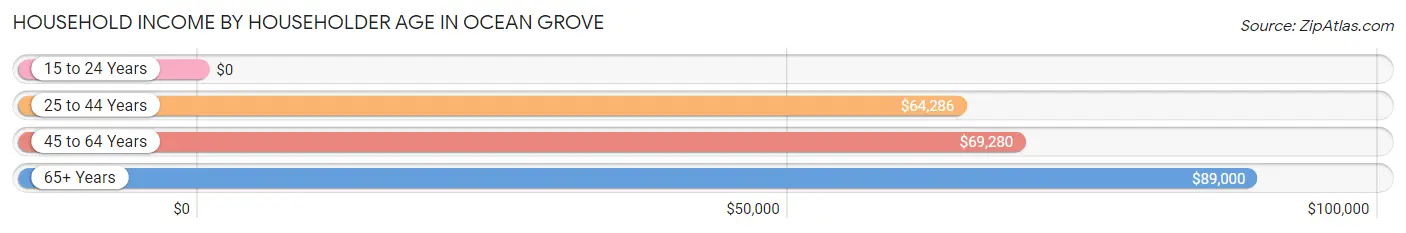
| Income Bracket | # Households | Median Income |
| 15 to 24 Years | 22 (1.2%) | $0 |
| 25 to 44 Years | 388 (21.1%) | $64,286 |
| 45 to 64 Years | 704 (38.3%) | $69,280 |
| 65+ Years | 724 (39.4%) | $89,000 |
| Total | 1,838 (100.0%) | $72,500 |
Poverty in Ocean Grove
Income Below Poverty by Sex and Age in Ocean Grove
With 3.4% poverty level for males and 6.3% for females among the residents of Ocean Grove, 18 to 24 year old males and 75 year old and over females are the most vulnerable to poverty, with 22 males (52.4%) and 35 females (14.8%) in their respective age groups living below the poverty level.
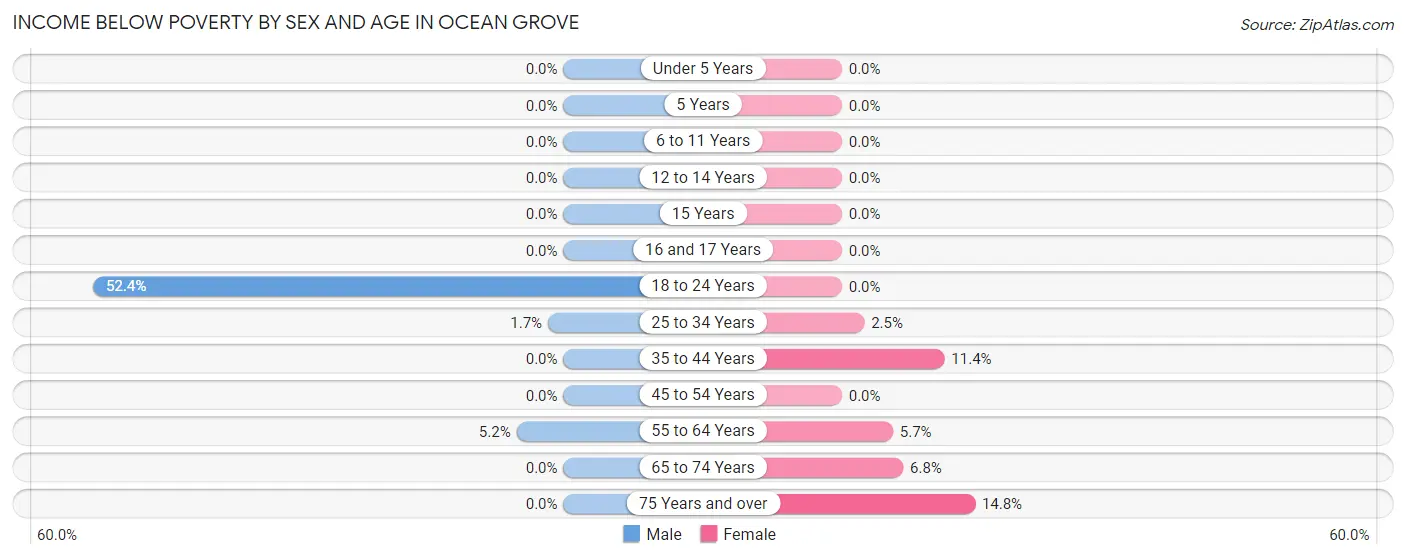
| Age Bracket | Male | Female |
| Under 5 Years | 0 (0.0%) | 0 (0.0%) |
| 5 Years | 0 (0.0%) | 0 (0.0%) |
| 6 to 11 Years | 0 (0.0%) | 0 (0.0%) |
| 12 to 14 Years | 0 (0.0%) | 0 (0.0%) |
| 15 Years | 0 (0.0%) | 0 (0.0%) |
| 16 and 17 Years | 0 (0.0%) | 0 (0.0%) |
| 18 to 24 Years | 22 (52.4%) | 0 (0.0%) |
| 25 to 34 Years | 2 (1.7%) | 7 (2.5%) |
| 35 to 44 Years | 0 (0.0%) | 12 (11.4%) |
| 45 to 54 Years | 0 (0.0%) | 0 (0.0%) |
| 55 to 64 Years | 26 (5.2%) | 28 (5.7%) |
| 65 to 74 Years | 0 (0.0%) | 22 (6.8%) |
| 75 Years and over | 0 (0.0%) | 35 (14.8%) |
| Total | 50 (3.4%) | 104 (6.3%) |
Income Above Poverty by Sex and Age in Ocean Grove
According to the poverty statistics in Ocean Grove, males aged under 5 years and females aged 16 and 17 years are the age groups that are most secure financially, with 100.0% of males and 100.0% of females in these age groups living above the poverty line.
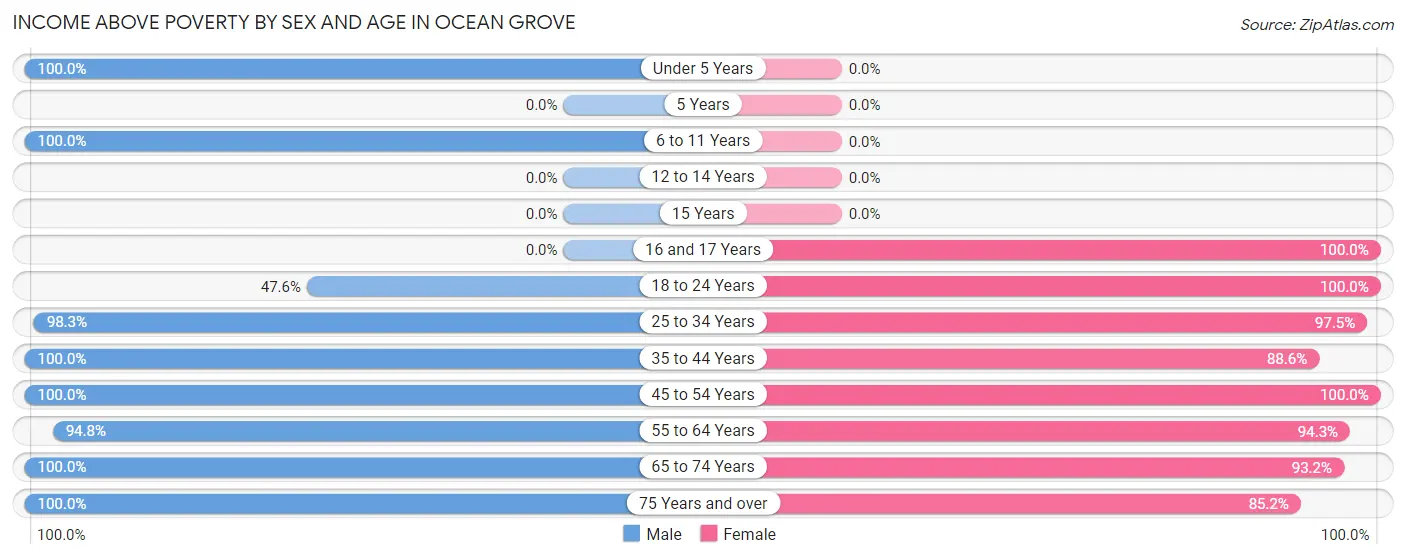
| Age Bracket | Male | Female |
| Under 5 Years | 79 (100.0%) | 0 (0.0%) |
| 5 Years | 0 (0.0%) | 0 (0.0%) |
| 6 to 11 Years | 9 (100.0%) | 0 (0.0%) |
| 12 to 14 Years | 0 (0.0%) | 0 (0.0%) |
| 15 Years | 0 (0.0%) | 0 (0.0%) |
| 16 and 17 Years | 0 (0.0%) | 16 (100.0%) |
| 18 to 24 Years | 20 (47.6%) | 4 (100.0%) |
| 25 to 34 Years | 114 (98.3%) | 273 (97.5%) |
| 35 to 44 Years | 249 (100.0%) | 93 (88.6%) |
| 45 to 54 Years | 90 (100.0%) | 202 (100.0%) |
| 55 to 64 Years | 472 (94.8%) | 464 (94.3%) |
| 65 to 74 Years | 294 (100.0%) | 300 (93.2%) |
| 75 Years and over | 87 (100.0%) | 201 (85.2%) |
| Total | 1,414 (96.6%) | 1,553 (93.7%) |
Income Below Poverty Among Married-Couple Families in Ocean Grove
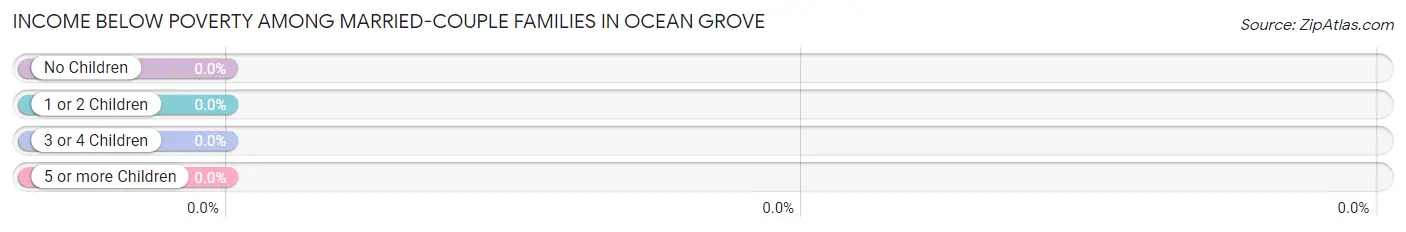
| Children | Above Poverty | Below Poverty |
| No Children | 625 (100.0%) | 0 (0.0%) |
| 1 or 2 Children | 61 (100.0%) | 0 (0.0%) |
| 3 or 4 Children | 0 (0.0%) | 0 (0.0%) |
| 5 or more Children | 0 (0.0%) | 0 (0.0%) |
| Total | 686 (100.0%) | 0 (0.0%) |
Income Below Poverty Among Single-Parent Households in Ocean Grove
| Children | Single Father | Single Mother |
| No Children | 0 (0.0%) | 0 (0.0%) |
| 1 or 2 Children | 0 (0.0%) | 0 (0.0%) |
| 3 or 4 Children | 0 (0.0%) | 0 (0.0%) |
| 5 or more Children | 0 (0.0%) | 0 (0.0%) |
| Total | 0 (0.0%) | 0 (0.0%) |
Income Below Poverty Among Married-Couple vs Single-Parent Households in Ocean Grove
| Children | Married-Couple Families | Single-Parent Households |
| No Children | 0 (0.0%) | 0 (0.0%) |
| 1 or 2 Children | 0 (0.0%) | 0 (0.0%) |
| 3 or 4 Children | 0 (0.0%) | 0 (0.0%) |
| 5 or more Children | 0 (0.0%) | 0 (0.0%) |
| Total | 0 (0.0%) | 0 (0.0%) |
Race in Ocean Grove
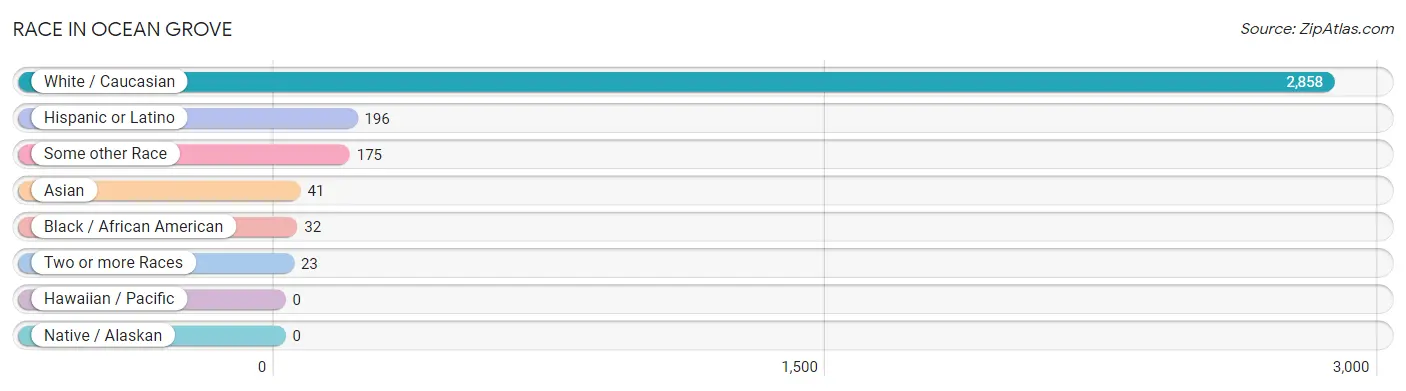
The most populous races in Ocean Grove are White / Caucasian (2,858 | 91.3%), Hispanic or Latino (196 | 6.3%), and Some other Race (175 | 5.6%).
| Race | # Population | % Population |
| Asian | 41 | 1.3% |
| Black / African American | 32 | 1.0% |
| Hawaiian / Pacific | 0 | 0.0% |
| Hispanic or Latino | 196 | 6.3% |
| Native / Alaskan | 0 | 0.0% |
| White / Caucasian | 2,858 | 91.3% |
| Two or more Races | 23 | 0.7% |
| Some other Race | 175 | 5.6% |
| Total | 3,129 | 100.0% |
Ancestry in Ocean Grove
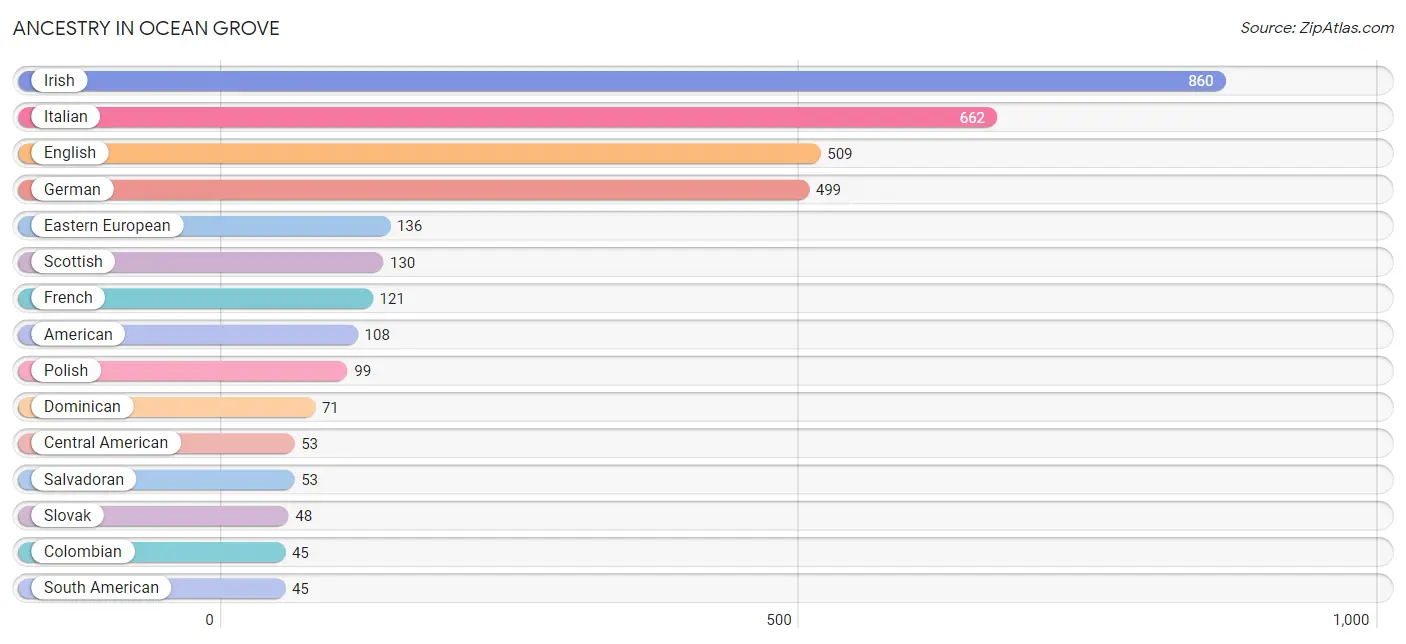
The most populous ancestries reported in Ocean Grove are Irish (860 | 27.5%), Italian (662 | 21.2%), English (509 | 16.3%), German (499 | 16.0%), and Eastern European (136 | 4.3%), together accounting for 85.2% of all Ocean Grove residents.
| Ancestry | # Population | % Population |
| American | 108 | 3.5% |
| Arab | 20 | 0.6% |
| Armenian | 11 | 0.4% |
| British | 28 | 0.9% |
| Burmese | 7 | 0.2% |
| Central American | 53 | 1.7% |
| Colombian | 45 | 1.4% |
| Cuban | 18 | 0.6% |
| Czech | 40 | 1.3% |
| Danish | 22 | 0.7% |
| Dominican | 71 | 2.3% |
| Dutch | 40 | 1.3% |
| Eastern European | 136 | 4.3% |
| English | 509 | 16.3% |
| European | 14 | 0.4% |
| French | 121 | 3.9% |
| French Canadian | 29 | 0.9% |
| German | 499 | 16.0% |
| Greek | 36 | 1.1% |
| Hungarian | 5 | 0.2% |
| Irish | 860 | 27.5% |
| Italian | 662 | 21.2% |
| Laotian | 6 | 0.2% |
| Malaysian | 22 | 0.7% |
| Mexican | 3 | 0.1% |
| Nigerian | 25 | 0.8% |
| Northern European | 9 | 0.3% |
| Norwegian | 15 | 0.5% |
| Polish | 99 | 3.2% |
| Puerto Rican | 6 | 0.2% |
| Romanian | 37 | 1.2% |
| Russian | 34 | 1.1% |
| Salvadoran | 53 | 1.7% |
| Scandinavian | 6 | 0.2% |
| Scotch-Irish | 15 | 0.5% |
| Scottish | 130 | 4.2% |
| Slovak | 48 | 1.5% |
| South American | 45 | 1.4% |
| Sri Lankan | 22 | 0.7% |
| Subsaharan African | 25 | 0.8% |
| Thai | 29 | 0.9% |
| Ukrainian | 15 | 0.5% | View All 42 Rows |
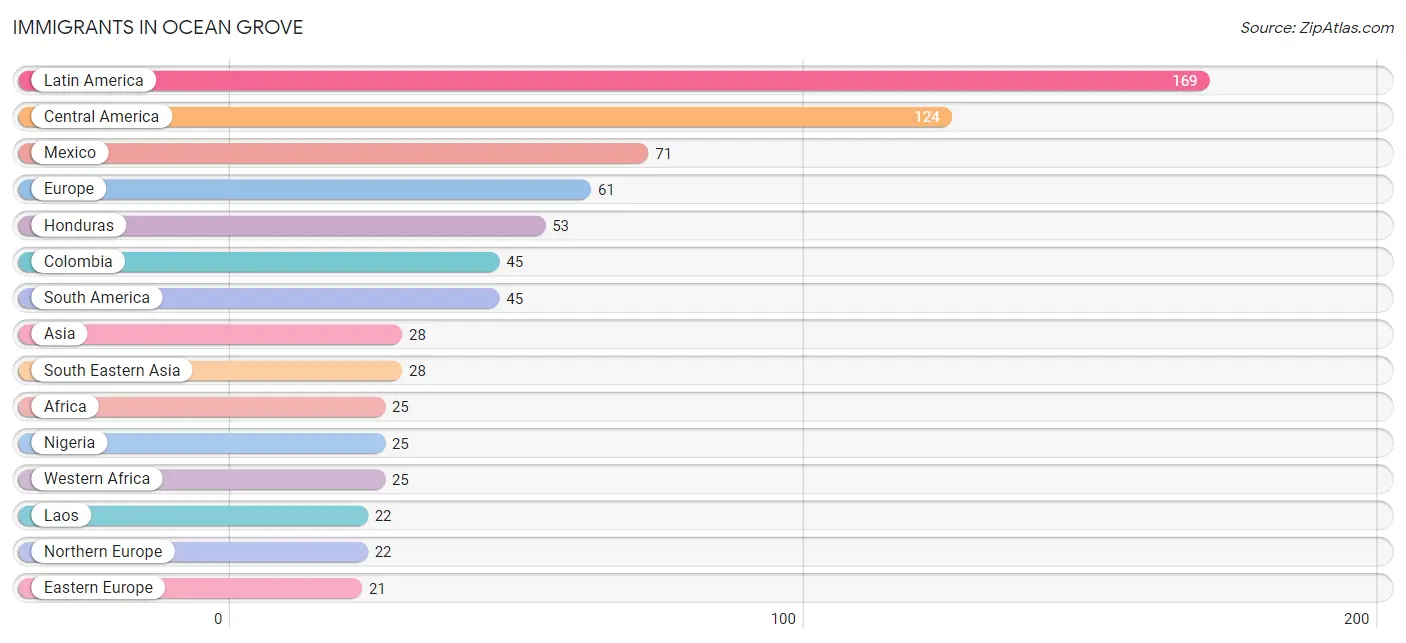
Immigrants in Ocean Grove
The most numerous immigrant groups reported in Ocean Grove came from Latin America (169 | 5.4%), Central America (124 | 4.0%), Mexico (71 | 2.3%), Europe (61 | 1.9%), and Honduras (53 | 1.7%), together accounting for 15.3% of all Ocean Grove residents.
| Immigration Origin | # Population | % Population |
| Africa | 25 | 0.8% |
| Asia | 28 | 0.9% |
| Central America | 124 | 4.0% |
| Colombia | 45 | 1.4% |
| Czechoslovakia | 12 | 0.4% |
| Eastern Europe | 21 | 0.7% |
| England | 9 | 0.3% |
| Europe | 61 | 1.9% |
| Honduras | 53 | 1.7% |
| Indonesia | 6 | 0.2% |
| Italy | 12 | 0.4% |
| Laos | 22 | 0.7% |
| Latin America | 169 | 5.4% |
| Mexico | 71 | 2.3% |
| Netherlands | 6 | 0.2% |
| Nigeria | 25 | 0.8% |
| Northern Europe | 22 | 0.7% |
| Russia | 9 | 0.3% |
| South America | 45 | 1.4% |
| South Eastern Asia | 28 | 0.9% |
| Southern Europe | 12 | 0.4% |
| Western Africa | 25 | 0.8% |
| Western Europe | 6 | 0.2% | View All 23 Rows |
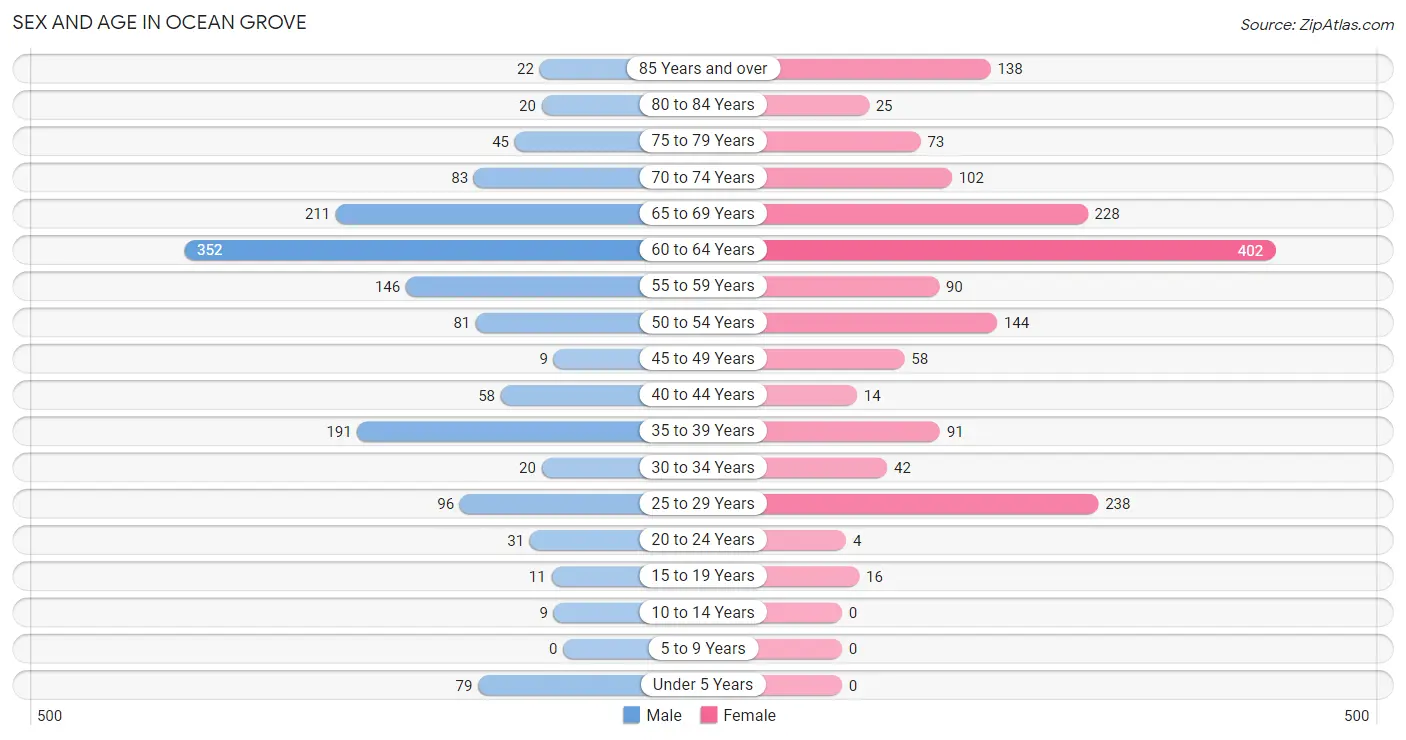
Sex and Age in Ocean Grove
Sex and Age in Ocean Grove
The most populous age groups in Ocean Grove are 60 to 64 Years (352 | 24.0%) for men and 60 to 64 Years (402 | 24.1%) for women.
| Age Bracket | Male | Female |
| Under 5 Years | 79 (5.4%) | 0 (0.0%) |
| 5 to 9 Years | 0 (0.0%) | 0 (0.0%) |
| 10 to 14 Years | 9 (0.6%) | 0 (0.0%) |
| 15 to 19 Years | 11 (0.7%) | 16 (1.0%) |
| 20 to 24 Years | 31 (2.1%) | 4 (0.2%) |
| 25 to 29 Years | 96 (6.6%) | 238 (14.3%) |
| 30 to 34 Years | 20 (1.4%) | 42 (2.5%) |
| 35 to 39 Years | 191 (13.1%) | 91 (5.5%) |
| 40 to 44 Years | 58 (4.0%) | 14 (0.8%) |
| 45 to 49 Years | 9 (0.6%) | 58 (3.5%) |
| 50 to 54 Years | 81 (5.5%) | 144 (8.6%) |
| 55 to 59 Years | 146 (10.0%) | 90 (5.4%) |
| 60 to 64 Years | 352 (24.0%) | 402 (24.1%) |
| 65 to 69 Years | 211 (14.4%) | 228 (13.7%) |
| 70 to 74 Years | 83 (5.7%) | 102 (6.1%) |
| 75 to 79 Years | 45 (3.1%) | 73 (4.4%) |
| 80 to 84 Years | 20 (1.4%) | 25 (1.5%) |
| 85 Years and over | 22 (1.5%) | 138 (8.3%) |
| Total | 1,464 (100.0%) | 1,665 (100.0%) |
Families and Households in Ocean Grove
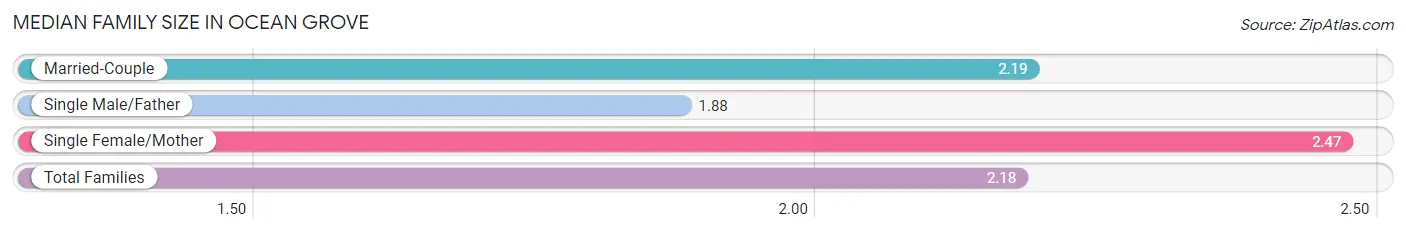
Median Family Size in Ocean Grove
The median family size in Ocean Grove is 2.18 persons per family, with single female/mother families (49 | 6.1%) accounting for the largest median family size of 2.47 persons per family. On the other hand, single male/father families (68 | 8.5%) represent the smallest median family size with 1.88 persons per family.
| Family Type | # Families | Family Size |
| Married-Couple | 686 (85.4%) | 2.19 |
| Single Male/Father | 68 (8.5%) | 1.88 |
| Single Female/Mother | 49 (6.1%) | 2.47 |
| Total Families | 803 (100.0%) | 2.18 |
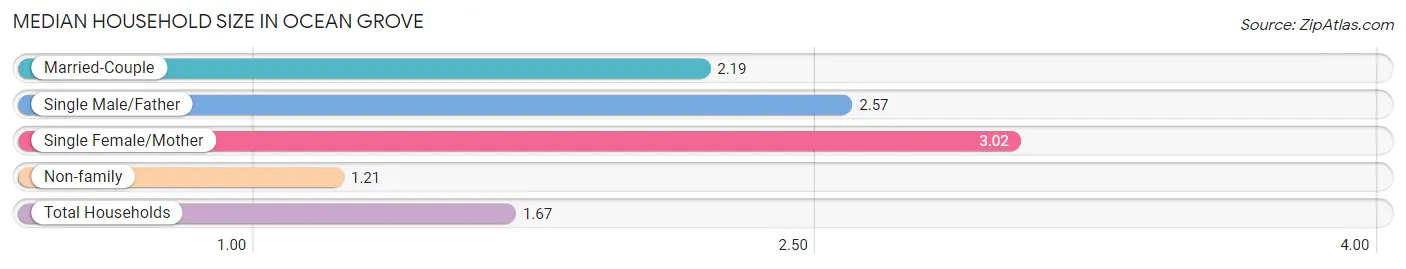
Median Household Size in Ocean Grove
The median household size in Ocean Grove is 1.67 persons per household, with single female/mother households (49 | 2.7%) accounting for the largest median household size of 3.02 persons per household. non-family households (1,035 | 56.3%) represent the smallest median household size with 1.21 persons per household.
| Household Type | # Households | Household Size |
| Married-Couple | 686 (37.3%) | 2.19 |
| Single Male/Father | 68 (3.7%) | 2.57 |
| Single Female/Mother | 49 (2.7%) | 3.02 |
| Non-family | 1,035 (56.3%) | 1.21 |
| Total Households | 1,838 (100.0%) | 1.67 |
Household Size by Marriage Status in Ocean Grove
Out of a total of 1,838 households in Ocean Grove, 803 (43.7%) are family households, while 1,035 (56.3%) are nonfamily households. The most numerous type of family households are 2-person households, comprising 601, and the most common type of nonfamily households are 1-person households, comprising 832.
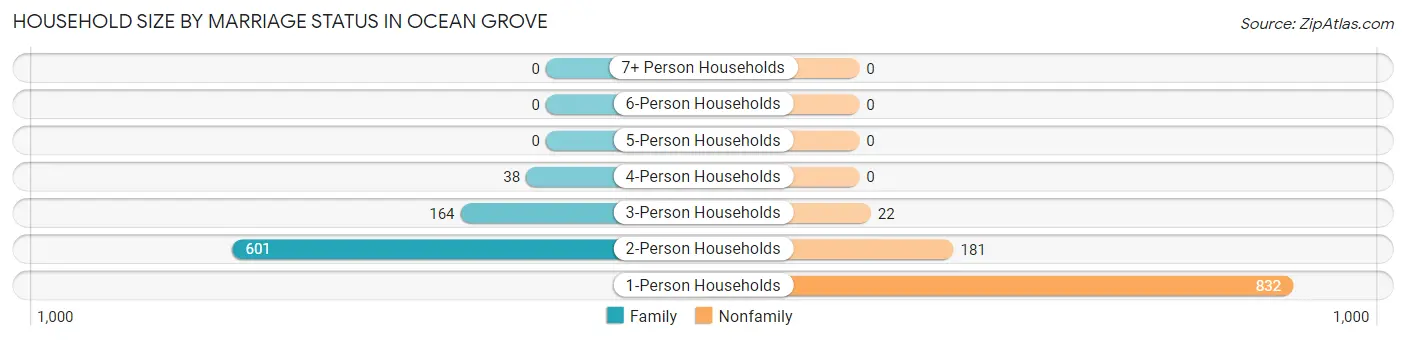
| Household Size | Family Households | Nonfamily Households |
| 1-Person Households | - | 832 (45.3%) |
| 2-Person Households | 601 (32.7%) | 181 (9.9%) |
| 3-Person Households | 164 (8.9%) | 22 (1.2%) |
| 4-Person Households | 38 (2.1%) | 0 (0.0%) |
| 5-Person Households | 0 (0.0%) | 0 (0.0%) |
| 6-Person Households | 0 (0.0%) | 0 (0.0%) |
| 7+ Person Households | 0 (0.0%) | 0 (0.0%) |
| Total | 803 (43.7%) | 1,035 (56.3%) |
Female Fertility in Ocean Grove
Fertility by Age in Ocean Grove
Average fertility rate in Ocean Grove is 74.0 births per 1,000 women. Women in the age bracket of 35 to 50 years have the highest fertility rate with 174.0 births per 1,000 women. Women in the age bracket of 35 to 50 years acount for 100.0% of all women with births.
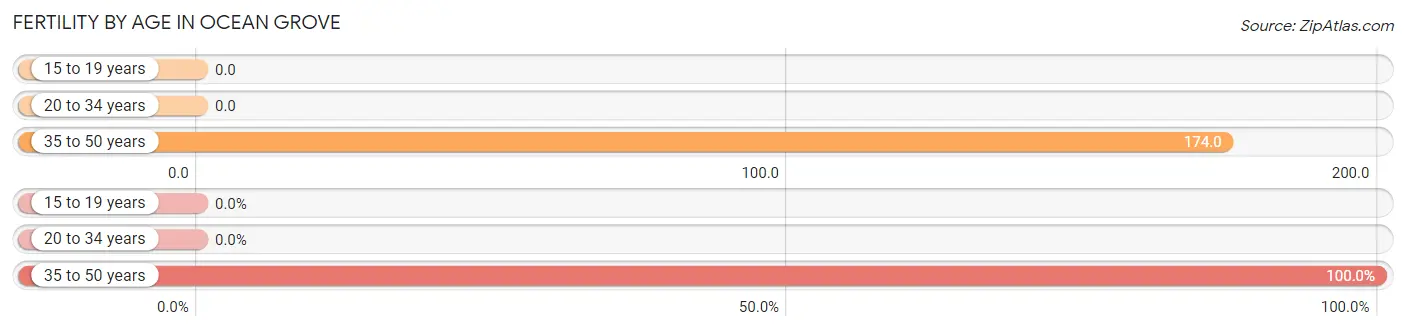
| Age Bracket | Women with Births | Births / 1,000 Women |
| 15 to 19 years | 0 (0.0%) | 0.0 |
| 20 to 34 years | 0 (0.0%) | 0.0 |
| 35 to 50 years | 39 (100.0%) | 174.0 |
| Total | 39 (100.0%) | 74.0 |
Fertility by Age by Marriage Status in Ocean Grove
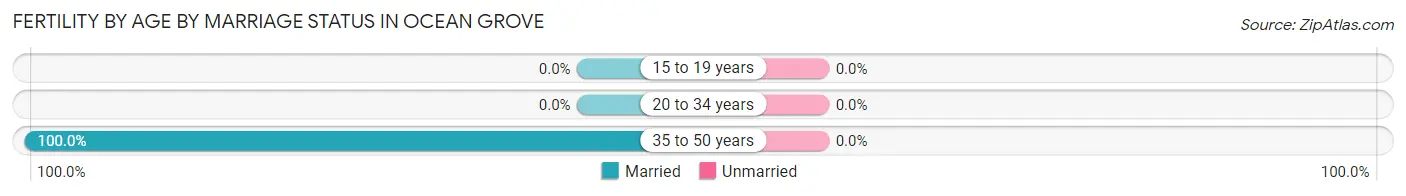
| Age Bracket | Married | Unmarried |
| 15 to 19 years | 0 (0.0%) | 0 (0.0%) |
| 20 to 34 years | 0 (0.0%) | 0 (0.0%) |
| 35 to 50 years | 39 (100.0%) | 0 (0.0%) |
| Total | 39 (100.0%) | 0 (0.0%) |
Fertility by Education in Ocean Grove
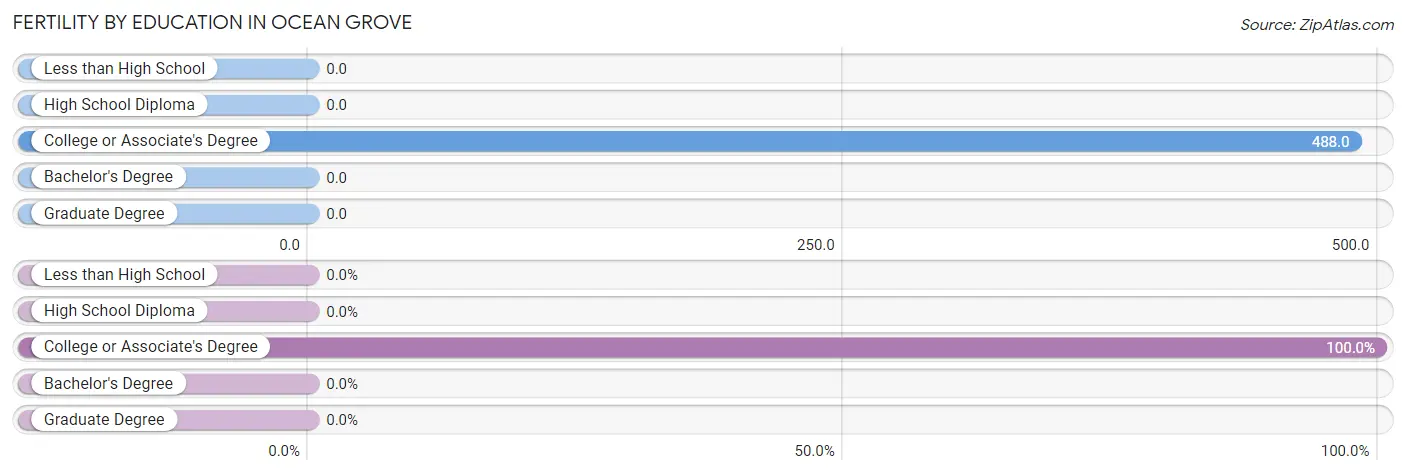
| Educational Attainment | Women with Births | Births / 1,000 Women |
| Less than High School | 0 (0.0%) | 0.0 |
| High School Diploma | 0 (0.0%) | 0.0 |
| College or Associate's Degree | 39 (100.0%) | 488.0 |
| Bachelor's Degree | 0 (0.0%) | 0.0 |
| Graduate Degree | 0 (0.0%) | 0.0 |
| Total | 39 (100.0%) | 74.0 |
Fertility by Education by Marriage Status in Ocean Grove
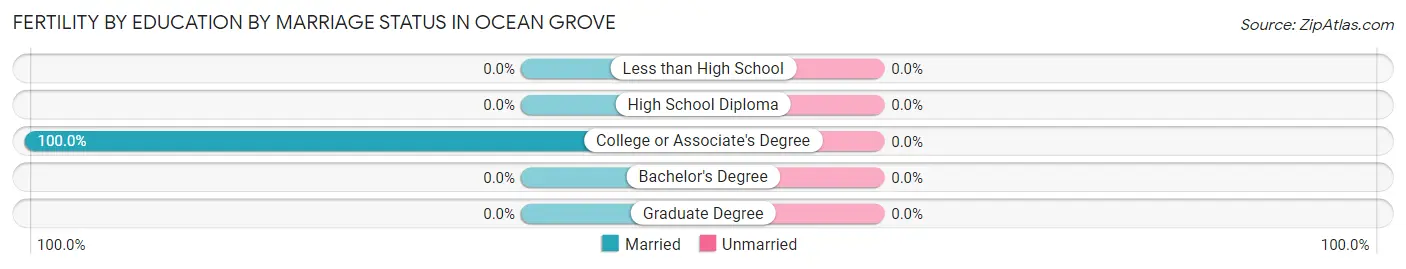
| Educational Attainment | Married | Unmarried |
| Less than High School | 0 (0.0%) | 0 (0.0%) |
| High School Diploma | 0 (0.0%) | 0 (0.0%) |
| College or Associate's Degree | 39 (100.0%) | 0 (0.0%) |
| Bachelor's Degree | 0 (0.0%) | 0 (0.0%) |
| Graduate Degree | 0 (0.0%) | 0 (0.0%) |
| Total | 39 (100.0%) | 0 (0.0%) |
Employment Characteristics in Ocean Grove
Employment by Class of Employer in Ocean Grove
Among the 1,623 employed individuals in Ocean Grove, private company employees (1,110 | 68.4%), not-for-profit organizations (160 | 9.9%), and state government employees (138 | 8.5%) make up the most common classes of employment.
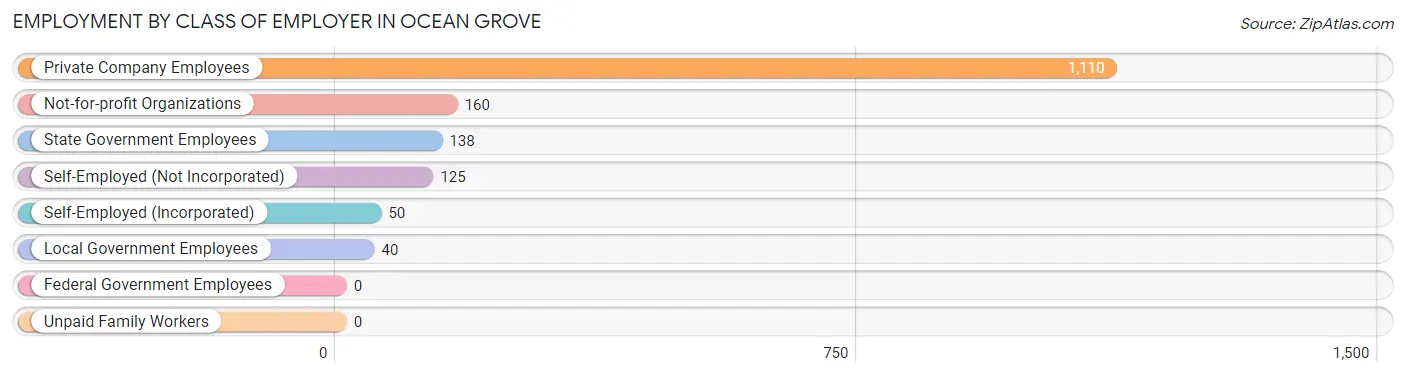
| Employer Class | # Employees | % Employees |
| Private Company Employees | 1,110 | 68.4% |
| Self-Employed (Incorporated) | 50 | 3.1% |
| Self-Employed (Not Incorporated) | 125 | 7.7% |
| Not-for-profit Organizations | 160 | 9.9% |
| Local Government Employees | 40 | 2.5% |
| State Government Employees | 138 | 8.5% |
| Federal Government Employees | 0 | 0.0% |
| Unpaid Family Workers | 0 | 0.0% |
| Total | 1,623 | 100.0% |
Employment Status by Age in Ocean Grove
According to the labor force statistics for Ocean Grove, out of the total population over 16 years of age (3,041), 58.1% or 1,767 individuals are in the labor force, with 7.2% or 127 of them unemployed. The age group with the highest labor force participation rate is 20 to 24 years, with 100.0% or 35 individuals in the labor force. Within the labor force, the 65 to 74 years age range has the highest percentage of unemployed individuals, with 23.1% or 54 of them being unemployed.
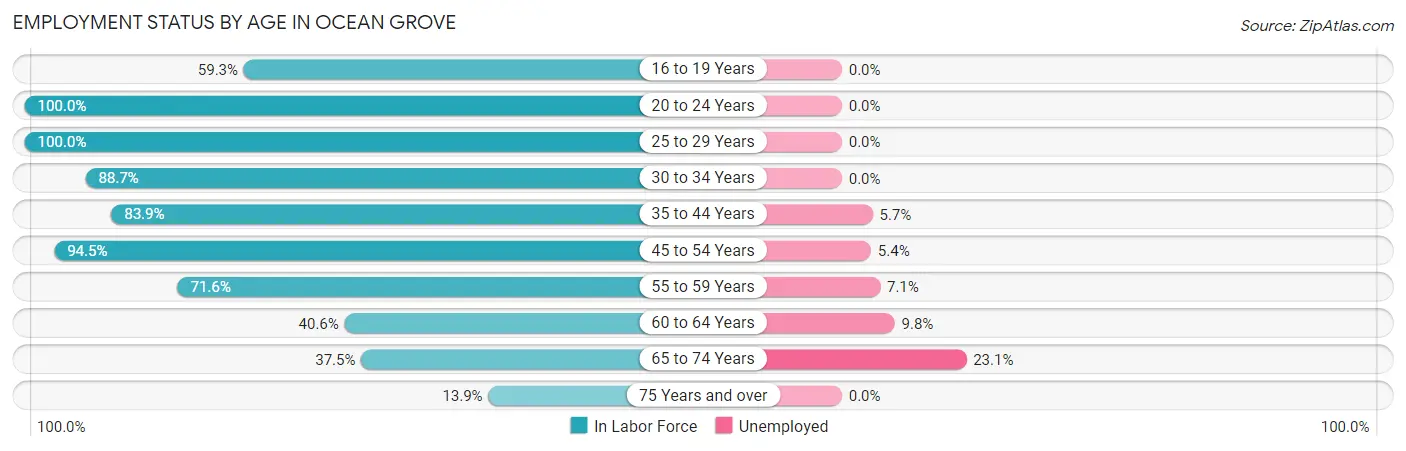
| Age Bracket | In Labor Force | Unemployed |
| 16 to 19 Years | 16 (59.3%) | 0 (0.0%) |
| 20 to 24 Years | 35 (100.0%) | 0 (0.0%) |
| 25 to 29 Years | 334 (100.0%) | 0 (0.0%) |
| 30 to 34 Years | 55 (88.7%) | 0 (0.0%) |
| 35 to 44 Years | 297 (83.9%) | 17 (5.7%) |
| 45 to 54 Years | 276 (94.5%) | 15 (5.4%) |
| 55 to 59 Years | 169 (71.6%) | 12 (7.1%) |
| 60 to 64 Years | 306 (40.6%) | 30 (9.8%) |
| 65 to 74 Years | 234 (37.5%) | 54 (23.1%) |
| 75 Years and over | 45 (13.9%) | 0 (0.0%) |
| Total | 1,767 (58.1%) | 127 (7.2%) |
Employment Status by Educational Attainment in Ocean Grove
According to labor force statistics for Ocean Grove, 70.7% of individuals (1,437) out of the total population between 25 and 64 years of age (2,032) are in the labor force, with 5.1% or 73 of them being unemployed. The group with the highest labor force participation rate are those with the educational attainment of less than high school, with 100.0% or 159 individuals in the labor force. Within the labor force, individuals with less than high school education have the highest percentage of unemployment, with 10.7% or 17 of them being unemployed.
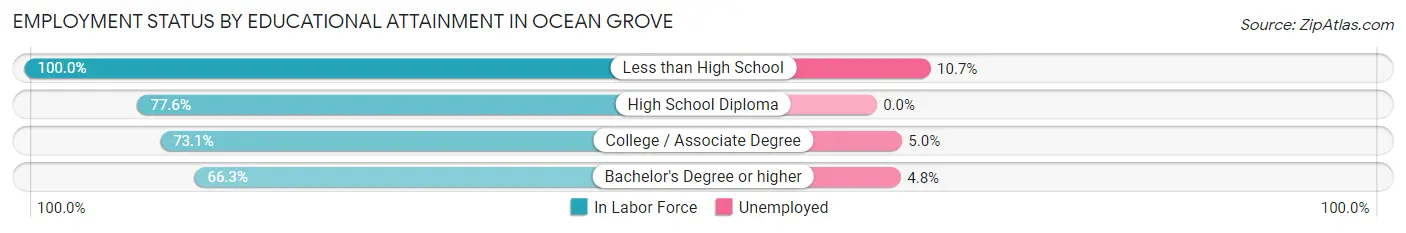
| Educational Attainment | In Labor Force | Unemployed |
| Less than High School | 159 (100.0%) | 17 (10.7%) |
| High School Diploma | 97 (77.6%) | 0 (0.0%) |
| College / Associate Degree | 239 (73.1%) | 16 (5.0%) |
| Bachelor's Degree or higher | 942 (66.3%) | 68 (4.8%) |
| Total | 1,437 (70.7%) | 104 (5.1%) |
Employment Occupations by Sex in Ocean Grove
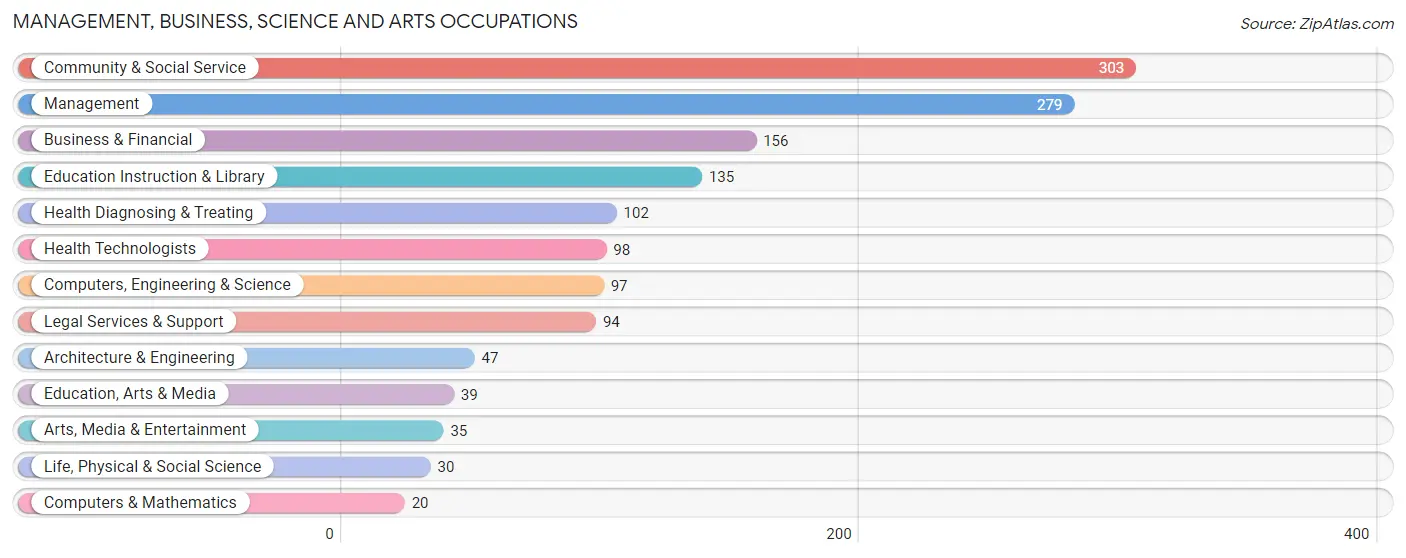
Management, Business, Science and Arts Occupations
The most common Management, Business, Science and Arts occupations in Ocean Grove are Community & Social Service (303 | 18.5%), Management (279 | 17.0%), Business & Financial (156 | 9.5%), Education Instruction & Library (135 | 8.2%), and Health Diagnosing & Treating (102 | 6.2%).
Management, Business, Science and Arts Occupations by Sex
Within the Management, Business, Science and Arts occupations in Ocean Grove, the most male-oriented occupations are Business & Financial (84.0%), Education, Arts & Media (76.9%), and Management (68.5%), while the most female-oriented occupations are Education Instruction & Library (94.8%), Health Diagnosing & Treating (80.4%), and Health Technologists (79.6%).
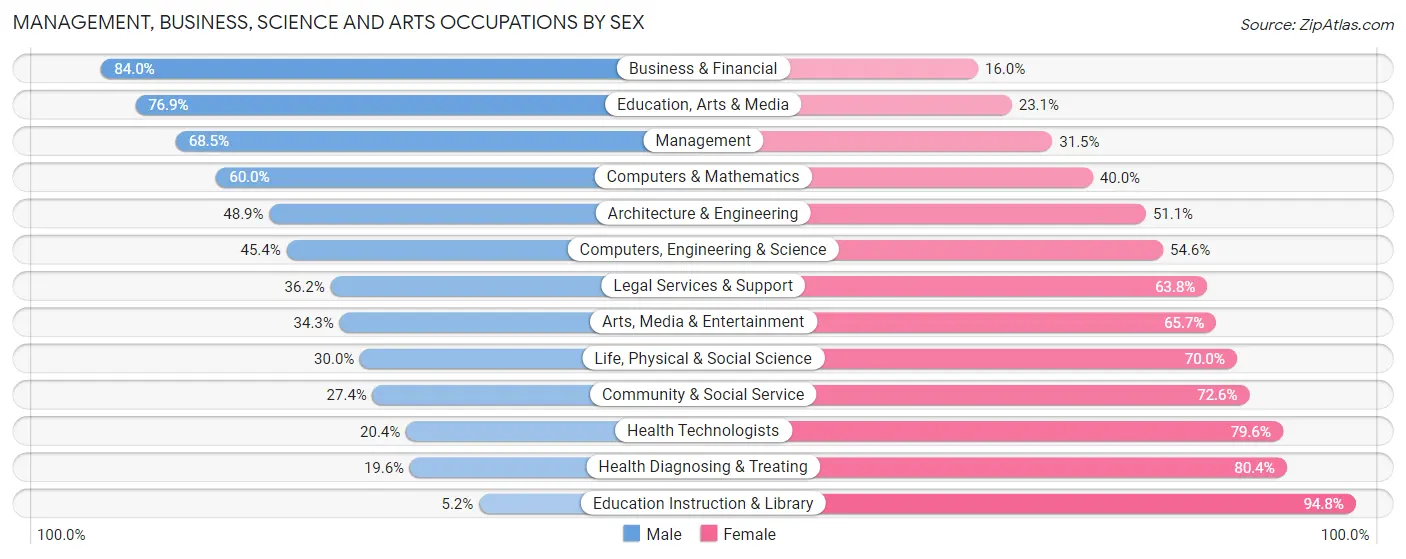
| Occupation | Male | Female |
| Management | 191 (68.5%) | 88 (31.5%) |
| Business & Financial | 131 (84.0%) | 25 (16.0%) |
| Computers, Engineering & Science | 44 (45.4%) | 53 (54.6%) |
| Computers & Mathematics | 12 (60.0%) | 8 (40.0%) |
| Architecture & Engineering | 23 (48.9%) | 24 (51.1%) |
| Life, Physical & Social Science | 9 (30.0%) | 21 (70.0%) |
| Community & Social Service | 83 (27.4%) | 220 (72.6%) |
| Education, Arts & Media | 30 (76.9%) | 9 (23.1%) |
| Legal Services & Support | 34 (36.2%) | 60 (63.8%) |
| Education Instruction & Library | 7 (5.2%) | 128 (94.8%) |
| Arts, Media & Entertainment | 12 (34.3%) | 23 (65.7%) |
| Health Diagnosing & Treating | 20 (19.6%) | 82 (80.4%) |
| Health Technologists | 20 (20.4%) | 78 (79.6%) |
| Total (Category) | 469 (50.0%) | 468 (49.9%) |
| Total (Overall) | 806 (49.2%) | 833 (50.8%) |
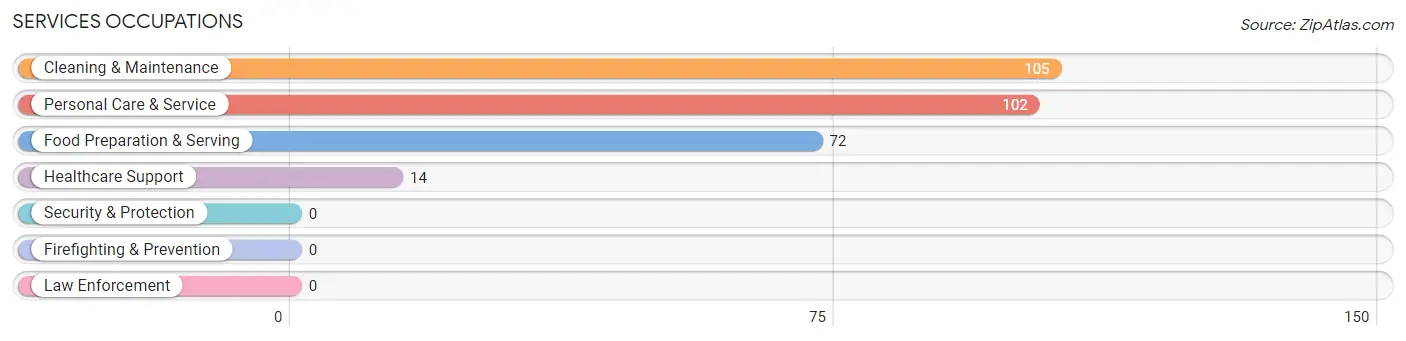
Services Occupations
The most common Services occupations in Ocean Grove are Cleaning & Maintenance (105 | 6.4%), Personal Care & Service (102 | 6.2%), Food Preparation & Serving (72 | 4.4%), and Healthcare Support (14 | 0.9%).
Services Occupations by Sex
Within the Services occupations in Ocean Grove, the most male-oriented occupations are Personal Care & Service (7.8%), and Cleaning & Maintenance (3.8%), while the most female-oriented occupations are Healthcare Support (100.0%), Food Preparation & Serving (100.0%), and Cleaning & Maintenance (96.2%).
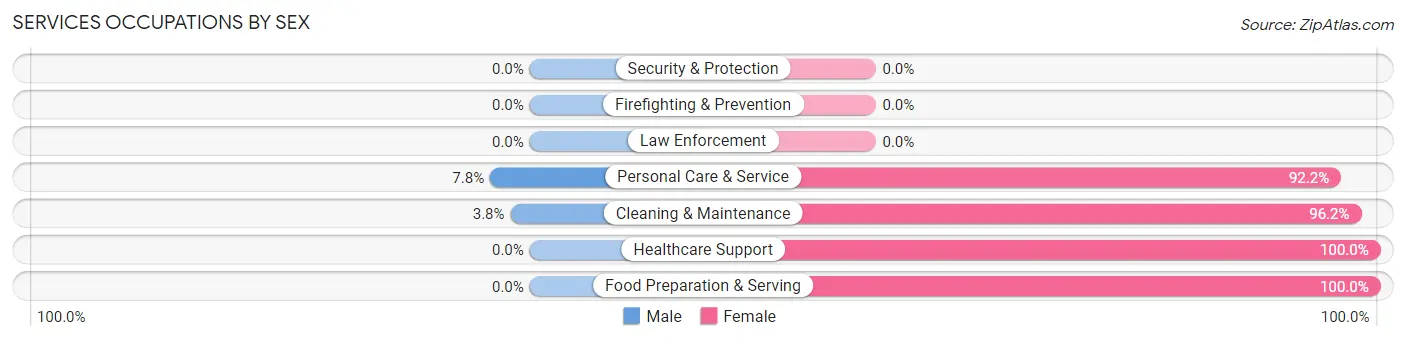
| Occupation | Male | Female |
| Healthcare Support | 0 (0.0%) | 14 (100.0%) |
| Security & Protection | 0 (0.0%) | 0 (0.0%) |
| Firefighting & Prevention | 0 (0.0%) | 0 (0.0%) |
| Law Enforcement | 0 (0.0%) | 0 (0.0%) |
| Food Preparation & Serving | 0 (0.0%) | 72 (100.0%) |
| Cleaning & Maintenance | 4 (3.8%) | 101 (96.2%) |
| Personal Care & Service | 8 (7.8%) | 94 (92.2%) |
| Total (Category) | 12 (4.1%) | 281 (95.9%) |
| Total (Overall) | 806 (49.2%) | 833 (50.8%) |
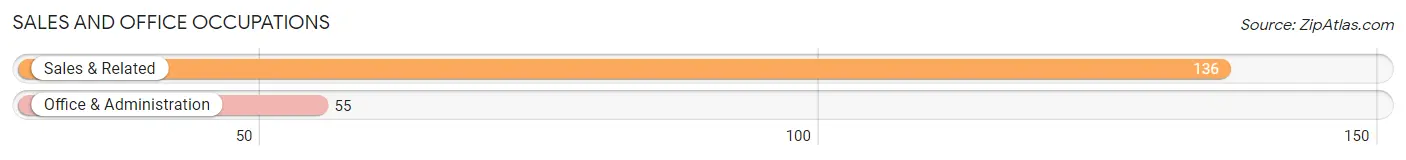
Sales and Office Occupations
The most common Sales and Office occupations in Ocean Grove are Sales & Related (136 | 8.3%), and Office & Administration (55 | 3.4%).
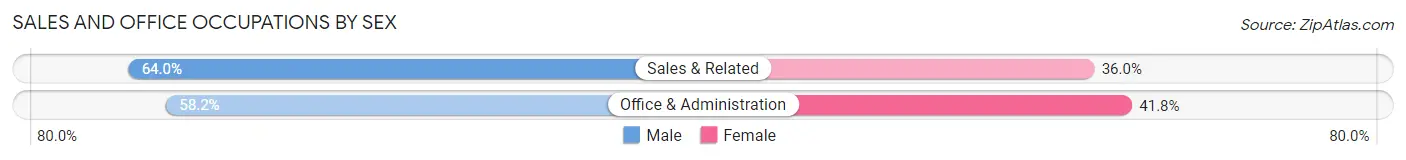
Sales and Office Occupations by Sex
| Occupation | Male | Female |
| Sales & Related | 87 (64.0%) | 49 (36.0%) |
| Office & Administration | 32 (58.2%) | 23 (41.8%) |
| Total (Category) | 119 (62.3%) | 72 (37.7%) |
| Total (Overall) | 806 (49.2%) | 833 (50.8%) |
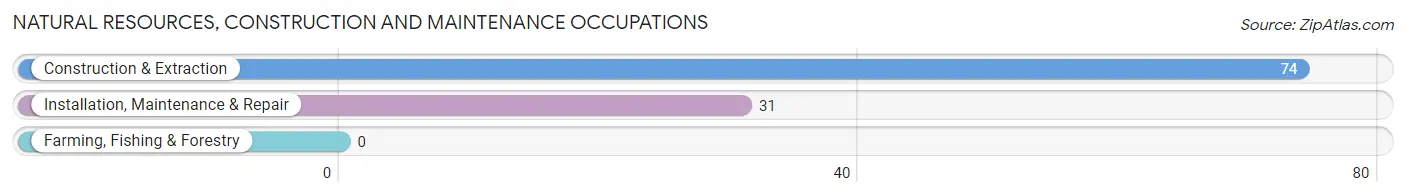
Natural Resources, Construction and Maintenance Occupations
The most common Natural Resources, Construction and Maintenance occupations in Ocean Grove are Construction & Extraction (74 | 4.5%), and Installation, Maintenance & Repair (31 | 1.9%).
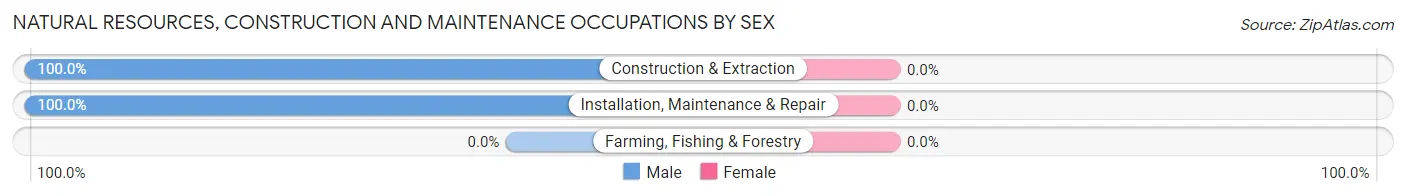
Natural Resources, Construction and Maintenance Occupations by Sex
| Occupation | Male | Female |
| Farming, Fishing & Forestry | 0 (0.0%) | 0 (0.0%) |
| Construction & Extraction | 74 (100.0%) | 0 (0.0%) |
| Installation, Maintenance & Repair | 31 (100.0%) | 0 (0.0%) |
| Total (Category) | 105 (100.0%) | 0 (0.0%) |
| Total (Overall) | 806 (49.2%) | 833 (50.8%) |
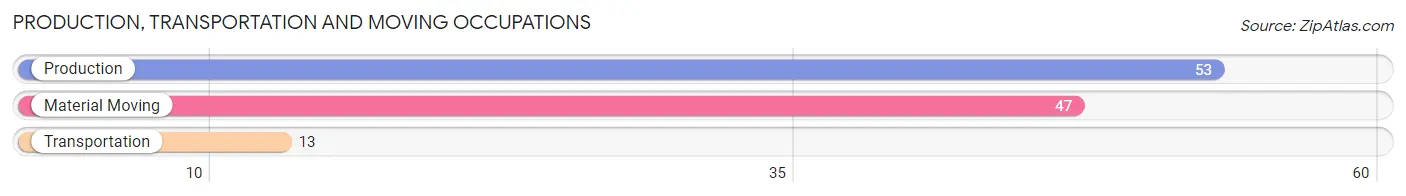
Production, Transportation and Moving Occupations
The most common Production, Transportation and Moving occupations in Ocean Grove are Production (53 | 3.2%), Material Moving (47 | 2.9%), and Transportation (13 | 0.8%).
Production, Transportation and Moving Occupations by Sex
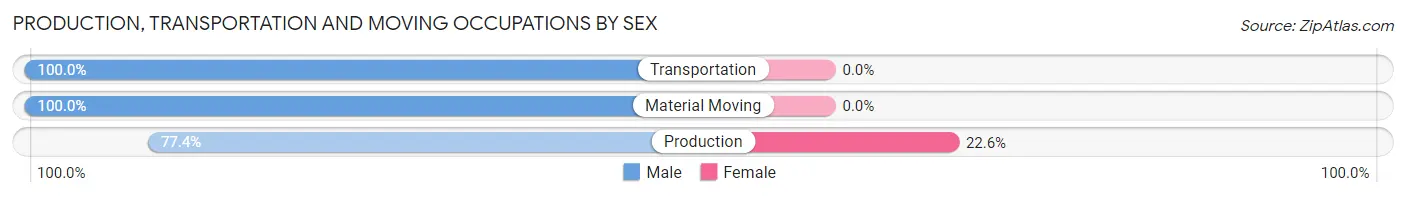
| Occupation | Male | Female |
| Production | 41 (77.4%) | 12 (22.6%) |
| Transportation | 13 (100.0%) | 0 (0.0%) |
| Material Moving | 47 (100.0%) | 0 (0.0%) |
| Total (Category) | 101 (89.4%) | 12 (10.6%) |
| Total (Overall) | 806 (49.2%) | 833 (50.8%) |
Employment Industries by Sex in Ocean Grove
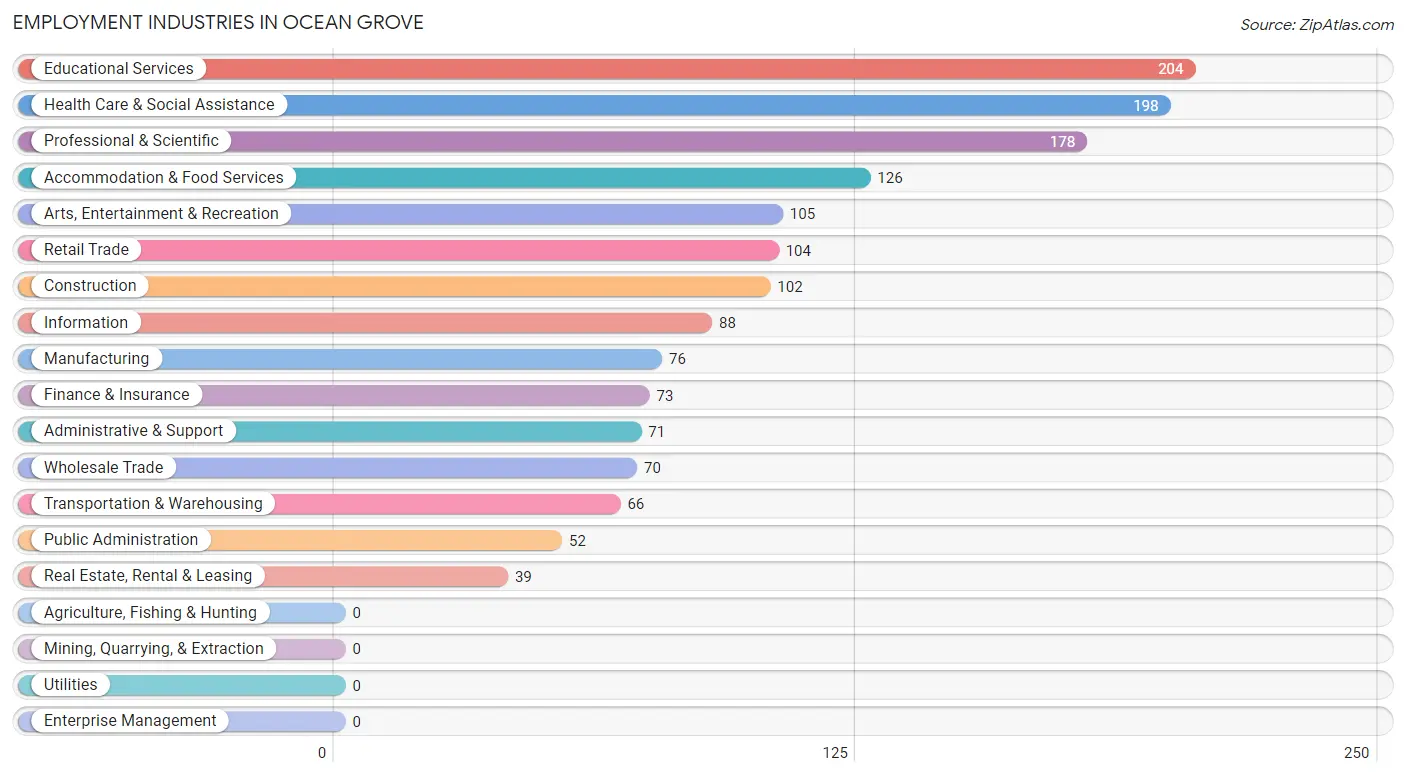
Employment Industries in Ocean Grove
The major employment industries in Ocean Grove include Educational Services (204 | 12.4%), Health Care & Social Assistance (198 | 12.1%), Professional & Scientific (178 | 10.9%), Accommodation & Food Services (126 | 7.7%), and Arts, Entertainment & Recreation (105 | 6.4%).
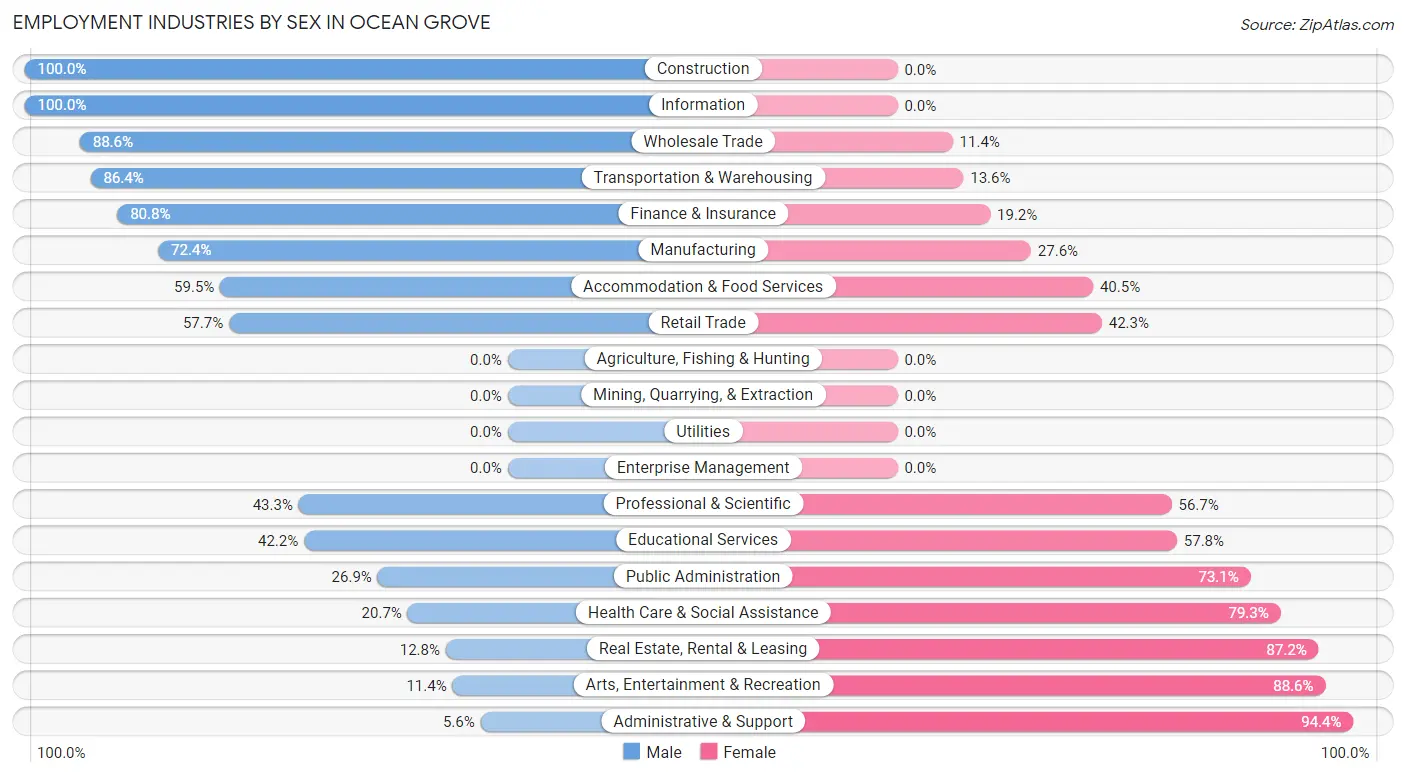
Employment Industries by Sex in Ocean Grove
The Ocean Grove industries that see more men than women are Construction (100.0%), Information (100.0%), and Wholesale Trade (88.6%), whereas the industries that tend to have a higher number of women are Administrative & Support (94.4%), Arts, Entertainment & Recreation (88.6%), and Real Estate, Rental & Leasing (87.2%).
| Industry | Male | Female |
| Agriculture, Fishing & Hunting | 0 (0.0%) | 0 (0.0%) |
| Mining, Quarrying, & Extraction | 0 (0.0%) | 0 (0.0%) |
| Construction | 102 (100.0%) | 0 (0.0%) |
| Manufacturing | 55 (72.4%) | 21 (27.6%) |
| Wholesale Trade | 62 (88.6%) | 8 (11.4%) |
| Retail Trade | 60 (57.7%) | 44 (42.3%) |
| Transportation & Warehousing | 57 (86.4%) | 9 (13.6%) |
| Utilities | 0 (0.0%) | 0 (0.0%) |
| Information | 88 (100.0%) | 0 (0.0%) |
| Finance & Insurance | 59 (80.8%) | 14 (19.2%) |
| Real Estate, Rental & Leasing | 5 (12.8%) | 34 (87.2%) |
| Professional & Scientific | 77 (43.3%) | 101 (56.7%) |
| Enterprise Management | 0 (0.0%) | 0 (0.0%) |
| Administrative & Support | 4 (5.6%) | 67 (94.4%) |
| Educational Services | 86 (42.2%) | 118 (57.8%) |
| Health Care & Social Assistance | 41 (20.7%) | 157 (79.3%) |
| Arts, Entertainment & Recreation | 12 (11.4%) | 93 (88.6%) |
| Accommodation & Food Services | 75 (59.5%) | 51 (40.5%) |
| Public Administration | 14 (26.9%) | 38 (73.1%) |
| Total | 806 (49.2%) | 833 (50.8%) |
Education in Ocean Grove
School Enrollment in Ocean Grove
The most common levels of schooling among the 243 students in Ocean Grove are graduate / professional (142 | 58.4%), nursery / preschool (40 | 16.5%), and college / undergraduate (36 | 14.8%).
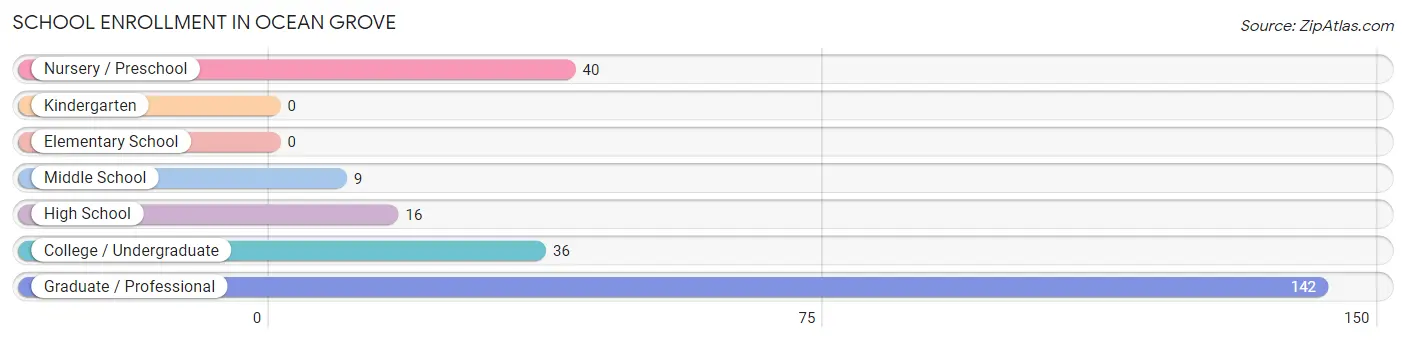
| School Level | # Students | % Students |
| Nursery / Preschool | 40 | 16.5% |
| Kindergarten | 0 | 0.0% |
| Elementary School | 0 | 0.0% |
| Middle School | 9 | 3.7% |
| High School | 16 | 6.6% |
| College / Undergraduate | 36 | 14.8% |
| Graduate / Professional | 142 | 58.4% |
| Total | 243 | 100.0% |
School Enrollment by Age by Funding Source in Ocean Grove
Out of a total of 243 students who are enrolled in schools in Ocean Grove, 43 (17.7%) attend a private institution, while the remaining 200 (82.3%) are enrolled in public schools. The age group of 15 to 17 year olds has the highest likelihood of being enrolled in private schools, with 16 (100.0% in the age bracket) enrolled. Conversely, the age group of 10 to 14 year olds has the lowest likelihood of being enrolled in a private school, with 9 (100.0% in the age bracket) attending a public institution.
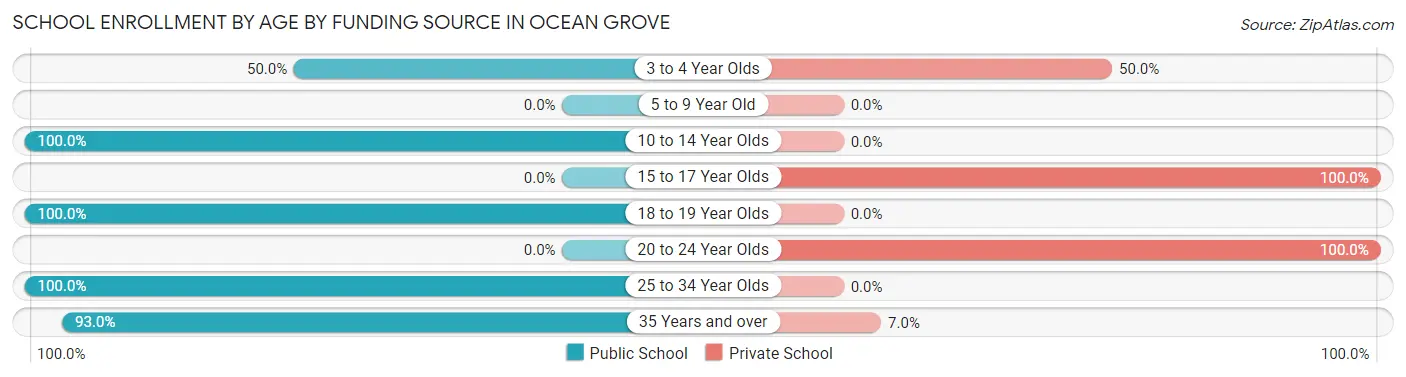
| Age Bracket | Public School | Private School |
| 3 to 4 Year Olds | 20 (50.0%) | 20 (50.0%) |
| 5 to 9 Year Old | 0 (0.0%) | 0 (0.0%) |
| 10 to 14 Year Olds | 9 (100.0%) | 0 (0.0%) |
| 15 to 17 Year Olds | 0 (0.0%) | 16 (100.0%) |
| 18 to 19 Year Olds | 11 (100.0%) | 0 (0.0%) |
| 20 to 24 Year Olds | 0 (0.0%) | 4 (100.0%) |
| 25 to 34 Year Olds | 120 (100.0%) | 0 (0.0%) |
| 35 Years and over | 40 (93.0%) | 3 (7.0%) |
| Total | 200 (82.3%) | 43 (17.7%) |
Educational Attainment by Field of Study in Ocean Grove
Business (483 | 21.5%), social sciences (346 | 15.4%), education (238 | 10.6%), literature & languages (207 | 9.2%), and communications (148 | 6.6%) are the most common fields of study among 2,249 individuals in Ocean Grove who have obtained a bachelor's degree or higher.
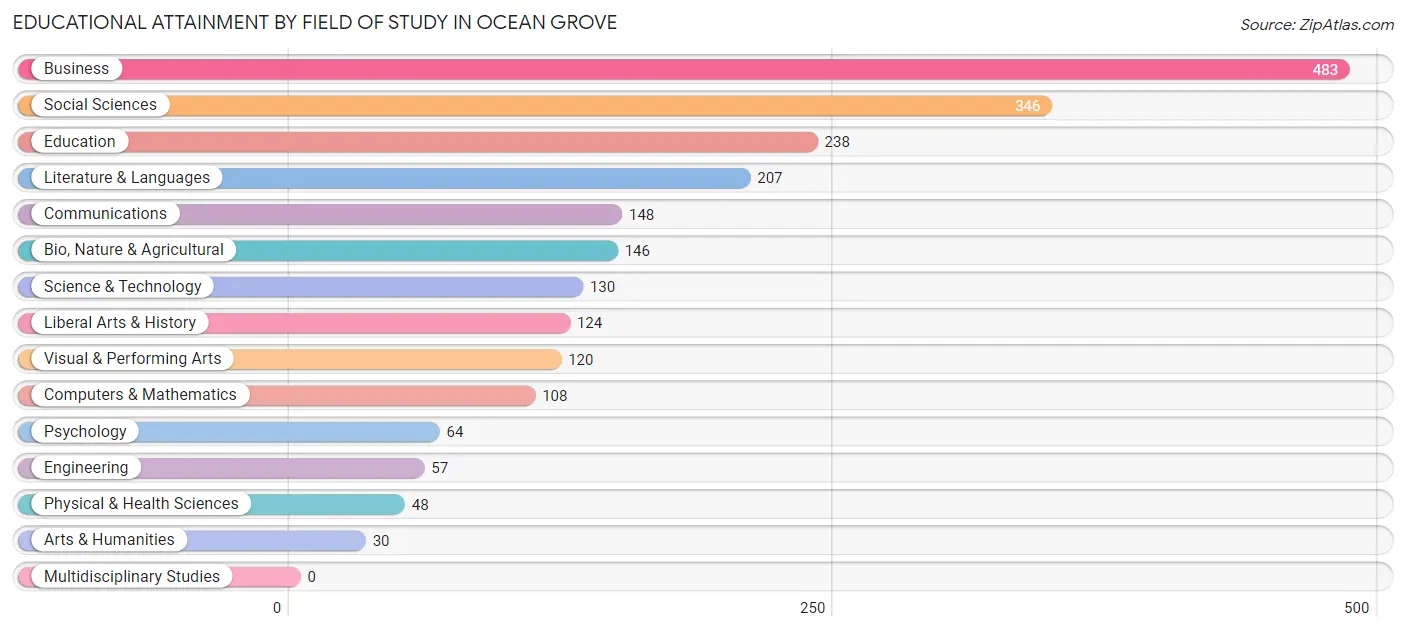
| Field of Study | # Graduates | % Graduates |
| Computers & Mathematics | 108 | 4.8% |
| Bio, Nature & Agricultural | 146 | 6.5% |
| Physical & Health Sciences | 48 | 2.1% |
| Psychology | 64 | 2.9% |
| Social Sciences | 346 | 15.4% |
| Engineering | 57 | 2.5% |
| Multidisciplinary Studies | 0 | 0.0% |
| Science & Technology | 130 | 5.8% |
| Business | 483 | 21.5% |
| Education | 238 | 10.6% |
| Literature & Languages | 207 | 9.2% |
| Liberal Arts & History | 124 | 5.5% |
| Visual & Performing Arts | 120 | 5.3% |
| Communications | 148 | 6.6% |
| Arts & Humanities | 30 | 1.3% |
| Total | 2,249 | 100.0% |
Transportation & Commute in Ocean Grove
Vehicle Availability by Sex in Ocean Grove
The most prevalent vehicle ownership categories in Ocean Grove are males with 2 vehicles (315, accounting for 39.1%) and females with 2 vehicles (311, making up 38.8%).
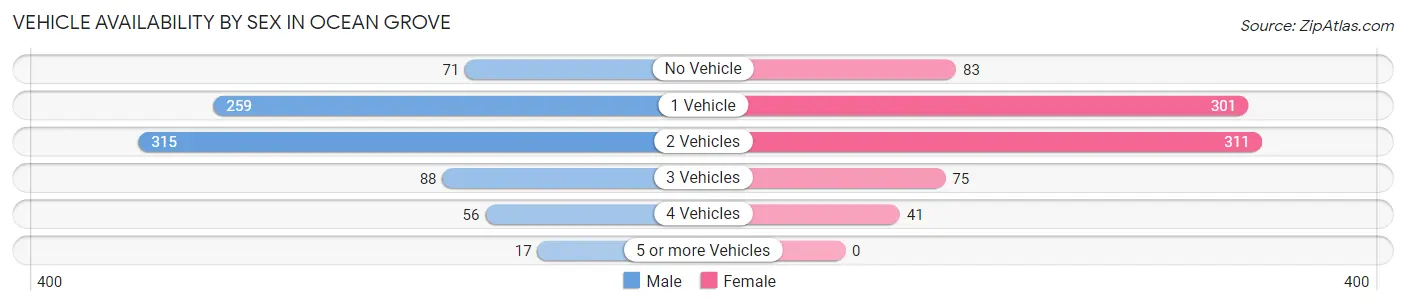
| Vehicles Available | Male | Female |
| No Vehicle | 71 (8.8%) | 83 (10.2%) |
| 1 Vehicle | 259 (32.1%) | 301 (37.1%) |
| 2 Vehicles | 315 (39.1%) | 311 (38.4%) |
| 3 Vehicles | 88 (10.9%) | 75 (9.2%) |
| 4 Vehicles | 56 (7.0%) | 41 (5.1%) |
| 5 or more Vehicles | 17 (2.1%) | 0 (0.0%) |
| Total | 806 (100.0%) | 811 (100.0%) |
Commute Time in Ocean Grove
The most frequently occuring commute durations in Ocean Grove are 5 to 9 minutes (264 commuters, 20.6%), 30 to 34 minutes (168 commuters, 13.1%), and 15 to 19 minutes (153 commuters, 11.9%).
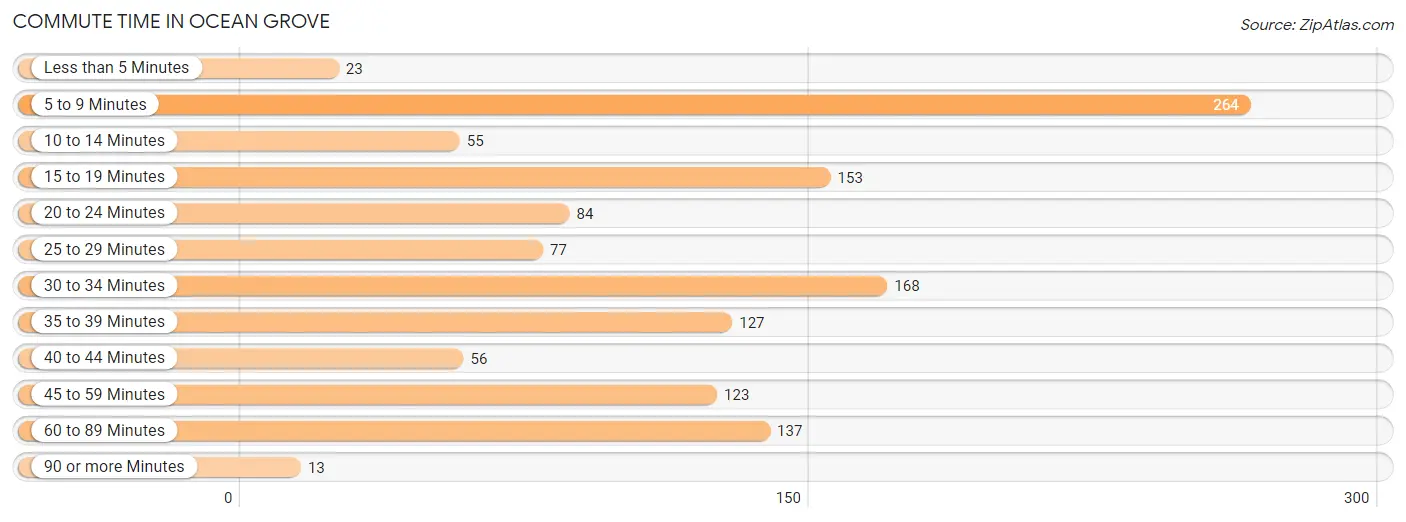
| Commute Time | # Commuters | % Commuters |
| Less than 5 Minutes | 23 | 1.8% |
| 5 to 9 Minutes | 264 | 20.6% |
| 10 to 14 Minutes | 55 | 4.3% |
| 15 to 19 Minutes | 153 | 11.9% |
| 20 to 24 Minutes | 84 | 6.6% |
| 25 to 29 Minutes | 77 | 6.0% |
| 30 to 34 Minutes | 168 | 13.1% |
| 35 to 39 Minutes | 127 | 9.9% |
| 40 to 44 Minutes | 56 | 4.4% |
| 45 to 59 Minutes | 123 | 9.6% |
| 60 to 89 Minutes | 137 | 10.7% |
| 90 or more Minutes | 13 | 1.0% |
Commute Time by Sex in Ocean Grove
The most common commute times in Ocean Grove are 30 to 34 minutes (151 commuters, 21.5%) for males and 5 to 9 minutes (158 commuters, 27.3%) for females.
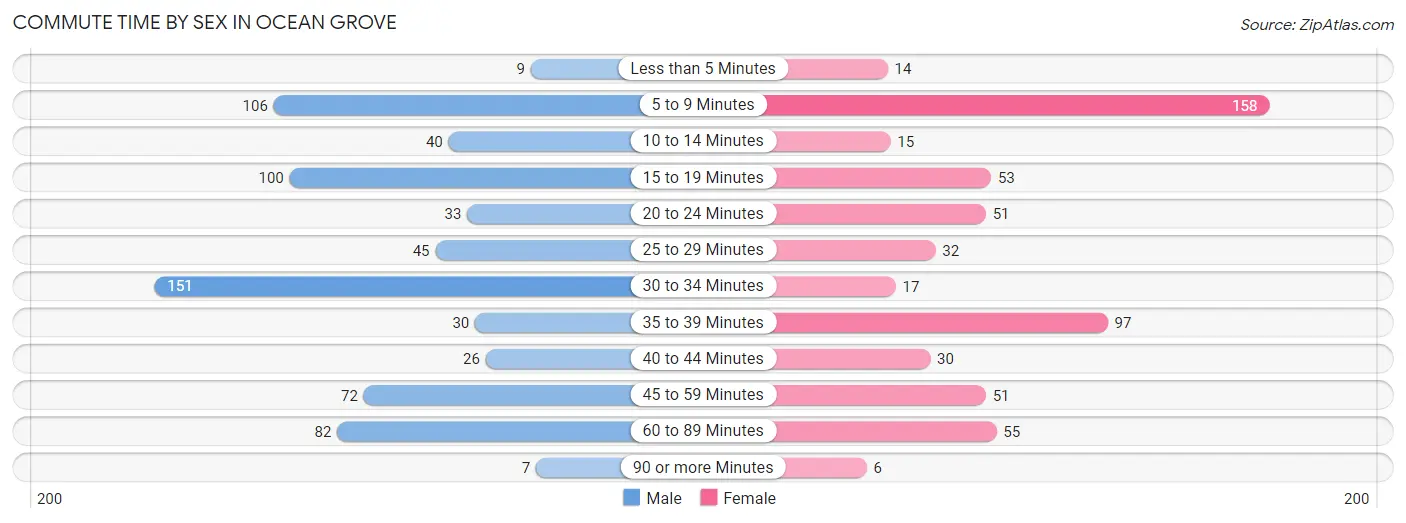
| Commute Time | Male | Female |
| Less than 5 Minutes | 9 (1.3%) | 14 (2.4%) |
| 5 to 9 Minutes | 106 (15.1%) | 158 (27.3%) |
| 10 to 14 Minutes | 40 (5.7%) | 15 (2.6%) |
| 15 to 19 Minutes | 100 (14.3%) | 53 (9.1%) |
| 20 to 24 Minutes | 33 (4.7%) | 51 (8.8%) |
| 25 to 29 Minutes | 45 (6.4%) | 32 (5.5%) |
| 30 to 34 Minutes | 151 (21.5%) | 17 (2.9%) |
| 35 to 39 Minutes | 30 (4.3%) | 97 (16.8%) |
| 40 to 44 Minutes | 26 (3.7%) | 30 (5.2%) |
| 45 to 59 Minutes | 72 (10.3%) | 51 (8.8%) |
| 60 to 89 Minutes | 82 (11.7%) | 55 (9.5%) |
| 90 or more Minutes | 7 (1.0%) | 6 (1.0%) |
Time of Departure to Work by Sex in Ocean Grove
The most frequent times of departure to work in Ocean Grove are 8:00 AM to 8:29 AM (253, 36.1%) for males and 6:30 AM to 6:59 AM (109, 18.8%) for females.
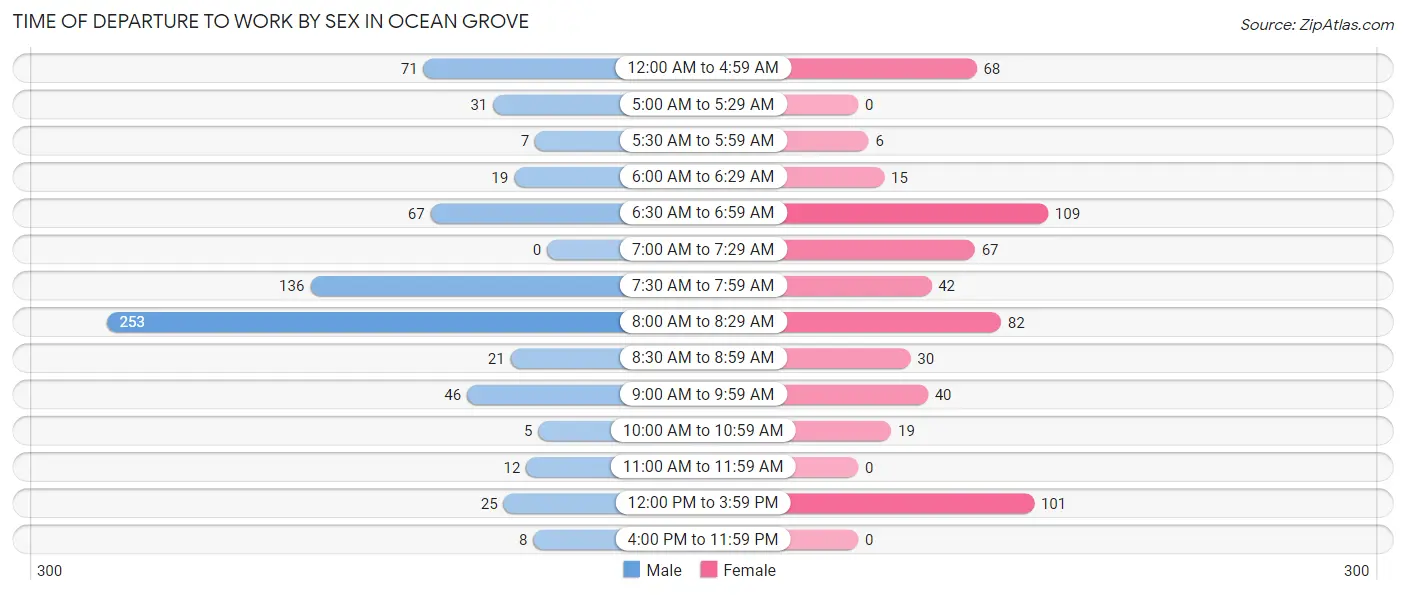
| Time of Departure | Male | Female |
| 12:00 AM to 4:59 AM | 71 (10.1%) | 68 (11.7%) |
| 5:00 AM to 5:29 AM | 31 (4.4%) | 0 (0.0%) |
| 5:30 AM to 5:59 AM | 7 (1.0%) | 6 (1.0%) |
| 6:00 AM to 6:29 AM | 19 (2.7%) | 15 (2.6%) |
| 6:30 AM to 6:59 AM | 67 (9.6%) | 109 (18.8%) |
| 7:00 AM to 7:29 AM | 0 (0.0%) | 67 (11.6%) |
| 7:30 AM to 7:59 AM | 136 (19.4%) | 42 (7.2%) |
| 8:00 AM to 8:29 AM | 253 (36.1%) | 82 (14.2%) |
| 8:30 AM to 8:59 AM | 21 (3.0%) | 30 (5.2%) |
| 9:00 AM to 9:59 AM | 46 (6.6%) | 40 (6.9%) |
| 10:00 AM to 10:59 AM | 5 (0.7%) | 19 (3.3%) |
| 11:00 AM to 11:59 AM | 12 (1.7%) | 0 (0.0%) |
| 12:00 PM to 3:59 PM | 25 (3.6%) | 101 (17.4%) |
| 4:00 PM to 11:59 PM | 8 (1.1%) | 0 (0.0%) |
| Total | 701 (100.0%) | 579 (100.0%) |
Housing Occupancy in Ocean Grove
Occupancy by Ownership in Ocean Grove
Of the total 1,838 dwellings in Ocean Grove, owner-occupied units account for 942 (51.2%), while renter-occupied units make up 896 (48.7%).
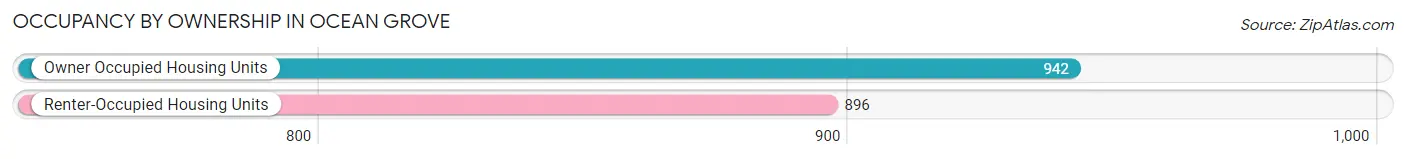
| Occupancy | # Housing Units | % Housing Units |
| Owner Occupied Housing Units | 942 | 51.2% |
| Renter-Occupied Housing Units | 896 | 48.7% |
| Total Occupied Housing Units | 1,838 | 100.0% |
Occupancy by Household Size in Ocean Grove
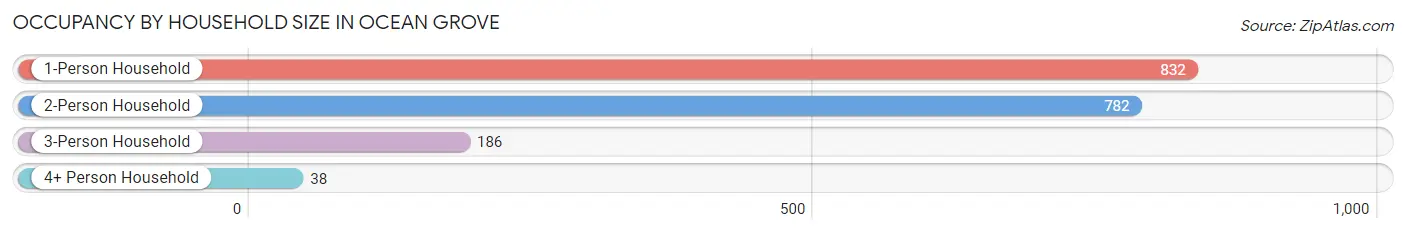
| Household Size | # Housing Units | % Housing Units |
| 1-Person Household | 832 | 45.3% |
| 2-Person Household | 782 | 42.5% |
| 3-Person Household | 186 | 10.1% |
| 4+ Person Household | 38 | 2.1% |
| Total Housing Units | 1,838 | 100.0% |
Occupancy by Ownership by Household Size in Ocean Grove
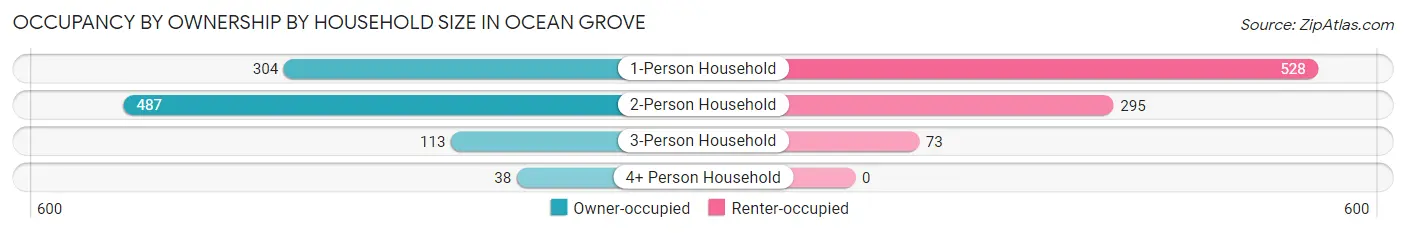
| Household Size | Owner-occupied | Renter-occupied |
| 1-Person Household | 304 (36.5%) | 528 (63.5%) |
| 2-Person Household | 487 (62.3%) | 295 (37.7%) |
| 3-Person Household | 113 (60.8%) | 73 (39.3%) |
| 4+ Person Household | 38 (100.0%) | 0 (0.0%) |
| Total Housing Units | 942 (51.2%) | 896 (48.7%) |
Occupancy by Educational Attainment in Ocean Grove
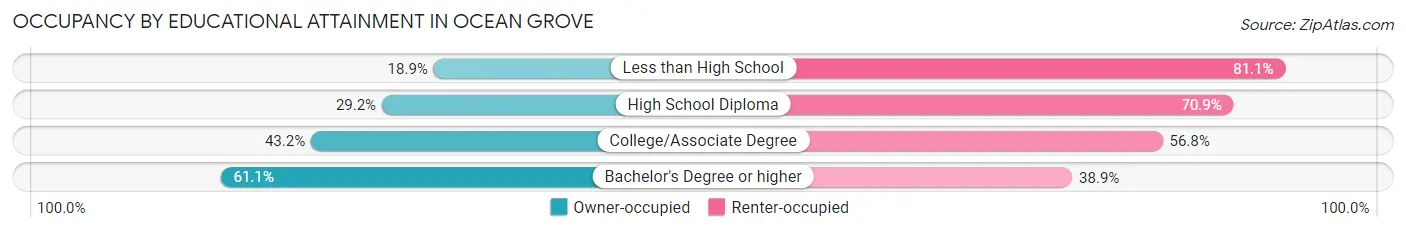
| Household Size | Owner-occupied | Renter-occupied |
| Less than High School | 24 (18.9%) | 103 (81.1%) |
| High School Diploma | 65 (29.1%) | 158 (70.9%) |
| College/Associate Degree | 137 (43.2%) | 180 (56.8%) |
| Bachelor's Degree or higher | 716 (61.1%) | 455 (38.9%) |
Occupancy by Age of Householder in Ocean Grove
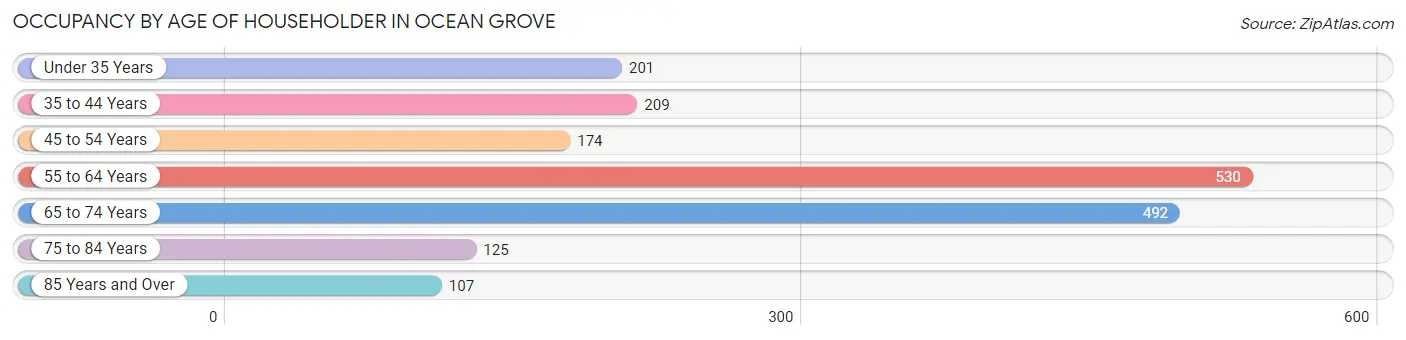
| Age Bracket | # Households | % Households |
| Under 35 Years | 201 | 10.9% |
| 35 to 44 Years | 209 | 11.4% |
| 45 to 54 Years | 174 | 9.5% |
| 55 to 64 Years | 530 | 28.8% |
| 65 to 74 Years | 492 | 26.8% |
| 75 to 84 Years | 125 | 6.8% |
| 85 Years and Over | 107 | 5.8% |
| Total | 1,838 | 100.0% |
Housing Finances in Ocean Grove
Median Income by Occupancy in Ocean Grove
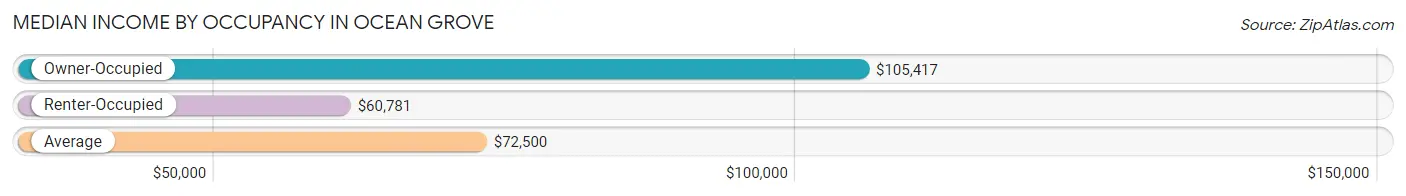
| Occupancy Type | # Households | Median Income |
| Owner-Occupied | 942 (51.2%) | $105,417 |
| Renter-Occupied | 896 (48.7%) | $60,781 |
| Average | 1,838 (100.0%) | $72,500 |
Occupancy by Householder Income Bracket in Ocean Grove
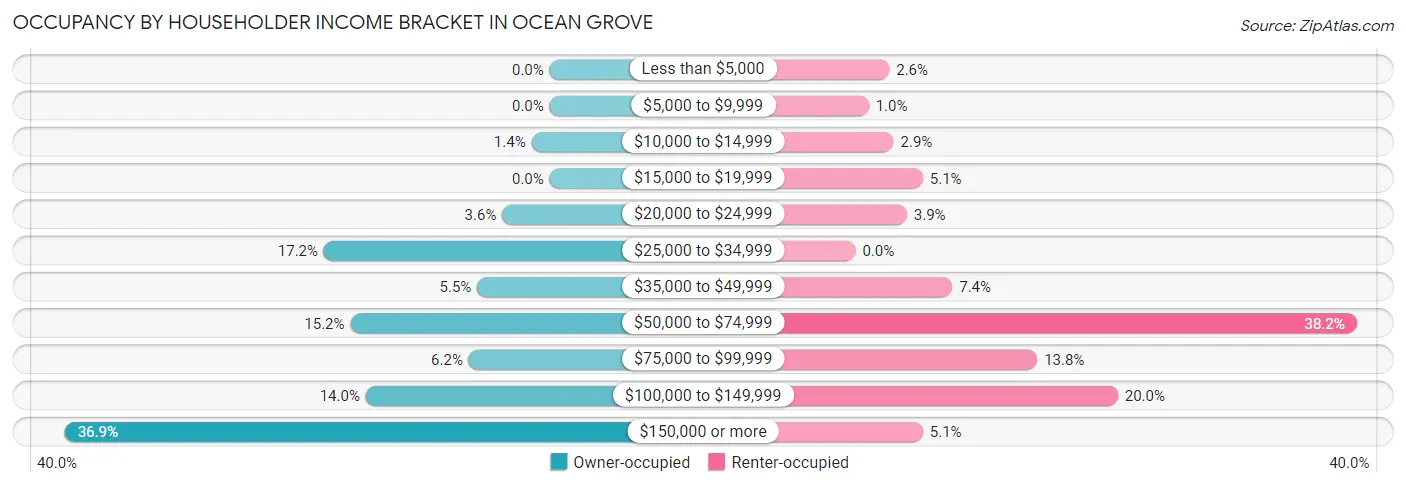
| Income Bracket | Owner-occupied | Renter-occupied |
| Less than $5,000 | 0 (0.0%) | 23 (2.6%) |
| $5,000 to $9,999 | 0 (0.0%) | 9 (1.0%) |
| $10,000 to $14,999 | 13 (1.4%) | 26 (2.9%) |
| $15,000 to $19,999 | 0 (0.0%) | 46 (5.1%) |
| $20,000 to $24,999 | 34 (3.6%) | 35 (3.9%) |
| $25,000 to $34,999 | 162 (17.2%) | 0 (0.0%) |
| $35,000 to $49,999 | 52 (5.5%) | 66 (7.4%) |
| $50,000 to $74,999 | 143 (15.2%) | 342 (38.2%) |
| $75,000 to $99,999 | 58 (6.2%) | 124 (13.8%) |
| $100,000 to $149,999 | 132 (14.0%) | 179 (20.0%) |
| $150,000 or more | 348 (36.9%) | 46 (5.1%) |
| Total | 942 (100.0%) | 896 (100.0%) |
Monthly Housing Cost Tiers in Ocean Grove
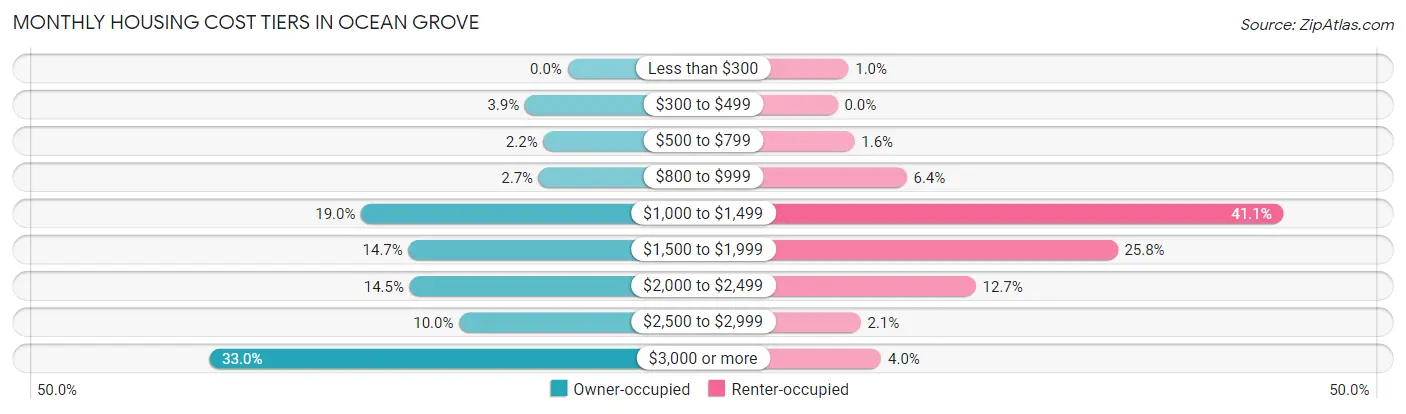
| Monthly Cost | Owner-occupied | Renter-occupied |
| Less than $300 | 0 (0.0%) | 9 (1.0%) |
| $300 to $499 | 37 (3.9%) | 0 (0.0%) |
| $500 to $799 | 21 (2.2%) | 14 (1.6%) |
| $800 to $999 | 25 (2.6%) | 57 (6.4%) |
| $1,000 to $1,499 | 179 (19.0%) | 368 (41.1%) |
| $1,500 to $1,999 | 138 (14.6%) | 231 (25.8%) |
| $2,000 to $2,499 | 137 (14.5%) | 114 (12.7%) |
| $2,500 to $2,999 | 94 (10.0%) | 19 (2.1%) |
| $3,000 or more | 311 (33.0%) | 36 (4.0%) |
| Total | 942 (100.0%) | 896 (100.0%) |
Physical Housing Characteristics in Ocean Grove
Housing Structures in Ocean Grove
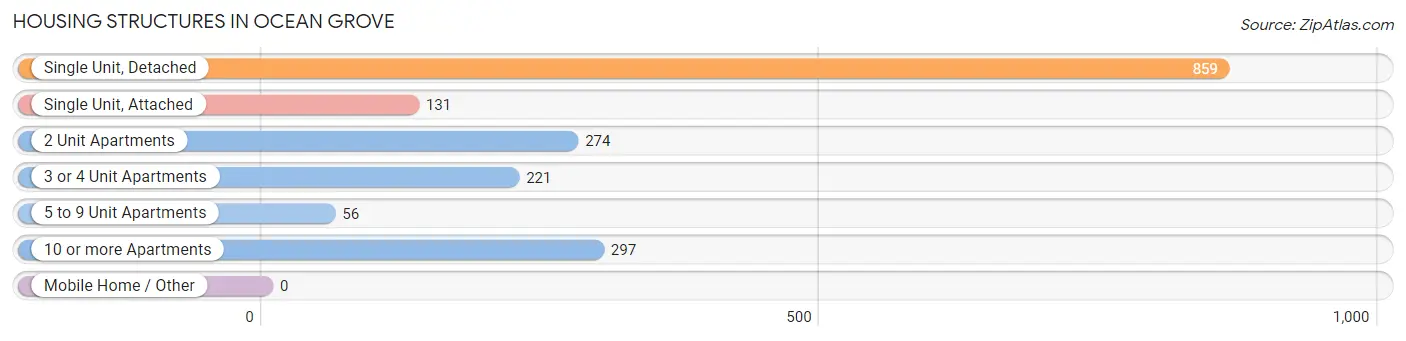
| Structure Type | # Housing Units | % Housing Units |
| Single Unit, Detached | 859 | 46.7% |
| Single Unit, Attached | 131 | 7.1% |
| 2 Unit Apartments | 274 | 14.9% |
| 3 or 4 Unit Apartments | 221 | 12.0% |
| 5 to 9 Unit Apartments | 56 | 3.0% |
| 10 or more Apartments | 297 | 16.2% |
| Mobile Home / Other | 0 | 0.0% |
| Total | 1,838 | 100.0% |
Housing Structures by Occupancy in Ocean Grove
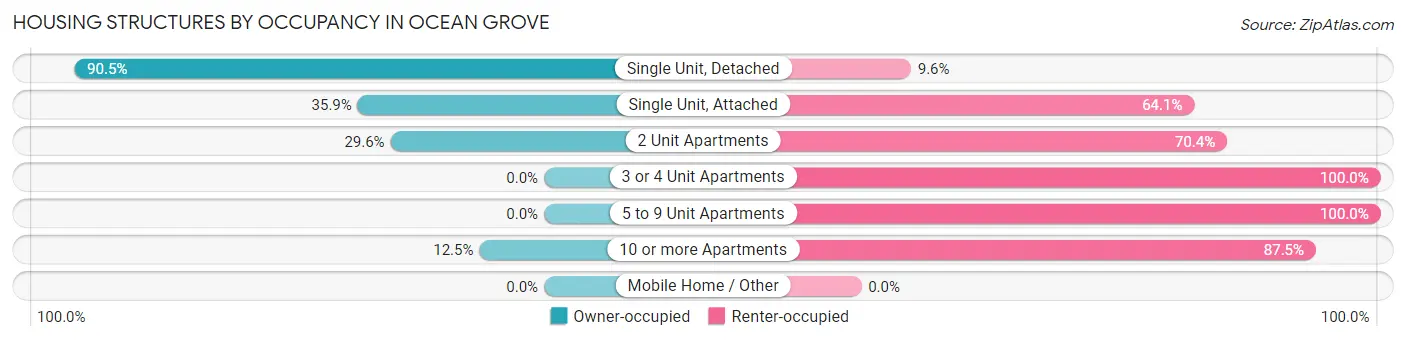
| Structure Type | Owner-occupied | Renter-occupied |
| Single Unit, Detached | 777 (90.4%) | 82 (9.6%) |
| Single Unit, Attached | 47 (35.9%) | 84 (64.1%) |
| 2 Unit Apartments | 81 (29.6%) | 193 (70.4%) |
| 3 or 4 Unit Apartments | 0 (0.0%) | 221 (100.0%) |
| 5 to 9 Unit Apartments | 0 (0.0%) | 56 (100.0%) |
| 10 or more Apartments | 37 (12.5%) | 260 (87.5%) |
| Mobile Home / Other | 0 (0.0%) | 0 (0.0%) |
| Total | 942 (51.2%) | 896 (48.7%) |
Housing Structures by Number of Rooms in Ocean Grove
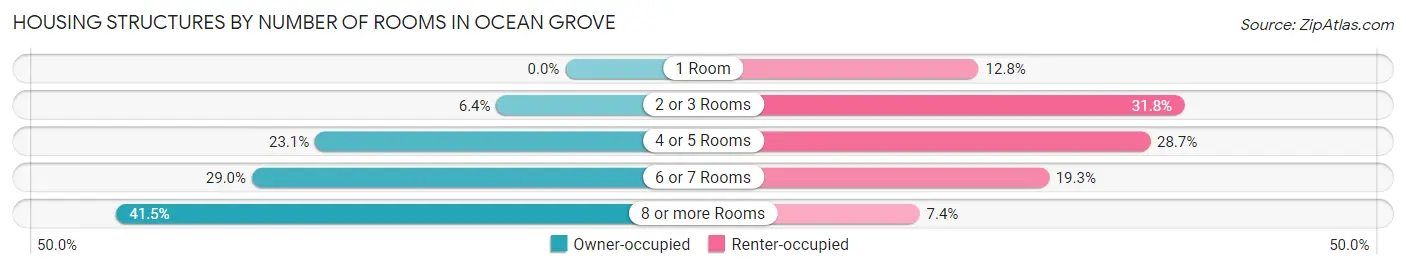
| Number of Rooms | Owner-occupied | Renter-occupied |
| 1 Room | 0 (0.0%) | 115 (12.8%) |
| 2 or 3 Rooms | 60 (6.4%) | 285 (31.8%) |
| 4 or 5 Rooms | 218 (23.1%) | 257 (28.7%) |
| 6 or 7 Rooms | 273 (29.0%) | 173 (19.3%) |
| 8 or more Rooms | 391 (41.5%) | 66 (7.4%) |
| Total | 942 (100.0%) | 896 (100.0%) |
Housing Structure by Heating Type in Ocean Grove
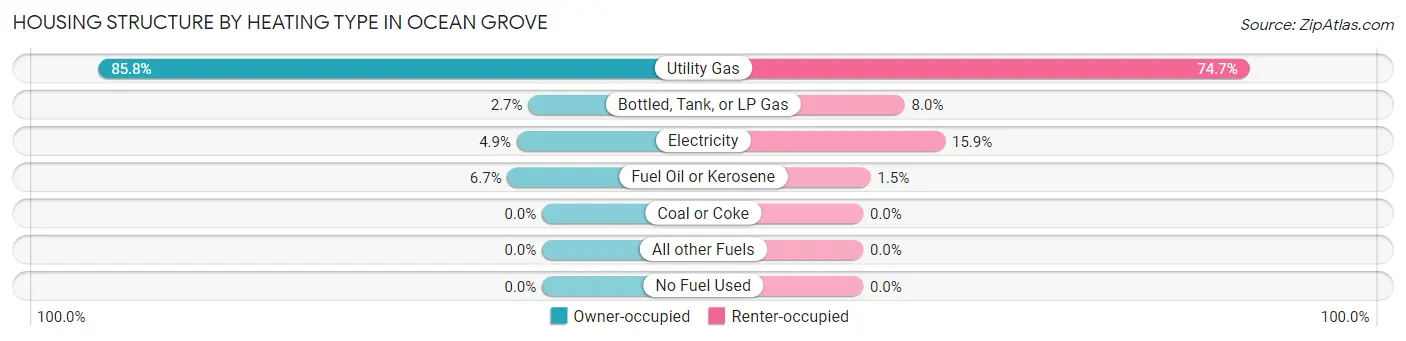
| Heating Type | Owner-occupied | Renter-occupied |
| Utility Gas | 808 (85.8%) | 669 (74.7%) |
| Bottled, Tank, or LP Gas | 25 (2.6%) | 72 (8.0%) |
| Electricity | 46 (4.9%) | 142 (15.9%) |
| Fuel Oil or Kerosene | 63 (6.7%) | 13 (1.5%) |
| Coal or Coke | 0 (0.0%) | 0 (0.0%) |
| All other Fuels | 0 (0.0%) | 0 (0.0%) |
| No Fuel Used | 0 (0.0%) | 0 (0.0%) |
| Total | 942 (100.0%) | 896 (100.0%) |
Household Vehicle Usage in Ocean Grove
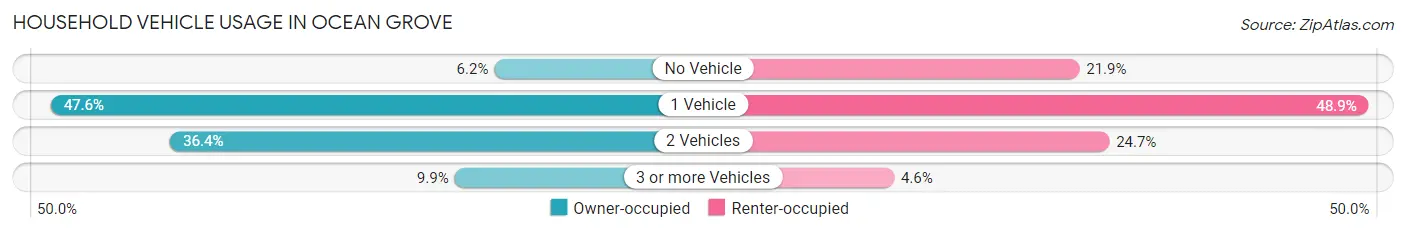
| Vehicles per Household | Owner-occupied | Renter-occupied |
| No Vehicle | 58 (6.2%) | 196 (21.9%) |
| 1 Vehicle | 448 (47.6%) | 438 (48.9%) |
| 2 Vehicles | 343 (36.4%) | 221 (24.7%) |
| 3 or more Vehicles | 93 (9.9%) | 41 (4.6%) |
| Total | 942 (100.0%) | 896 (100.0%) |
Real Estate & Mortgages in Ocean Grove
Real Estate and Mortgage Overview in Ocean Grove
| Characteristic | Without Mortgage | With Mortgage |
| Housing Units | 600 | 342 |
| Median Property Value | $847,900 | $686,000 |
| Median Household Income | $78,900 | $183 |
| Monthly Housing Costs | $1,501 | $190 |
| Real Estate Taxes | $10,001 | $0 |
Property Value by Mortgage Status in Ocean Grove
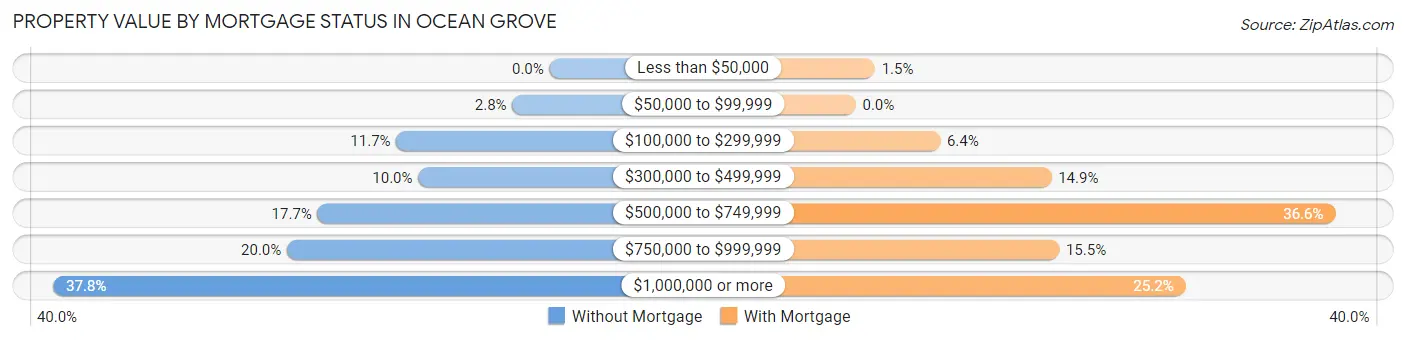
| Property Value | Without Mortgage | With Mortgage |
| Less than $50,000 | 0 (0.0%) | 5 (1.5%) |
| $50,000 to $99,999 | 17 (2.8%) | 0 (0.0%) |
| $100,000 to $299,999 | 70 (11.7%) | 22 (6.4%) |
| $300,000 to $499,999 | 60 (10.0%) | 51 (14.9%) |
| $500,000 to $749,999 | 106 (17.7%) | 125 (36.5%) |
| $750,000 to $999,999 | 120 (20.0%) | 53 (15.5%) |
| $1,000,000 or more | 227 (37.8%) | 86 (25.2%) |
| Total | 600 (100.0%) | 342 (100.0%) |
Household Income by Mortgage Status in Ocean Grove
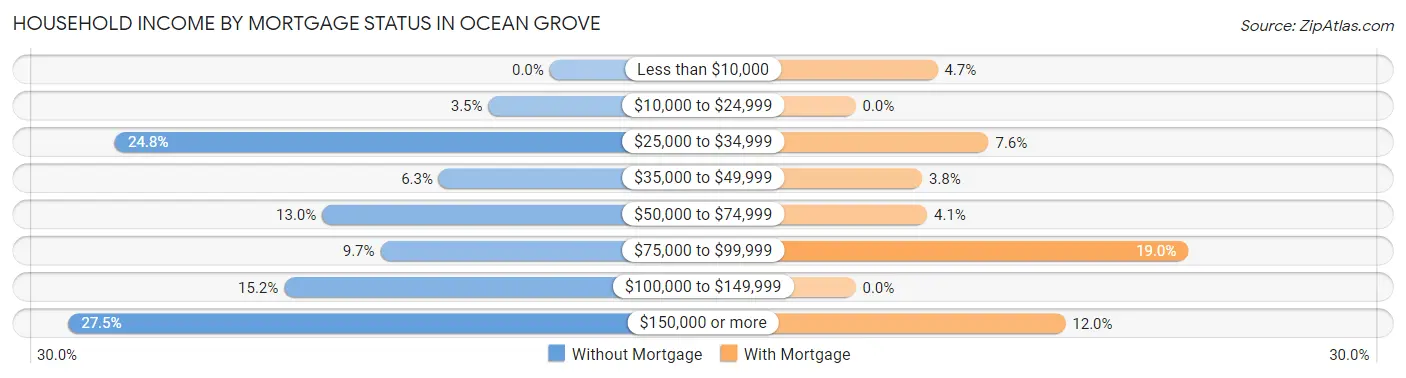
| Household Income | Without Mortgage | With Mortgage |
| Less than $10,000 | 0 (0.0%) | 16 (4.7%) |
| $10,000 to $24,999 | 21 (3.5%) | 0 (0.0%) |
| $25,000 to $34,999 | 149 (24.8%) | 26 (7.6%) |
| $35,000 to $49,999 | 38 (6.3%) | 13 (3.8%) |
| $50,000 to $74,999 | 78 (13.0%) | 14 (4.1%) |
| $75,000 to $99,999 | 58 (9.7%) | 65 (19.0%) |
| $100,000 to $149,999 | 91 (15.2%) | 0 (0.0%) |
| $150,000 or more | 165 (27.5%) | 41 (12.0%) |
| Total | 600 (100.0%) | 342 (100.0%) |
Property Value to Household Income Ratio in Ocean Grove
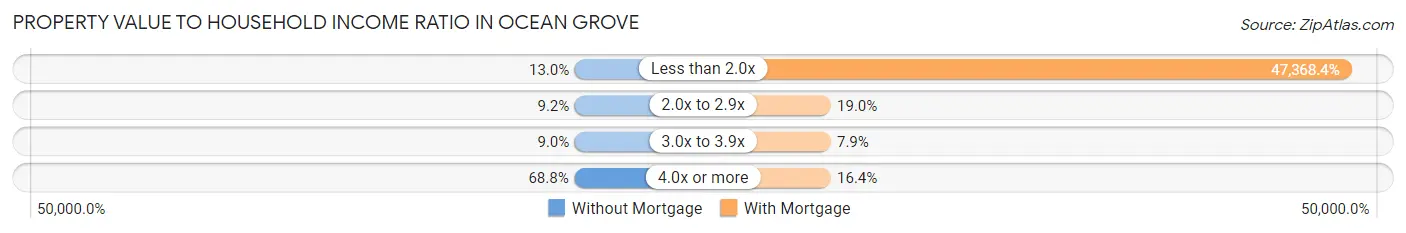
| Value-to-Income Ratio | Without Mortgage | With Mortgage |
| Less than 2.0x | 78 (13.0%) | 162,000 (47,368.4%) |
| 2.0x to 2.9x | 55 (9.2%) | 65 (19.0%) |
| 3.0x to 3.9x | 54 (9.0%) | 27 (7.9%) |
| 4.0x or more | 413 (68.8%) | 56 (16.4%) |
| Total | 600 (100.0%) | 342 (100.0%) |
Real Estate Taxes by Mortgage Status in Ocean Grove
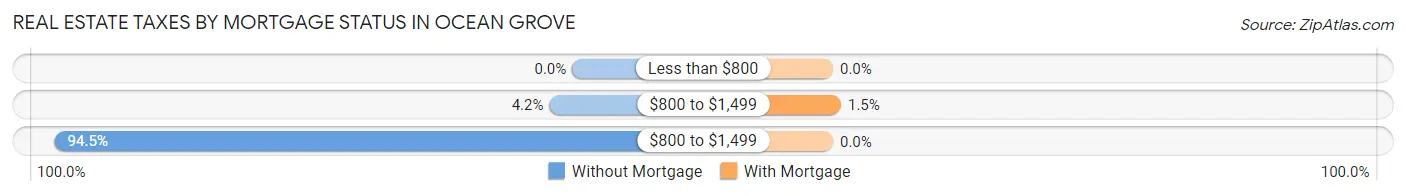
| Property Taxes | Without Mortgage | With Mortgage |
| Less than $800 | 0 (0.0%) | 0 (0.0%) |
| $800 to $1,499 | 25 (4.2%) | 5 (1.5%) |
| $800 to $1,499 | 567 (94.5%) | 0 (0.0%) |
| Total | 600 (100.0%) | 342 (100.0%) |
Health & Disability in Ocean Grove
Health Insurance Coverage by Age in Ocean Grove
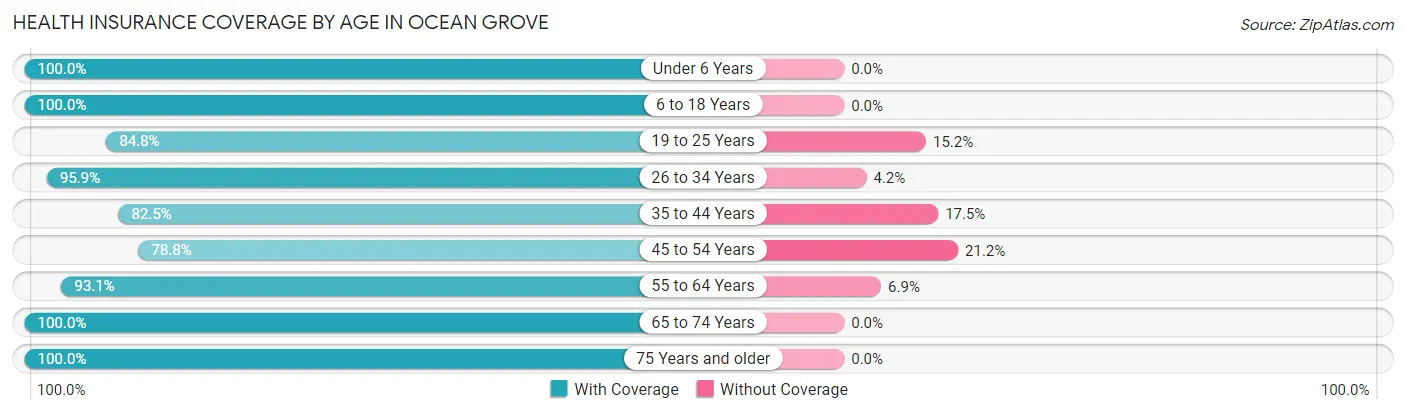
| Age Bracket | With Coverage | Without Coverage |
| Under 6 Years | 79 (100.0%) | 0 (0.0%) |
| 6 to 18 Years | 25 (100.0%) | 0 (0.0%) |
| 19 to 25 Years | 89 (84.8%) | 16 (15.2%) |
| 26 to 34 Years | 323 (95.9%) | 14 (4.2%) |
| 35 to 44 Years | 292 (82.5%) | 62 (17.5%) |
| 45 to 54 Years | 230 (78.8%) | 62 (21.2%) |
| 55 to 64 Years | 922 (93.1%) | 68 (6.9%) |
| 65 to 74 Years | 616 (100.0%) | 0 (0.0%) |
| 75 Years and older | 323 (100.0%) | 0 (0.0%) |
| Total | 2,899 (92.9%) | 222 (7.1%) |
Health Insurance Coverage by Citizenship Status in Ocean Grove
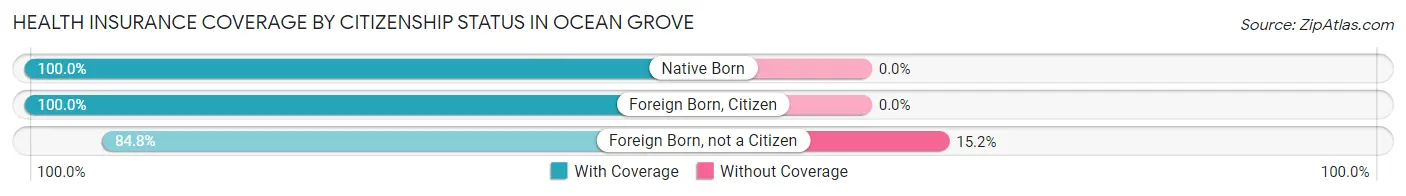
| Citizenship Status | With Coverage | Without Coverage |
| Native Born | 79 (100.0%) | 0 (0.0%) |
| Foreign Born, Citizen | 25 (100.0%) | 0 (0.0%) |
| Foreign Born, not a Citizen | 89 (84.8%) | 16 (15.2%) |
Health Insurance Coverage by Household Income in Ocean Grove
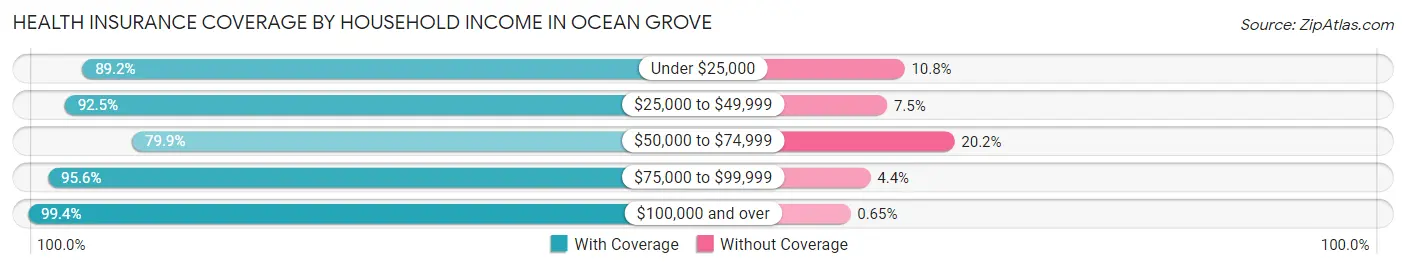
| Household Income | With Coverage | Without Coverage |
| Under $25,000 | 190 (89.2%) | 23 (10.8%) |
| $25,000 to $49,999 | 430 (92.5%) | 35 (7.5%) |
| $50,000 to $74,999 | 523 (79.8%) | 132 (20.2%) |
| $75,000 to $99,999 | 347 (95.6%) | 16 (4.4%) |
| $100,000 and over | 1,369 (99.4%) | 9 (0.6%) |
Public vs Private Health Insurance Coverage by Age in Ocean Grove
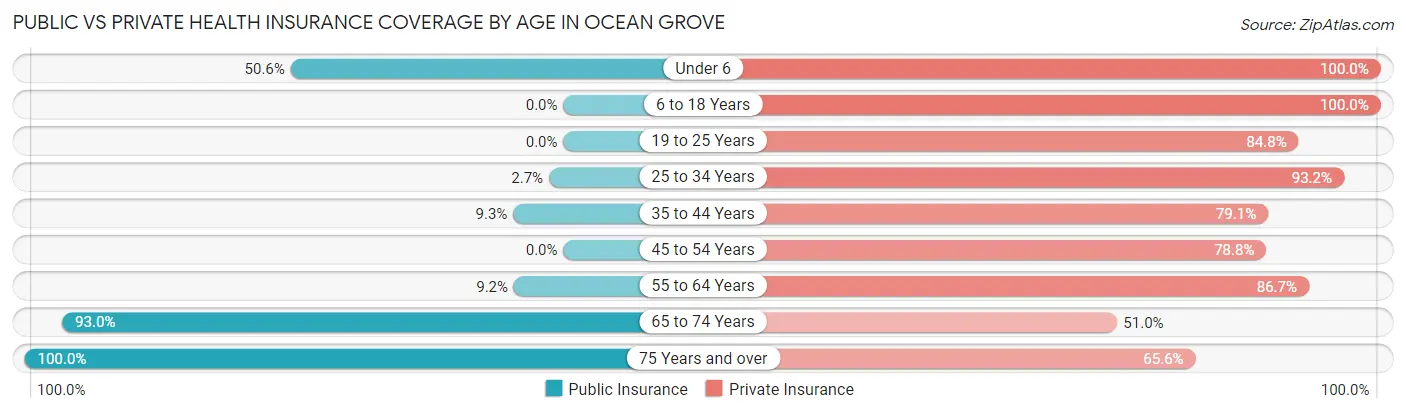
| Age Bracket | Public Insurance | Private Insurance |
| Under 6 | 40 (50.6%) | 79 (100.0%) |
| 6 to 18 Years | 0 (0.0%) | 25 (100.0%) |
| 19 to 25 Years | 0 (0.0%) | 89 (84.8%) |
| 25 to 34 Years | 9 (2.7%) | 314 (93.2%) |
| 35 to 44 Years | 33 (9.3%) | 280 (79.1%) |
| 45 to 54 Years | 0 (0.0%) | 230 (78.8%) |
| 55 to 64 Years | 91 (9.2%) | 858 (86.7%) |
| 65 to 74 Years | 573 (93.0%) | 314 (51.0%) |
| 75 Years and over | 323 (100.0%) | 212 (65.6%) |
| Total | 1,069 (34.3%) | 2,401 (76.9%) |
Disability Status by Sex by Age in Ocean Grove
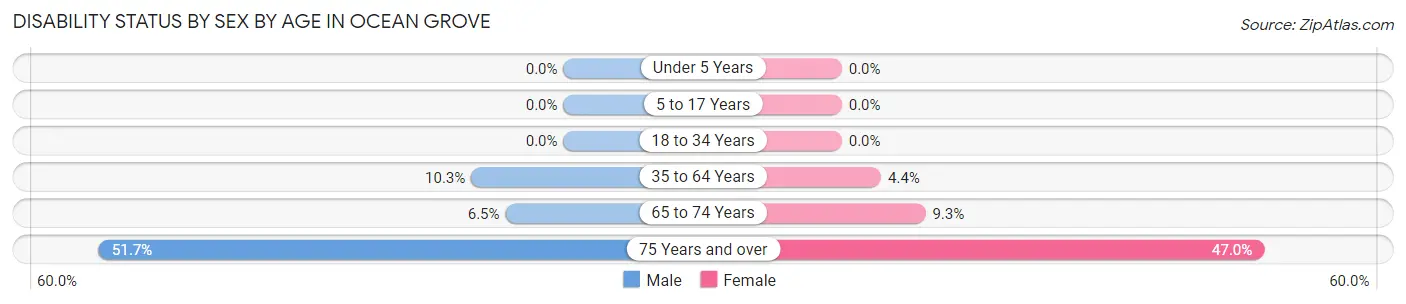
| Age Bracket | Male | Female |
| Under 5 Years | 0 (0.0%) | 0 (0.0%) |
| 5 to 17 Years | 0 (0.0%) | 0 (0.0%) |
| 18 to 34 Years | 0 (0.0%) | 0 (0.0%) |
| 35 to 64 Years | 86 (10.3%) | 35 (4.4%) |
| 65 to 74 Years | 19 (6.5%) | 30 (9.3%) |
| 75 Years and over | 45 (51.7%) | 111 (47.0%) |
Disability Class by Sex by Age in Ocean Grove
Disability Class: Hearing Difficulty
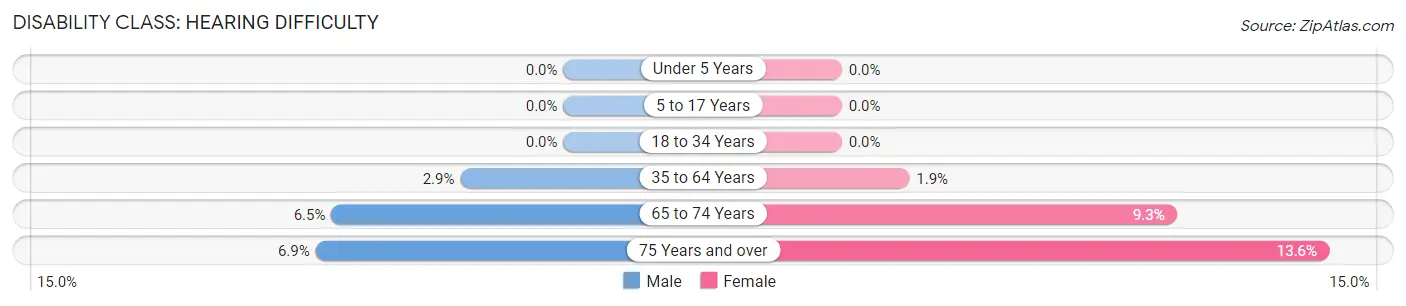
| Age Bracket | Male | Female |
| Under 5 Years | 0 (0.0%) | 0 (0.0%) |
| 5 to 17 Years | 0 (0.0%) | 0 (0.0%) |
| 18 to 34 Years | 0 (0.0%) | 0 (0.0%) |
| 35 to 64 Years | 24 (2.9%) | 15 (1.9%) |
| 65 to 74 Years | 19 (6.5%) | 30 (9.3%) |
| 75 Years and over | 6 (6.9%) | 32 (13.6%) |
Disability Class: Vision Difficulty
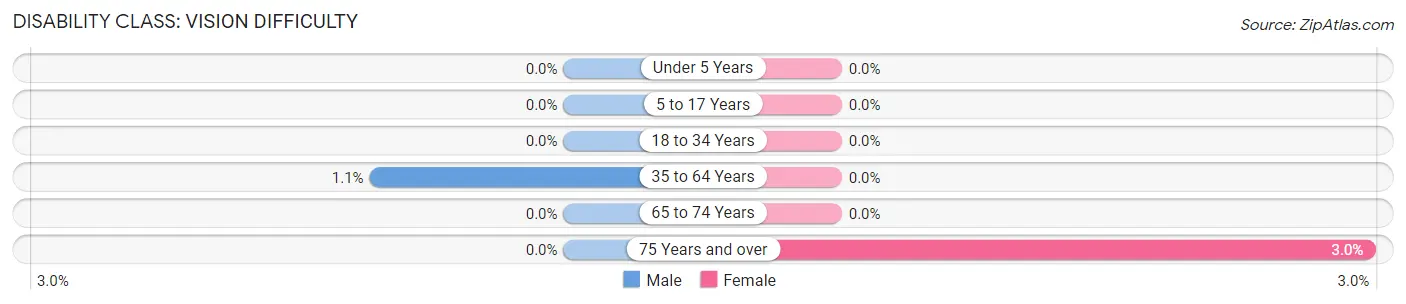
| Age Bracket | Male | Female |
| Under 5 Years | 0 (0.0%) | 0 (0.0%) |
| 5 to 17 Years | 0 (0.0%) | 0 (0.0%) |
| 18 to 34 Years | 0 (0.0%) | 0 (0.0%) |
| 35 to 64 Years | 9 (1.1%) | 0 (0.0%) |
| 65 to 74 Years | 0 (0.0%) | 0 (0.0%) |
| 75 Years and over | 0 (0.0%) | 7 (3.0%) |
Disability Class: Cognitive Difficulty
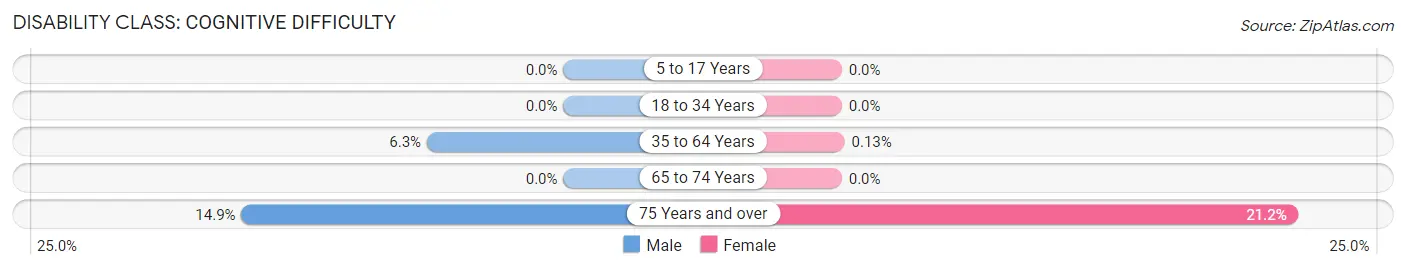
| Age Bracket | Male | Female |
| 5 to 17 Years | 0 (0.0%) | 0 (0.0%) |
| 18 to 34 Years | 0 (0.0%) | 0 (0.0%) |
| 35 to 64 Years | 53 (6.3%) | 1 (0.1%) |
| 65 to 74 Years | 0 (0.0%) | 0 (0.0%) |
| 75 Years and over | 13 (14.9%) | 50 (21.2%) |
Disability Class: Ambulatory Difficulty
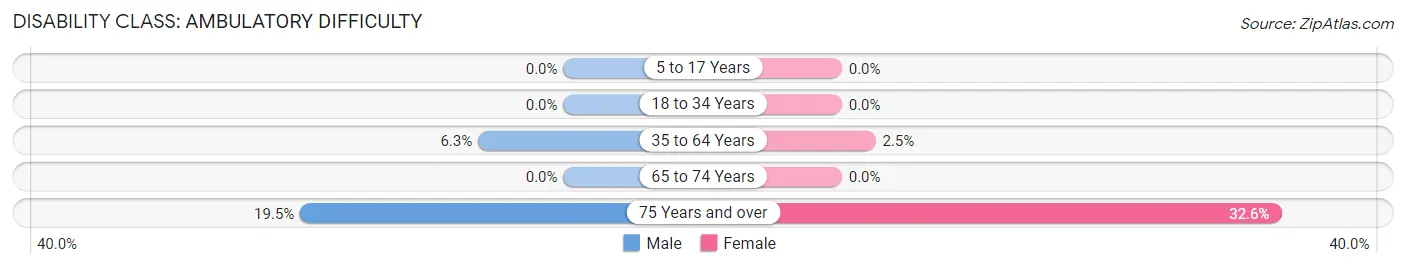
| Age Bracket | Male | Female |
| 5 to 17 Years | 0 (0.0%) | 0 (0.0%) |
| 18 to 34 Years | 0 (0.0%) | 0 (0.0%) |
| 35 to 64 Years | 53 (6.3%) | 20 (2.5%) |
| 65 to 74 Years | 0 (0.0%) | 0 (0.0%) |
| 75 Years and over | 17 (19.5%) | 77 (32.6%) |
Disability Class: Self-Care Difficulty
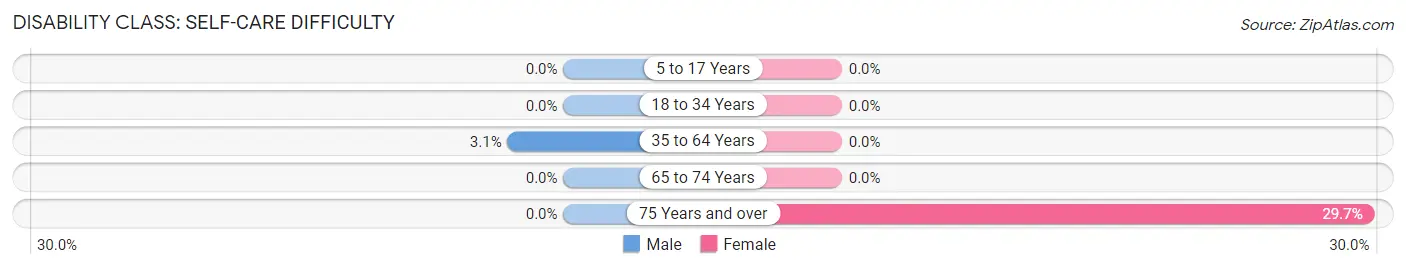
| Age Bracket | Male | Female |
| 5 to 17 Years | 0 (0.0%) | 0 (0.0%) |
| 18 to 34 Years | 0 (0.0%) | 0 (0.0%) |
| 35 to 64 Years | 26 (3.1%) | 0 (0.0%) |
| 65 to 74 Years | 0 (0.0%) | 0 (0.0%) |
| 75 Years and over | 0 (0.0%) | 70 (29.7%) |
Technology Access in Ocean Grove
Computing Device Access in Ocean Grove
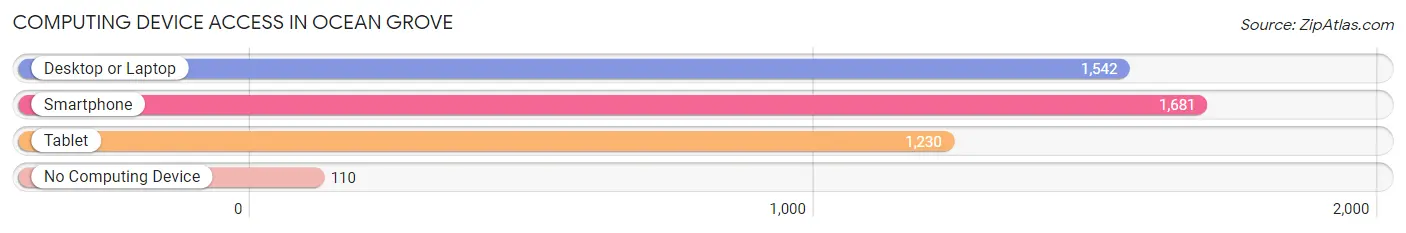
| Device Type | # Households | % Households |
| Desktop or Laptop | 1,542 | 83.9% |
| Smartphone | 1,681 | 91.5% |
| Tablet | 1,230 | 66.9% |
| No Computing Device | 110 | 6.0% |
| Total | 1,838 | 100.0% |
Internet Access in Ocean Grove
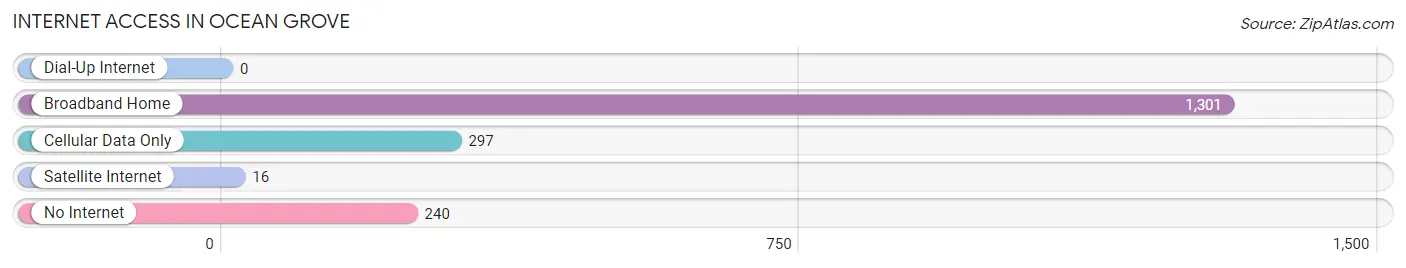
| Internet Type | # Households | % Households |
| Dial-Up Internet | 0 | 0.0% |
| Broadband Home | 1,301 | 70.8% |
| Cellular Data Only | 297 | 16.2% |
| Satellite Internet | 16 | 0.9% |
| No Internet | 240 | 13.1% |
| Total | 1,838 | 100.0% |
Ocean Grove Summary
Geography
Ocean Grove is a small beach town located in the northern part of New Jersey, in Monmouth County. It is situated on the Atlantic Ocean, just south of Asbury Park and north of Bradley Beach. The town is bordered by the Shark River to the west and the Ocean to the east. The town is approximately 1.5 square miles in size and is home to approximately 4,000 people.
The town is divided into two distinct sections, the North End and the South End. The North End is the more residential area of the town, with many single-family homes and small apartment buildings. The South End is the more commercial area, with a variety of shops, restaurants, and other businesses.
The town is also home to a number of parks and beaches, including the Ocean Grove Beach, which is a popular spot for swimming, sunbathing, and fishing. The town also has a boardwalk, which runs along the beach and is a popular spot for walking and biking.
History
Ocean Grove was founded in 1869 by a group of Methodists who wanted to create a religious retreat. The town was originally called Ocean Grove Camp Meeting Association, and it was the first organized camp meeting in the United States. The town was designed to be a place of spiritual renewal and reflection, and it was a popular destination for religious retreats.
The town quickly grew in popularity, and by the early 1900s it had become a popular summer destination for vacationers. The town was known for its strict rules and regulations, which included a ban on alcohol, gambling, and dancing.
The town continued to grow and prosper throughout the 20th century, and it remains a popular destination for vacationers today.
Economy
The economy of Ocean Grove is largely based on tourism. The town is a popular destination for vacationers, and it is home to a variety of shops, restaurants, and other businesses that cater to tourists. The town also has a number of bed and breakfasts, as well as a few hotels.
The town also has a number of small businesses, including a few retail stores, a few restaurants, and a few professional services.
Demographics
As of the 2010 census, the population of Ocean Grove was 4,116. The racial makeup of the town was 94.3% White, 2.2% African American, 0.3% Native American, 0.7% Asian, 0.1% Pacific Islander, 1.2% from other races, and 1.2% from two or more races. Hispanic or Latino of any race were 4.2% of the population.
The median household income in Ocean Grove was $60,938, and the median family income was $71,917. The per capita income for the town was $31,945. About 4.3% of families and 6.2% of the population were below the poverty line, including 8.2% of those under age 18 and 4.2% of those age 65 or over.
Common Questions
What is Per Capita Income in Ocean Grove?
Per Capita income in Ocean Grove is $73,156.
What is the Median Family Income in Ocean Grove?
Median Family Income in Ocean Grove is $88,674.
What is the Median Household income in Ocean Grove?
Median Household Income in Ocean Grove is $72,500.
What is Income or Wage Gap in Ocean Grove?
Income or Wage Gap in Ocean Grove is 26.1%.
Women in Ocean Grove earn 73.9 cents for every dollar earned by a man.
What is Inequality or Gini Index in Ocean Grove?
Inequality or Gini Index in Ocean Grove is 0.52.
What is the Total Population of Ocean Grove?
Total Population of Ocean Grove is 3,129.
What is the Total Male Population of Ocean Grove?
Total Male Population of Ocean Grove is 1,464.
What is the Total Female Population of Ocean Grove?
Total Female Population of Ocean Grove is 1,665.
What is the Ratio of Males per 100 Females in Ocean Grove?
There are 87.93 Males per 100 Females in Ocean Grove.
What is the Ratio of Females per 100 Males in Ocean Grove?
There are 113.73 Females per 100 Males in Ocean Grove.
What is the Median Population Age in Ocean Grove?
Median Population Age in Ocean Grove is 61.0 Years.
What is the Average Family Size in Ocean Grove
Average Family Size in Ocean Grove is 2.2 People.
What is the Average Household Size in Ocean Grove
Average Household Size in Ocean Grove is 1.7 People.
How Large is the Labor Force in Ocean Grove?
There are 1,767 People in the Labor Forcein in Ocean Grove.
What is the Percentage of People in the Labor Force in Ocean Grove?
58.1% of People are in the Labor Force in Ocean Grove.
What is the Unemployment Rate in Ocean Grove?
Unemployment Rate in Ocean Grove is 7.2%.