Annandale, NJ Map & Demographics
Annandale Map
Annandale Overview
$57,016
PER CAPITA INCOME
$142,024
AVG FAMILY INCOME
$121,806
AVG HOUSEHOLD INCOME
33.3%
WAGE / INCOME GAP [ % ]
66.7¢/ $1
WAGE / INCOME GAP [ $ ]
0.40
INEQUALITY / GINI INDEX
1,853
TOTAL POPULATION
841
MALE POPULATION
1,012
FEMALE POPULATION
83.10
MALES / 100 FEMALES
120.33
FEMALES / 100 MALES
33.1
MEDIAN AGE
3.5
AVG FAMILY SIZE
2.9
AVG HOUSEHOLD SIZE
1,050
LABOR FORCE [ PEOPLE ]
69.8%
PERCENT IN LABOR FORCE
12.0%
UNEMPLOYMENT RATE
Annandale Zip Codes
Annandale Area Codes
Income in Annandale
Income Overview in Annandale
Per Capita Income in Annandale is $57,016, while median incomes of families and households are $142,024 and $121,806 respectively.
| Characteristic | Number | Measure |
| Per Capita Income | 1,853 | $57,016 |
| Median Family Income | 482 | $142,024 |
| Mean Family Income | 482 | $166,843 |
| Median Household Income | 643 | $121,806 |
| Mean Household Income | 643 | $159,472 |
| Income Deficit | 482 | $0 |
| Wage / Income Gap (%) | 1,853 | 33.32% |
| Wage / Income Gap ($) | 1,853 | 66.68¢ per $1 |
| Gini / Inequality Index | 1,853 | 0.40 |
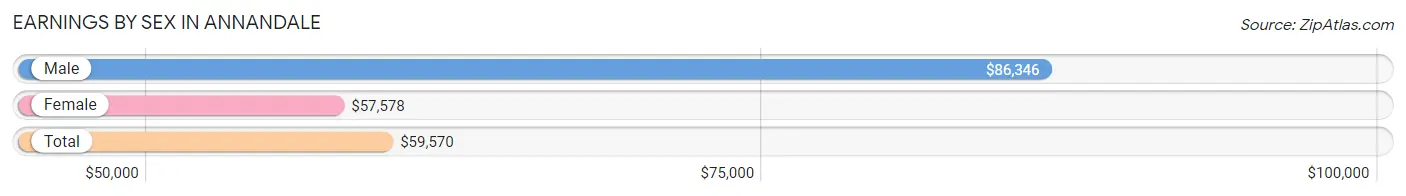
Earnings by Sex in Annandale
Average Earnings in Annandale are $59,570, $86,346 for men and $57,578 for women, a difference of 33.3%.
| Sex | Number | Average Earnings |
| Male | 416 (41.3%) | $86,346 |
| Female | 590 (58.7%) | $57,578 |
| Total | 1,006 (100.0%) | $59,570 |
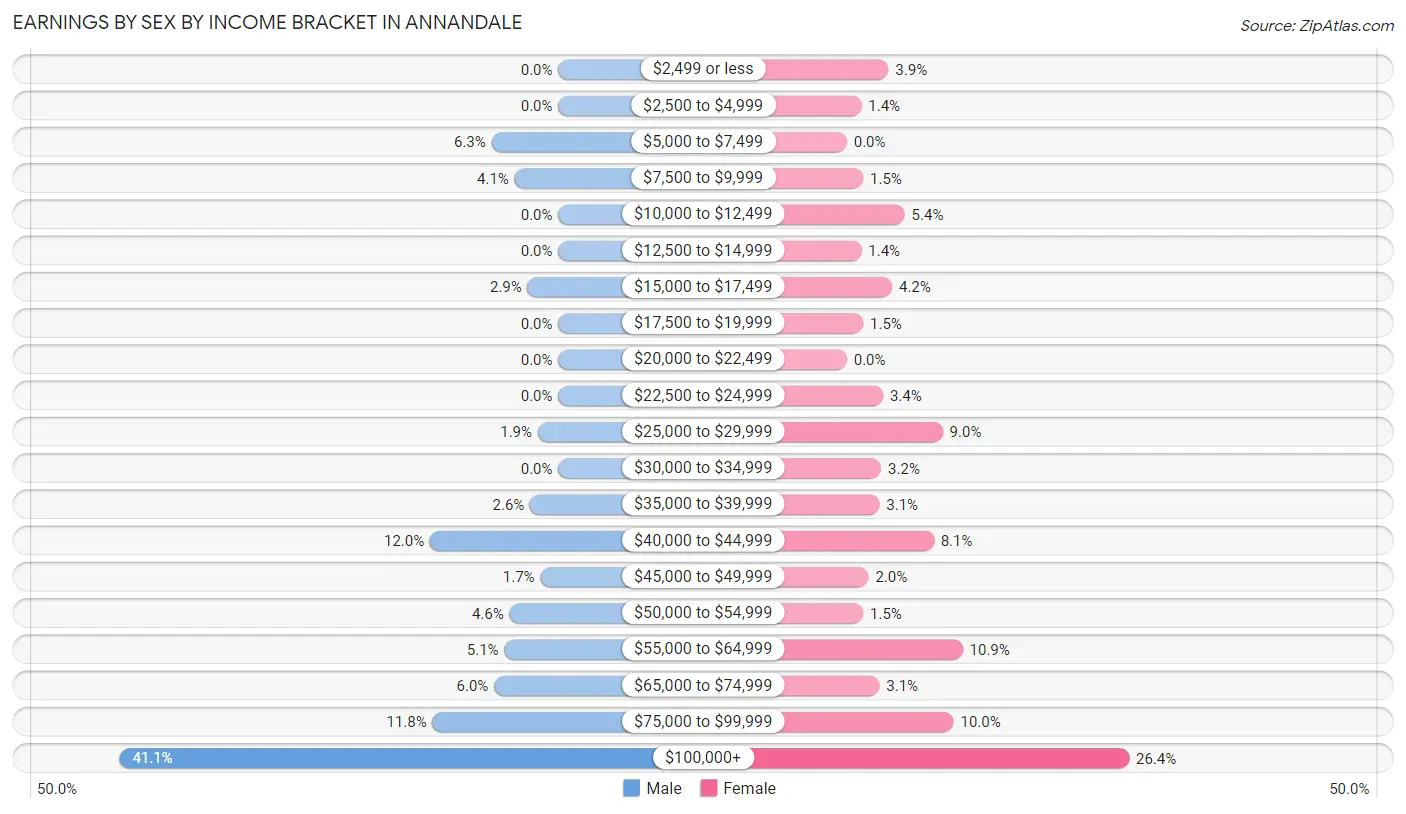
Earnings by Sex by Income Bracket in Annandale
The most common earnings brackets in Annandale are $100,000+ for men (171 | 41.1%) and $100,000+ for women (156 | 26.4%).
| Income | Male | Female |
| $2,499 or less | 0 (0.0%) | 23 (3.9%) |
| $2,500 to $4,999 | 0 (0.0%) | 8 (1.4%) |
| $5,000 to $7,499 | 26 (6.2%) | 0 (0.0%) |
| $7,500 to $9,999 | 17 (4.1%) | 9 (1.5%) |
| $10,000 to $12,499 | 0 (0.0%) | 32 (5.4%) |
| $12,500 to $14,999 | 0 (0.0%) | 8 (1.4%) |
| $15,000 to $17,499 | 12 (2.9%) | 25 (4.2%) |
| $17,500 to $19,999 | 0 (0.0%) | 9 (1.5%) |
| $20,000 to $22,499 | 0 (0.0%) | 0 (0.0%) |
| $22,500 to $24,999 | 0 (0.0%) | 20 (3.4%) |
| $25,000 to $29,999 | 8 (1.9%) | 53 (9.0%) |
| $30,000 to $34,999 | 0 (0.0%) | 19 (3.2%) |
| $35,000 to $39,999 | 11 (2.6%) | 18 (3.0%) |
| $40,000 to $44,999 | 50 (12.0%) | 48 (8.1%) |
| $45,000 to $49,999 | 7 (1.7%) | 12 (2.0%) |
| $50,000 to $54,999 | 19 (4.6%) | 9 (1.5%) |
| $55,000 to $64,999 | 21 (5.1%) | 64 (10.8%) |
| $65,000 to $74,999 | 25 (6.0%) | 18 (3.0%) |
| $75,000 to $99,999 | 49 (11.8%) | 59 (10.0%) |
| $100,000+ | 171 (41.1%) | 156 (26.4%) |
| Total | 416 (100.0%) | 590 (100.0%) |
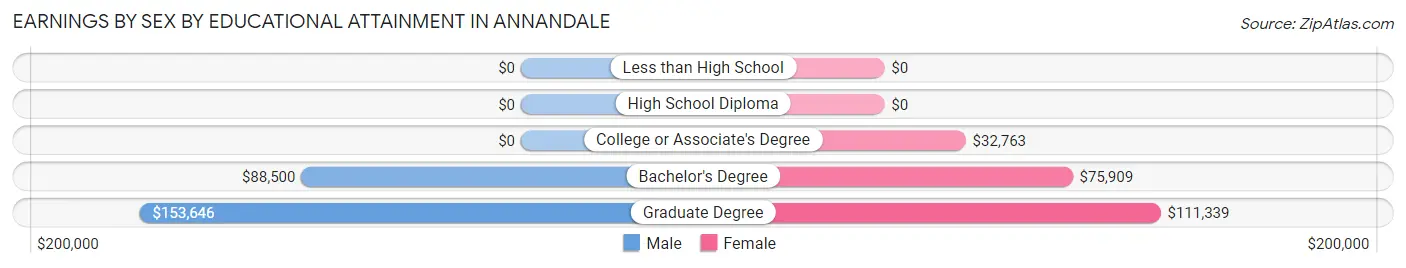
Earnings by Sex by Educational Attainment in Annandale
Average earnings in Annandale are $88,917 for men and $66,111 for women, a difference of 25.7%. Men with an educational attainment of graduate degree enjoy the highest average annual earnings of $153,646, while those with bachelor's degree education earn the least with $88,500. Women with an educational attainment of graduate degree earn the most with the average annual earnings of $111,339, while those with college or associate's degree education have the smallest earnings of $32,763.
| Educational Attainment | Male Income | Female Income |
| Less than High School | - | - |
| High School Diploma | - | - |
| College or Associate's Degree | - | - |
| Bachelor's Degree | $88,500 | $75,909 |
| Graduate Degree | $153,646 | $111,339 |
| Total | $88,917 | $66,111 |
Family Income in Annandale
Family Income Brackets in Annandale
According to the Annandale family income data, there are 136 families falling into the $200,000+ income range, which is the most common income bracket and makes up 28.2% of all families.
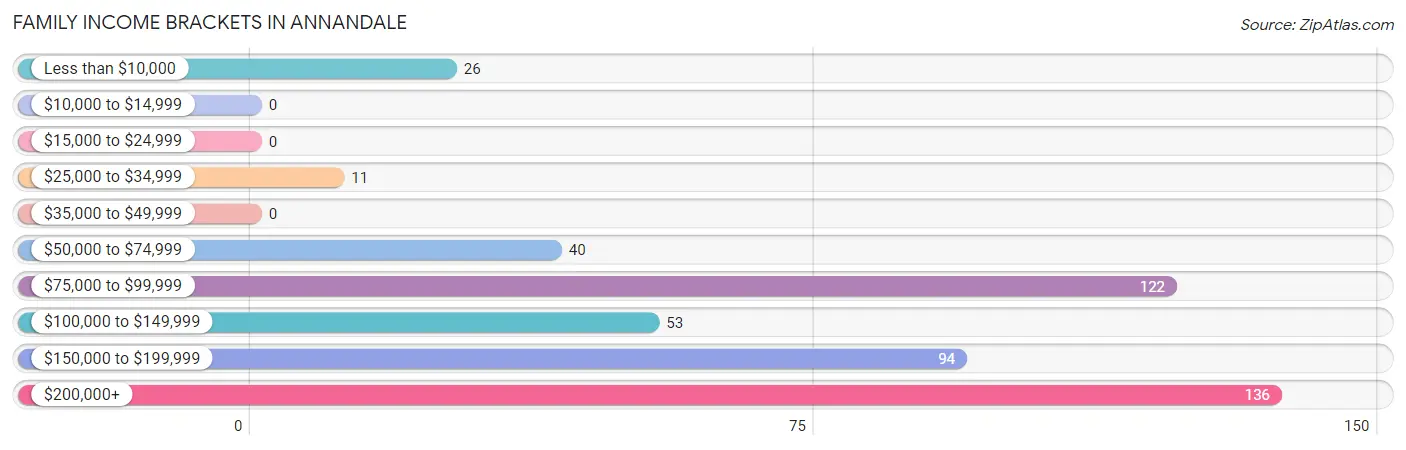
| Income Bracket | # Families | % Families |
| Less than $10,000 | 26 | 5.4% |
| $10,000 to $14,999 | 0 | 0.0% |
| $15,000 to $24,999 | 0 | 0.0% |
| $25,000 to $34,999 | 11 | 2.3% |
| $35,000 to $49,999 | 0 | 0.0% |
| $50,000 to $74,999 | 40 | 8.3% |
| $75,000 to $99,999 | 122 | 25.3% |
| $100,000 to $149,999 | 53 | 11.0% |
| $150,000 to $199,999 | 94 | 19.5% |
| $200,000+ | 136 | 28.2% |
Family Income by Famaliy Size in Annandale
4-person families (73 | 15.1%) account for the highest median family income in Annandale with $208,021 per family, while 2-person families (230 | 47.7%) have the highest median income of $63,125 per family member.
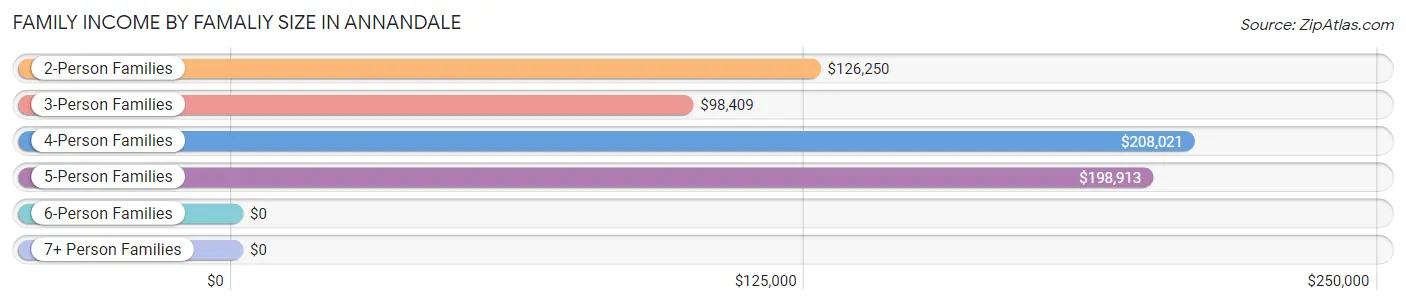
| Income Bracket | # Families | Median Income |
| 2-Person Families | 230 (47.7%) | $126,250 |
| 3-Person Families | 112 (23.2%) | $98,409 |
| 4-Person Families | 73 (15.1%) | $208,021 |
| 5-Person Families | 40 (8.3%) | $198,913 |
| 6-Person Families | 27 (5.6%) | $0 |
| 7+ Person Families | 0 (0.0%) | $0 |
| Total | 482 (100.0%) | $142,024 |
Family Income by Number of Earners in Annandale
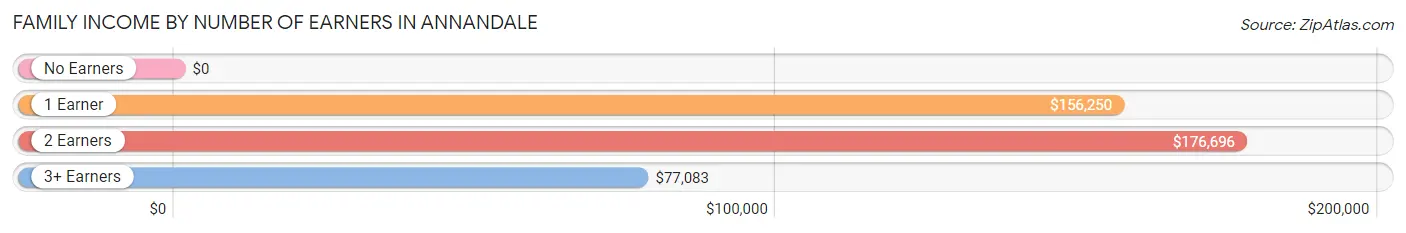
| Number of Earners | # Families | Median Income |
| No Earners | 54 (11.2%) | $0 |
| 1 Earner | 88 (18.3%) | $156,250 |
| 2 Earners | 295 (61.2%) | $176,696 |
| 3+ Earners | 45 (9.3%) | $77,083 |
| Total | 482 (100.0%) | $142,024 |
Household Income in Annandale
Household Income Brackets in Annandale
With 156 households falling in the category, the $200,000+ income range is the most frequent in Annandale, accounting for 24.3% of all households.
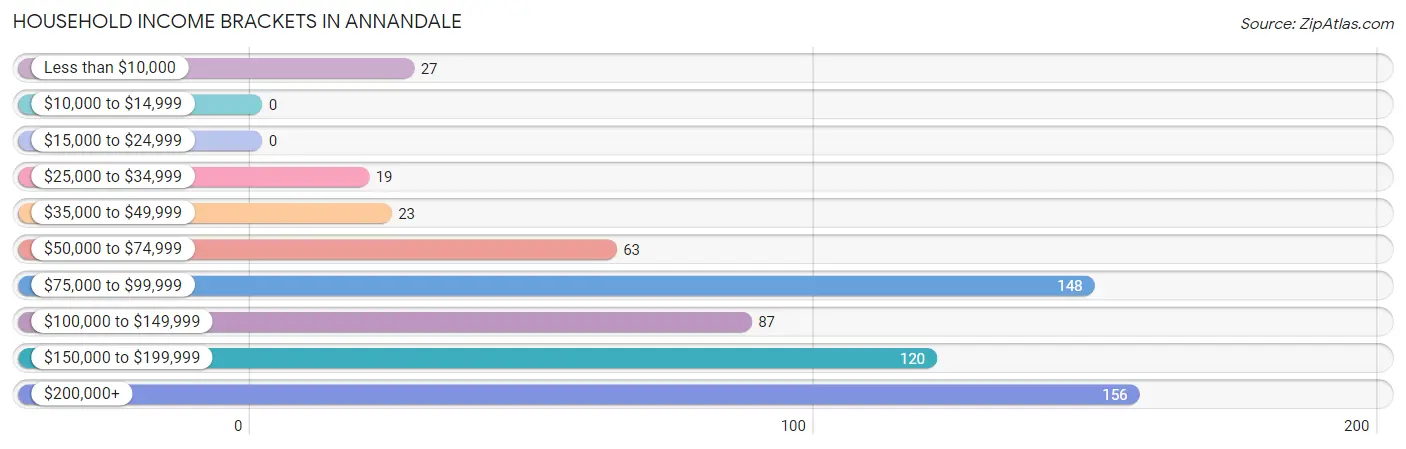
| Income Bracket | # Households | % Households |
| Less than $10,000 | 27 | 4.2% |
| $10,000 to $14,999 | 0 | 0.0% |
| $15,000 to $24,999 | 0 | 0.0% |
| $25,000 to $34,999 | 19 | 3.0% |
| $35,000 to $49,999 | 23 | 3.6% |
| $50,000 to $74,999 | 63 | 9.8% |
| $75,000 to $99,999 | 148 | 23.0% |
| $100,000 to $149,999 | 87 | 13.5% |
| $150,000 to $199,999 | 120 | 18.7% |
| $200,000+ | 156 | 24.3% |
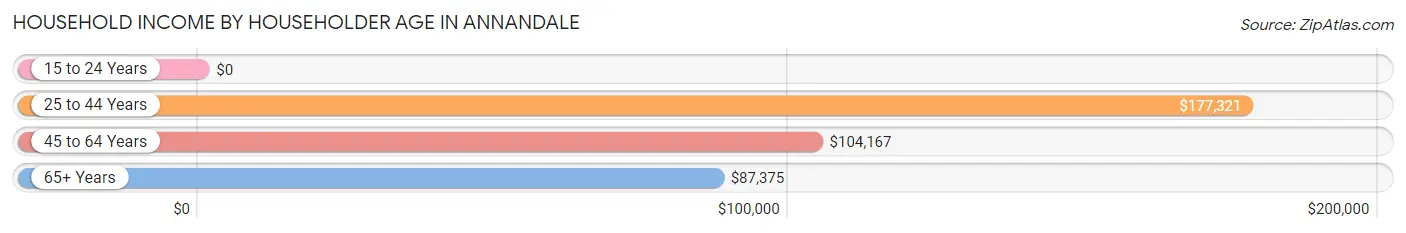
Household Income by Householder Age in Annandale
The median household income in Annandale is $121,806, with the highest median household income of $177,321 found in the 25 to 44 years age bracket for the primary householder. A total of 238 households (37.0%) fall into this category.
| Income Bracket | # Households | Median Income |
| 15 to 24 Years | 0 (0.0%) | $0 |
| 25 to 44 Years | 238 (37.0%) | $177,321 |
| 45 to 64 Years | 298 (46.4%) | $104,167 |
| 65+ Years | 107 (16.6%) | $87,375 |
| Total | 643 (100.0%) | $121,806 |
Poverty in Annandale
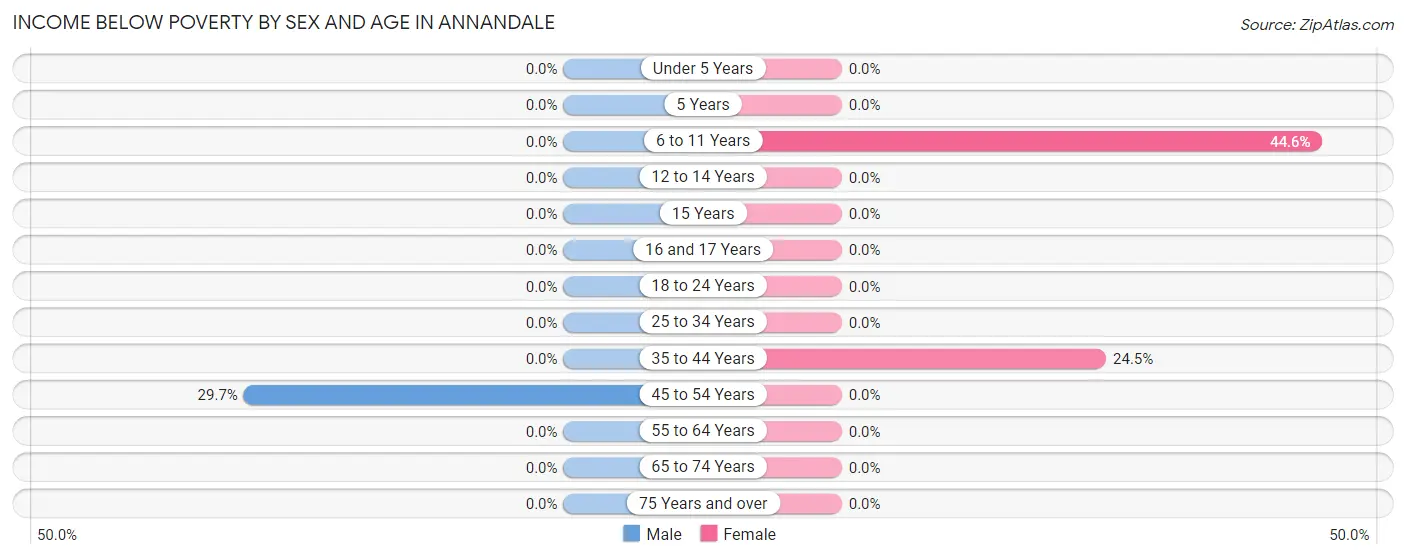
Income Below Poverty by Sex and Age in Annandale
With 3.2% poverty level for males and 5.8% for females among the residents of Annandale, 45 to 54 year old males and 6 to 11 year old females are the most vulnerable to poverty, with 27 males (29.7%) and 33 females (44.6%) in their respective age groups living below the poverty level.
| Age Bracket | Male | Female |
| Under 5 Years | 0 (0.0%) | 0 (0.0%) |
| 5 Years | 0 (0.0%) | 0 (0.0%) |
| 6 to 11 Years | 0 (0.0%) | 33 (44.6%) |
| 12 to 14 Years | 0 (0.0%) | 0 (0.0%) |
| 15 Years | 0 (0.0%) | 0 (0.0%) |
| 16 and 17 Years | 0 (0.0%) | 0 (0.0%) |
| 18 to 24 Years | 0 (0.0%) | 0 (0.0%) |
| 25 to 34 Years | 0 (0.0%) | 0 (0.0%) |
| 35 to 44 Years | 0 (0.0%) | 26 (24.5%) |
| 45 to 54 Years | 27 (29.7%) | 0 (0.0%) |
| 55 to 64 Years | 0 (0.0%) | 0 (0.0%) |
| 65 to 74 Years | 0 (0.0%) | 0 (0.0%) |
| 75 Years and over | 0 (0.0%) | 0 (0.0%) |
| Total | 27 (3.2%) | 59 (5.8%) |
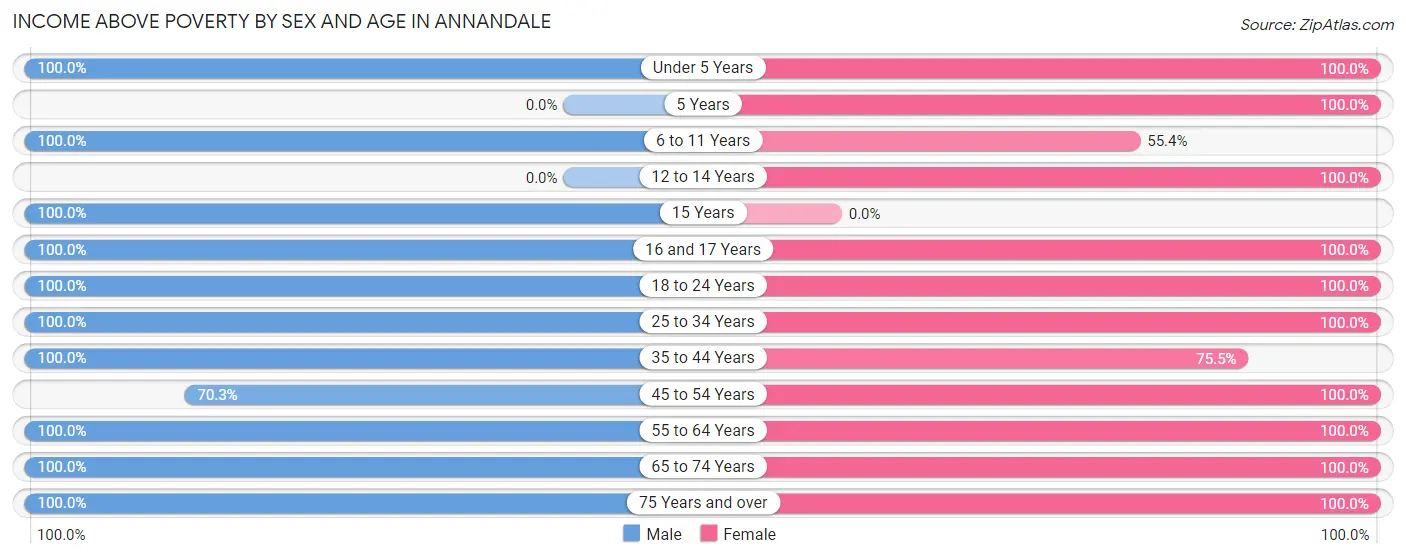
Income Above Poverty by Sex and Age in Annandale
According to the poverty statistics in Annandale, males aged under 5 years and females aged under 5 years are the age groups that are most secure financially, with 100.0% of males and 100.0% of females in these age groups living above the poverty line.
| Age Bracket | Male | Female |
| Under 5 Years | 112 (100.0%) | 71 (100.0%) |
| 5 Years | 0 (0.0%) | 4 (100.0%) |
| 6 to 11 Years | 68 (100.0%) | 41 (55.4%) |
| 12 to 14 Years | 0 (0.0%) | 10 (100.0%) |
| 15 Years | 10 (100.0%) | 0 (0.0%) |
| 16 and 17 Years | 67 (100.0%) | 17 (100.0%) |
| 18 to 24 Years | 65 (100.0%) | 184 (100.0%) |
| 25 to 34 Years | 135 (100.0%) | 206 (100.0%) |
| 35 to 44 Years | 77 (100.0%) | 80 (75.5%) |
| 45 to 54 Years | 64 (70.3%) | 116 (100.0%) |
| 55 to 64 Years | 122 (100.0%) | 136 (100.0%) |
| 65 to 74 Years | 74 (100.0%) | 64 (100.0%) |
| 75 Years and over | 20 (100.0%) | 24 (100.0%) |
| Total | 814 (96.8%) | 953 (94.2%) |
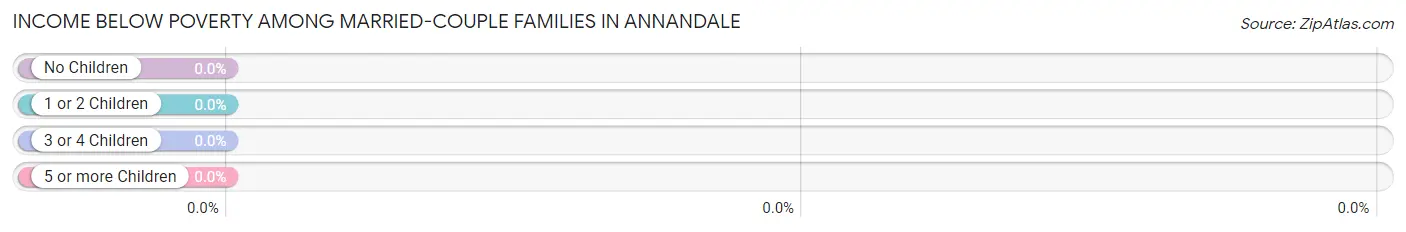
Income Below Poverty Among Married-Couple Families in Annandale
| Children | Above Poverty | Below Poverty |
| No Children | 225 (100.0%) | 0 (0.0%) |
| 1 or 2 Children | 119 (100.0%) | 0 (0.0%) |
| 3 or 4 Children | 33 (100.0%) | 0 (0.0%) |
| 5 or more Children | 0 (0.0%) | 0 (0.0%) |
| Total | 377 (100.0%) | 0 (0.0%) |
Income Below Poverty Among Single-Parent Households in Annandale
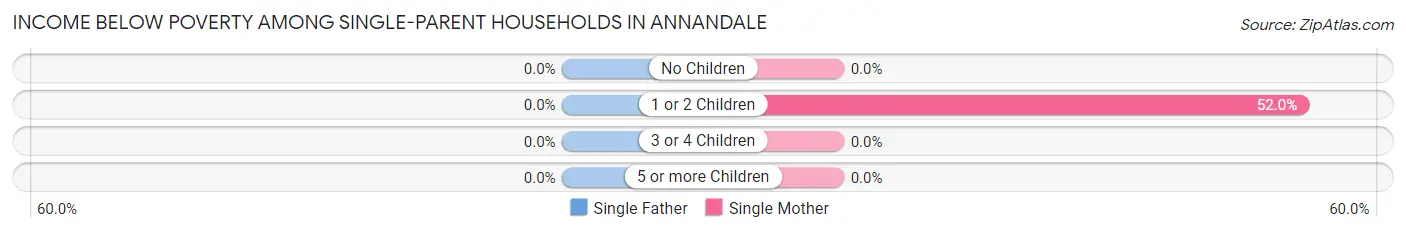
| Children | Single Father | Single Mother |
| No Children | 0 (0.0%) | 0 (0.0%) |
| 1 or 2 Children | 0 (0.0%) | 26 (52.0%) |
| 3 or 4 Children | 0 (0.0%) | 0 (0.0%) |
| 5 or more Children | 0 (0.0%) | 0 (0.0%) |
| Total | 0 (0.0%) | 26 (24.8%) |
Income Below Poverty Among Married-Couple vs Single-Parent Households in Annandale
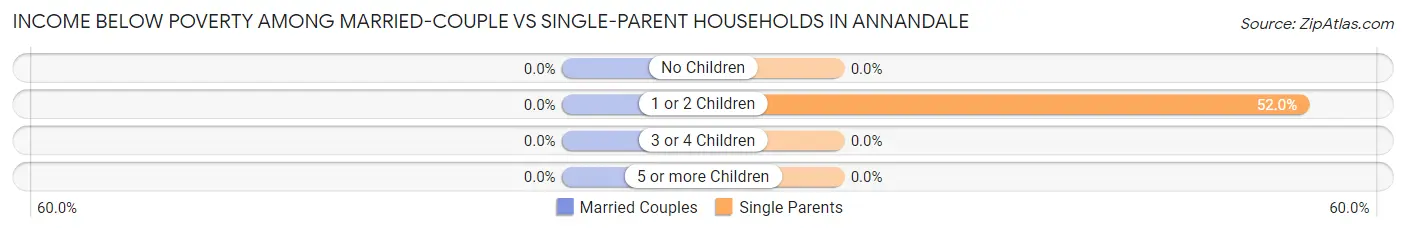
| Children | Married-Couple Families | Single-Parent Households |
| No Children | 0 (0.0%) | 0 (0.0%) |
| 1 or 2 Children | 0 (0.0%) | 26 (52.0%) |
| 3 or 4 Children | 0 (0.0%) | 0 (0.0%) |
| 5 or more Children | 0 (0.0%) | 0 (0.0%) |
| Total | 0 (0.0%) | 26 (24.8%) |
Race in Annandale
The most populous races in Annandale are White / Caucasian (1,655 | 89.3%), Two or more Races (113 | 6.1%), and Hispanic or Latino (107 | 5.8%).
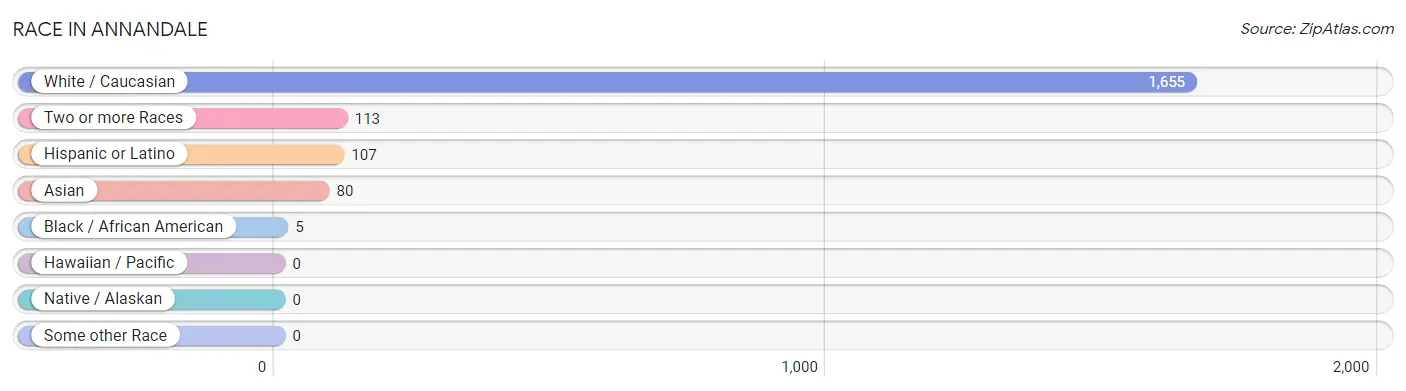
| Race | # Population | % Population |
| Asian | 80 | 4.3% |
| Black / African American | 5 | 0.3% |
| Hawaiian / Pacific | 0 | 0.0% |
| Hispanic or Latino | 107 | 5.8% |
| Native / Alaskan | 0 | 0.0% |
| White / Caucasian | 1,655 | 89.3% |
| Two or more Races | 113 | 6.1% |
| Some other Race | 0 | 0.0% |
| Total | 1,853 | 100.0% |
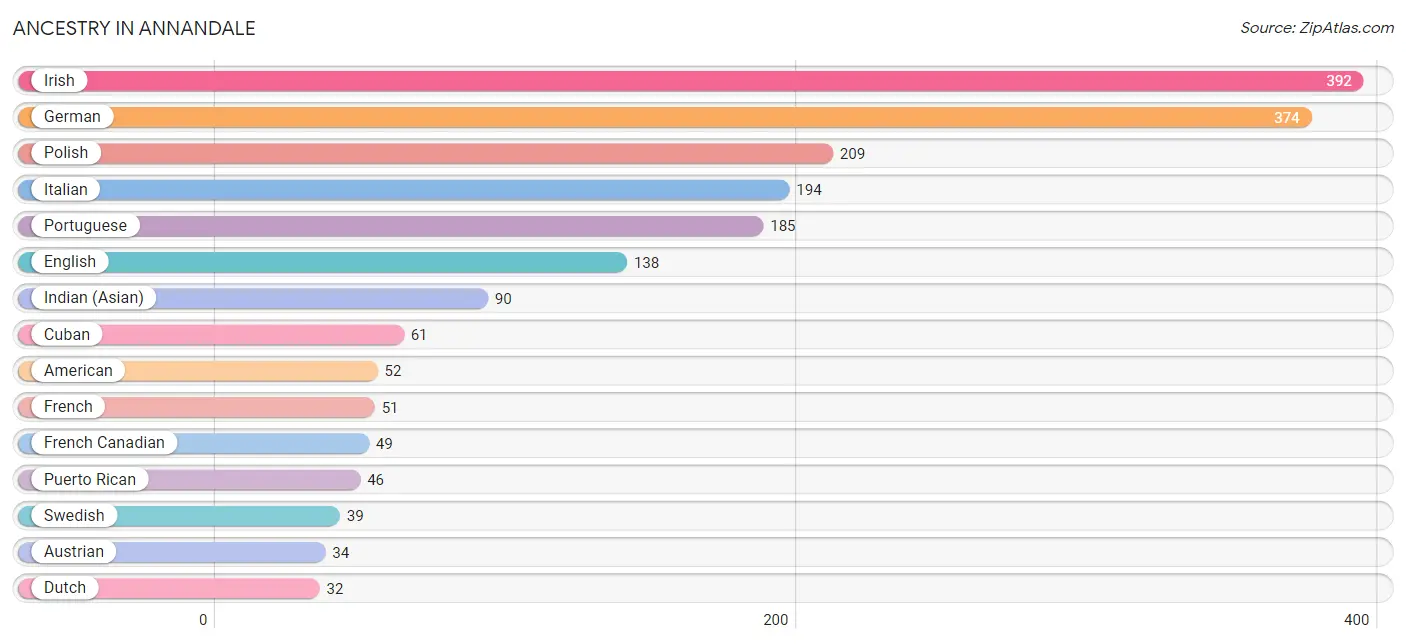
Ancestry in Annandale
The most populous ancestries reported in Annandale are Irish (392 | 21.1%), German (374 | 20.2%), Polish (209 | 11.3%), Italian (194 | 10.5%), and Portuguese (185 | 10.0%), together accounting for 73.1% of all Annandale residents.
| Ancestry | # Population | % Population |
| American | 52 | 2.8% |
| Australian | 7 | 0.4% |
| Austrian | 34 | 1.8% |
| British | 14 | 0.8% |
| Creek | 3 | 0.2% |
| Cuban | 61 | 3.3% |
| Dutch | 32 | 1.7% |
| English | 138 | 7.4% |
| European | 15 | 0.8% |
| Filipino | 12 | 0.6% |
| French | 51 | 2.8% |
| French Canadian | 49 | 2.6% |
| German | 374 | 20.2% |
| Greek | 9 | 0.5% |
| Hungarian | 21 | 1.1% |
| Indian (Asian) | 90 | 4.9% |
| Irish | 392 | 21.1% |
| Italian | 194 | 10.5% |
| Nigerian | 5 | 0.3% |
| Polish | 209 | 11.3% |
| Portuguese | 185 | 10.0% |
| Puerto Rican | 46 | 2.5% |
| Russian | 28 | 1.5% |
| Scandinavian | 20 | 1.1% |
| Scotch-Irish | 17 | 0.9% |
| Subsaharan African | 5 | 0.3% |
| Swedish | 39 | 2.1% |
| Thai | 27 | 1.5% |
| Ukrainian | 27 | 1.5% |
| Welsh | 9 | 0.5% | View All 30 Rows |
Immigrants in Annandale
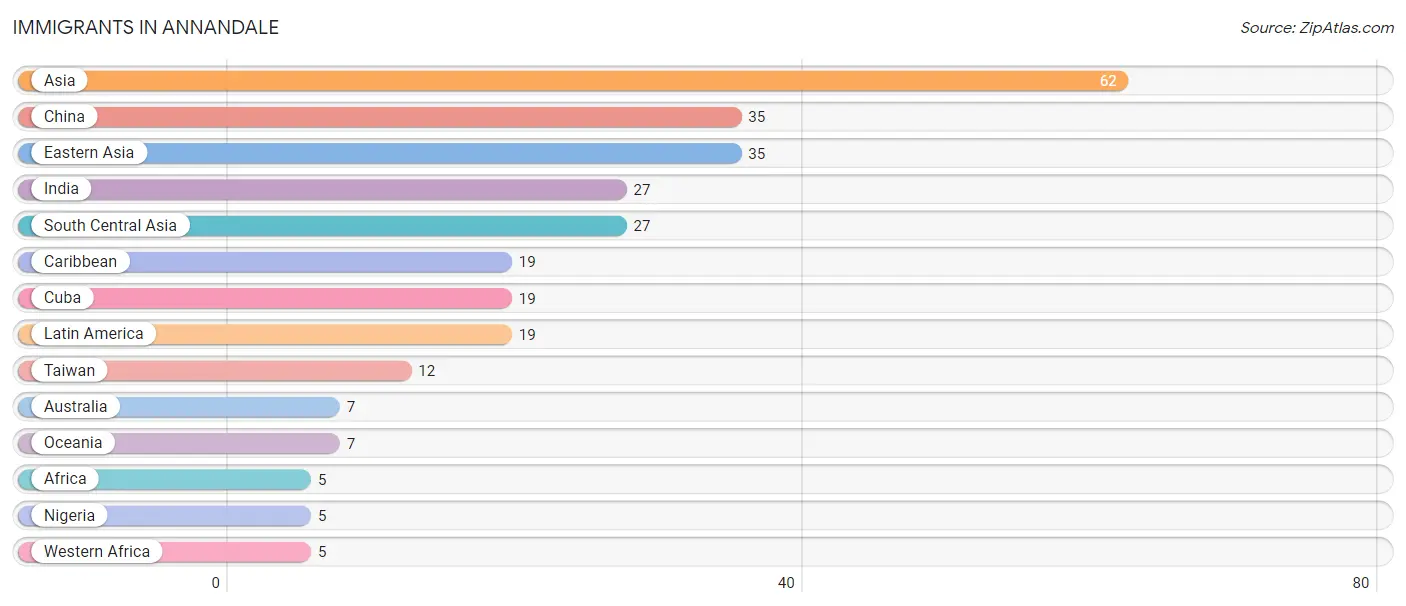
The most numerous immigrant groups reported in Annandale came from Asia (62 | 3.4%), China (35 | 1.9%), Eastern Asia (35 | 1.9%), India (27 | 1.5%), and South Central Asia (27 | 1.5%), together accounting for 10.1% of all Annandale residents.
| Immigration Origin | # Population | % Population |
| Africa | 5 | 0.3% |
| Asia | 62 | 3.4% |
| Australia | 7 | 0.4% |
| Caribbean | 19 | 1.0% |
| China | 35 | 1.9% |
| Cuba | 19 | 1.0% |
| Eastern Asia | 35 | 1.9% |
| India | 27 | 1.5% |
| Latin America | 19 | 1.0% |
| Nigeria | 5 | 0.3% |
| Oceania | 7 | 0.4% |
| South Central Asia | 27 | 1.5% |
| Taiwan | 12 | 0.6% |
| Western Africa | 5 | 0.3% | View All 14 Rows |
Sex and Age in Annandale
Sex and Age in Annandale
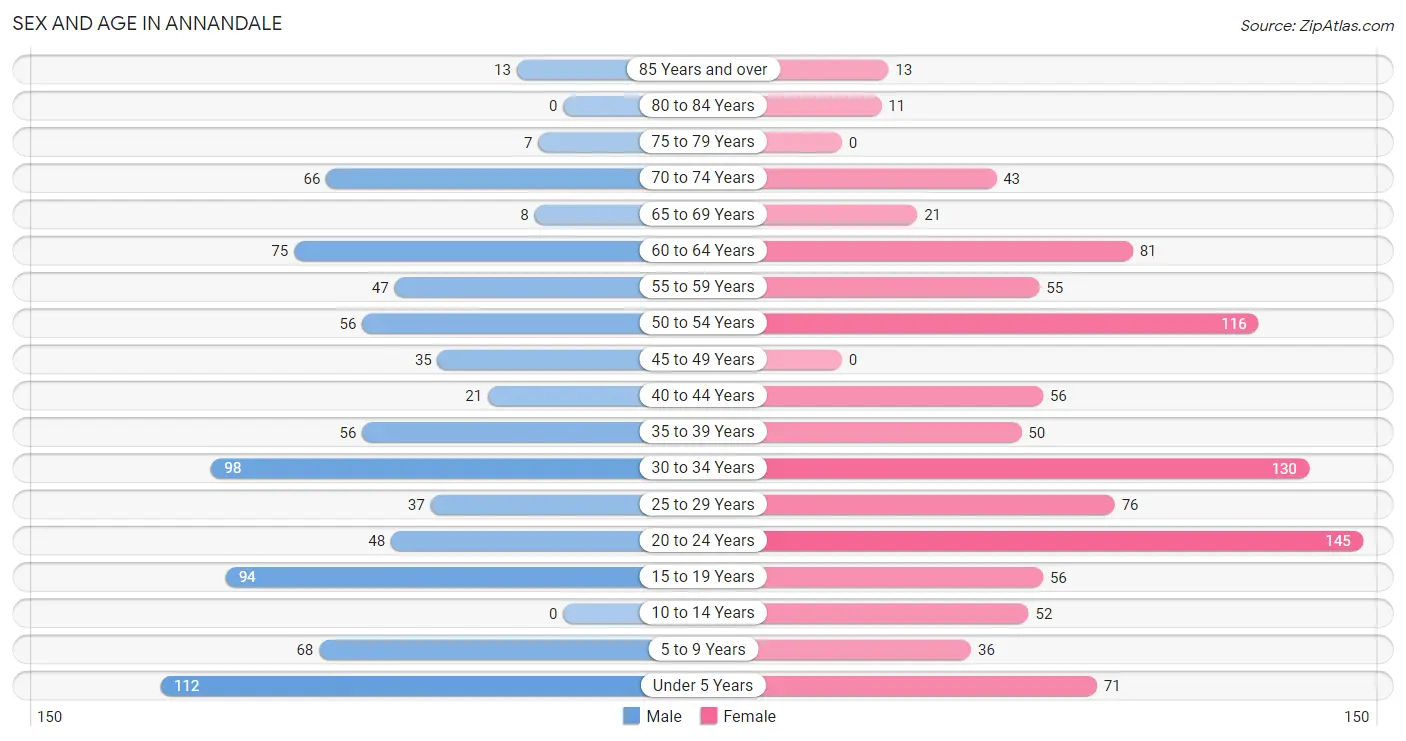
The most populous age groups in Annandale are Under 5 Years (112 | 13.3%) for men and 20 to 24 Years (145 | 14.3%) for women.
| Age Bracket | Male | Female |
| Under 5 Years | 112 (13.3%) | 71 (7.0%) |
| 5 to 9 Years | 68 (8.1%) | 36 (3.6%) |
| 10 to 14 Years | 0 (0.0%) | 52 (5.1%) |
| 15 to 19 Years | 94 (11.2%) | 56 (5.5%) |
| 20 to 24 Years | 48 (5.7%) | 145 (14.3%) |
| 25 to 29 Years | 37 (4.4%) | 76 (7.5%) |
| 30 to 34 Years | 98 (11.7%) | 130 (12.9%) |
| 35 to 39 Years | 56 (6.7%) | 50 (4.9%) |
| 40 to 44 Years | 21 (2.5%) | 56 (5.5%) |
| 45 to 49 Years | 35 (4.2%) | 0 (0.0%) |
| 50 to 54 Years | 56 (6.7%) | 116 (11.5%) |
| 55 to 59 Years | 47 (5.6%) | 55 (5.4%) |
| 60 to 64 Years | 75 (8.9%) | 81 (8.0%) |
| 65 to 69 Years | 8 (0.9%) | 21 (2.1%) |
| 70 to 74 Years | 66 (7.9%) | 43 (4.3%) |
| 75 to 79 Years | 7 (0.8%) | 0 (0.0%) |
| 80 to 84 Years | 0 (0.0%) | 11 (1.1%) |
| 85 Years and over | 13 (1.5%) | 13 (1.3%) |
| Total | 841 (100.0%) | 1,012 (100.0%) |
Families and Households in Annandale
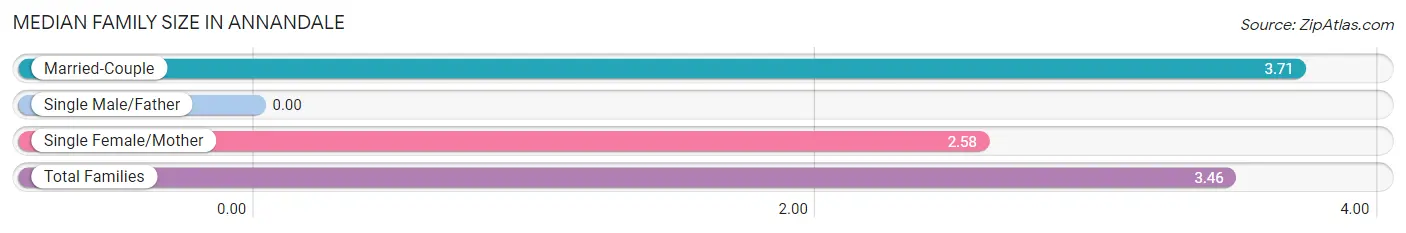
Median Family Size in Annandale
| Family Type | # Families | Family Size |
| Married-Couple | 377 (78.2%) | 3.71 |
| Single Male/Father | 0 (0.0%) | - |
| Single Female/Mother | 105 (21.8%) | 2.58 |
| Total Families | 482 (100.0%) | 3.46 |
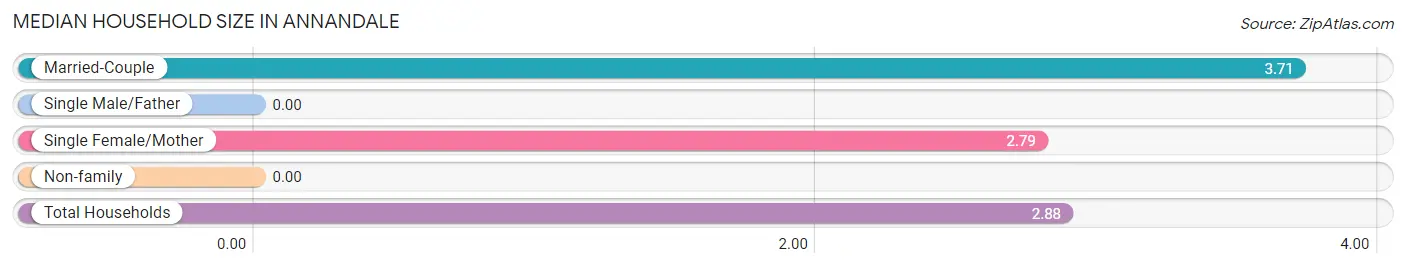
Median Household Size in Annandale
| Household Type | # Households | Household Size |
| Married-Couple | 377 (58.6%) | 3.71 |
| Single Male/Father | 0 (0.0%) | - |
| Single Female/Mother | 105 (16.3%) | 2.79 |
| Non-family | 161 (25.0%) | - |
| Total Households | 643 (100.0%) | 2.88 |
Household Size by Marriage Status in Annandale
Out of a total of 643 households in Annandale, 482 (75.0%) are family households, while 161 (25.0%) are nonfamily households. The most numerous type of family households are 2-person households, comprising 204, and the most common type of nonfamily households are 1-person households, comprising 161.
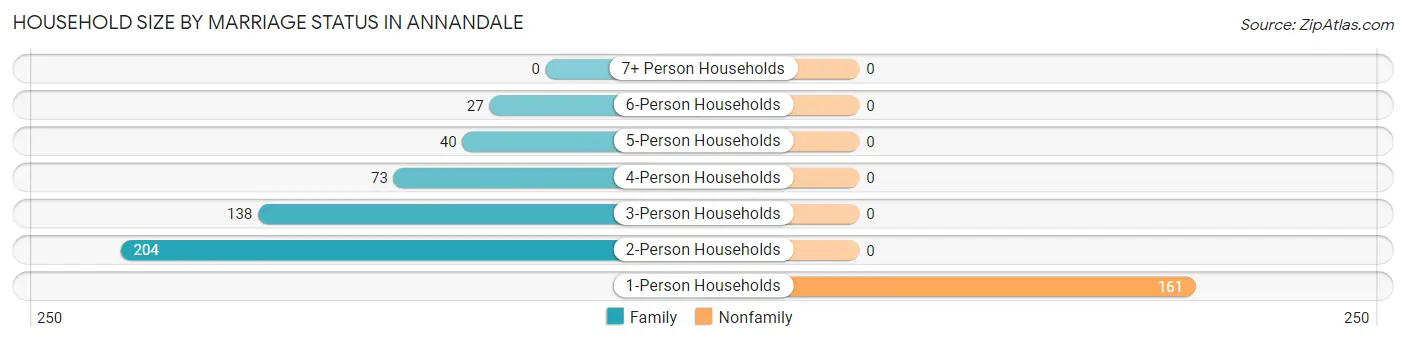
| Household Size | Family Households | Nonfamily Households |
| 1-Person Households | - | 161 (25.0%) |
| 2-Person Households | 204 (31.7%) | 0 (0.0%) |
| 3-Person Households | 138 (21.5%) | 0 (0.0%) |
| 4-Person Households | 73 (11.4%) | 0 (0.0%) |
| 5-Person Households | 40 (6.2%) | 0 (0.0%) |
| 6-Person Households | 27 (4.2%) | 0 (0.0%) |
| 7+ Person Households | 0 (0.0%) | 0 (0.0%) |
| Total | 482 (75.0%) | 161 (25.0%) |
Female Fertility in Annandale
Fertility by Age in Annandale
Average fertility rate in Annandale is 44.0 births per 1,000 women. Women in the age bracket of 20 to 34 years have the highest fertility rate with 68.0 births per 1,000 women. Women in the age bracket of 20 to 34 years acount for 100.0% of all women with births.
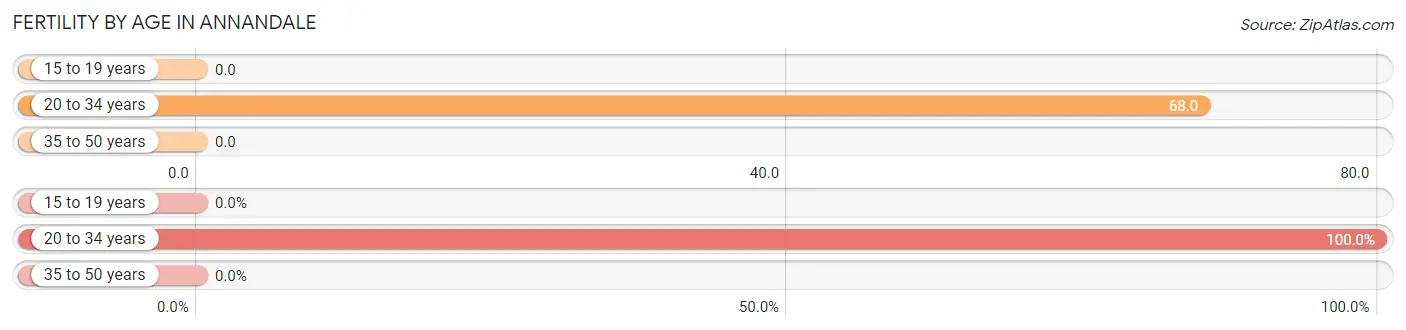
| Age Bracket | Women with Births | Births / 1,000 Women |
| 15 to 19 years | 0 (0.0%) | 0.0 |
| 20 to 34 years | 24 (100.0%) | 68.0 |
| 35 to 50 years | 0 (0.0%) | 0.0 |
| Total | 24 (100.0%) | 44.0 |
Fertility by Age by Marriage Status in Annandale
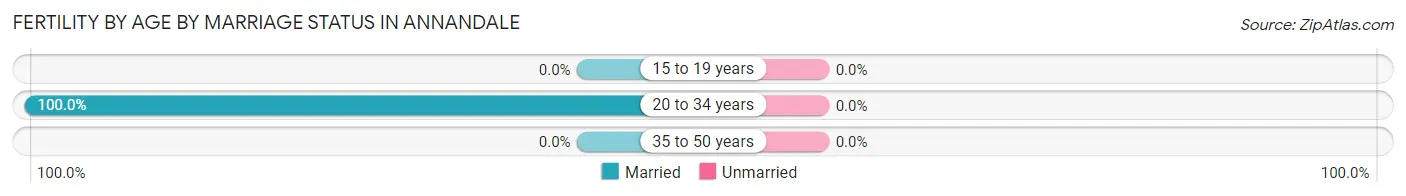
| Age Bracket | Married | Unmarried |
| 15 to 19 years | 0 (0.0%) | 0 (0.0%) |
| 20 to 34 years | 24 (100.0%) | 0 (0.0%) |
| 35 to 50 years | 0 (0.0%) | 0 (0.0%) |
| Total | 24 (100.0%) | 0 (0.0%) |
Fertility by Education in Annandale
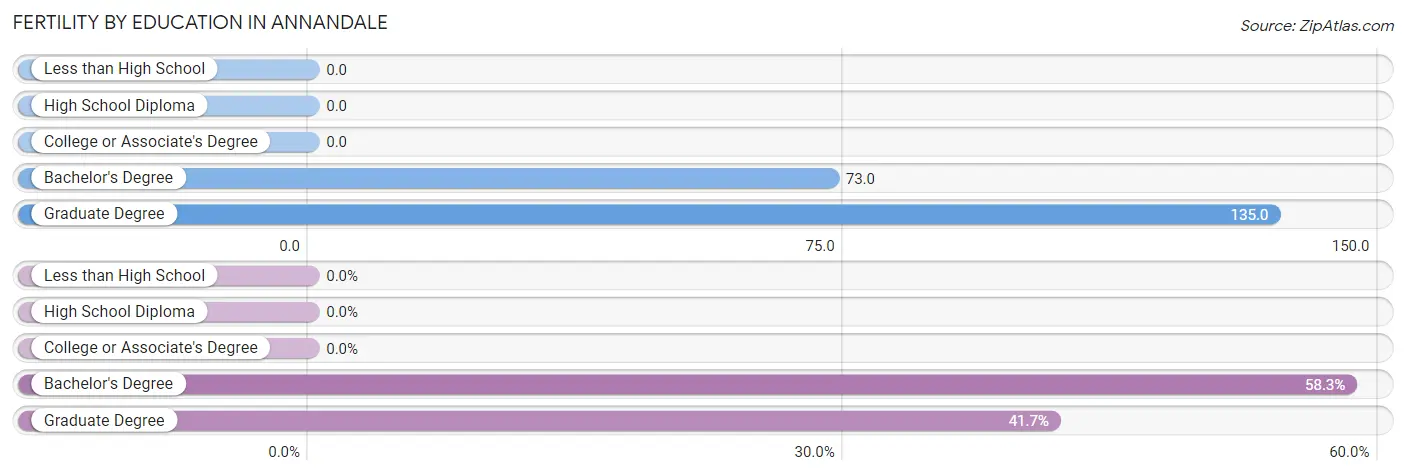
| Educational Attainment | Women with Births | Births / 1,000 Women |
| Less than High School | 0 (0.0%) | 0.0 |
| High School Diploma | 0 (0.0%) | 0.0 |
| College or Associate's Degree | 0 (0.0%) | 0.0 |
| Bachelor's Degree | 14 (58.3%) | 73.0 |
| Graduate Degree | 10 (41.7%) | 135.0 |
| Total | 24 (100.0%) | 44.0 |
Fertility by Education by Marriage Status in Annandale
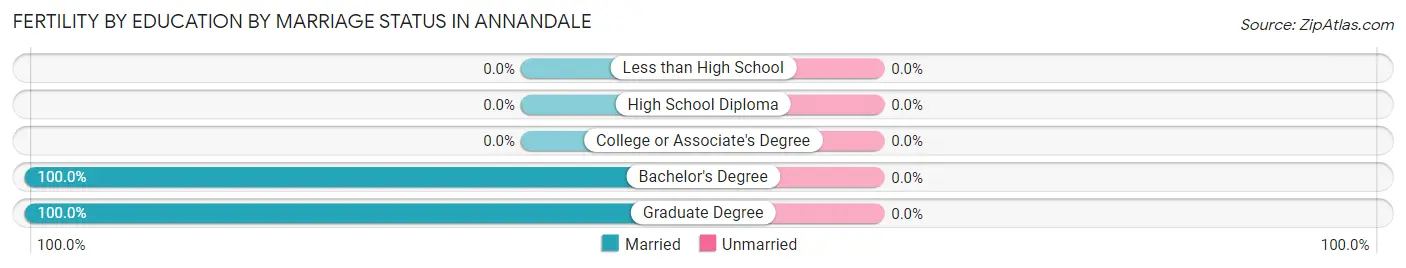
| Educational Attainment | Married | Unmarried |
| Less than High School | 0 (0.0%) | 0 (0.0%) |
| High School Diploma | 0 (0.0%) | 0 (0.0%) |
| College or Associate's Degree | 0 (0.0%) | 0 (0.0%) |
| Bachelor's Degree | 14 (100.0%) | 0 (0.0%) |
| Graduate Degree | 10 (100.0%) | 0 (0.0%) |
| Total | 24 (100.0%) | 0 (0.0%) |
Employment Characteristics in Annandale
Employment by Class of Employer in Annandale
Among the 925 employed individuals in Annandale, private company employees (645 | 69.7%), not-for-profit organizations (104 | 11.2%), and local government employees (96 | 10.4%) make up the most common classes of employment.
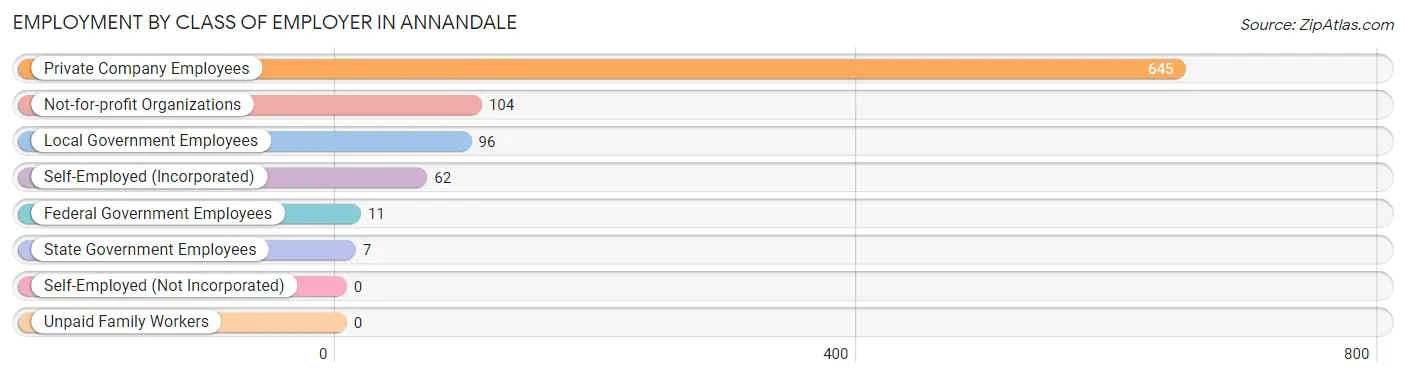
| Employer Class | # Employees | % Employees |
| Private Company Employees | 645 | 69.7% |
| Self-Employed (Incorporated) | 62 | 6.7% |
| Self-Employed (Not Incorporated) | 0 | 0.0% |
| Not-for-profit Organizations | 104 | 11.2% |
| Local Government Employees | 96 | 10.4% |
| State Government Employees | 7 | 0.8% |
| Federal Government Employees | 11 | 1.2% |
| Unpaid Family Workers | 0 | 0.0% |
| Total | 925 | 100.0% |
Employment Status by Age in Annandale
According to the labor force statistics for Annandale, out of the total population over 16 years of age (1,504), 69.8% or 1,050 individuals are in the labor force, with 12.0% or 126 of them unemployed. The age group with the highest labor force participation rate is 25 to 29 years, with 91.2% or 103 individuals in the labor force. Within the labor force, the 20 to 24 years age range has the highest percentage of unemployed individuals, with 45.6% or 68 of them being unemployed.
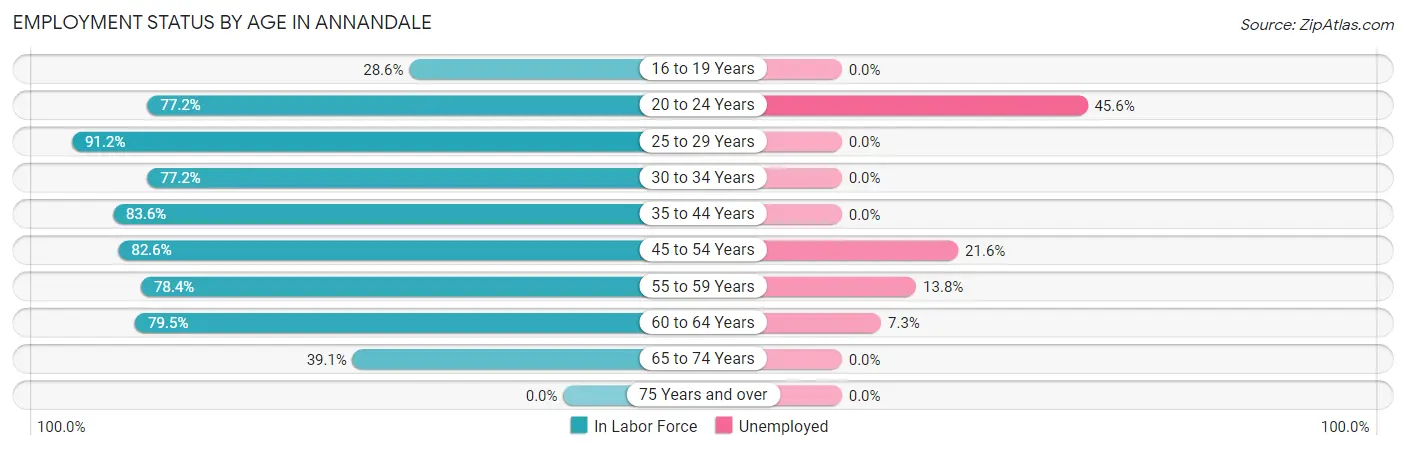
| Age Bracket | In Labor Force | Unemployed |
| 16 to 19 Years | 40 (28.6%) | 0 (0.0%) |
| 20 to 24 Years | 149 (77.2%) | 68 (45.6%) |
| 25 to 29 Years | 103 (91.2%) | 0 (0.0%) |
| 30 to 34 Years | 176 (77.2%) | 0 (0.0%) |
| 35 to 44 Years | 153 (83.6%) | 0 (0.0%) |
| 45 to 54 Years | 171 (82.6%) | 37 (21.6%) |
| 55 to 59 Years | 80 (78.4%) | 11 (13.8%) |
| 60 to 64 Years | 124 (79.5%) | 9 (7.3%) |
| 65 to 74 Years | 54 (39.1%) | 0 (0.0%) |
| 75 Years and over | 0 (0.0%) | 0 (0.0%) |
| Total | 1,050 (69.8%) | 126 (12.0%) |
Employment Status by Educational Attainment in Annandale
According to labor force statistics for Annandale, 81.6% of individuals (807) out of the total population between 25 and 64 years of age (989) are in the labor force, with 7.2% or 58 of them being unemployed. The group with the highest labor force participation rate are those with the educational attainment of bachelor's degree or higher, with 91.1% or 601 individuals in the labor force. Within the labor force, individuals with college / associate degree education have the highest percentage of unemployment, with 16.8% or 21 of them being unemployed.
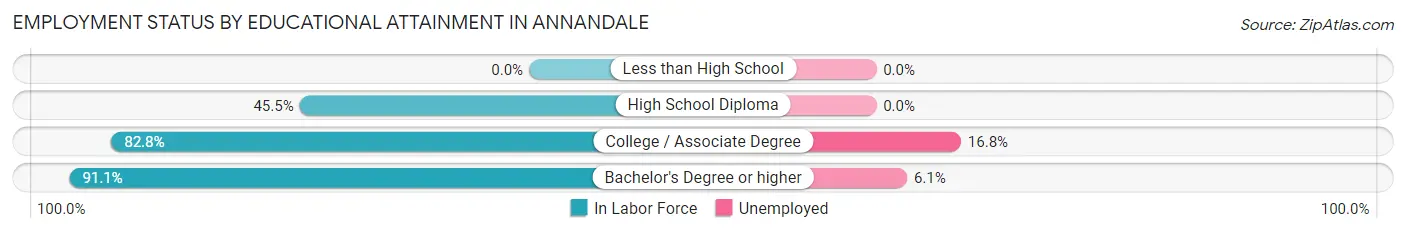
| Educational Attainment | In Labor Force | Unemployed |
| Less than High School | 0 (0.0%) | 0 (0.0%) |
| High School Diploma | 81 (45.5%) | 0 (0.0%) |
| College / Associate Degree | 125 (82.8%) | 25 (16.8%) |
| Bachelor's Degree or higher | 601 (91.1%) | 40 (6.1%) |
| Total | 807 (81.6%) | 71 (7.2%) |
Employment Occupations by Sex in Annandale
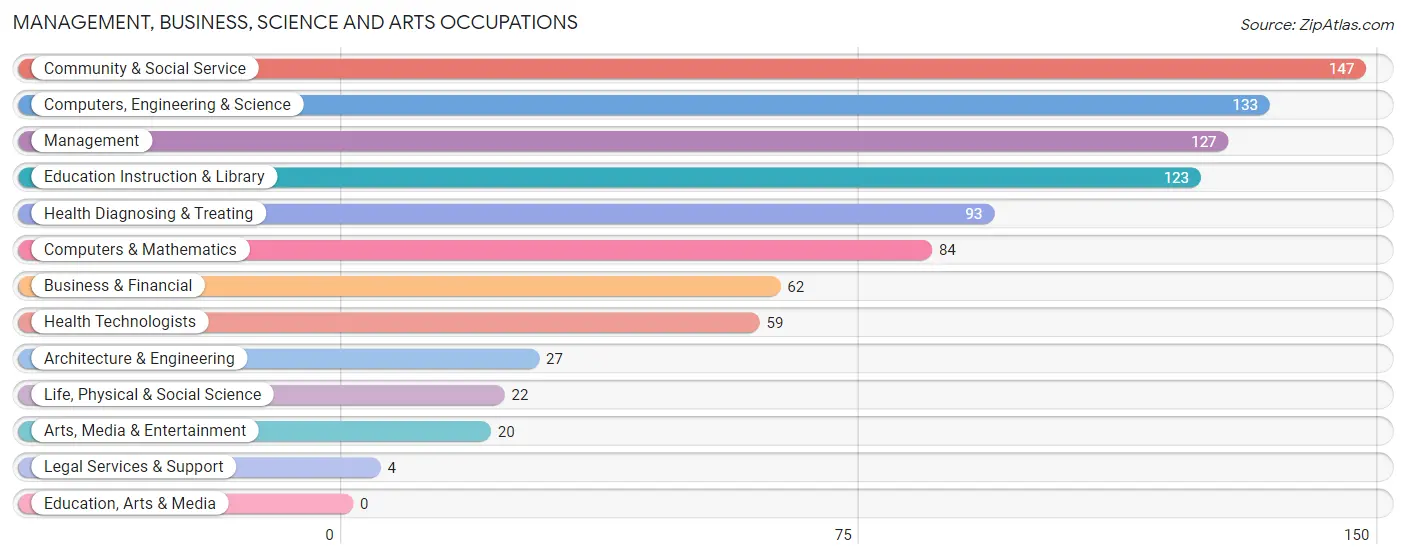
Management, Business, Science and Arts Occupations
The most common Management, Business, Science and Arts occupations in Annandale are Community & Social Service (147 | 16.1%), Computers, Engineering & Science (133 | 14.5%), Management (127 | 13.9%), Education Instruction & Library (123 | 13.5%), and Health Diagnosing & Treating (93 | 10.2%).
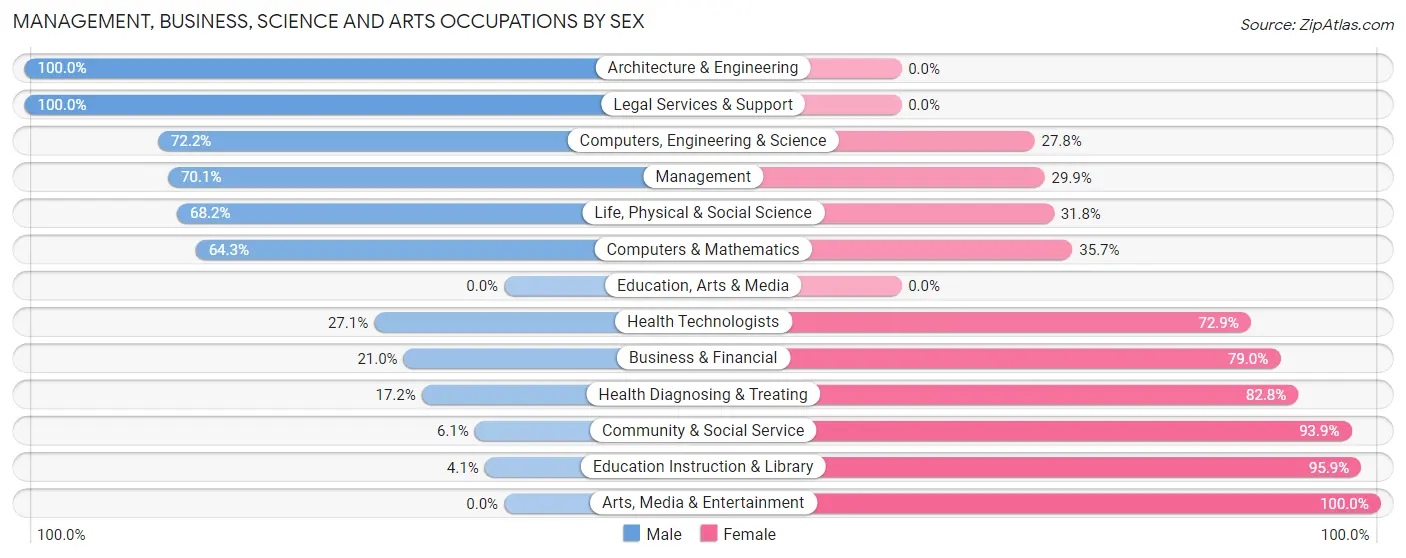
Management, Business, Science and Arts Occupations by Sex
Within the Management, Business, Science and Arts occupations in Annandale, the most male-oriented occupations are Architecture & Engineering (100.0%), Legal Services & Support (100.0%), and Computers, Engineering & Science (72.2%), while the most female-oriented occupations are Arts, Media & Entertainment (100.0%), Education Instruction & Library (95.9%), and Community & Social Service (93.9%).
| Occupation | Male | Female |
| Management | 89 (70.1%) | 38 (29.9%) |
| Business & Financial | 13 (21.0%) | 49 (79.0%) |
| Computers, Engineering & Science | 96 (72.2%) | 37 (27.8%) |
| Computers & Mathematics | 54 (64.3%) | 30 (35.7%) |
| Architecture & Engineering | 27 (100.0%) | 0 (0.0%) |
| Life, Physical & Social Science | 15 (68.2%) | 7 (31.8%) |
| Community & Social Service | 9 (6.1%) | 138 (93.9%) |
| Education, Arts & Media | 0 (0.0%) | 0 (0.0%) |
| Legal Services & Support | 4 (100.0%) | 0 (0.0%) |
| Education Instruction & Library | 5 (4.1%) | 118 (95.9%) |
| Arts, Media & Entertainment | 0 (0.0%) | 20 (100.0%) |
| Health Diagnosing & Treating | 16 (17.2%) | 77 (82.8%) |
| Health Technologists | 16 (27.1%) | 43 (72.9%) |
| Total (Category) | 223 (39.7%) | 339 (60.3%) |
| Total (Overall) | 375 (41.0%) | 539 (59.0%) |
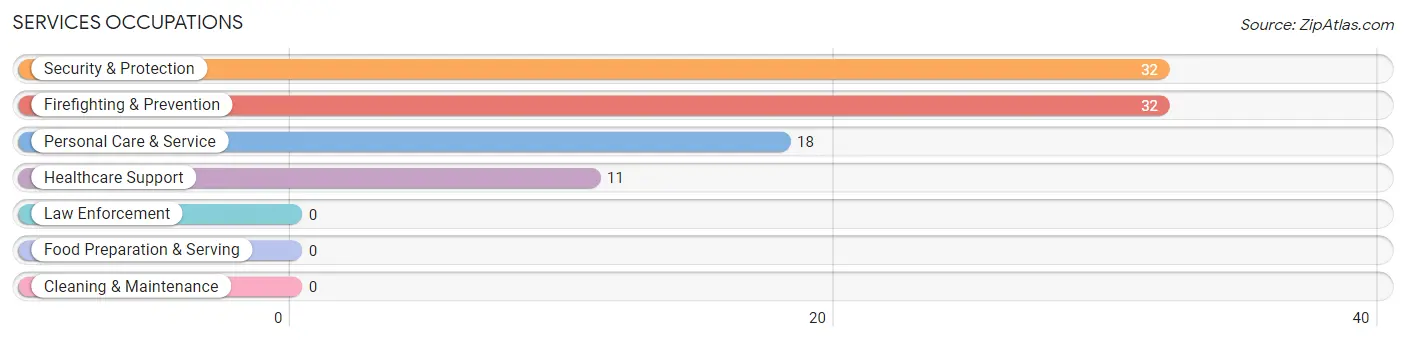
Services Occupations
The most common Services occupations in Annandale are Security & Protection (32 | 3.5%), Firefighting & Prevention (32 | 3.5%), Personal Care & Service (18 | 2.0%), and Healthcare Support (11 | 1.2%).
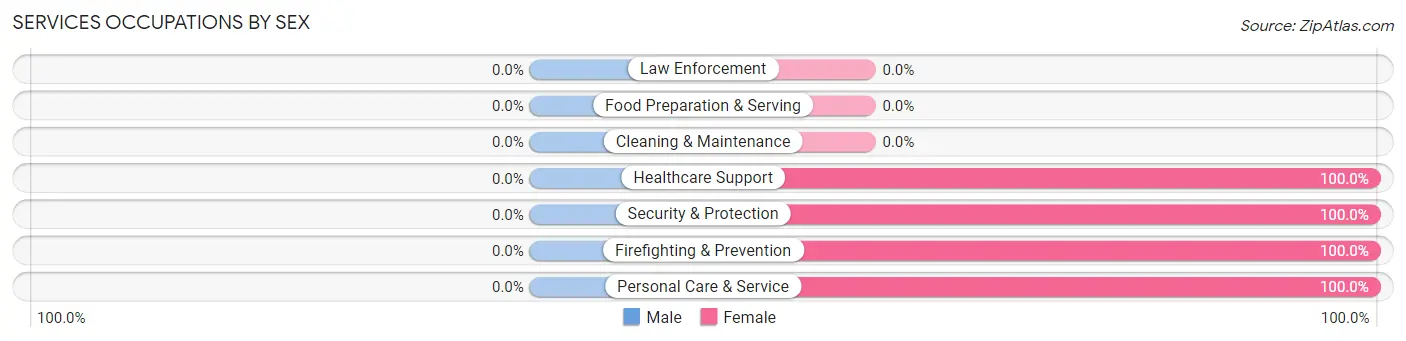
Services Occupations by Sex
| Occupation | Male | Female |
| Healthcare Support | 0 (0.0%) | 11 (100.0%) |
| Security & Protection | 0 (0.0%) | 32 (100.0%) |
| Firefighting & Prevention | 0 (0.0%) | 32 (100.0%) |
| Law Enforcement | 0 (0.0%) | 0 (0.0%) |
| Food Preparation & Serving | 0 (0.0%) | 0 (0.0%) |
| Cleaning & Maintenance | 0 (0.0%) | 0 (0.0%) |
| Personal Care & Service | 0 (0.0%) | 18 (100.0%) |
| Total (Category) | 0 (0.0%) | 61 (100.0%) |
| Total (Overall) | 375 (41.0%) | 539 (59.0%) |
Sales and Office Occupations
The most common Sales and Office occupations in Annandale are Sales & Related (117 | 12.8%), and Office & Administration (96 | 10.5%).
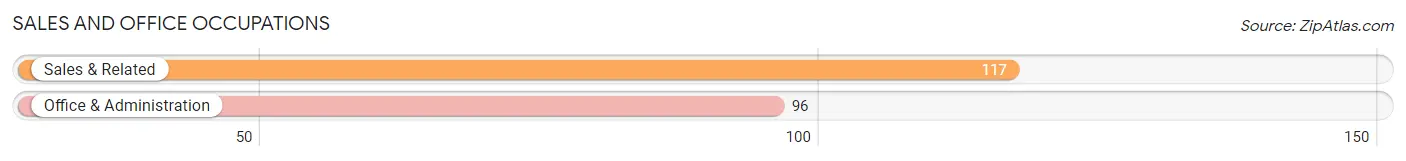
Sales and Office Occupations by Sex

| Occupation | Male | Female |
| Sales & Related | 82 (70.1%) | 35 (29.9%) |
| Office & Administration | 36 (37.5%) | 60 (62.5%) |
| Total (Category) | 118 (55.4%) | 95 (44.6%) |
| Total (Overall) | 375 (41.0%) | 539 (59.0%) |
Natural Resources, Construction and Maintenance Occupations
The most common Natural Resources, Construction and Maintenance occupations in Annandale are Installation, Maintenance & Repair (20 | 2.2%), and Construction & Extraction (14 | 1.5%).
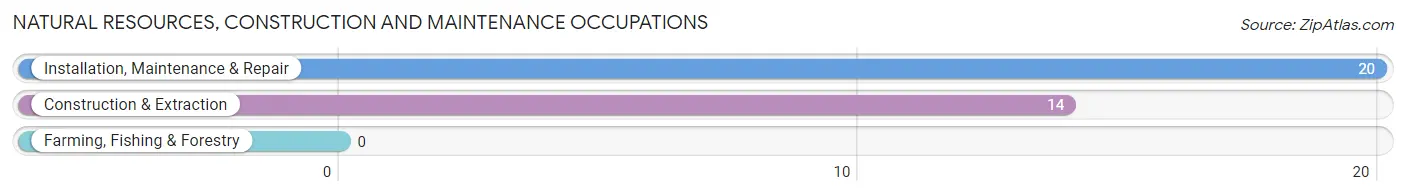
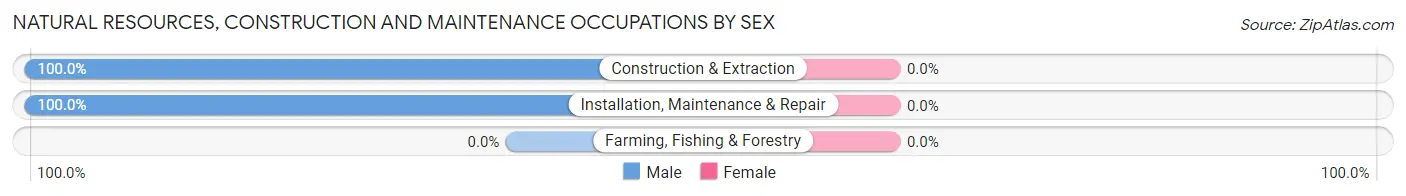
Natural Resources, Construction and Maintenance Occupations by Sex
| Occupation | Male | Female |
| Farming, Fishing & Forestry | 0 (0.0%) | 0 (0.0%) |
| Construction & Extraction | 14 (100.0%) | 0 (0.0%) |
| Installation, Maintenance & Repair | 20 (100.0%) | 0 (0.0%) |
| Total (Category) | 34 (100.0%) | 0 (0.0%) |
| Total (Overall) | 375 (41.0%) | 539 (59.0%) |
Production, Transportation and Moving Occupations
The most common Production, Transportation and Moving occupations in Annandale are Transportation (34 | 3.7%), and Production (10 | 1.1%).
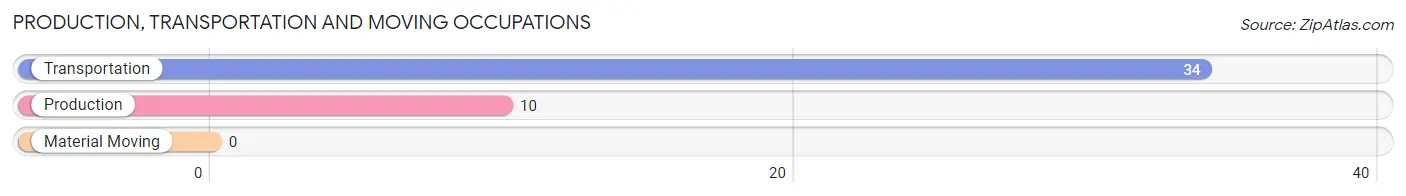
Production, Transportation and Moving Occupations by Sex
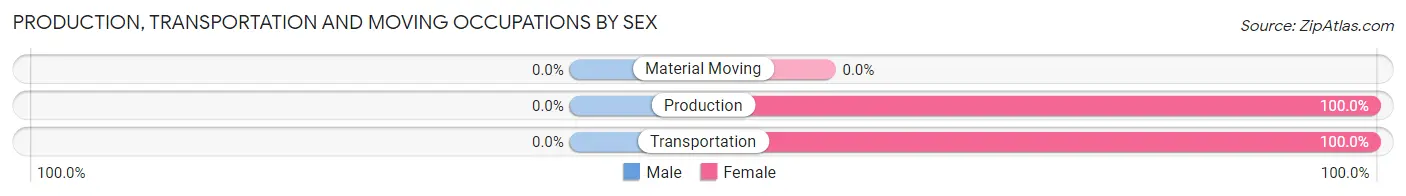
| Occupation | Male | Female |
| Production | 0 (0.0%) | 10 (100.0%) |
| Transportation | 0 (0.0%) | 34 (100.0%) |
| Material Moving | 0 (0.0%) | 0 (0.0%) |
| Total (Category) | 0 (0.0%) | 44 (100.0%) |
| Total (Overall) | 375 (41.0%) | 539 (59.0%) |
Employment Industries by Sex in Annandale
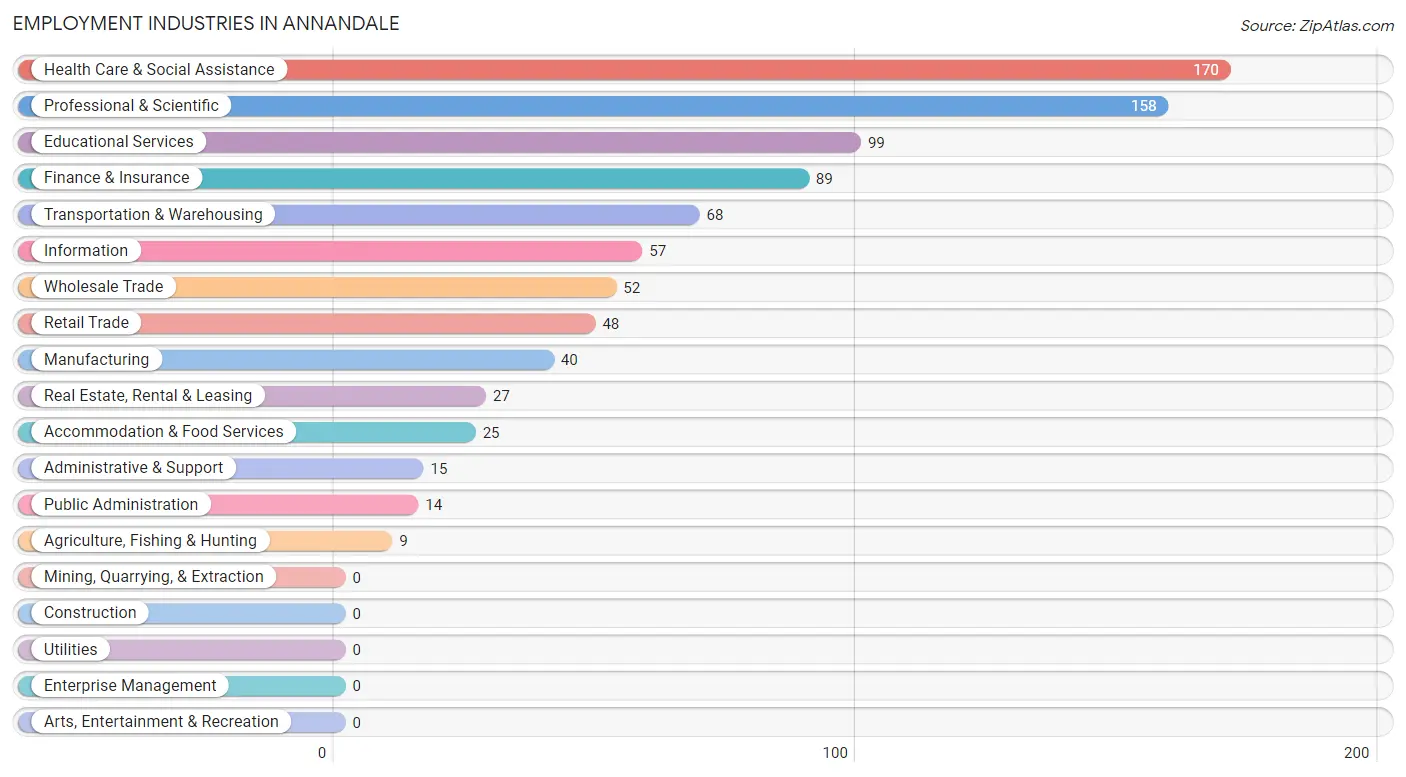
Employment Industries in Annandale
The major employment industries in Annandale include Health Care & Social Assistance (170 | 18.6%), Professional & Scientific (158 | 17.3%), Educational Services (99 | 10.8%), Finance & Insurance (89 | 9.7%), and Transportation & Warehousing (68 | 7.4%).
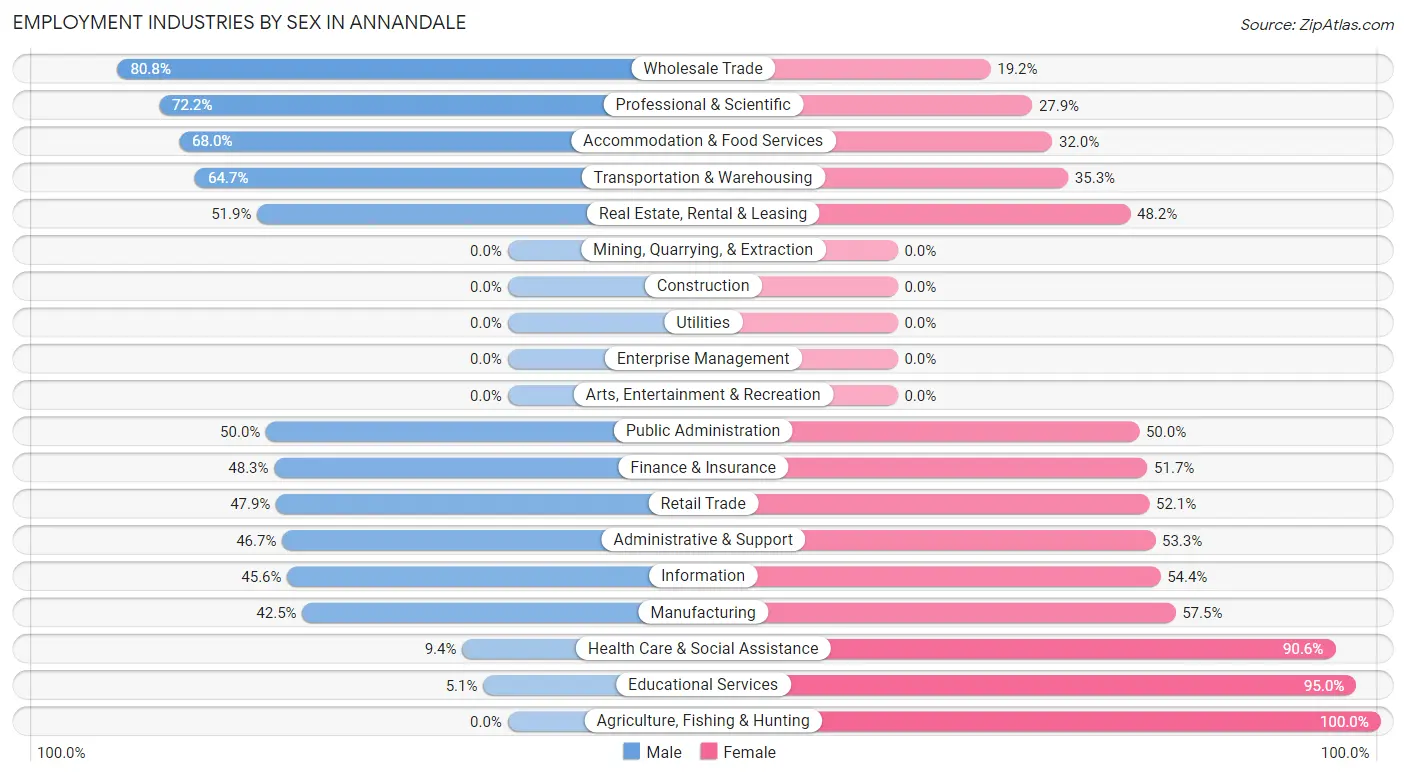
Employment Industries by Sex in Annandale
The Annandale industries that see more men than women are Wholesale Trade (80.8%), Professional & Scientific (72.2%), and Accommodation & Food Services (68.0%), whereas the industries that tend to have a higher number of women are Agriculture, Fishing & Hunting (100.0%), Educational Services (95.0%), and Health Care & Social Assistance (90.6%).
| Industry | Male | Female |
| Agriculture, Fishing & Hunting | 0 (0.0%) | 9 (100.0%) |
| Mining, Quarrying, & Extraction | 0 (0.0%) | 0 (0.0%) |
| Construction | 0 (0.0%) | 0 (0.0%) |
| Manufacturing | 17 (42.5%) | 23 (57.5%) |
| Wholesale Trade | 42 (80.8%) | 10 (19.2%) |
| Retail Trade | 23 (47.9%) | 25 (52.1%) |
| Transportation & Warehousing | 44 (64.7%) | 24 (35.3%) |
| Utilities | 0 (0.0%) | 0 (0.0%) |
| Information | 26 (45.6%) | 31 (54.4%) |
| Finance & Insurance | 43 (48.3%) | 46 (51.7%) |
| Real Estate, Rental & Leasing | 14 (51.8%) | 13 (48.1%) |
| Professional & Scientific | 114 (72.2%) | 44 (27.9%) |
| Enterprise Management | 0 (0.0%) | 0 (0.0%) |
| Administrative & Support | 7 (46.7%) | 8 (53.3%) |
| Educational Services | 5 (5.1%) | 94 (95.0%) |
| Health Care & Social Assistance | 16 (9.4%) | 154 (90.6%) |
| Arts, Entertainment & Recreation | 0 (0.0%) | 0 (0.0%) |
| Accommodation & Food Services | 17 (68.0%) | 8 (32.0%) |
| Public Administration | 7 (50.0%) | 7 (50.0%) |
| Total | 375 (41.0%) | 539 (59.0%) |
Education in Annandale
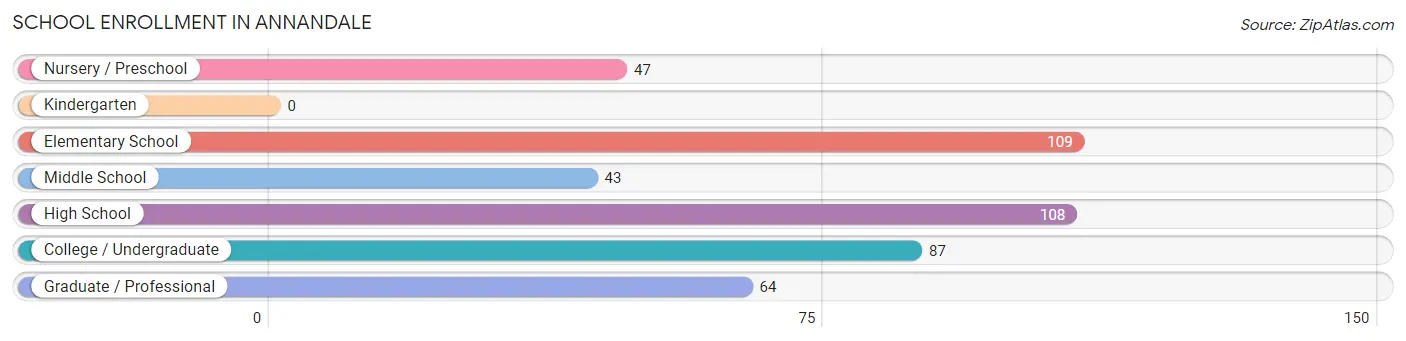
School Enrollment in Annandale
The most common levels of schooling among the 458 students in Annandale are elementary school (109 | 23.8%), high school (108 | 23.6%), and college / undergraduate (87 | 19.0%).
| School Level | # Students | % Students |
| Nursery / Preschool | 47 | 10.3% |
| Kindergarten | 0 | 0.0% |
| Elementary School | 109 | 23.8% |
| Middle School | 43 | 9.4% |
| High School | 108 | 23.6% |
| College / Undergraduate | 87 | 19.0% |
| Graduate / Professional | 64 | 14.0% |
| Total | 458 | 100.0% |
School Enrollment by Age by Funding Source in Annandale
Out of a total of 458 students who are enrolled in schools in Annandale, 130 (28.4%) attend a private institution, while the remaining 328 (71.6%) are enrolled in public schools. The age group of 25 to 34 year olds has the highest likelihood of being enrolled in private schools, with 20 (100.0% in the age bracket) enrolled. Conversely, the age group of 10 to 14 year olds has the lowest likelihood of being enrolled in a private school, with 52 (100.0% in the age bracket) attending a public institution.
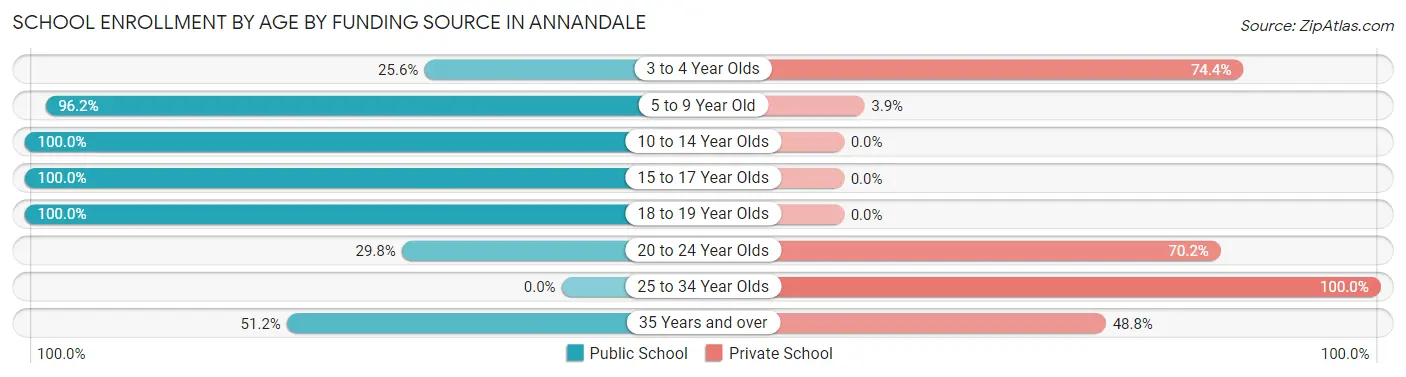
| Age Bracket | Public School | Private School |
| 3 to 4 Year Olds | 11 (25.6%) | 32 (74.4%) |
| 5 to 9 Year Old | 100 (96.2%) | 4 (3.8%) |
| 10 to 14 Year Olds | 52 (100.0%) | 0 (0.0%) |
| 15 to 17 Year Olds | 94 (100.0%) | 0 (0.0%) |
| 18 to 19 Year Olds | 14 (100.0%) | 0 (0.0%) |
| 20 to 24 Year Olds | 14 (29.8%) | 33 (70.2%) |
| 25 to 34 Year Olds | 0 (0.0%) | 20 (100.0%) |
| 35 Years and over | 43 (51.2%) | 41 (48.8%) |
| Total | 328 (71.6%) | 130 (28.4%) |
Educational Attainment by Field of Study in Annandale
Business (198 | 22.7%), education (92 | 10.6%), communications (86 | 9.9%), bio, nature & agricultural (80 | 9.2%), and psychology (80 | 9.2%) are the most common fields of study among 871 individuals in Annandale who have obtained a bachelor's degree or higher.
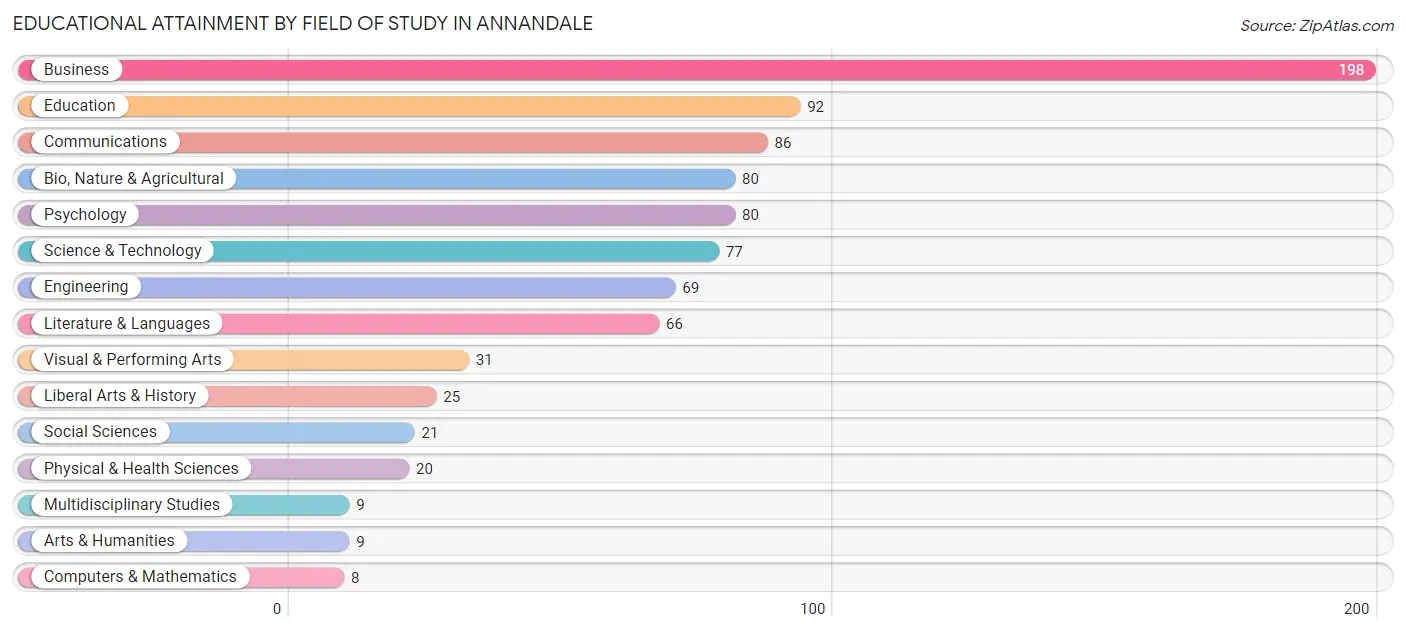
| Field of Study | # Graduates | % Graduates |
| Computers & Mathematics | 8 | 0.9% |
| Bio, Nature & Agricultural | 80 | 9.2% |
| Physical & Health Sciences | 20 | 2.3% |
| Psychology | 80 | 9.2% |
| Social Sciences | 21 | 2.4% |
| Engineering | 69 | 7.9% |
| Multidisciplinary Studies | 9 | 1.0% |
| Science & Technology | 77 | 8.8% |
| Business | 198 | 22.7% |
| Education | 92 | 10.6% |
| Literature & Languages | 66 | 7.6% |
| Liberal Arts & History | 25 | 2.9% |
| Visual & Performing Arts | 31 | 3.6% |
| Communications | 86 | 9.9% |
| Arts & Humanities | 9 | 1.0% |
| Total | 871 | 100.0% |
Transportation & Commute in Annandale
Vehicle Availability by Sex in Annandale
The most prevalent vehicle ownership categories in Annandale are males with 2 vehicles (170, accounting for 44.0%) and females with 2 vehicles (219, making up 31.5%).
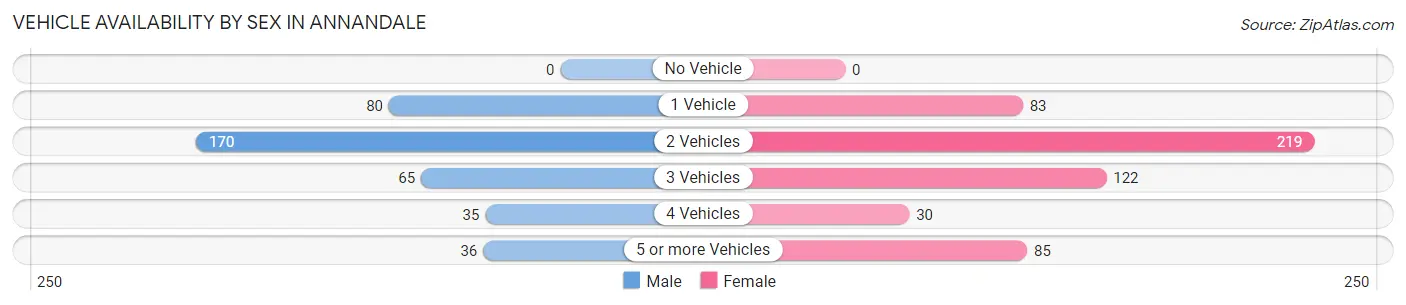
| Vehicles Available | Male | Female |
| No Vehicle | 0 (0.0%) | 0 (0.0%) |
| 1 Vehicle | 80 (20.7%) | 83 (15.4%) |
| 2 Vehicles | 170 (44.0%) | 219 (40.6%) |
| 3 Vehicles | 65 (16.8%) | 122 (22.6%) |
| 4 Vehicles | 35 (9.1%) | 30 (5.6%) |
| 5 or more Vehicles | 36 (9.3%) | 85 (15.8%) |
| Total | 386 (100.0%) | 539 (100.0%) |
Commute Time in Annandale
The most frequently occuring commute durations in Annandale are 60 to 89 minutes (176 commuters, 21.1%), 30 to 34 minutes (146 commuters, 17.5%), and 15 to 19 minutes (128 commuters, 15.4%).
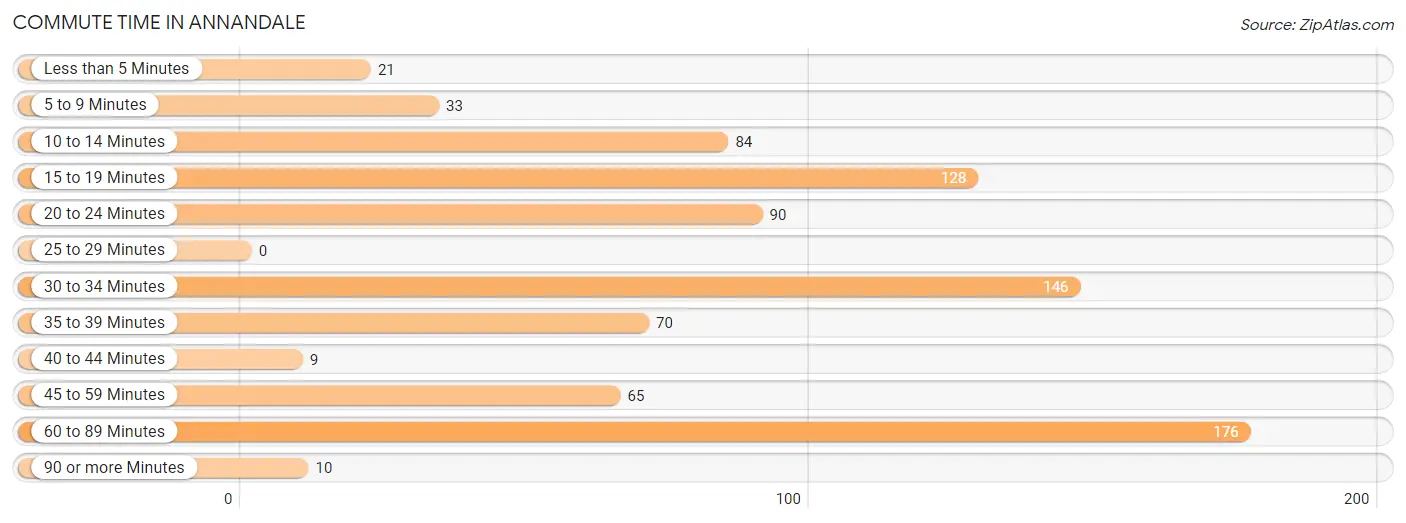
| Commute Time | # Commuters | % Commuters |
| Less than 5 Minutes | 21 | 2.5% |
| 5 to 9 Minutes | 33 | 4.0% |
| 10 to 14 Minutes | 84 | 10.1% |
| 15 to 19 Minutes | 128 | 15.4% |
| 20 to 24 Minutes | 90 | 10.8% |
| 25 to 29 Minutes | 0 | 0.0% |
| 30 to 34 Minutes | 146 | 17.5% |
| 35 to 39 Minutes | 70 | 8.4% |
| 40 to 44 Minutes | 9 | 1.1% |
| 45 to 59 Minutes | 65 | 7.8% |
| 60 to 89 Minutes | 176 | 21.1% |
| 90 or more Minutes | 10 | 1.2% |
Commute Time by Sex in Annandale
The most common commute times in Annandale are 60 to 89 minutes (87 commuters, 26.9%) for males and 30 to 34 minutes (125 commuters, 24.6%) for females.
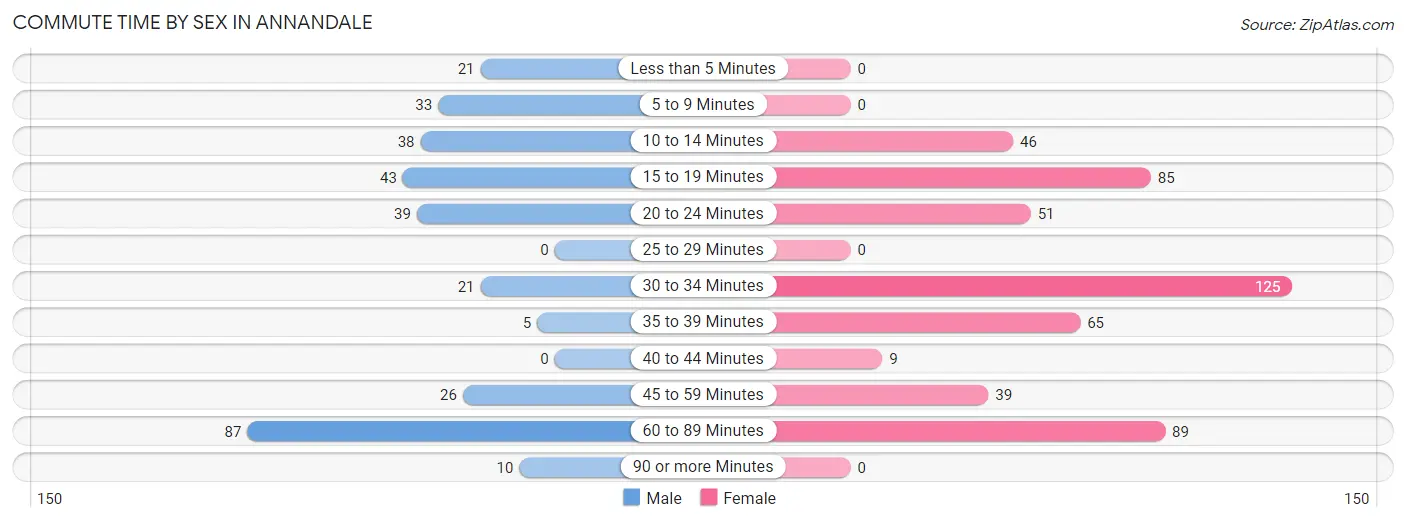
| Commute Time | Male | Female |
| Less than 5 Minutes | 21 (6.5%) | 0 (0.0%) |
| 5 to 9 Minutes | 33 (10.2%) | 0 (0.0%) |
| 10 to 14 Minutes | 38 (11.8%) | 46 (9.0%) |
| 15 to 19 Minutes | 43 (13.3%) | 85 (16.7%) |
| 20 to 24 Minutes | 39 (12.1%) | 51 (10.0%) |
| 25 to 29 Minutes | 0 (0.0%) | 0 (0.0%) |
| 30 to 34 Minutes | 21 (6.5%) | 125 (24.6%) |
| 35 to 39 Minutes | 5 (1.5%) | 65 (12.8%) |
| 40 to 44 Minutes | 0 (0.0%) | 9 (1.8%) |
| 45 to 59 Minutes | 26 (8.1%) | 39 (7.7%) |
| 60 to 89 Minutes | 87 (26.9%) | 89 (17.5%) |
| 90 or more Minutes | 10 (3.1%) | 0 (0.0%) |
Time of Departure to Work by Sex in Annandale
The most frequent times of departure to work in Annandale are 8:00 AM to 8:29 AM (61, 18.9%) for males and 6:30 AM to 6:59 AM (87, 17.1%) for females.
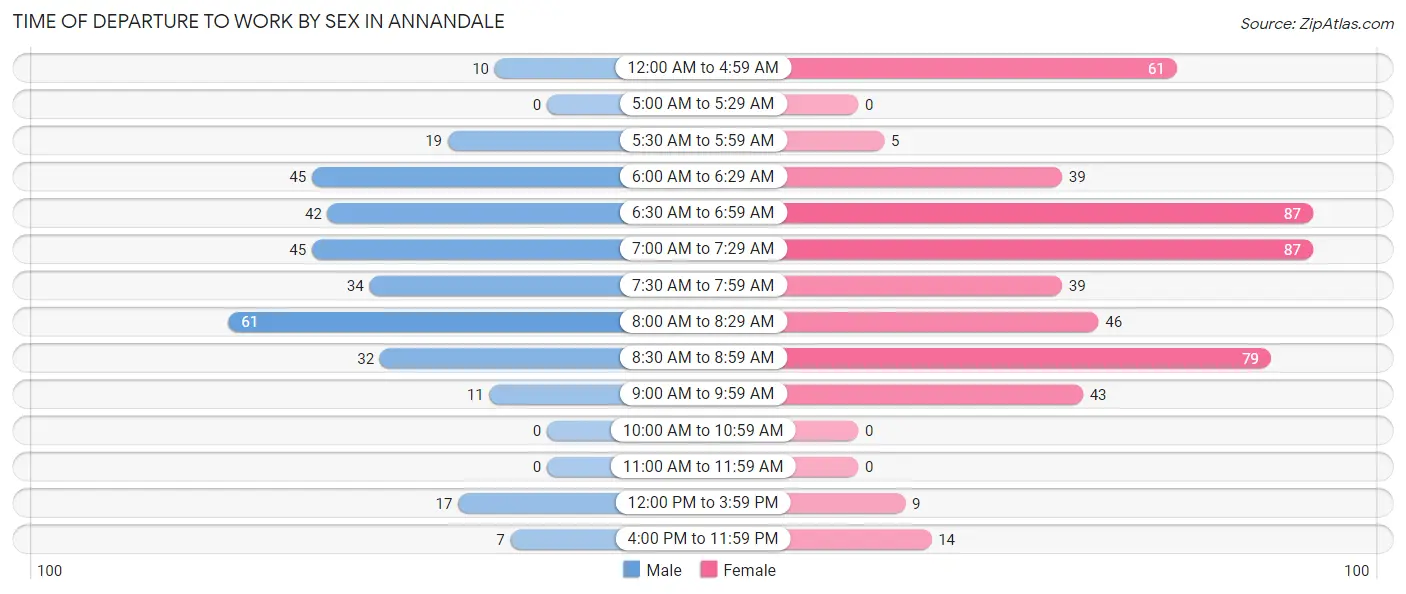
| Time of Departure | Male | Female |
| 12:00 AM to 4:59 AM | 10 (3.1%) | 61 (12.0%) |
| 5:00 AM to 5:29 AM | 0 (0.0%) | 0 (0.0%) |
| 5:30 AM to 5:59 AM | 19 (5.9%) | 5 (1.0%) |
| 6:00 AM to 6:29 AM | 45 (13.9%) | 39 (7.7%) |
| 6:30 AM to 6:59 AM | 42 (13.0%) | 87 (17.1%) |
| 7:00 AM to 7:29 AM | 45 (13.9%) | 87 (17.1%) |
| 7:30 AM to 7:59 AM | 34 (10.5%) | 39 (7.7%) |
| 8:00 AM to 8:29 AM | 61 (18.9%) | 46 (9.0%) |
| 8:30 AM to 8:59 AM | 32 (9.9%) | 79 (15.5%) |
| 9:00 AM to 9:59 AM | 11 (3.4%) | 43 (8.5%) |
| 10:00 AM to 10:59 AM | 0 (0.0%) | 0 (0.0%) |
| 11:00 AM to 11:59 AM | 0 (0.0%) | 0 (0.0%) |
| 12:00 PM to 3:59 PM | 17 (5.3%) | 9 (1.8%) |
| 4:00 PM to 11:59 PM | 7 (2.2%) | 14 (2.8%) |
| Total | 323 (100.0%) | 509 (100.0%) |
Housing Occupancy in Annandale
Occupancy by Ownership in Annandale
Of the total 643 dwellings in Annandale, owner-occupied units account for 439 (68.3%), while renter-occupied units make up 204 (31.7%).
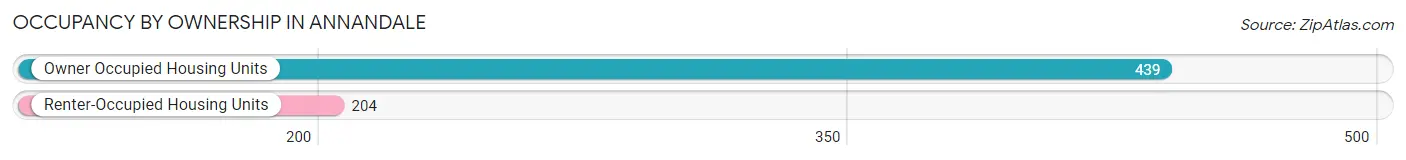
| Occupancy | # Housing Units | % Housing Units |
| Owner Occupied Housing Units | 439 | 68.3% |
| Renter-Occupied Housing Units | 204 | 31.7% |
| Total Occupied Housing Units | 643 | 100.0% |
Occupancy by Household Size in Annandale
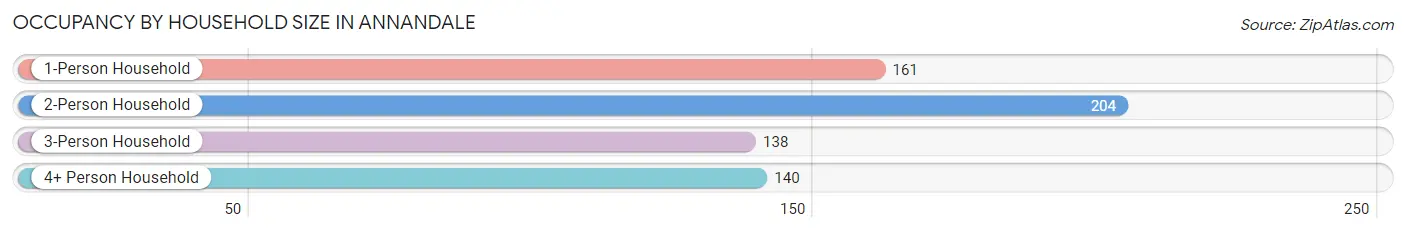
| Household Size | # Housing Units | % Housing Units |
| 1-Person Household | 161 | 25.0% |
| 2-Person Household | 204 | 31.7% |
| 3-Person Household | 138 | 21.5% |
| 4+ Person Household | 140 | 21.8% |
| Total Housing Units | 643 | 100.0% |
Occupancy by Ownership by Household Size in Annandale
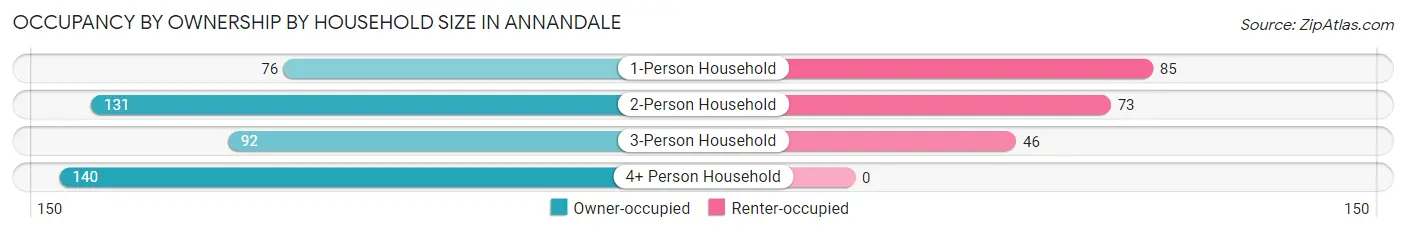
| Household Size | Owner-occupied | Renter-occupied |
| 1-Person Household | 76 (47.2%) | 85 (52.8%) |
| 2-Person Household | 131 (64.2%) | 73 (35.8%) |
| 3-Person Household | 92 (66.7%) | 46 (33.3%) |
| 4+ Person Household | 140 (100.0%) | 0 (0.0%) |
| Total Housing Units | 439 (68.3%) | 204 (31.7%) |
Occupancy by Educational Attainment in Annandale
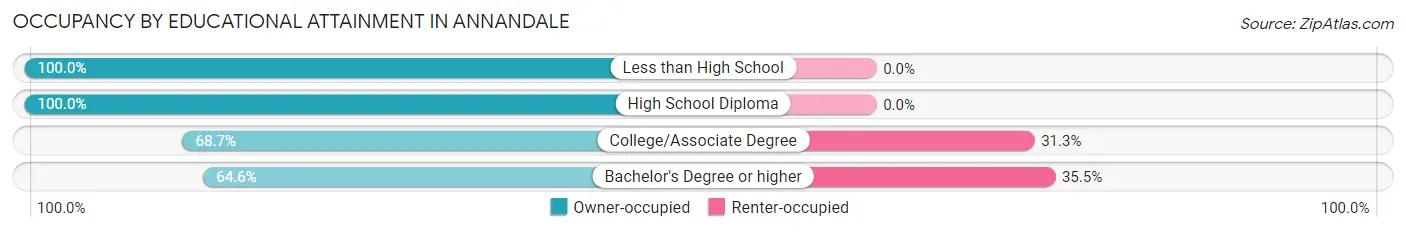
| Household Size | Owner-occupied | Renter-occupied |
| Less than High School | 13 (100.0%) | 0 (0.0%) |
| High School Diploma | 39 (100.0%) | 0 (0.0%) |
| College/Associate Degree | 92 (68.7%) | 42 (31.3%) |
| Bachelor's Degree or higher | 295 (64.5%) | 162 (35.4%) |
Occupancy by Age of Householder in Annandale
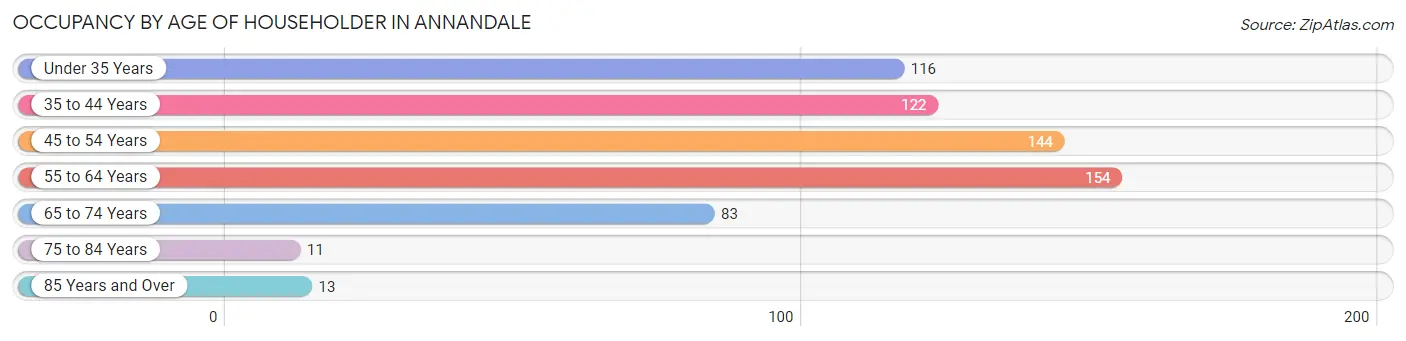
| Age Bracket | # Households | % Households |
| Under 35 Years | 116 | 18.0% |
| 35 to 44 Years | 122 | 19.0% |
| 45 to 54 Years | 144 | 22.4% |
| 55 to 64 Years | 154 | 23.9% |
| 65 to 74 Years | 83 | 12.9% |
| 75 to 84 Years | 11 | 1.7% |
| 85 Years and Over | 13 | 2.0% |
| Total | 643 | 100.0% |
Housing Finances in Annandale
Median Income by Occupancy in Annandale
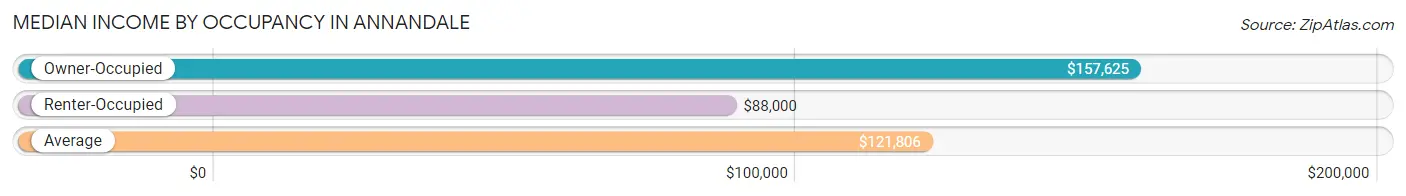
| Occupancy Type | # Households | Median Income |
| Owner-Occupied | 439 (68.3%) | $157,625 |
| Renter-Occupied | 204 (31.7%) | $88,000 |
| Average | 643 (100.0%) | $121,806 |
Occupancy by Householder Income Bracket in Annandale
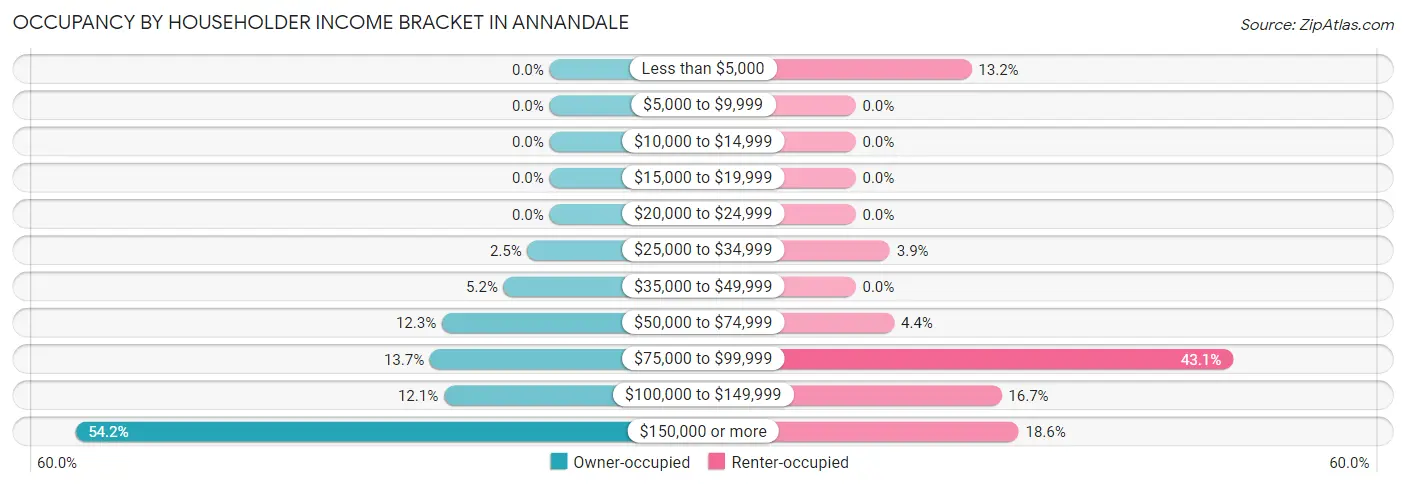
| Income Bracket | Owner-occupied | Renter-occupied |
| Less than $5,000 | 0 (0.0%) | 27 (13.2%) |
| $5,000 to $9,999 | 0 (0.0%) | 0 (0.0%) |
| $10,000 to $14,999 | 0 (0.0%) | 0 (0.0%) |
| $15,000 to $19,999 | 0 (0.0%) | 0 (0.0%) |
| $20,000 to $24,999 | 0 (0.0%) | 0 (0.0%) |
| $25,000 to $34,999 | 11 (2.5%) | 8 (3.9%) |
| $35,000 to $49,999 | 23 (5.2%) | 0 (0.0%) |
| $50,000 to $74,999 | 54 (12.3%) | 9 (4.4%) |
| $75,000 to $99,999 | 60 (13.7%) | 88 (43.1%) |
| $100,000 to $149,999 | 53 (12.1%) | 34 (16.7%) |
| $150,000 or more | 238 (54.2%) | 38 (18.6%) |
| Total | 439 (100.0%) | 204 (100.0%) |
Monthly Housing Cost Tiers in Annandale
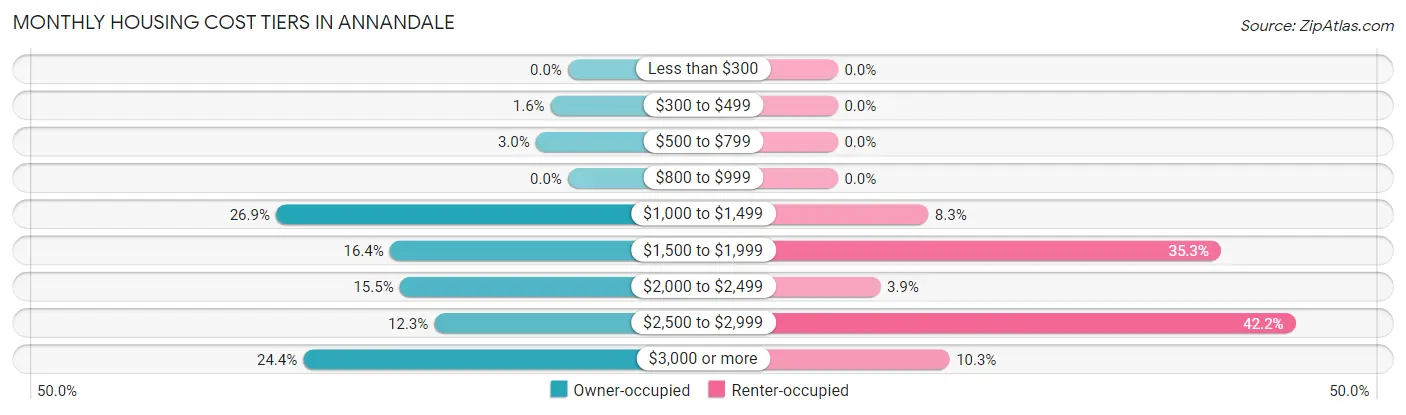
| Monthly Cost | Owner-occupied | Renter-occupied |
| Less than $300 | 0 (0.0%) | 0 (0.0%) |
| $300 to $499 | 7 (1.6%) | 0 (0.0%) |
| $500 to $799 | 13 (3.0%) | 0 (0.0%) |
| $800 to $999 | 0 (0.0%) | 0 (0.0%) |
| $1,000 to $1,499 | 118 (26.9%) | 17 (8.3%) |
| $1,500 to $1,999 | 72 (16.4%) | 72 (35.3%) |
| $2,000 to $2,499 | 68 (15.5%) | 8 (3.9%) |
| $2,500 to $2,999 | 54 (12.3%) | 86 (42.2%) |
| $3,000 or more | 107 (24.4%) | 21 (10.3%) |
| Total | 439 (100.0%) | 204 (100.0%) |
Physical Housing Characteristics in Annandale
Housing Structures in Annandale
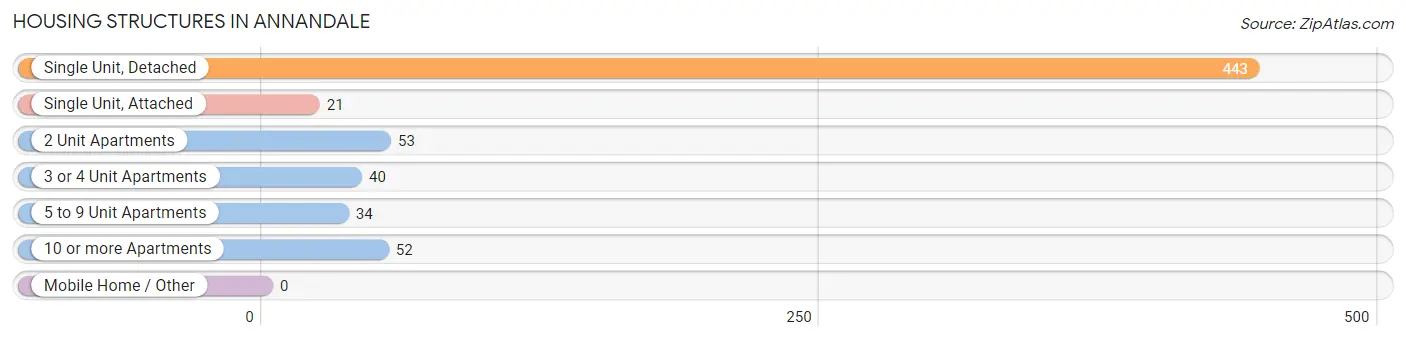
| Structure Type | # Housing Units | % Housing Units |
| Single Unit, Detached | 443 | 68.9% |
| Single Unit, Attached | 21 | 3.3% |
| 2 Unit Apartments | 53 | 8.2% |
| 3 or 4 Unit Apartments | 40 | 6.2% |
| 5 to 9 Unit Apartments | 34 | 5.3% |
| 10 or more Apartments | 52 | 8.1% |
| Mobile Home / Other | 0 | 0.0% |
| Total | 643 | 100.0% |
Housing Structures by Occupancy in Annandale
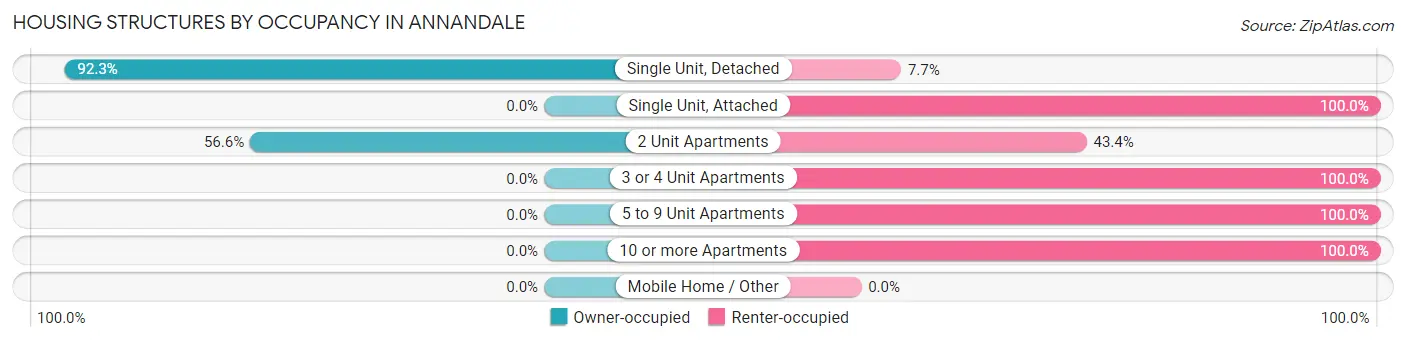
| Structure Type | Owner-occupied | Renter-occupied |
| Single Unit, Detached | 409 (92.3%) | 34 (7.7%) |
| Single Unit, Attached | 0 (0.0%) | 21 (100.0%) |
| 2 Unit Apartments | 30 (56.6%) | 23 (43.4%) |
| 3 or 4 Unit Apartments | 0 (0.0%) | 40 (100.0%) |
| 5 to 9 Unit Apartments | 0 (0.0%) | 34 (100.0%) |
| 10 or more Apartments | 0 (0.0%) | 52 (100.0%) |
| Mobile Home / Other | 0 (0.0%) | 0 (0.0%) |
| Total | 439 (68.3%) | 204 (31.7%) |
Housing Structures by Number of Rooms in Annandale
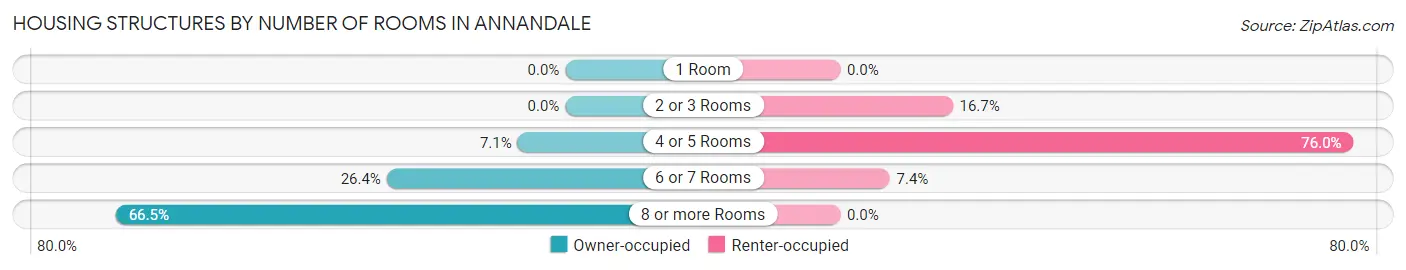
| Number of Rooms | Owner-occupied | Renter-occupied |
| 1 Room | 0 (0.0%) | 0 (0.0%) |
| 2 or 3 Rooms | 0 (0.0%) | 34 (16.7%) |
| 4 or 5 Rooms | 31 (7.1%) | 155 (76.0%) |
| 6 or 7 Rooms | 116 (26.4%) | 15 (7.3%) |
| 8 or more Rooms | 292 (66.5%) | 0 (0.0%) |
| Total | 439 (100.0%) | 204 (100.0%) |
Housing Structure by Heating Type in Annandale
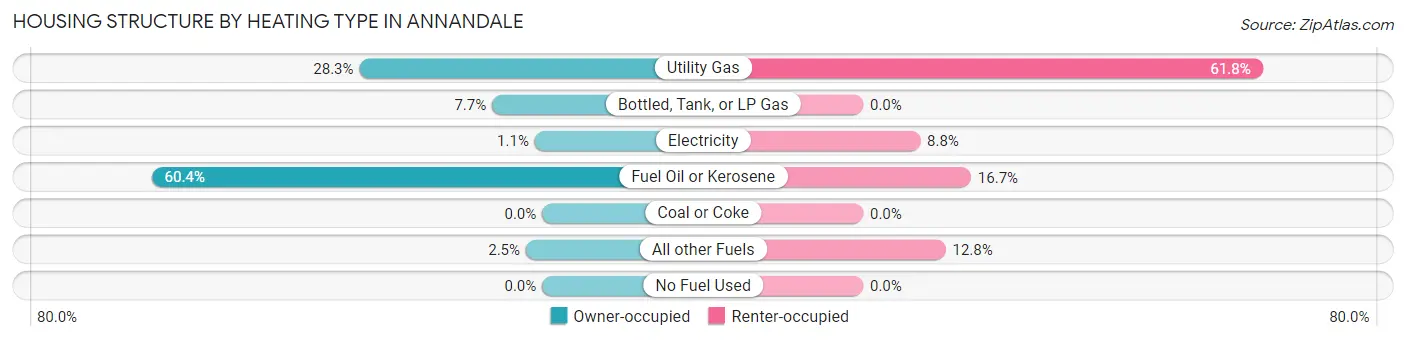
| Heating Type | Owner-occupied | Renter-occupied |
| Utility Gas | 124 (28.2%) | 126 (61.8%) |
| Bottled, Tank, or LP Gas | 34 (7.7%) | 0 (0.0%) |
| Electricity | 5 (1.1%) | 18 (8.8%) |
| Fuel Oil or Kerosene | 265 (60.4%) | 34 (16.7%) |
| Coal or Coke | 0 (0.0%) | 0 (0.0%) |
| All other Fuels | 11 (2.5%) | 26 (12.8%) |
| No Fuel Used | 0 (0.0%) | 0 (0.0%) |
| Total | 439 (100.0%) | 204 (100.0%) |
Household Vehicle Usage in Annandale
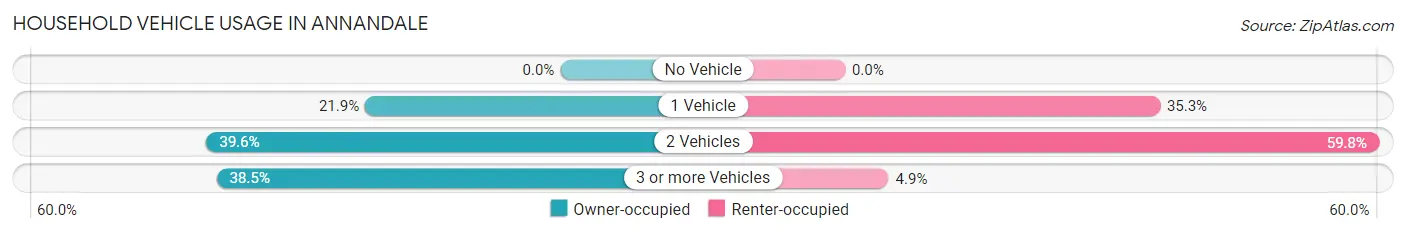
| Vehicles per Household | Owner-occupied | Renter-occupied |
| No Vehicle | 0 (0.0%) | 0 (0.0%) |
| 1 Vehicle | 96 (21.9%) | 72 (35.3%) |
| 2 Vehicles | 174 (39.6%) | 122 (59.8%) |
| 3 or more Vehicles | 169 (38.5%) | 10 (4.9%) |
| Total | 439 (100.0%) | 204 (100.0%) |
Real Estate & Mortgages in Annandale
Real Estate and Mortgage Overview in Annandale
| Characteristic | Without Mortgage | With Mortgage |
| Housing Units | 134 | 305 |
| Median Property Value | $545,700 | $459,600 |
| Median Household Income | $83,409 | $195 |
| Monthly Housing Costs | $1,338 | $107 |
| Real Estate Taxes | $9,643 | $0 |
Property Value by Mortgage Status in Annandale
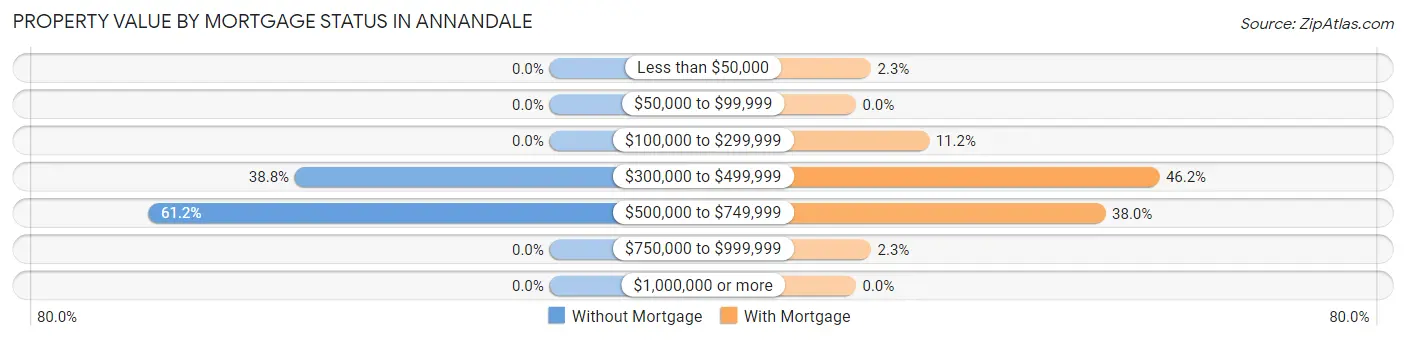
| Property Value | Without Mortgage | With Mortgage |
| Less than $50,000 | 0 (0.0%) | 7 (2.3%) |
| $50,000 to $99,999 | 0 (0.0%) | 0 (0.0%) |
| $100,000 to $299,999 | 0 (0.0%) | 34 (11.2%) |
| $300,000 to $499,999 | 52 (38.8%) | 141 (46.2%) |
| $500,000 to $749,999 | 82 (61.2%) | 116 (38.0%) |
| $750,000 to $999,999 | 0 (0.0%) | 7 (2.3%) |
| $1,000,000 or more | 0 (0.0%) | 0 (0.0%) |
| Total | 134 (100.0%) | 305 (100.0%) |
Household Income by Mortgage Status in Annandale
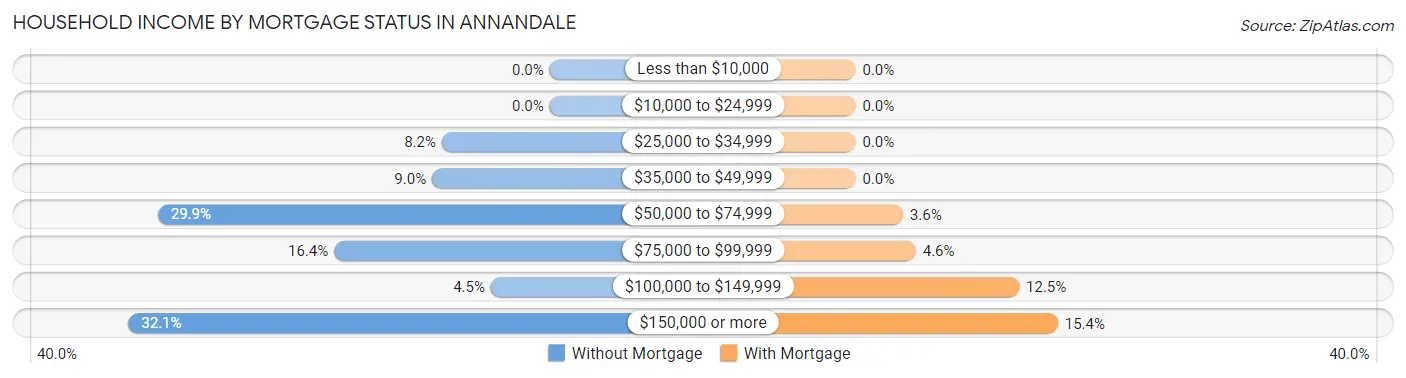
| Household Income | Without Mortgage | With Mortgage |
| Less than $10,000 | 0 (0.0%) | 0 (0.0%) |
| $10,000 to $24,999 | 0 (0.0%) | 0 (0.0%) |
| $25,000 to $34,999 | 11 (8.2%) | 0 (0.0%) |
| $35,000 to $49,999 | 12 (9.0%) | 0 (0.0%) |
| $50,000 to $74,999 | 40 (29.8%) | 11 (3.6%) |
| $75,000 to $99,999 | 22 (16.4%) | 14 (4.6%) |
| $100,000 to $149,999 | 6 (4.5%) | 38 (12.5%) |
| $150,000 or more | 43 (32.1%) | 47 (15.4%) |
| Total | 134 (100.0%) | 305 (100.0%) |
Property Value to Household Income Ratio in Annandale
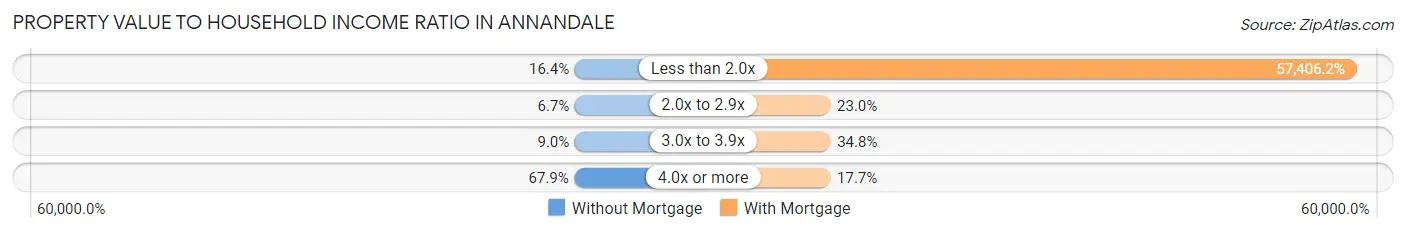
| Value-to-Income Ratio | Without Mortgage | With Mortgage |
| Less than 2.0x | 22 (16.4%) | 175,089 (57,406.2%) |
| 2.0x to 2.9x | 9 (6.7%) | 70 (23.0%) |
| 3.0x to 3.9x | 12 (9.0%) | 106 (34.7%) |
| 4.0x or more | 91 (67.9%) | 54 (17.7%) |
| Total | 134 (100.0%) | 305 (100.0%) |
Real Estate Taxes by Mortgage Status in Annandale
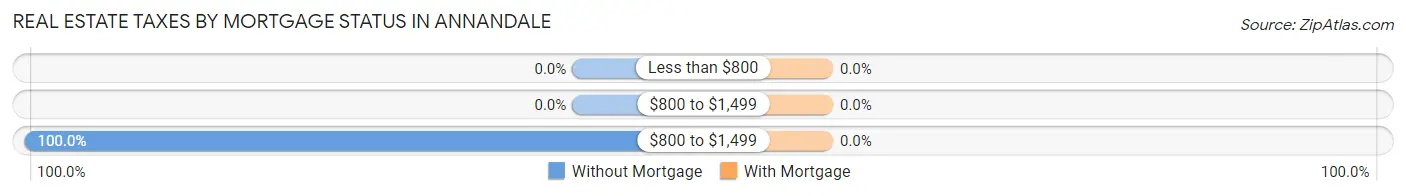
| Property Taxes | Without Mortgage | With Mortgage |
| Less than $800 | 0 (0.0%) | 0 (0.0%) |
| $800 to $1,499 | 0 (0.0%) | 0 (0.0%) |
| $800 to $1,499 | 134 (100.0%) | 0 (0.0%) |
| Total | 134 (100.0%) | 305 (100.0%) |
Health & Disability in Annandale
Health Insurance Coverage by Age in Annandale
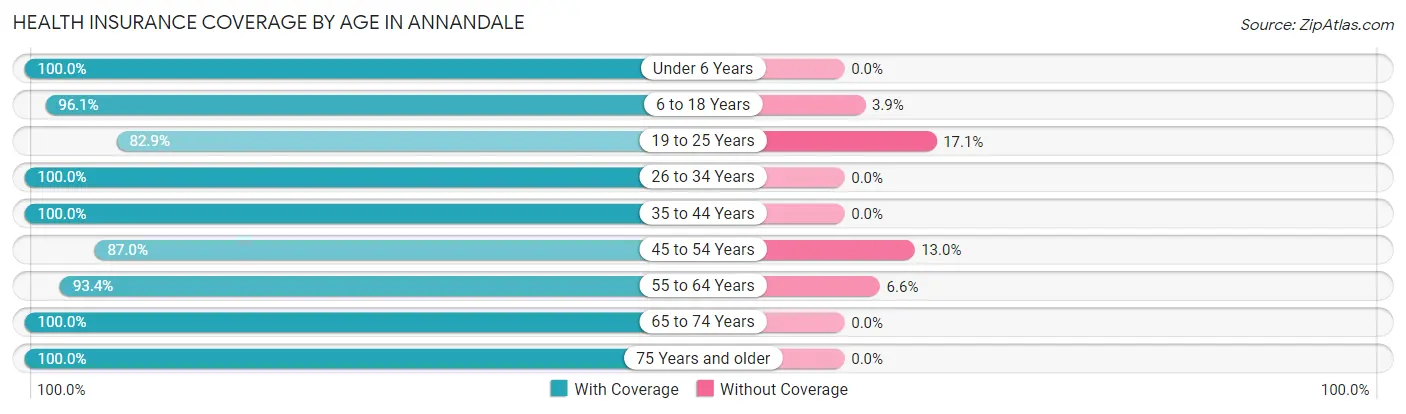
| Age Bracket | With Coverage | Without Coverage |
| Under 6 Years | 187 (100.0%) | 0 (0.0%) |
| 6 to 18 Years | 274 (96.1%) | 11 (3.9%) |
| 19 to 25 Years | 174 (82.9%) | 36 (17.1%) |
| 26 to 34 Years | 330 (100.0%) | 0 (0.0%) |
| 35 to 44 Years | 183 (100.0%) | 0 (0.0%) |
| 45 to 54 Years | 180 (87.0%) | 27 (13.0%) |
| 55 to 64 Years | 241 (93.4%) | 17 (6.6%) |
| 65 to 74 Years | 138 (100.0%) | 0 (0.0%) |
| 75 Years and older | 44 (100.0%) | 0 (0.0%) |
| Total | 1,751 (95.1%) | 91 (4.9%) |
Health Insurance Coverage by Citizenship Status in Annandale
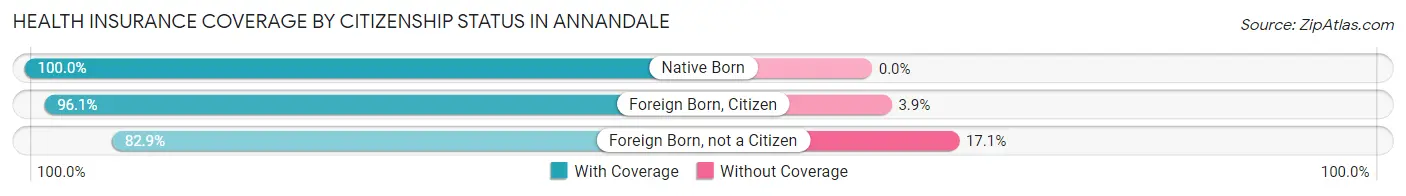
| Citizenship Status | With Coverage | Without Coverage |
| Native Born | 187 (100.0%) | 0 (0.0%) |
| Foreign Born, Citizen | 274 (96.1%) | 11 (3.9%) |
| Foreign Born, not a Citizen | 174 (82.9%) | 36 (17.1%) |
Health Insurance Coverage by Household Income in Annandale
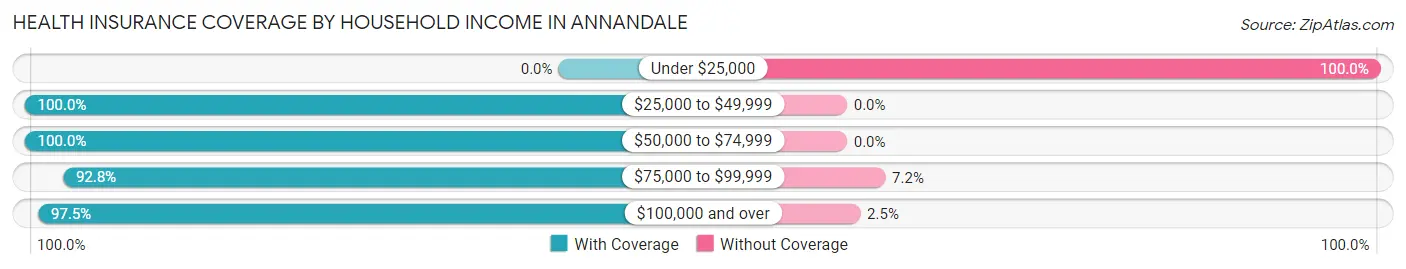
| Household Income | With Coverage | Without Coverage |
| Under $25,000 | 0 (0.0%) | 27 (100.0%) |
| $25,000 to $49,999 | 54 (100.0%) | 0 (0.0%) |
| $50,000 to $74,999 | 139 (100.0%) | 0 (0.0%) |
| $75,000 to $99,999 | 465 (92.8%) | 36 (7.2%) |
| $100,000 and over | 1,093 (97.5%) | 28 (2.5%) |
Public vs Private Health Insurance Coverage by Age in Annandale
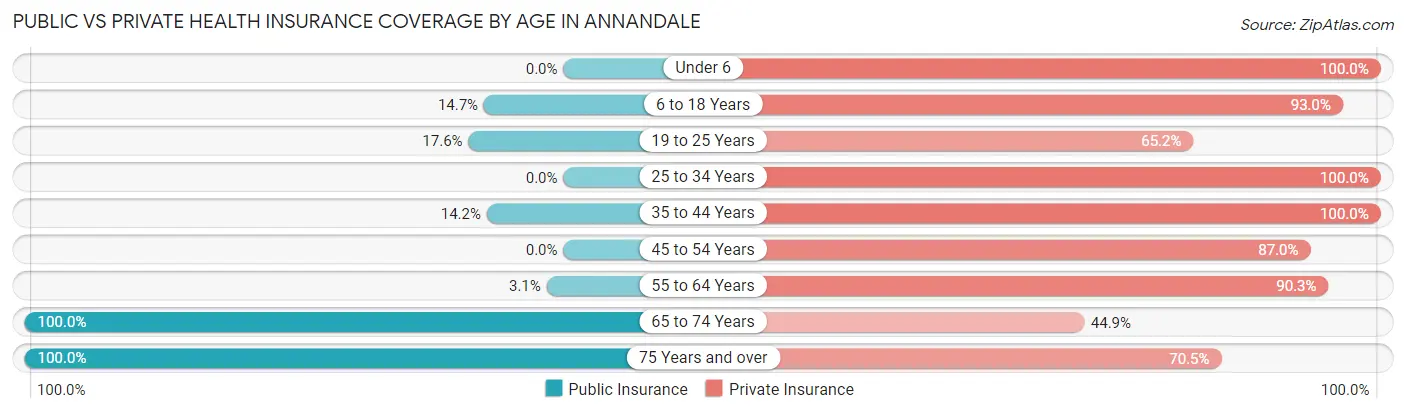
| Age Bracket | Public Insurance | Private Insurance |
| Under 6 | 0 (0.0%) | 187 (100.0%) |
| 6 to 18 Years | 42 (14.7%) | 265 (93.0%) |
| 19 to 25 Years | 37 (17.6%) | 137 (65.2%) |
| 25 to 34 Years | 0 (0.0%) | 330 (100.0%) |
| 35 to 44 Years | 26 (14.2%) | 183 (100.0%) |
| 45 to 54 Years | 0 (0.0%) | 180 (87.0%) |
| 55 to 64 Years | 8 (3.1%) | 233 (90.3%) |
| 65 to 74 Years | 138 (100.0%) | 62 (44.9%) |
| 75 Years and over | 44 (100.0%) | 31 (70.5%) |
| Total | 295 (16.0%) | 1,608 (87.3%) |
Disability Status by Sex by Age in Annandale
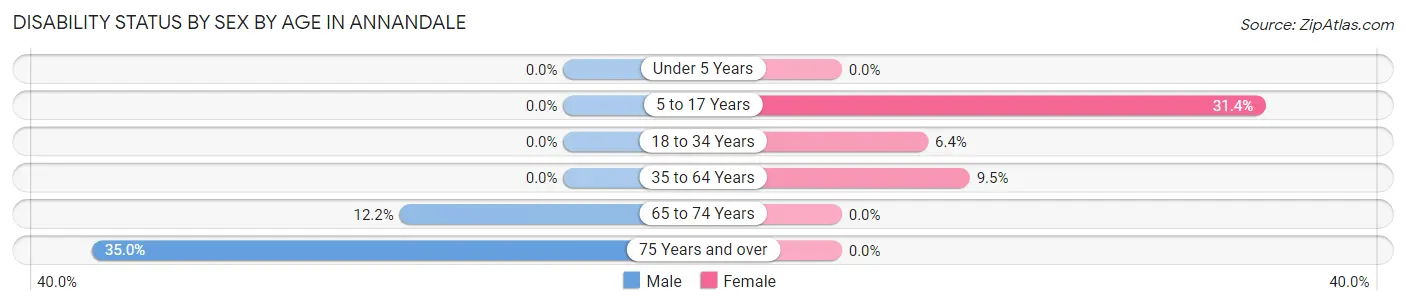
| Age Bracket | Male | Female |
| Under 5 Years | 0 (0.0%) | 0 (0.0%) |
| 5 to 17 Years | 0 (0.0%) | 33 (31.4%) |
| 18 to 34 Years | 0 (0.0%) | 25 (6.4%) |
| 35 to 64 Years | 0 (0.0%) | 34 (9.5%) |
| 65 to 74 Years | 9 (12.2%) | 0 (0.0%) |
| 75 Years and over | 7 (35.0%) | 0 (0.0%) |
Disability Class by Sex by Age in Annandale
Disability Class: Hearing Difficulty
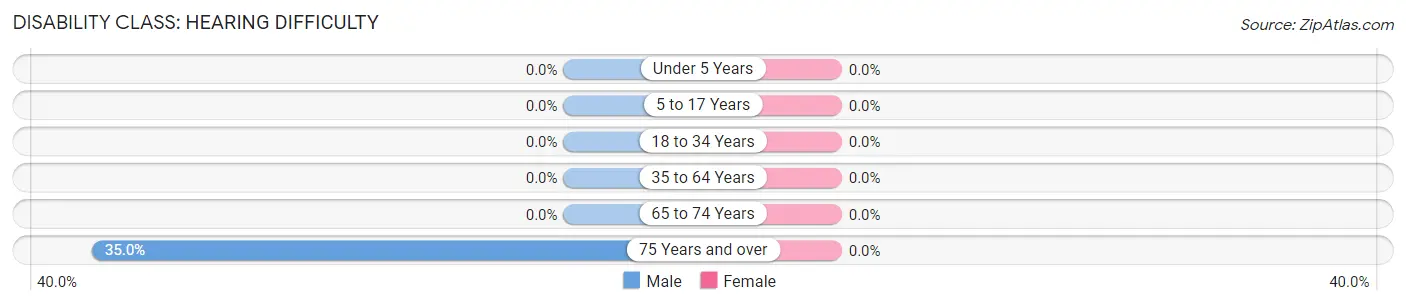
| Age Bracket | Male | Female |
| Under 5 Years | 0 (0.0%) | 0 (0.0%) |
| 5 to 17 Years | 0 (0.0%) | 0 (0.0%) |
| 18 to 34 Years | 0 (0.0%) | 0 (0.0%) |
| 35 to 64 Years | 0 (0.0%) | 0 (0.0%) |
| 65 to 74 Years | 0 (0.0%) | 0 (0.0%) |
| 75 Years and over | 7 (35.0%) | 0 (0.0%) |
Disability Class: Vision Difficulty
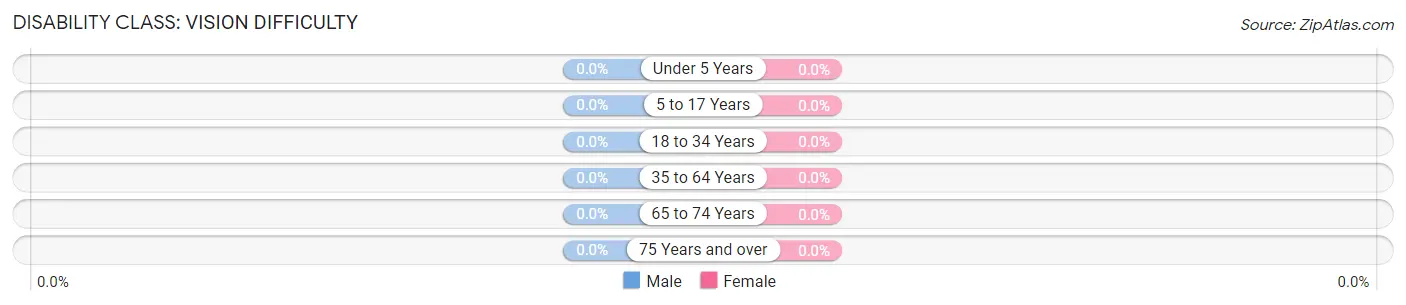
| Age Bracket | Male | Female |
| Under 5 Years | 0 (0.0%) | 0 (0.0%) |
| 5 to 17 Years | 0 (0.0%) | 0 (0.0%) |
| 18 to 34 Years | 0 (0.0%) | 0 (0.0%) |
| 35 to 64 Years | 0 (0.0%) | 0 (0.0%) |
| 65 to 74 Years | 0 (0.0%) | 0 (0.0%) |
| 75 Years and over | 0 (0.0%) | 0 (0.0%) |
Disability Class: Cognitive Difficulty
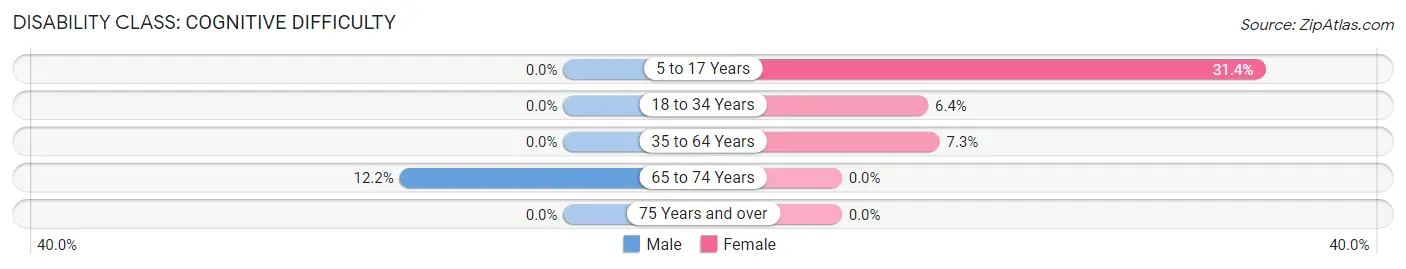
| Age Bracket | Male | Female |
| 5 to 17 Years | 0 (0.0%) | 33 (31.4%) |
| 18 to 34 Years | 0 (0.0%) | 25 (6.4%) |
| 35 to 64 Years | 0 (0.0%) | 26 (7.3%) |
| 65 to 74 Years | 9 (12.2%) | 0 (0.0%) |
| 75 Years and over | 0 (0.0%) | 0 (0.0%) |
Disability Class: Ambulatory Difficulty
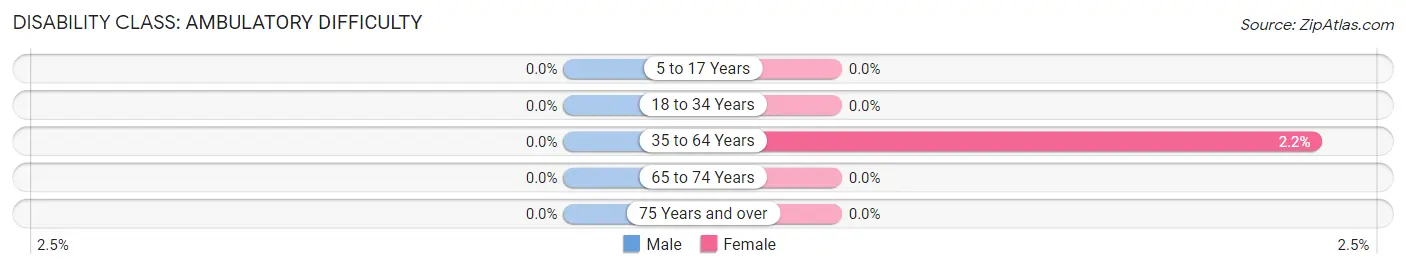
| Age Bracket | Male | Female |
| 5 to 17 Years | 0 (0.0%) | 0 (0.0%) |
| 18 to 34 Years | 0 (0.0%) | 0 (0.0%) |
| 35 to 64 Years | 0 (0.0%) | 8 (2.2%) |
| 65 to 74 Years | 0 (0.0%) | 0 (0.0%) |
| 75 Years and over | 0 (0.0%) | 0 (0.0%) |
Disability Class: Self-Care Difficulty
| Age Bracket | Male | Female |
| 5 to 17 Years | 0 (0.0%) | 0 (0.0%) |
| 18 to 34 Years | 0 (0.0%) | 0 (0.0%) |
| 35 to 64 Years | 0 (0.0%) | 0 (0.0%) |
| 65 to 74 Years | 0 (0.0%) | 0 (0.0%) |
| 75 Years and over | 0 (0.0%) | 0 (0.0%) |
Technology Access in Annandale
Computing Device Access in Annandale
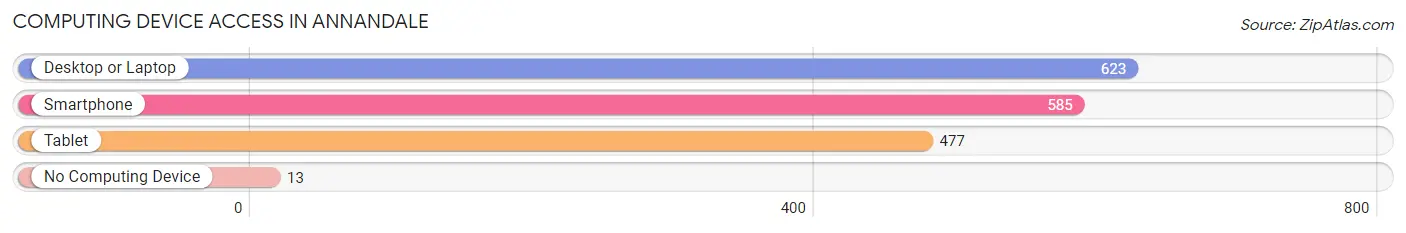
| Device Type | # Households | % Households |
| Desktop or Laptop | 623 | 96.9% |
| Smartphone | 585 | 91.0% |
| Tablet | 477 | 74.2% |
| No Computing Device | 13 | 2.0% |
| Total | 643 | 100.0% |
Internet Access in Annandale
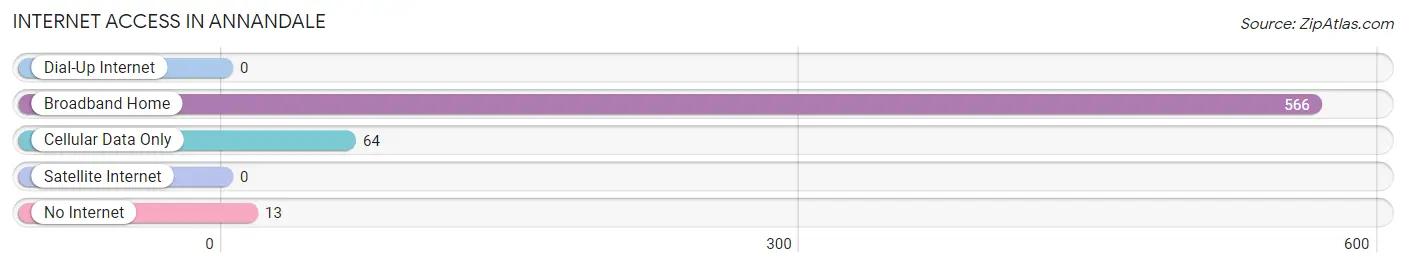
| Internet Type | # Households | % Households |
| Dial-Up Internet | 0 | 0.0% |
| Broadband Home | 566 | 88.0% |
| Cellular Data Only | 64 | 10.0% |
| Satellite Internet | 0 | 0.0% |
| No Internet | 13 | 2.0% |
| Total | 643 | 100.0% |
Annandale Summary
Annandale, NJ is a small borough located in Hunterdon County, New Jersey. It is situated in the northwest corner of the state, about 40 miles west of New York City. The borough is bordered by Bethlehem Township to the north, Clinton Township to the east, Franklin Township to the south, and Lebanon Township to the west. Annandale has a total area of 1.3 square miles, all of which is land.
Geography
Annandale is located in the northwest corner of Hunterdon County, New Jersey. It is situated in the northwest corner of the state, about 40 miles west of New York City. The borough is bordered by Bethlehem Township to the north, Clinton Township to the east, Franklin Township to the south, and Lebanon Township to the west. Annandale has a total area of 1.3 square miles, all of which is land. The terrain is mostly flat, with some rolling hills in the northern part of the borough. The highest point in Annandale is located at the intersection of Route 519 and Route 604, where the elevation is approximately 500 feet above sea level.
The climate in Annandale is typical of the Northeastern United States, with cold winters and hot, humid summers. The average annual temperature is around 50°F, with an average high of around 70°F in the summer and an average low of around 30°F in the winter. The average annual precipitation is around 45 inches, with the majority of it falling in the form of rain.
Economy
Annandale has a small, but diverse economy. The borough is home to a variety of businesses, including retail stores, restaurants, professional services, and manufacturing. The largest employer in the borough is the Annandale Golf Club, which employs over 100 people. Other major employers include the Annandale Country Club, the Annandale Inn, and the Annandale Fire Company.
The borough also has a thriving agricultural sector, with several farms located in the area. The most common crops grown in Annandale are corn, soybeans, hay, and wheat. The borough also has a number of wineries and vineyards, which produce a variety of wines.
Demographics
As of the 2010 census, Annandale had a population of 2,845 people. The racial makeup of the borough was 94.3% White, 1.7% African American, 0.2% Native American, 1.2% Asian, 0.1% Pacific Islander, 1.2% from other races, and 1.5% from two or more races. Hispanic or Latino of any race were 4.2% of the population.
The median household income in Annandale was $76,250, and the median family income was $87,500. The per capita income for the borough was $35,945. About 4.2% of families and 5.2% of the population were below the poverty line, including 6.2% of those under age 18 and 4.2% of those age 65 or over.
Annandale is a small, but vibrant borough with a diverse economy and a rich history. The borough is home to a variety of businesses, farms, and wineries, and is a popular destination for tourists and outdoor enthusiasts. With its close proximity to New York City, Annandale is an ideal place to live, work, and play.
Common Questions
What is Per Capita Income in Annandale?
Per Capita income in Annandale is $57,016.
What is the Median Family Income in Annandale?
Median Family Income in Annandale is $142,024.
What is the Median Household income in Annandale?
Median Household Income in Annandale is $121,806.
What is Income or Wage Gap in Annandale?
Income or Wage Gap in Annandale is 33.3%.
Women in Annandale earn 66.7 cents for every dollar earned by a man.
What is Inequality or Gini Index in Annandale?
Inequality or Gini Index in Annandale is 0.40.
What is the Total Population of Annandale?
Total Population of Annandale is 1,853.
What is the Total Male Population of Annandale?
Total Male Population of Annandale is 841.
What is the Total Female Population of Annandale?
Total Female Population of Annandale is 1,012.
What is the Ratio of Males per 100 Females in Annandale?
There are 83.10 Males per 100 Females in Annandale.
What is the Ratio of Females per 100 Males in Annandale?
There are 120.33 Females per 100 Males in Annandale.
What is the Median Population Age in Annandale?
Median Population Age in Annandale is 33.1 Years.
What is the Average Family Size in Annandale
Average Family Size in Annandale is 3.5 People.
What is the Average Household Size in Annandale
Average Household Size in Annandale is 2.9 People.
How Large is the Labor Force in Annandale?
There are 1,050 People in the Labor Forcein in Annandale.
What is the Percentage of People in the Labor Force in Annandale?
69.8% of People are in the Labor Force in Annandale.
What is the Unemployment Rate in Annandale?
Unemployment Rate in Annandale is 12.0%.