Lame Deer, MT Map & Demographics
Lame Deer Map
Lame Deer Overview
$11,650
PER CAPITA INCOME
$36,167
AVG FAMILY INCOME
$31,250
AVG HOUSEHOLD INCOME
0.6%
WAGE / INCOME GAP [ % ]
99.4¢/ $1
WAGE / INCOME GAP [ $ ]
$17,099
FAMILY INCOME DEFICIT
0.48
INEQUALITY / GINI INDEX
2,064
TOTAL POPULATION
973
MALE POPULATION
1,091
FEMALE POPULATION
89.18
MALES / 100 FEMALES
112.13
FEMALES / 100 MALES
20.9
MEDIAN AGE
4.8
AVG FAMILY SIZE
4.2
AVG HOUSEHOLD SIZE
596
LABOR FORCE [ PEOPLE ]
47.1%
PERCENT IN LABOR FORCE
26.3%
UNEMPLOYMENT RATE
Lame Deer Zip Codes
Lame Deer Area Codes
Income in Lame Deer
Income Overview in Lame Deer
Per Capita Income in Lame Deer is $11,650, while median incomes of families and households are $36,167 and $31,250 respectively.
| Characteristic | Number | Measure |
| Per Capita Income | 2,064 | $11,650 |
| Median Family Income | 382 | $36,167 |
| Mean Family Income | 382 | $48,718 |
| Median Household Income | 484 | $31,250 |
| Mean Household Income | 484 | $46,357 |
| Income Deficit | 382 | $17,099 |
| Wage / Income Gap (%) | 2,064 | 0.62% |
| Wage / Income Gap ($) | 2,064 | 99.38¢ per $1 |
| Gini / Inequality Index | 2,064 | 0.48 |
Earnings by Sex in Lame Deer
Average Earnings in Lame Deer are $31,831, $31,767 for men and $31,964 for women, a difference of 0.6%.
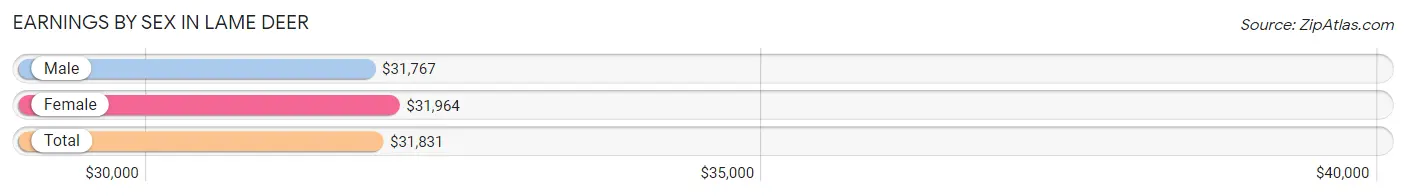
| Sex | Number | Average Earnings |
| Male | 249 (47.2%) | $31,767 |
| Female | 278 (52.7%) | $31,964 |
| Total | 527 (100.0%) | $31,831 |
Earnings by Sex by Income Bracket in Lame Deer
The most common earnings brackets in Lame Deer are $30,000 to $34,999 for men (54 | 21.7%) and $35,000 to $39,999 for women (44 | 15.8%).
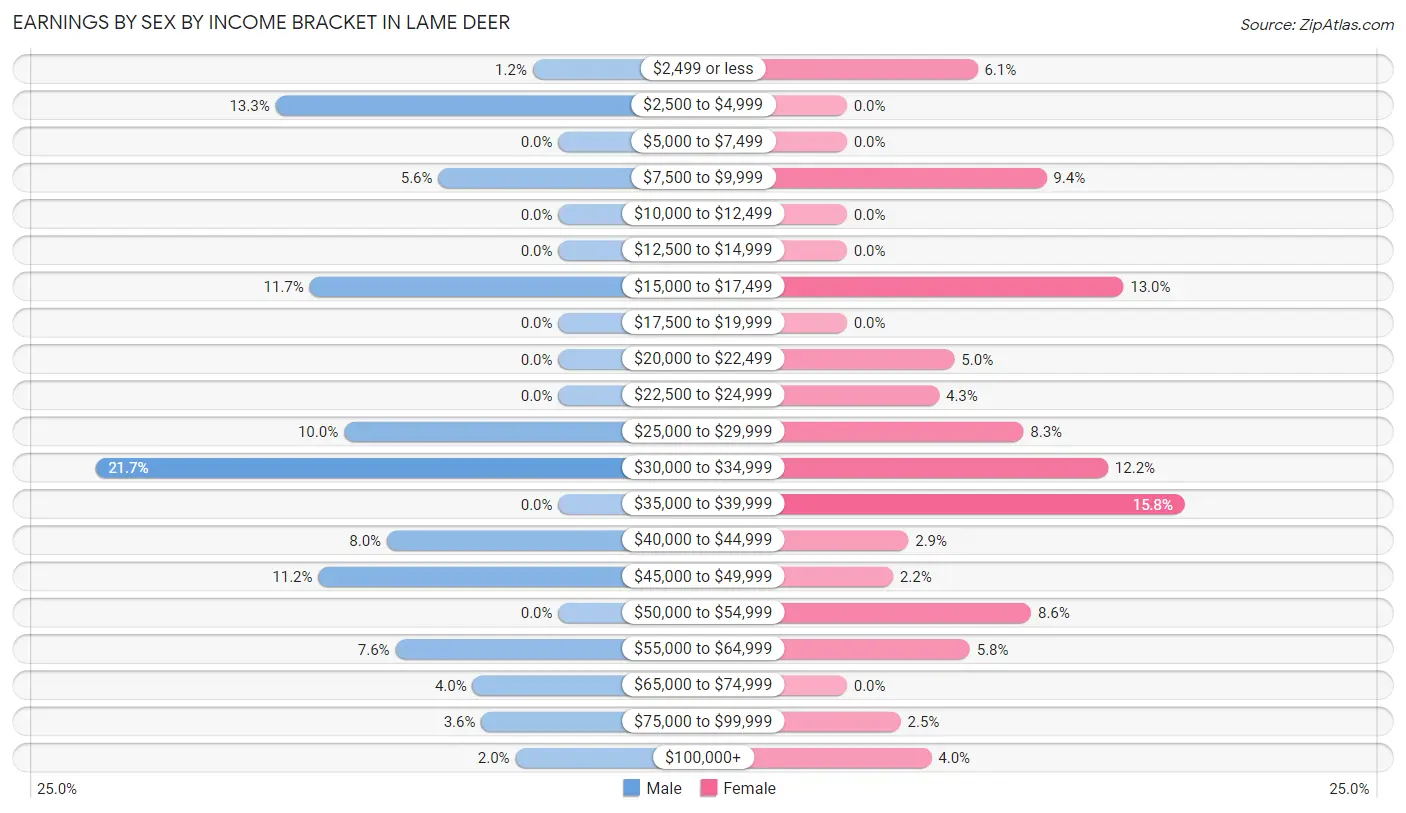
| Income | Male | Female |
| $2,499 or less | 3 (1.2%) | 17 (6.1%) |
| $2,500 to $4,999 | 33 (13.3%) | 0 (0.0%) |
| $5,000 to $7,499 | 0 (0.0%) | 0 (0.0%) |
| $7,500 to $9,999 | 14 (5.6%) | 26 (9.3%) |
| $10,000 to $12,499 | 0 (0.0%) | 0 (0.0%) |
| $12,500 to $14,999 | 0 (0.0%) | 0 (0.0%) |
| $15,000 to $17,499 | 29 (11.7%) | 36 (13.0%) |
| $17,500 to $19,999 | 0 (0.0%) | 0 (0.0%) |
| $20,000 to $22,499 | 0 (0.0%) | 14 (5.0%) |
| $22,500 to $24,999 | 0 (0.0%) | 12 (4.3%) |
| $25,000 to $29,999 | 25 (10.0%) | 23 (8.3%) |
| $30,000 to $34,999 | 54 (21.7%) | 34 (12.2%) |
| $35,000 to $39,999 | 0 (0.0%) | 44 (15.8%) |
| $40,000 to $44,999 | 20 (8.0%) | 8 (2.9%) |
| $45,000 to $49,999 | 28 (11.2%) | 6 (2.2%) |
| $50,000 to $54,999 | 0 (0.0%) | 24 (8.6%) |
| $55,000 to $64,999 | 19 (7.6%) | 16 (5.8%) |
| $65,000 to $74,999 | 10 (4.0%) | 0 (0.0%) |
| $75,000 to $99,999 | 9 (3.6%) | 7 (2.5%) |
| $100,000+ | 5 (2.0%) | 11 (4.0%) |
| Total | 249 (100.0%) | 278 (100.0%) |
Earnings by Sex by Educational Attainment in Lame Deer
Average earnings in Lame Deer are $40,536 for men and $34,313 for women, a difference of 15.3%. Men with an educational attainment of college or associate's degree enjoy the highest average annual earnings of $43,462, while those with high school diploma education earn the least with $25,938. Women with an educational attainment of bachelor's degree earn the most with the average annual earnings of $50,833, while those with college or associate's degree education have the smallest earnings of $28,696.
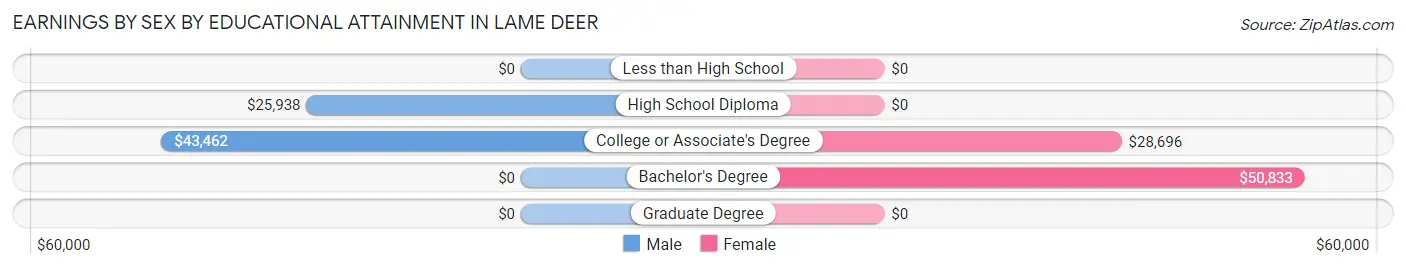
| Educational Attainment | Male Income | Female Income |
| Less than High School | - | - |
| High School Diploma | $25,938 | $0 |
| College or Associate's Degree | $43,462 | $28,696 |
| Bachelor's Degree | - | - |
| Graduate Degree | - | - |
| Total | $40,536 | $34,313 |
Family Income in Lame Deer
Family Income Brackets in Lame Deer
According to the Lame Deer family income data, there are 69 families falling into the $25,000 to $34,999 income range, which is the most common income bracket and makes up 18.1% of all families. Conversely, the $200,000+ income bracket is the least frequent group with only 3 families (0.8%) belonging to this category.
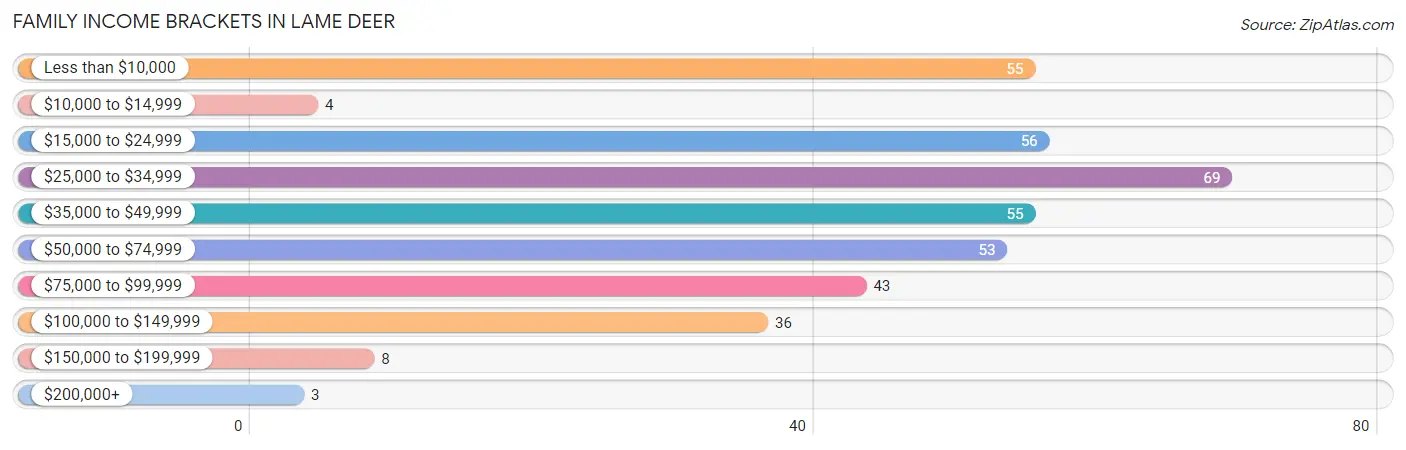
| Income Bracket | # Families | % Families |
| Less than $10,000 | 55 | 14.4% |
| $10,000 to $14,999 | 4 | 1.0% |
| $15,000 to $24,999 | 56 | 14.7% |
| $25,000 to $34,999 | 69 | 18.1% |
| $35,000 to $49,999 | 55 | 14.4% |
| $50,000 to $74,999 | 53 | 13.9% |
| $75,000 to $99,999 | 43 | 11.3% |
| $100,000 to $149,999 | 36 | 9.4% |
| $150,000 to $199,999 | 8 | 2.1% |
| $200,000+ | 3 | 0.8% |
Family Income by Famaliy Size in Lame Deer
6-person families (31 | 8.1%) account for the highest median family income in Lame Deer with $93,194 per family, while 2-person families (76 | 19.9%) have the highest median income of $35,703 per family member.
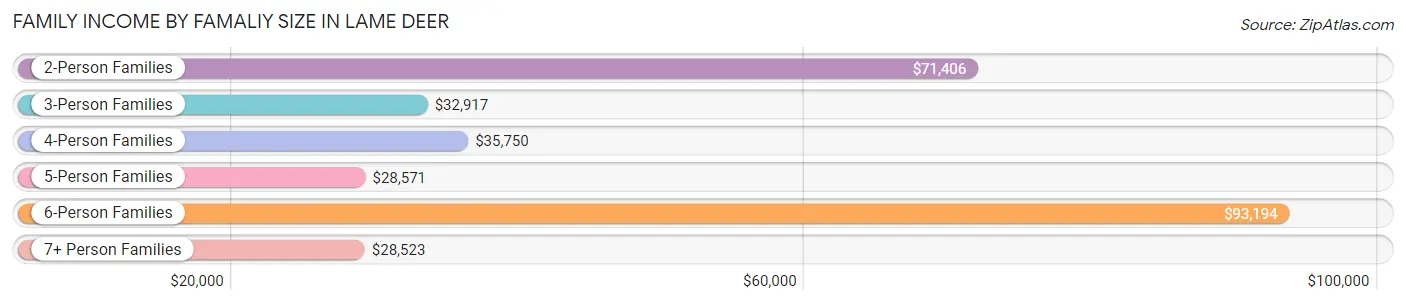
| Income Bracket | # Families | Median Income |
| 2-Person Families | 76 (19.9%) | $71,406 |
| 3-Person Families | 99 (25.9%) | $32,917 |
| 4-Person Families | 47 (12.3%) | $35,750 |
| 5-Person Families | 72 (18.9%) | $28,571 |
| 6-Person Families | 31 (8.1%) | $93,194 |
| 7+ Person Families | 57 (14.9%) | $28,523 |
| Total | 382 (100.0%) | $36,167 |
Family Income by Number of Earners in Lame Deer
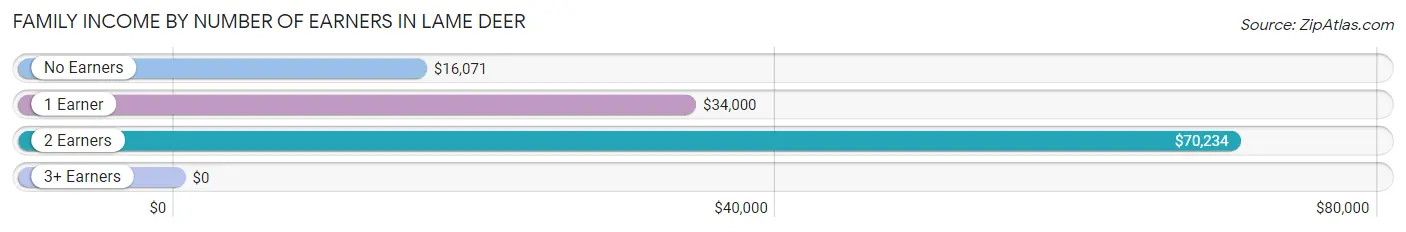
| Number of Earners | # Families | Median Income |
| No Earners | 118 (30.9%) | $16,071 |
| 1 Earner | 150 (39.3%) | $34,000 |
| 2 Earners | 99 (25.9%) | $70,234 |
| 3+ Earners | 15 (3.9%) | $0 |
| Total | 382 (100.0%) | $36,167 |
Household Income in Lame Deer
Household Income Brackets in Lame Deer
With 87 households falling in the category, the less than $10,000 income range is the most frequent in Lame Deer, accounting for 18.0% of all households. In contrast, only 3 households (0.6%) fall into the $200,000+ income bracket, making it the least populous group.
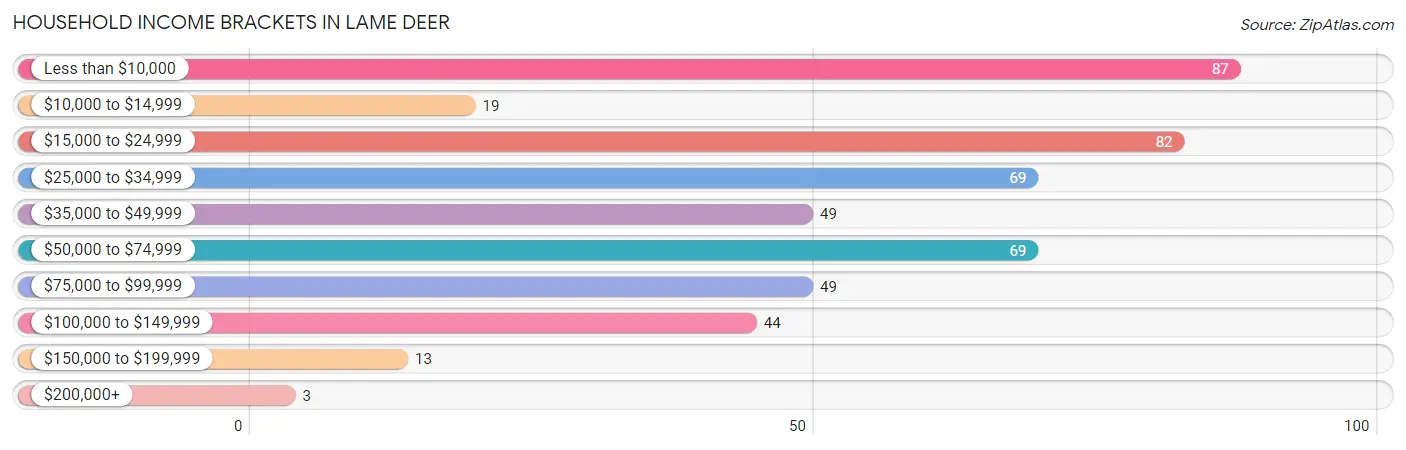
| Income Bracket | # Households | % Households |
| Less than $10,000 | 87 | 18.0% |
| $10,000 to $14,999 | 19 | 3.9% |
| $15,000 to $24,999 | 82 | 16.9% |
| $25,000 to $34,999 | 69 | 14.3% |
| $35,000 to $49,999 | 49 | 10.1% |
| $50,000 to $74,999 | 69 | 14.3% |
| $75,000 to $99,999 | 49 | 10.1% |
| $100,000 to $149,999 | 44 | 9.1% |
| $150,000 to $199,999 | 13 | 2.7% |
| $200,000+ | 3 | 0.6% |
Household Income by Householder Age in Lame Deer
The median household income in Lame Deer is $31,250, with the highest median household income of $56,719 found in the 25 to 44 years age bracket for the primary householder. A total of 133 households (27.5%) fall into this category. Meanwhile, the 15 to 24 years age bracket for the primary householder has the lowest median household income of $0, with 25 households (5.2%) in this group.
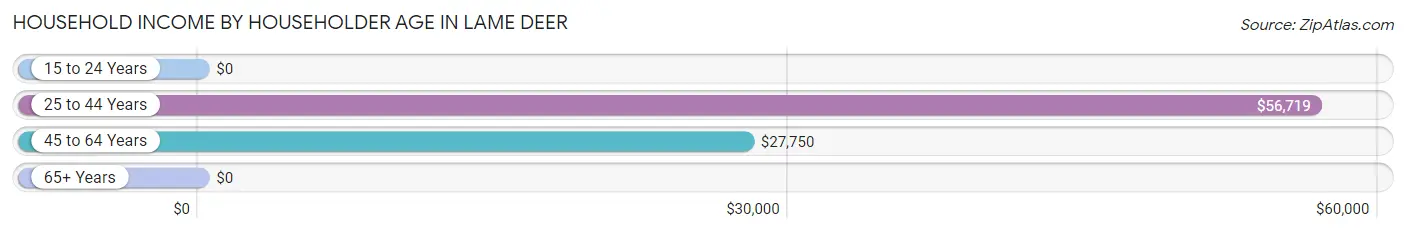
| Income Bracket | # Households | Median Income |
| 15 to 24 Years | 25 (5.2%) | $0 |
| 25 to 44 Years | 133 (27.5%) | $56,719 |
| 45 to 64 Years | 205 (42.4%) | $27,750 |
| 65+ Years | 121 (25.0%) | $0 |
| Total | 484 (100.0%) | $31,250 |
Poverty in Lame Deer
Income Below Poverty by Sex and Age in Lame Deer
With 46.9% poverty level for males and 48.1% for females among the residents of Lame Deer, under 5 year old males and 5 year old females are the most vulnerable to poverty, with 60 males (100.0%) and 67 females (100.0%) in their respective age groups living below the poverty level.
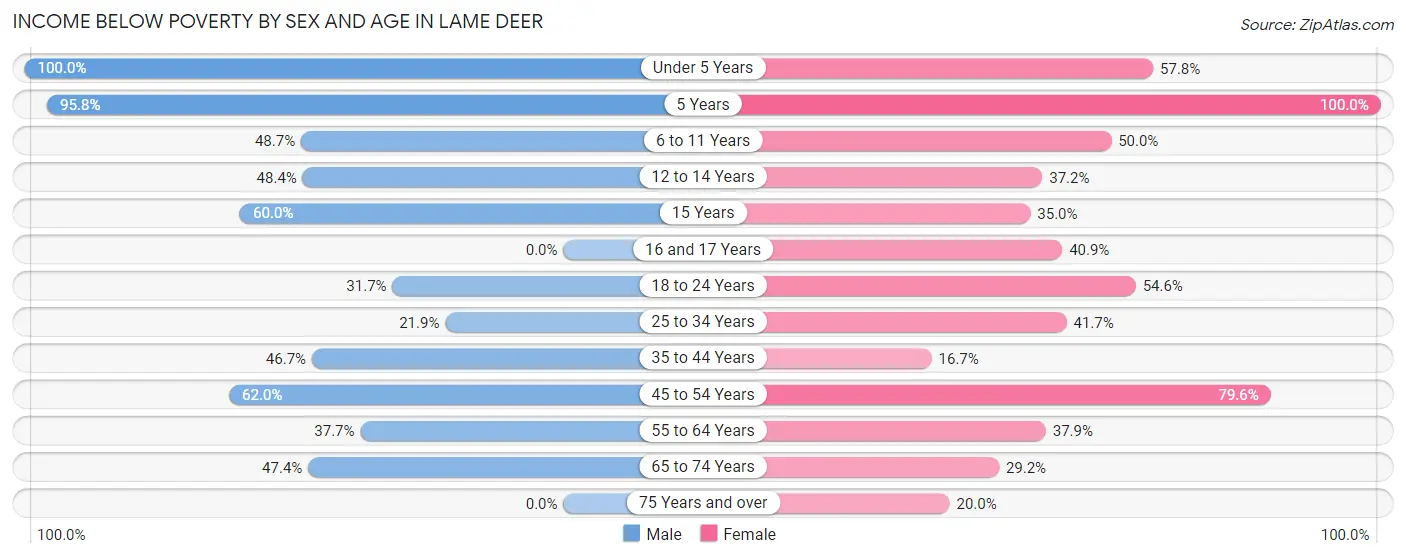
| Age Bracket | Male | Female |
| Under 5 Years | 60 (100.0%) | 89 (57.8%) |
| 5 Years | 46 (95.8%) | 67 (100.0%) |
| 6 to 11 Years | 56 (48.7%) | 66 (50.0%) |
| 12 to 14 Years | 30 (48.4%) | 16 (37.2%) |
| 15 Years | 24 (60.0%) | 14 (35.0%) |
| 16 and 17 Years | 0 (0.0%) | 18 (40.9%) |
| 18 to 24 Years | 66 (31.7%) | 72 (54.5%) |
| 25 to 34 Years | 16 (21.9%) | 63 (41.7%) |
| 35 to 44 Years | 42 (46.7%) | 15 (16.7%) |
| 45 to 54 Years | 49 (62.0%) | 39 (79.6%) |
| 55 to 64 Years | 26 (37.7%) | 39 (37.9%) |
| 65 to 74 Years | 27 (47.4%) | 14 (29.2%) |
| 75 Years and over | 0 (0.0%) | 4 (20.0%) |
| Total | 442 (46.9%) | 516 (48.1%) |
Income Above Poverty by Sex and Age in Lame Deer
According to the poverty statistics in Lame Deer, males aged 16 and 17 years and females aged 35 to 44 years are the age groups that are most secure financially, with 100.0% of males and 83.3% of females in these age groups living above the poverty line.
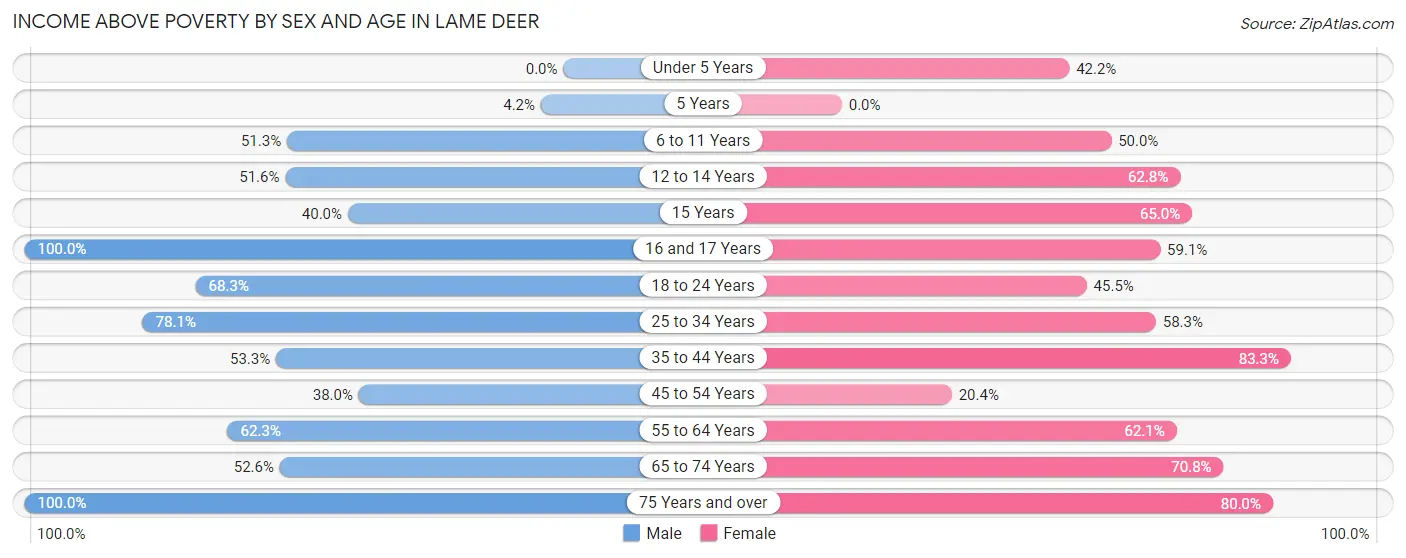
| Age Bracket | Male | Female |
| Under 5 Years | 0 (0.0%) | 65 (42.2%) |
| 5 Years | 2 (4.2%) | 0 (0.0%) |
| 6 to 11 Years | 59 (51.3%) | 66 (50.0%) |
| 12 to 14 Years | 32 (51.6%) | 27 (62.8%) |
| 15 Years | 16 (40.0%) | 26 (65.0%) |
| 16 and 17 Years | 41 (100.0%) | 26 (59.1%) |
| 18 to 24 Years | 142 (68.3%) | 60 (45.5%) |
| 25 to 34 Years | 57 (78.1%) | 88 (58.3%) |
| 35 to 44 Years | 48 (53.3%) | 75 (83.3%) |
| 45 to 54 Years | 30 (38.0%) | 10 (20.4%) |
| 55 to 64 Years | 43 (62.3%) | 64 (62.1%) |
| 65 to 74 Years | 30 (52.6%) | 34 (70.8%) |
| 75 Years and over | 1 (100.0%) | 16 (80.0%) |
| Total | 501 (53.1%) | 557 (51.9%) |
Income Below Poverty Among Married-Couple Families in Lame Deer
The poverty statistics for married-couple families in Lame Deer show that 36.9% or 58 of the total 157 families live below the poverty line. Families with 5 or more children have the highest poverty rate of 100.0%, comprising of 14 families. On the other hand, families with 1 or 2 children have the lowest poverty rate of 0.0%, which includes 0 families.
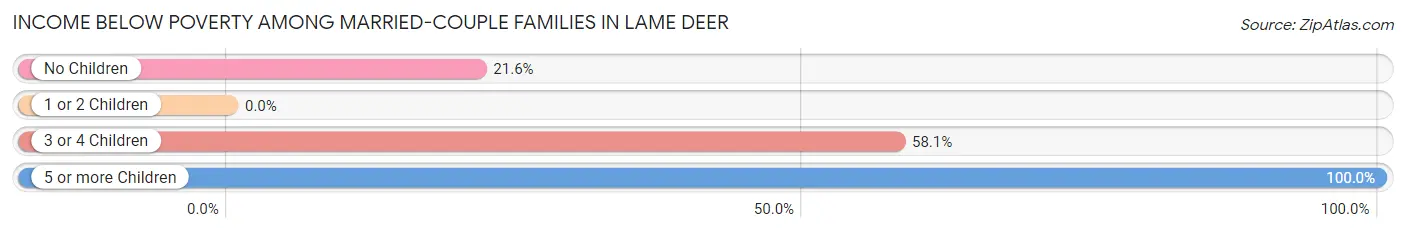
| Children | Above Poverty | Below Poverty |
| No Children | 29 (78.4%) | 8 (21.6%) |
| 1 or 2 Children | 44 (100.0%) | 0 (0.0%) |
| 3 or 4 Children | 26 (41.9%) | 36 (58.1%) |
| 5 or more Children | 0 (0.0%) | 14 (100.0%) |
| Total | 99 (63.1%) | 58 (36.9%) |
Income Below Poverty Among Single-Parent Households in Lame Deer
According to the poverty data in Lame Deer, 21.6% or 16 single-father households and 48.3% or 73 single-mother households are living below the poverty line. Among single-father households, those with no children have the highest poverty rate, with 13 households (33.3%) experiencing poverty. Likewise, among single-mother households, those with 5 or more children have the highest poverty rate, with 11 households (100.0%) falling below the poverty line.
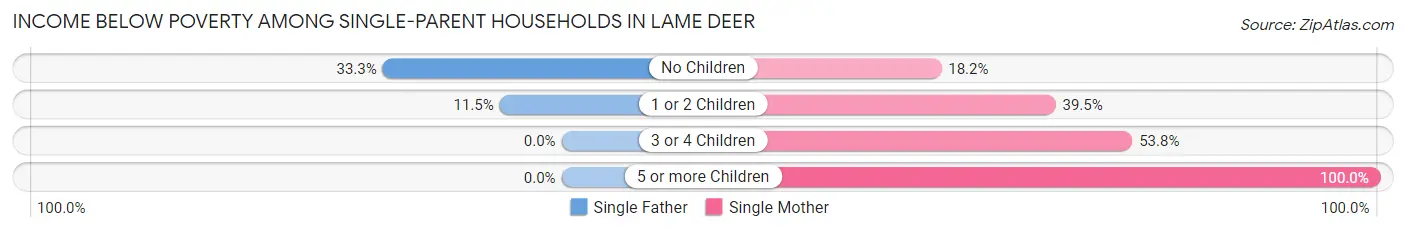
| Children | Single Father | Single Mother |
| No Children | 13 (33.3%) | 4 (18.2%) |
| 1 or 2 Children | 3 (11.5%) | 15 (39.5%) |
| 3 or 4 Children | 0 (0.0%) | 43 (53.7%) |
| 5 or more Children | 0 (0.0%) | 11 (100.0%) |
| Total | 16 (21.6%) | 73 (48.3%) |
Income Below Poverty Among Married-Couple vs Single-Parent Households in Lame Deer
The poverty data for Lame Deer shows that 58 of the married-couple family households (36.9%) and 89 of the single-parent households (39.6%) are living below the poverty level. Within the married-couple family households, those with 5 or more children have the highest poverty rate, with 14 households (100.0%) falling below the poverty line. Among the single-parent households, those with 5 or more children have the highest poverty rate, with 11 household (55.0%) living below poverty.
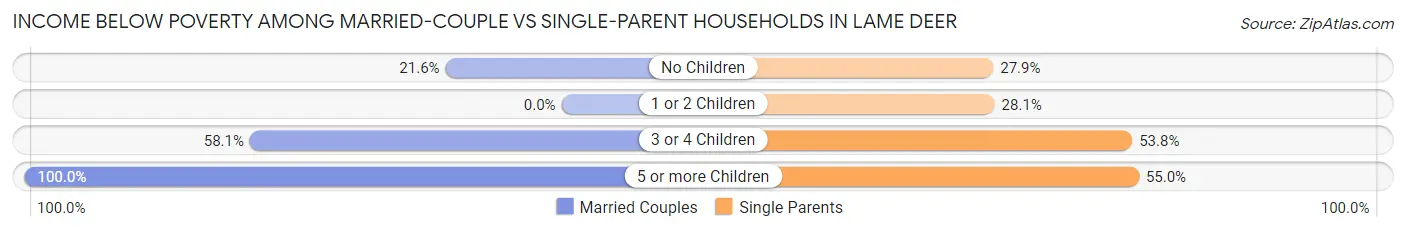
| Children | Married-Couple Families | Single-Parent Households |
| No Children | 8 (21.6%) | 17 (27.9%) |
| 1 or 2 Children | 0 (0.0%) | 18 (28.1%) |
| 3 or 4 Children | 36 (58.1%) | 43 (53.7%) |
| 5 or more Children | 14 (100.0%) | 11 (55.0%) |
| Total | 58 (36.9%) | 89 (39.6%) |
Race in Lame Deer
The most populous races in Lame Deer are Native / Alaskan (1,968 | 95.4%), White / Caucasian (46 | 2.2%), and Two or more Races (40 | 1.9%).
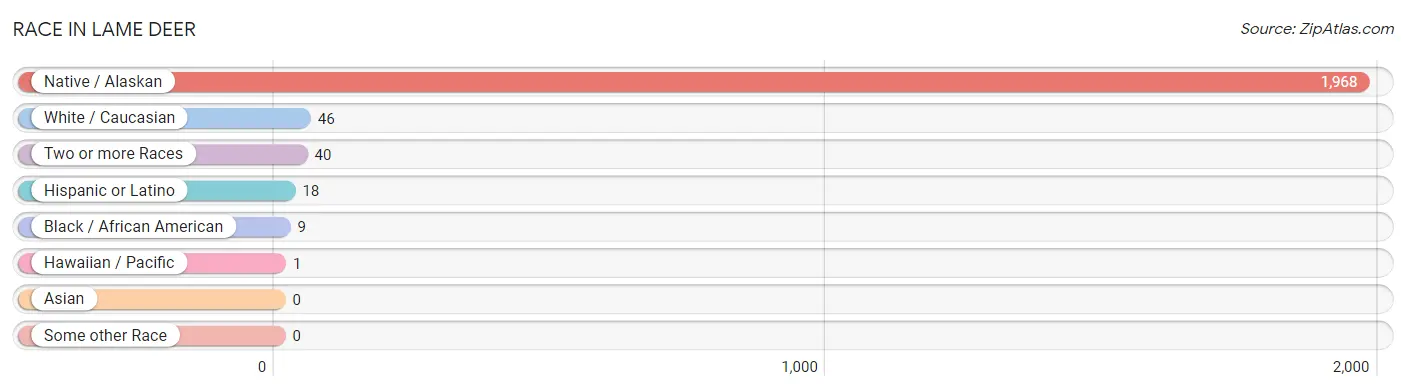
| Race | # Population | % Population |
| Asian | 0 | 0.0% |
| Black / African American | 9 | 0.4% |
| Hawaiian / Pacific | 1 | 0.1% |
| Hispanic or Latino | 18 | 0.9% |
| Native / Alaskan | 1,968 | 95.4% |
| White / Caucasian | 46 | 2.2% |
| Two or more Races | 40 | 1.9% |
| Some other Race | 0 | 0.0% |
| Total | 2,064 | 100.0% |
Ancestry in Lame Deer
The most populous ancestries reported in Lame Deer are Cheyenne (1,387 | 67.2%), Crow (195 | 9.5%), Irish (37 | 1.8%), German (33 | 1.6%), and Arapaho (27 | 1.3%), together accounting for 81.4% of all Lame Deer residents.
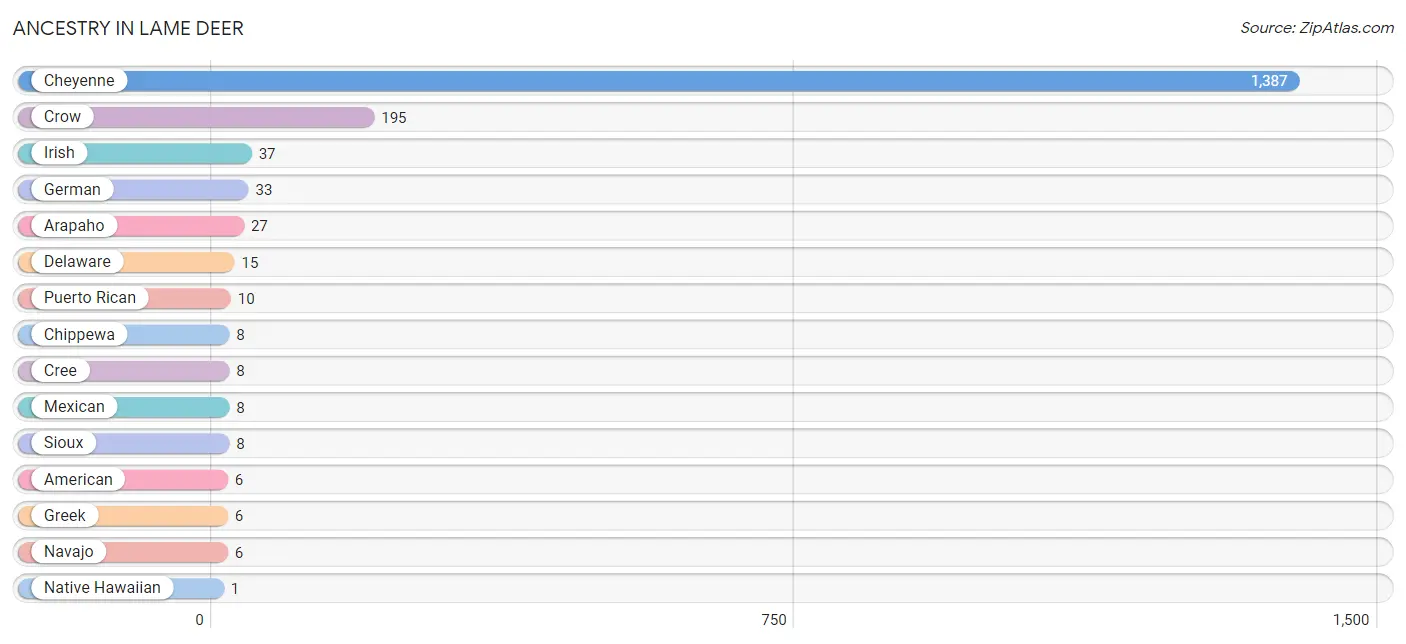
| Ancestry | # Population | % Population |
| American | 6 | 0.3% |
| Arapaho | 27 | 1.3% |
| Cheyenne | 1,387 | 67.2% |
| Chippewa | 8 | 0.4% |
| Cree | 8 | 0.4% |
| Crow | 195 | 9.5% |
| Delaware | 15 | 0.7% |
| German | 33 | 1.6% |
| Greek | 6 | 0.3% |
| Irish | 37 | 1.8% |
| Mexican | 8 | 0.4% |
| Native Hawaiian | 1 | 0.1% |
| Navajo | 6 | 0.3% |
| Northern European | 1 | 0.1% |
| Puerto Rican | 10 | 0.5% |
| Sioux | 8 | 0.4% | View All 16 Rows |
Immigrants in Lame Deer

| Immigration Origin | # Population | % Population | View All 0 Rows |
Sex and Age in Lame Deer
Sex and Age in Lame Deer
The most populous age groups in Lame Deer are 15 to 19 Years (164 | 16.9%) for men and Under 5 Years (154 | 14.1%) for women.
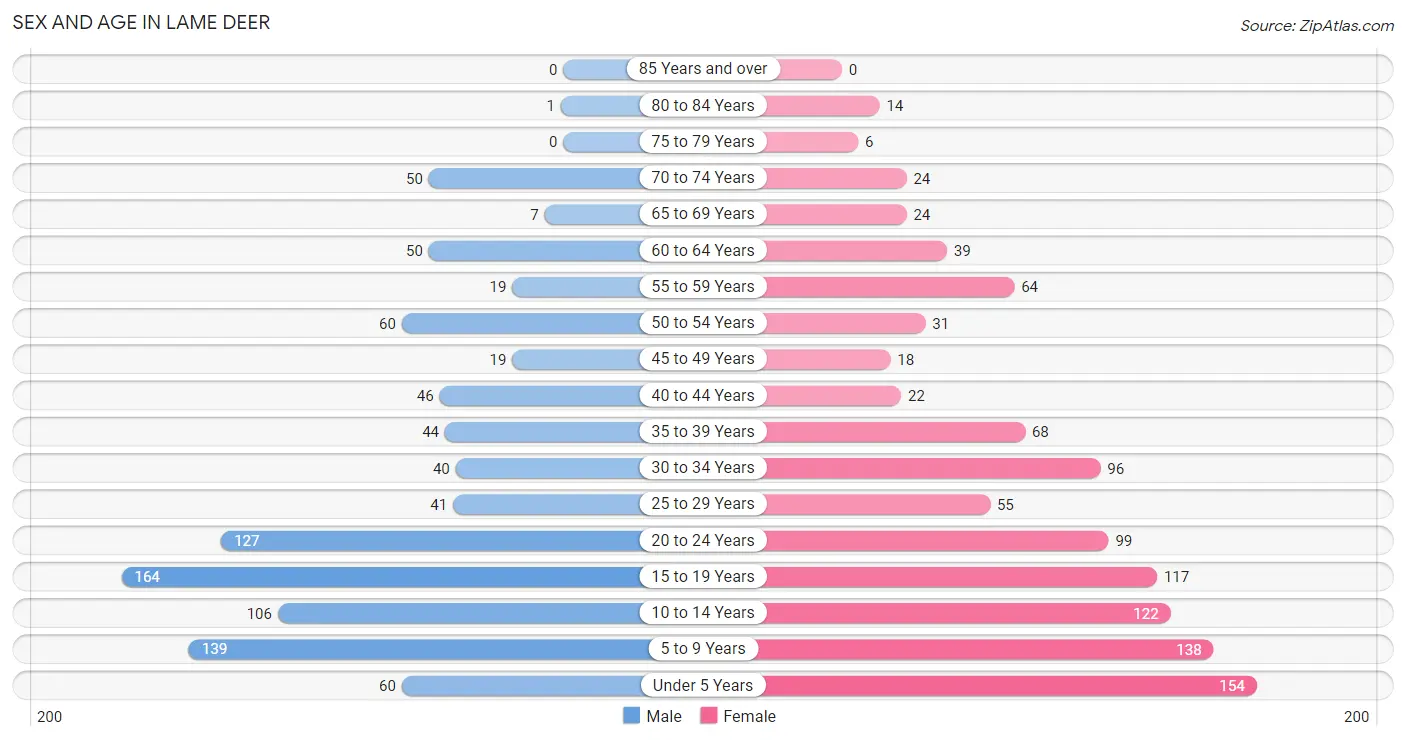
| Age Bracket | Male | Female |
| Under 5 Years | 60 (6.2%) | 154 (14.1%) |
| 5 to 9 Years | 139 (14.3%) | 138 (12.7%) |
| 10 to 14 Years | 106 (10.9%) | 122 (11.2%) |
| 15 to 19 Years | 164 (16.9%) | 117 (10.7%) |
| 20 to 24 Years | 127 (13.1%) | 99 (9.1%) |
| 25 to 29 Years | 41 (4.2%) | 55 (5.0%) |
| 30 to 34 Years | 40 (4.1%) | 96 (8.8%) |
| 35 to 39 Years | 44 (4.5%) | 68 (6.2%) |
| 40 to 44 Years | 46 (4.7%) | 22 (2.0%) |
| 45 to 49 Years | 19 (1.9%) | 18 (1.7%) |
| 50 to 54 Years | 60 (6.2%) | 31 (2.8%) |
| 55 to 59 Years | 19 (1.9%) | 64 (5.9%) |
| 60 to 64 Years | 50 (5.1%) | 39 (3.6%) |
| 65 to 69 Years | 7 (0.7%) | 24 (2.2%) |
| 70 to 74 Years | 50 (5.1%) | 24 (2.2%) |
| 75 to 79 Years | 0 (0.0%) | 6 (0.5%) |
| 80 to 84 Years | 1 (0.1%) | 14 (1.3%) |
| 85 Years and over | 0 (0.0%) | 0 (0.0%) |
| Total | 973 (100.0%) | 1,091 (100.0%) |
Families and Households in Lame Deer
Median Family Size in Lame Deer
The median family size in Lame Deer is 4.76 persons per family, with single female/mother families (151 | 39.5%) accounting for the largest median family size of 5.28 persons per family. On the other hand, single male/father families (74 | 19.4%) represent the smallest median family size with 3.32 persons per family.
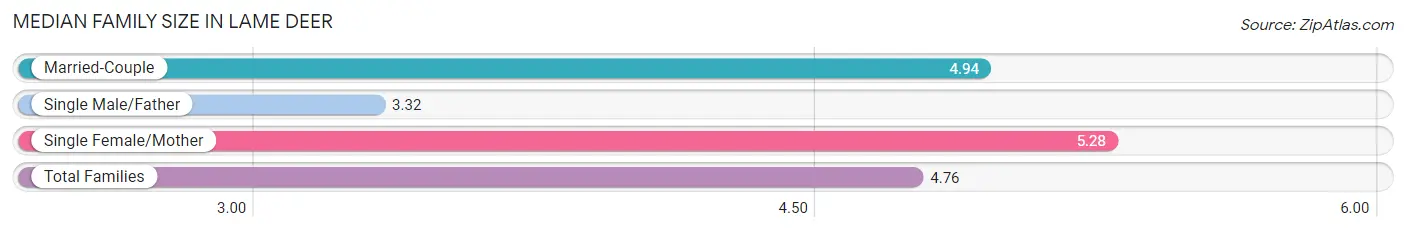
| Family Type | # Families | Family Size |
| Married-Couple | 157 (41.1%) | 4.94 |
| Single Male/Father | 74 (19.4%) | 3.32 |
| Single Female/Mother | 151 (39.5%) | 5.28 |
| Total Families | 382 (100.0%) | 4.76 |
Median Household Size in Lame Deer
The median household size in Lame Deer is 4.24 persons per household, with single female/mother households (151 | 31.2%) accounting for the largest median household size of 5.6 persons per household. non-family households (102 | 21.1%) represent the smallest median household size with 1.23 persons per household.
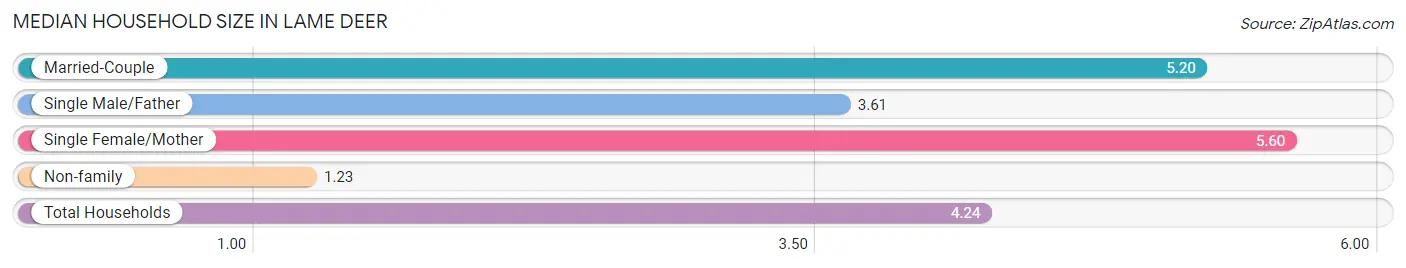
| Household Type | # Households | Household Size |
| Married-Couple | 157 (32.4%) | 5.20 |
| Single Male/Father | 74 (15.3%) | 3.61 |
| Single Female/Mother | 151 (31.2%) | 5.60 |
| Non-family | 102 (21.1%) | 1.23 |
| Total Households | 484 (100.0%) | 4.24 |
Household Size by Marriage Status in Lame Deer
Out of a total of 484 households in Lame Deer, 382 (78.9%) are family households, while 102 (21.1%) are nonfamily households. The most numerous type of family households are 2-person households, comprising 76, and the most common type of nonfamily households are 1-person households, comprising 87.
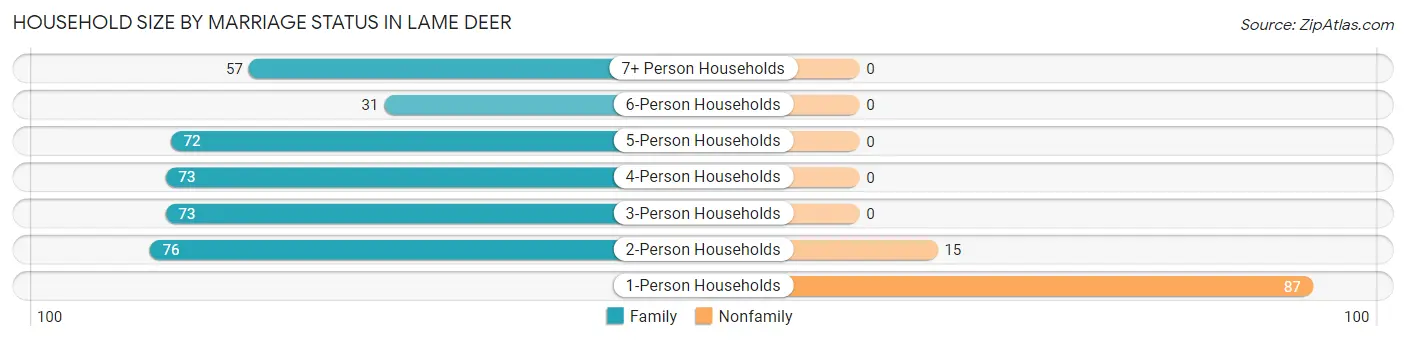
| Household Size | Family Households | Nonfamily Households |
| 1-Person Households | - | 87 (18.0%) |
| 2-Person Households | 76 (15.7%) | 15 (3.1%) |
| 3-Person Households | 73 (15.1%) | 0 (0.0%) |
| 4-Person Households | 73 (15.1%) | 0 (0.0%) |
| 5-Person Households | 72 (14.9%) | 0 (0.0%) |
| 6-Person Households | 31 (6.4%) | 0 (0.0%) |
| 7+ Person Households | 57 (11.8%) | 0 (0.0%) |
| Total | 382 (78.9%) | 102 (21.1%) |
Female Fertility in Lame Deer
Fertility by Age in Lame Deer
Average fertility rate in Lame Deer is 114.0 births per 1,000 women. Women in the age bracket of 15 to 19 years have the highest fertility rate with 197.0 births per 1,000 women. Women in the age bracket of 15 to 19 years acount for 42.6% of all women with births.
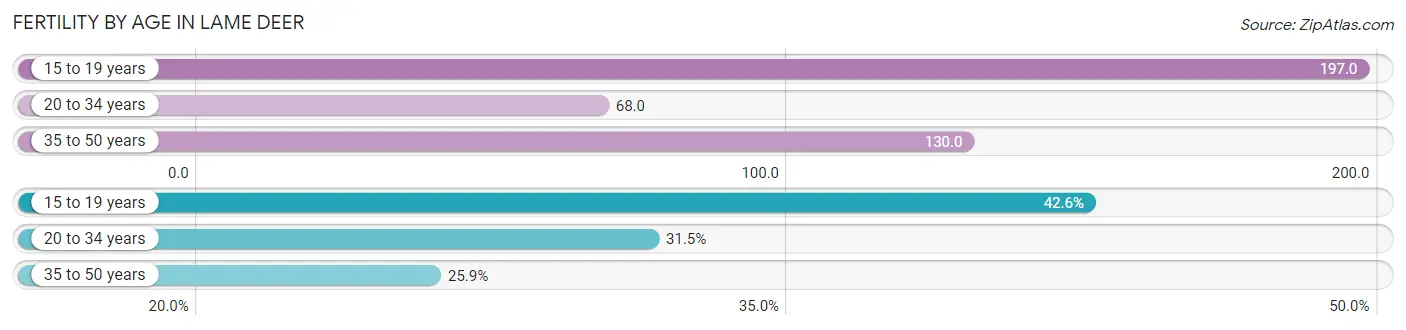
| Age Bracket | Women with Births | Births / 1,000 Women |
| 15 to 19 years | 23 (42.6%) | 197.0 |
| 20 to 34 years | 17 (31.5%) | 68.0 |
| 35 to 50 years | 14 (25.9%) | 130.0 |
| Total | 54 (100.0%) | 114.0 |
Fertility by Age by Marriage Status in Lame Deer
42.6% of women with births (54) in Lame Deer are married. The highest percentage of unmarried women with births falls into 20 to 34 years age bracket with 100.0% of them unmarried at the time of birth, while the lowest percentage of unmarried women with births belong to 15 to 19 years age bracket with 34.8% of them unmarried.
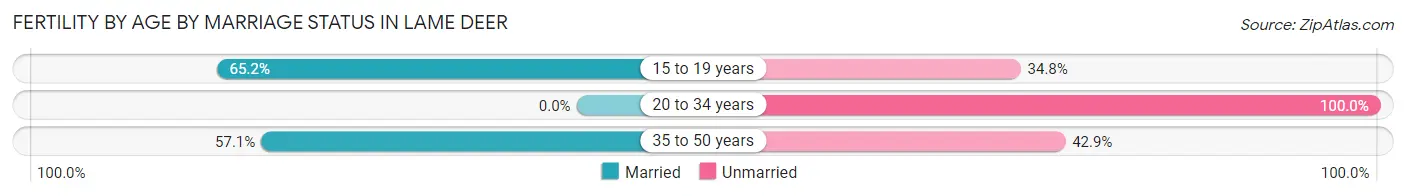
| Age Bracket | Married | Unmarried |
| 15 to 19 years | 15 (65.2%) | 8 (34.8%) |
| 20 to 34 years | 0 (0.0%) | 17 (100.0%) |
| 35 to 50 years | 8 (57.1%) | 6 (42.9%) |
| Total | 23 (42.6%) | 31 (57.4%) |
Fertility by Education in Lame Deer
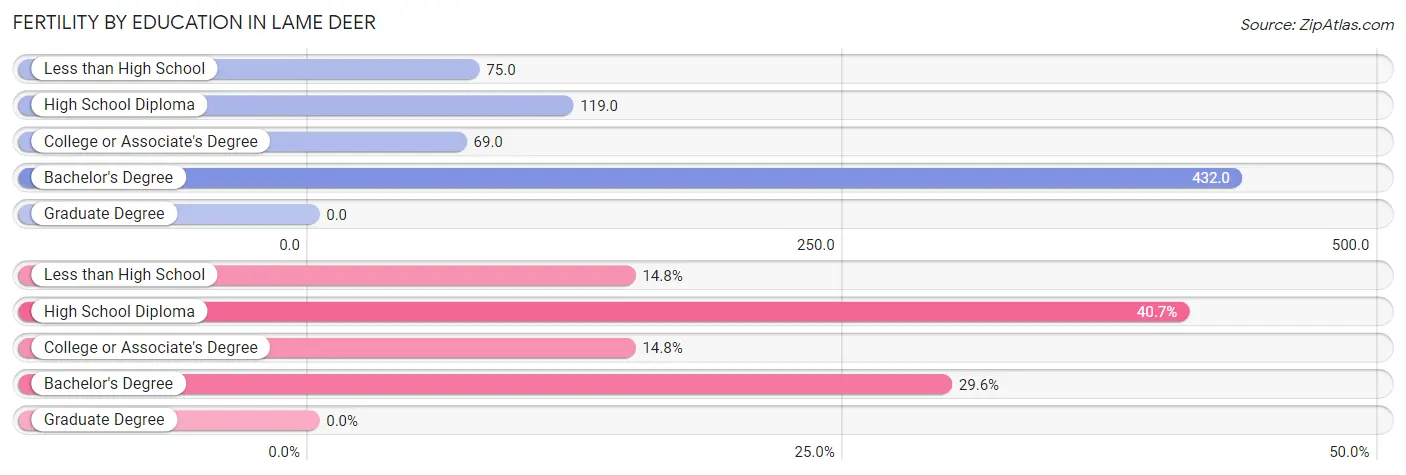
| Educational Attainment | Women with Births | Births / 1,000 Women |
| Less than High School | 8 (14.8%) | 75.0 |
| High School Diploma | 22 (40.7%) | 119.0 |
| College or Associate's Degree | 8 (14.8%) | 69.0 |
| Bachelor's Degree | 16 (29.6%) | 432.0 |
| Graduate Degree | 0 (0.0%) | 0.0 |
| Total | 54 (100.0%) | 114.0 |
Fertility by Education by Marriage Status in Lame Deer
57.4% of women with births in Lame Deer are unmarried. Women with the educational attainment of college or associate's degree are most likely to be married with 100.0% of them married at childbirth, while women with the educational attainment of less than high school are least likely to be married with 100.0% of them unmarried at childbirth.
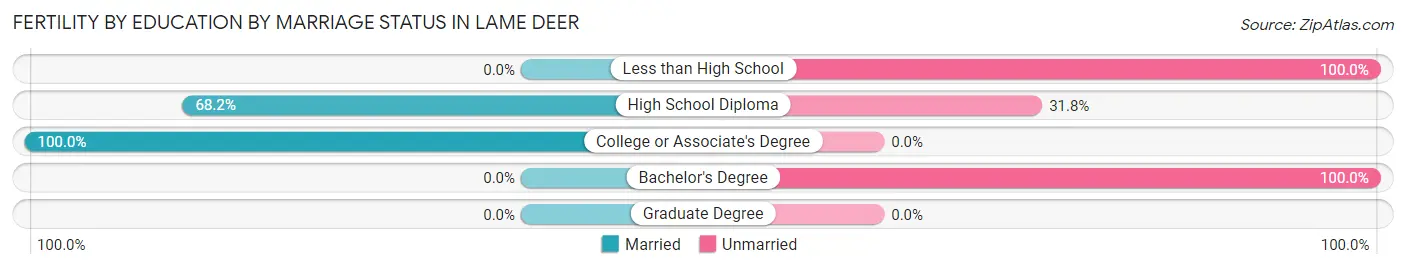
| Educational Attainment | Married | Unmarried |
| Less than High School | 0 (0.0%) | 8 (100.0%) |
| High School Diploma | 15 (68.2%) | 7 (31.8%) |
| College or Associate's Degree | 8 (100.0%) | 0 (0.0%) |
| Bachelor's Degree | 0 (0.0%) | 16 (100.0%) |
| Graduate Degree | 0 (0.0%) | 0 (0.0%) |
| Total | 23 (42.6%) | 31 (57.4%) |
Employment Characteristics in Lame Deer
Employment by Class of Employer in Lame Deer
Among the 442 employed individuals in Lame Deer, local government employees (156 | 35.3%), private company employees (125 | 28.3%), and federal government employees (74 | 16.7%) make up the most common classes of employment.
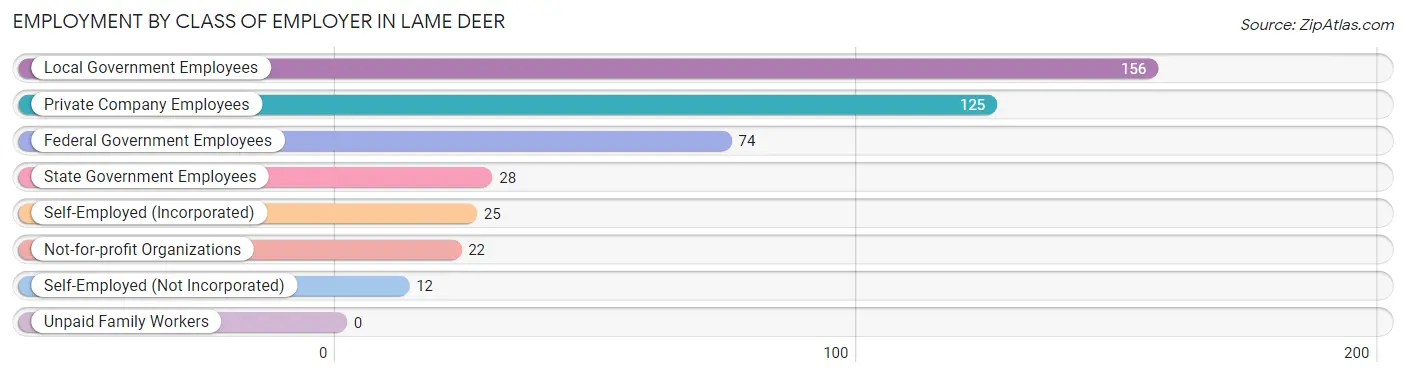
| Employer Class | # Employees | % Employees |
| Private Company Employees | 125 | 28.3% |
| Self-Employed (Incorporated) | 25 | 5.7% |
| Self-Employed (Not Incorporated) | 12 | 2.7% |
| Not-for-profit Organizations | 22 | 5.0% |
| Local Government Employees | 156 | 35.3% |
| State Government Employees | 28 | 6.3% |
| Federal Government Employees | 74 | 16.7% |
| Unpaid Family Workers | 0 | 0.0% |
| Total | 442 | 100.0% |
Employment Status by Age in Lame Deer
According to the labor force statistics for Lame Deer, out of the total population over 16 years of age (1,265), 47.1% or 596 individuals are in the labor force, with 26.3% or 157 of them unemployed. The age group with the highest labor force participation rate is 30 to 34 years, with 75.7% or 103 individuals in the labor force. Within the labor force, the 45 to 54 years age range has the highest percentage of unemployed individuals, with 63.9% or 46 of them being unemployed.
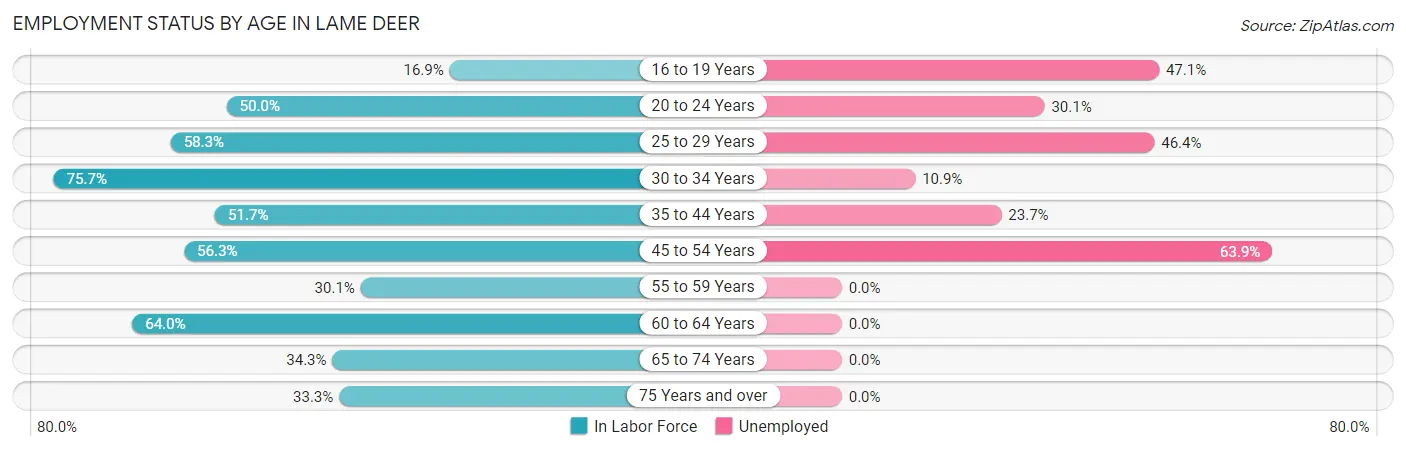
| Age Bracket | In Labor Force | Unemployed |
| 16 to 19 Years | 34 (16.9%) | 16 (47.1%) |
| 20 to 24 Years | 113 (50.0%) | 34 (30.1%) |
| 25 to 29 Years | 56 (58.3%) | 26 (46.4%) |
| 30 to 34 Years | 103 (75.7%) | 11 (10.9%) |
| 35 to 44 Years | 93 (51.7%) | 22 (23.7%) |
| 45 to 54 Years | 72 (56.3%) | 46 (63.9%) |
| 55 to 59 Years | 25 (30.1%) | 0 (0.0%) |
| 60 to 64 Years | 57 (64.0%) | 0 (0.0%) |
| 65 to 74 Years | 36 (34.3%) | 0 (0.0%) |
| 75 Years and over | 7 (33.3%) | 0 (0.0%) |
| Total | 596 (47.1%) | 157 (26.3%) |
Employment Status by Educational Attainment in Lame Deer
According to labor force statistics for Lame Deer, 57.0% of individuals (406) out of the total population between 25 and 64 years of age (712) are in the labor force, with 26.3% or 107 of them being unemployed. The group with the highest labor force participation rate are those with the educational attainment of bachelor's degree or higher, with 90.1% or 82 individuals in the labor force. Within the labor force, individuals with less than high school education have the highest percentage of unemployment, with 50.0% or 22 of them being unemployed.
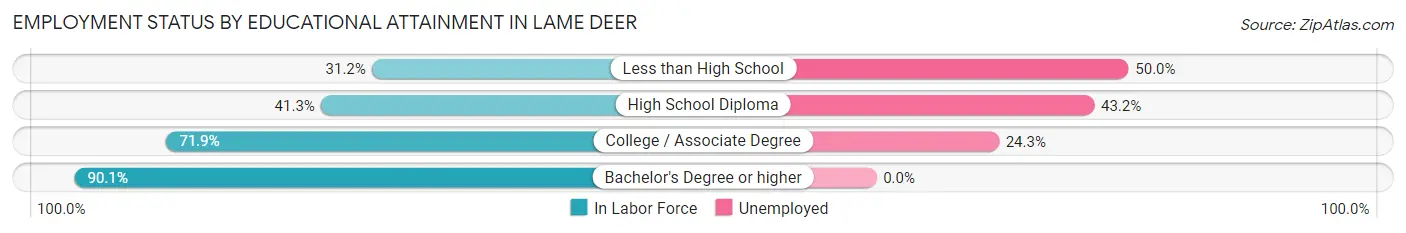
| Educational Attainment | In Labor Force | Unemployed |
| Less than High School | 44 (31.2%) | 70 (50.0%) |
| High School Diploma | 88 (41.3%) | 92 (43.2%) |
| College / Associate Degree | 192 (71.9%) | 65 (24.3%) |
| Bachelor's Degree or higher | 82 (90.1%) | 0 (0.0%) |
| Total | 406 (57.0%) | 187 (26.3%) |
Employment Occupations by Sex in Lame Deer
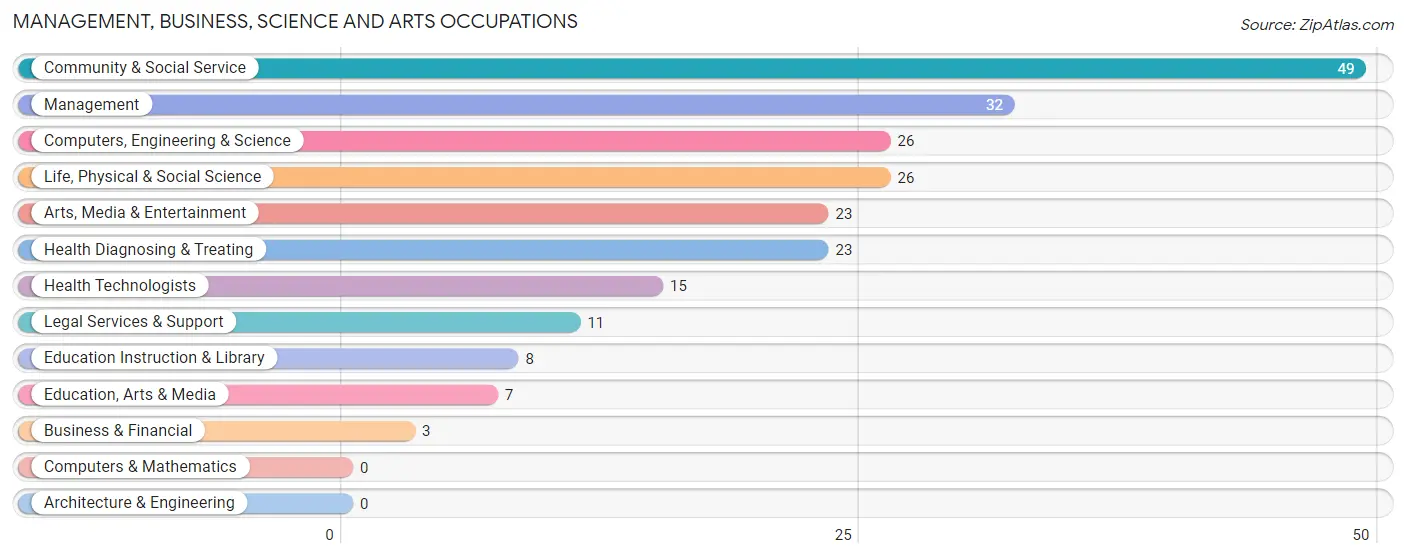
Management, Business, Science and Arts Occupations
The most common Management, Business, Science and Arts occupations in Lame Deer are Community & Social Service (49 | 11.4%), Management (32 | 7.4%), Computers, Engineering & Science (26 | 6.0%), Life, Physical & Social Science (26 | 6.0%), and Arts, Media & Entertainment (23 | 5.3%).
Management, Business, Science and Arts Occupations by Sex
Within the Management, Business, Science and Arts occupations in Lame Deer, the most male-oriented occupations are Education Instruction & Library (100.0%), Arts, Media & Entertainment (65.2%), and Health Diagnosing & Treating (56.5%), while the most female-oriented occupations are Business & Financial (100.0%), Legal Services & Support (100.0%), and Education, Arts & Media (85.7%).
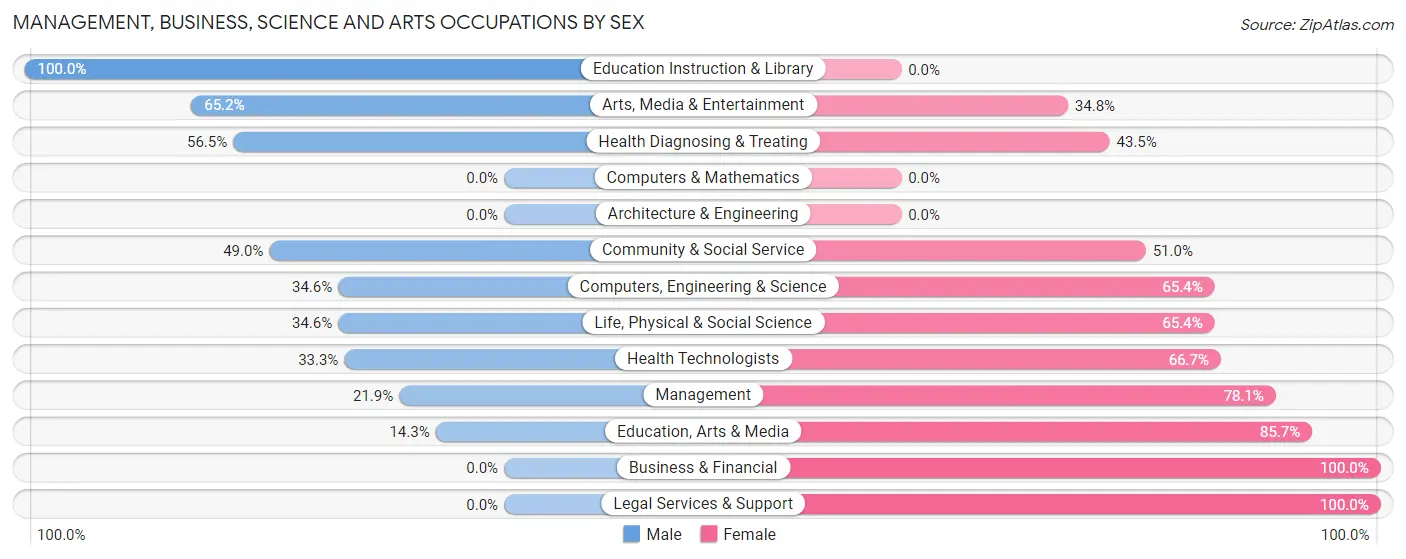
| Occupation | Male | Female |
| Management | 7 (21.9%) | 25 (78.1%) |
| Business & Financial | 0 (0.0%) | 3 (100.0%) |
| Computers, Engineering & Science | 9 (34.6%) | 17 (65.4%) |
| Computers & Mathematics | 0 (0.0%) | 0 (0.0%) |
| Architecture & Engineering | 0 (0.0%) | 0 (0.0%) |
| Life, Physical & Social Science | 9 (34.6%) | 17 (65.4%) |
| Community & Social Service | 24 (49.0%) | 25 (51.0%) |
| Education, Arts & Media | 1 (14.3%) | 6 (85.7%) |
| Legal Services & Support | 0 (0.0%) | 11 (100.0%) |
| Education Instruction & Library | 8 (100.0%) | 0 (0.0%) |
| Arts, Media & Entertainment | 15 (65.2%) | 8 (34.8%) |
| Health Diagnosing & Treating | 13 (56.5%) | 10 (43.5%) |
| Health Technologists | 5 (33.3%) | 10 (66.7%) |
| Total (Category) | 53 (39.9%) | 80 (60.2%) |
| Total (Overall) | 186 (43.2%) | 245 (56.8%) |
Services Occupations
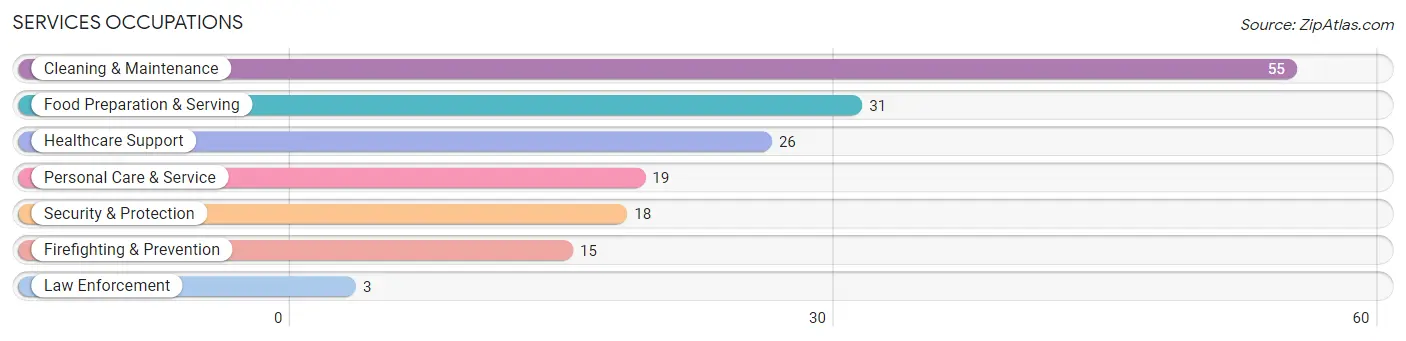
The most common Services occupations in Lame Deer are Cleaning & Maintenance (55 | 12.8%), Food Preparation & Serving (31 | 7.2%), Healthcare Support (26 | 6.0%), Personal Care & Service (19 | 4.4%), and Security & Protection (18 | 4.2%).
Services Occupations by Sex
Within the Services occupations in Lame Deer, the most male-oriented occupations are Firefighting & Prevention (100.0%), Security & Protection (83.3%), and Cleaning & Maintenance (72.7%), while the most female-oriented occupations are Healthcare Support (100.0%), Law Enforcement (100.0%), and Food Preparation & Serving (100.0%).
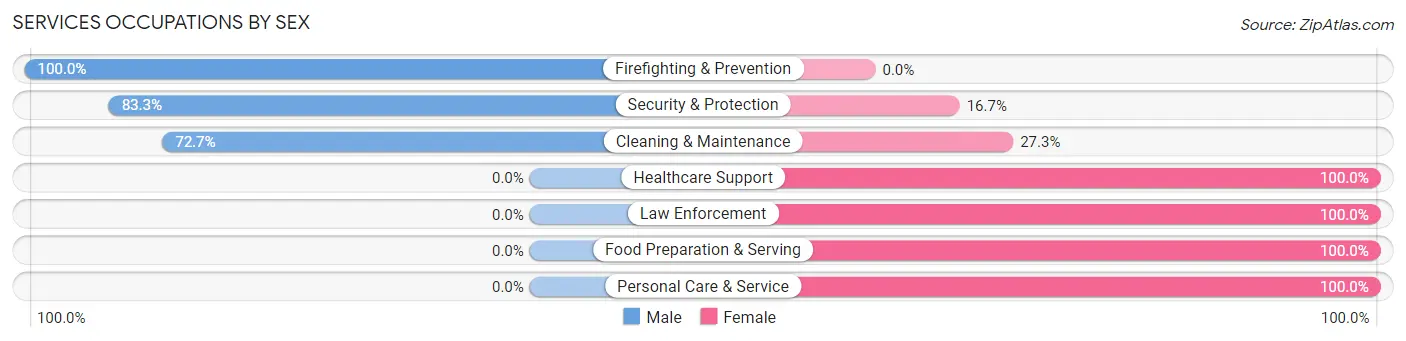
| Occupation | Male | Female |
| Healthcare Support | 0 (0.0%) | 26 (100.0%) |
| Security & Protection | 15 (83.3%) | 3 (16.7%) |
| Firefighting & Prevention | 15 (100.0%) | 0 (0.0%) |
| Law Enforcement | 0 (0.0%) | 3 (100.0%) |
| Food Preparation & Serving | 0 (0.0%) | 31 (100.0%) |
| Cleaning & Maintenance | 40 (72.7%) | 15 (27.3%) |
| Personal Care & Service | 0 (0.0%) | 19 (100.0%) |
| Total (Category) | 55 (36.9%) | 94 (63.1%) |
| Total (Overall) | 186 (43.2%) | 245 (56.8%) |
Sales and Office Occupations
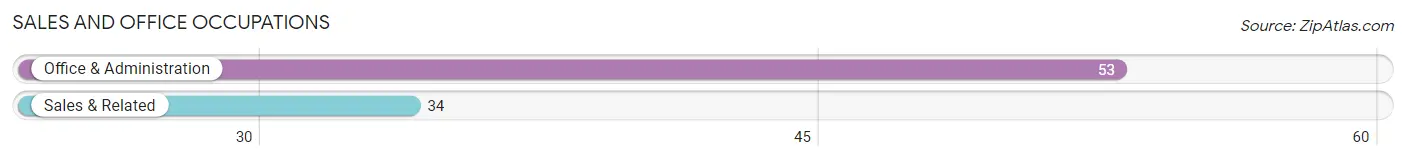
The most common Sales and Office occupations in Lame Deer are Office & Administration (53 | 12.3%), and Sales & Related (34 | 7.9%).
Sales and Office Occupations by Sex
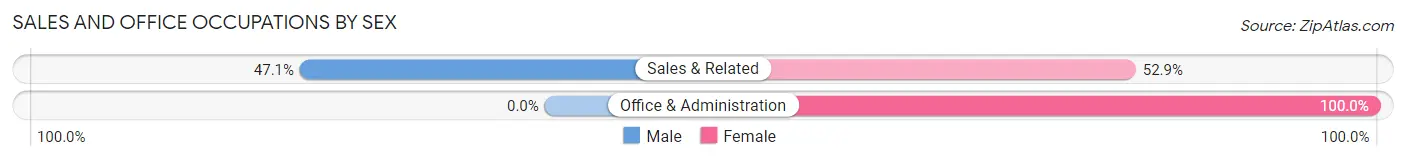
| Occupation | Male | Female |
| Sales & Related | 16 (47.1%) | 18 (52.9%) |
| Office & Administration | 0 (0.0%) | 53 (100.0%) |
| Total (Category) | 16 (18.4%) | 71 (81.6%) |
| Total (Overall) | 186 (43.2%) | 245 (56.8%) |
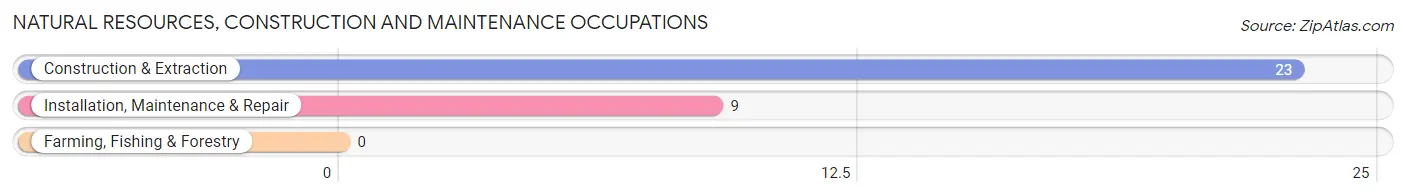
Natural Resources, Construction and Maintenance Occupations
The most common Natural Resources, Construction and Maintenance occupations in Lame Deer are Construction & Extraction (23 | 5.3%), and Installation, Maintenance & Repair (9 | 2.1%).
Natural Resources, Construction and Maintenance Occupations by Sex
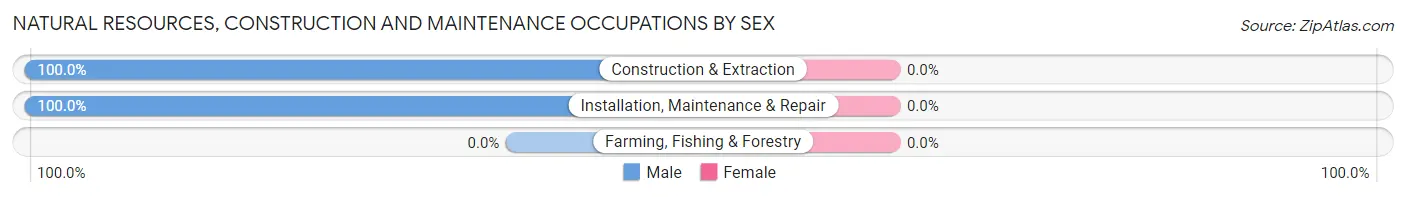
| Occupation | Male | Female |
| Farming, Fishing & Forestry | 0 (0.0%) | 0 (0.0%) |
| Construction & Extraction | 23 (100.0%) | 0 (0.0%) |
| Installation, Maintenance & Repair | 9 (100.0%) | 0 (0.0%) |
| Total (Category) | 32 (100.0%) | 0 (0.0%) |
| Total (Overall) | 186 (43.2%) | 245 (56.8%) |
Production, Transportation and Moving Occupations
The most common Production, Transportation and Moving occupations in Lame Deer are Transportation (23 | 5.3%), and Production (7 | 1.6%).
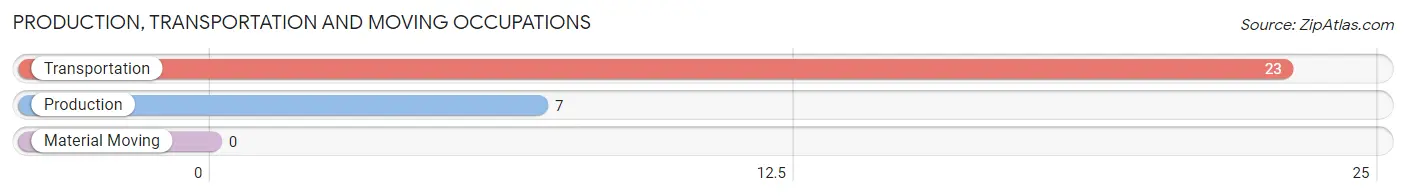
Production, Transportation and Moving Occupations by Sex
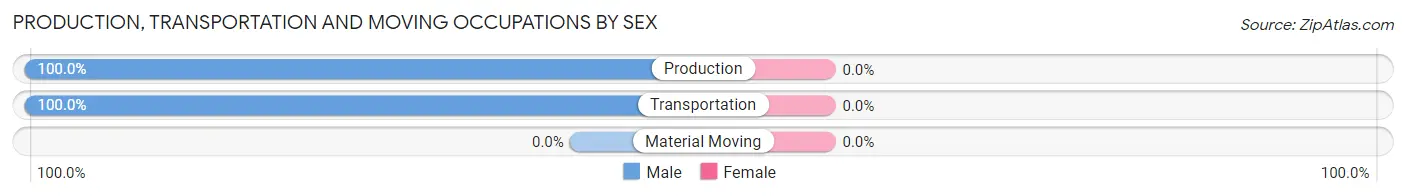
| Occupation | Male | Female |
| Production | 7 (100.0%) | 0 (0.0%) |
| Transportation | 23 (100.0%) | 0 (0.0%) |
| Material Moving | 0 (0.0%) | 0 (0.0%) |
| Total (Category) | 30 (100.0%) | 0 (0.0%) |
| Total (Overall) | 186 (43.2%) | 245 (56.8%) |
Employment Industries by Sex in Lame Deer
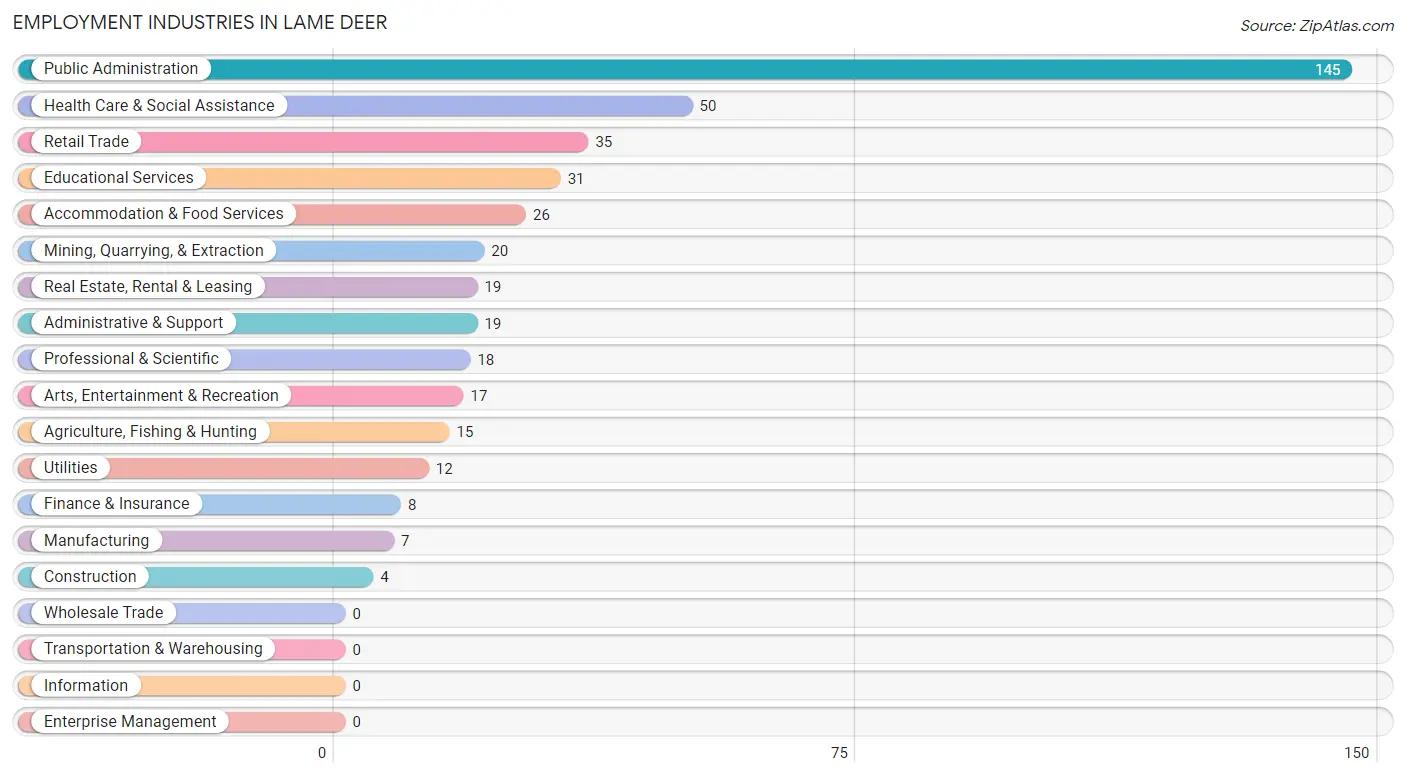
Employment Industries in Lame Deer
The major employment industries in Lame Deer include Public Administration (145 | 33.6%), Health Care & Social Assistance (50 | 11.6%), Retail Trade (35 | 8.1%), Educational Services (31 | 7.2%), and Accommodation & Food Services (26 | 6.0%).
Employment Industries by Sex in Lame Deer
The Lame Deer industries that see more men than women are Agriculture, Fishing & Hunting (100.0%), Construction (100.0%), and Manufacturing (100.0%), whereas the industries that tend to have a higher number of women are Finance & Insurance (100.0%), Real Estate, Rental & Leasing (100.0%), and Arts, Entertainment & Recreation (100.0%).
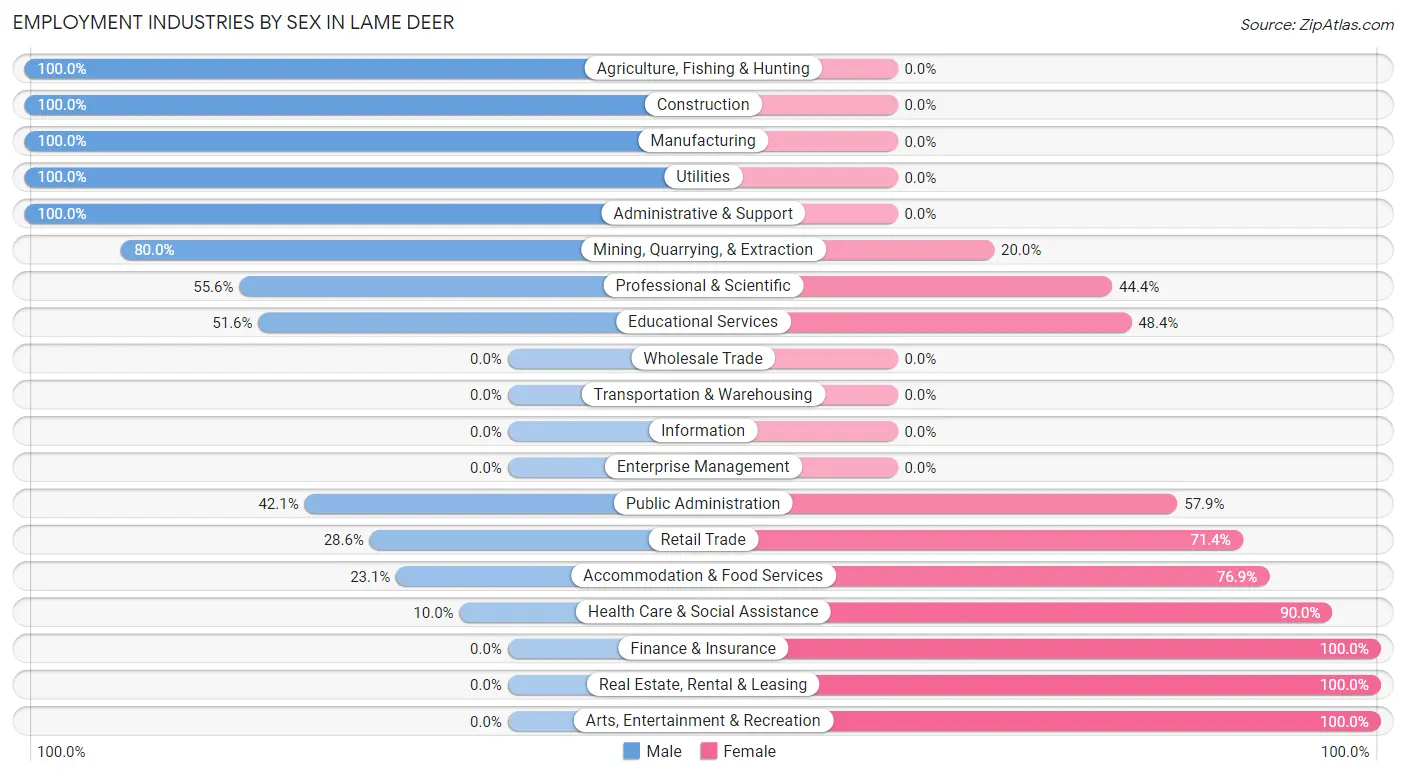
| Industry | Male | Female |
| Agriculture, Fishing & Hunting | 15 (100.0%) | 0 (0.0%) |
| Mining, Quarrying, & Extraction | 16 (80.0%) | 4 (20.0%) |
| Construction | 4 (100.0%) | 0 (0.0%) |
| Manufacturing | 7 (100.0%) | 0 (0.0%) |
| Wholesale Trade | 0 (0.0%) | 0 (0.0%) |
| Retail Trade | 10 (28.6%) | 25 (71.4%) |
| Transportation & Warehousing | 0 (0.0%) | 0 (0.0%) |
| Utilities | 12 (100.0%) | 0 (0.0%) |
| Information | 0 (0.0%) | 0 (0.0%) |
| Finance & Insurance | 0 (0.0%) | 8 (100.0%) |
| Real Estate, Rental & Leasing | 0 (0.0%) | 19 (100.0%) |
| Professional & Scientific | 10 (55.6%) | 8 (44.4%) |
| Enterprise Management | 0 (0.0%) | 0 (0.0%) |
| Administrative & Support | 19 (100.0%) | 0 (0.0%) |
| Educational Services | 16 (51.6%) | 15 (48.4%) |
| Health Care & Social Assistance | 5 (10.0%) | 45 (90.0%) |
| Arts, Entertainment & Recreation | 0 (0.0%) | 17 (100.0%) |
| Accommodation & Food Services | 6 (23.1%) | 20 (76.9%) |
| Public Administration | 61 (42.1%) | 84 (57.9%) |
| Total | 186 (43.2%) | 245 (56.8%) |
Education in Lame Deer
School Enrollment in Lame Deer
The most common levels of schooling among the 765 students in Lame Deer are high school (193 | 25.2%), elementary school (183 | 23.9%), and middle school (182 | 23.8%).
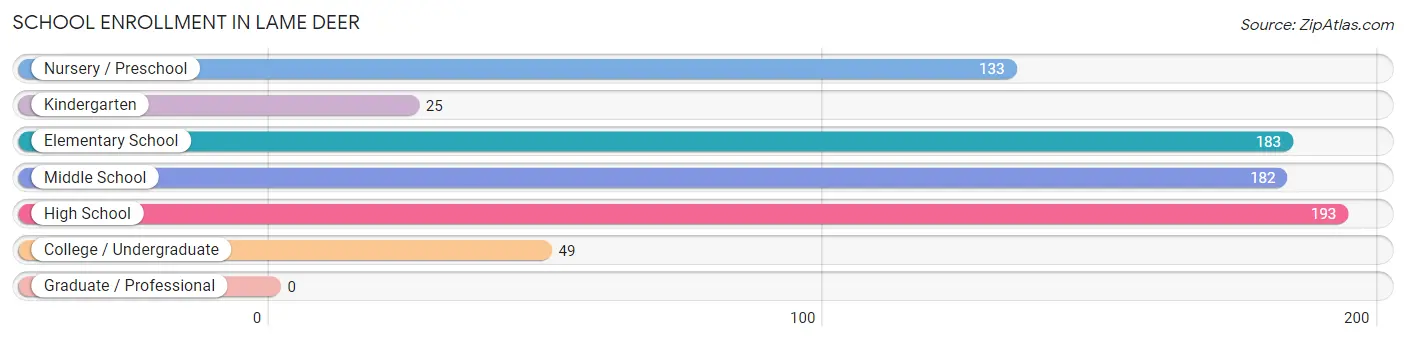
| School Level | # Students | % Students |
| Nursery / Preschool | 133 | 17.4% |
| Kindergarten | 25 | 3.3% |
| Elementary School | 183 | 23.9% |
| Middle School | 182 | 23.8% |
| High School | 193 | 25.2% |
| College / Undergraduate | 49 | 6.4% |
| Graduate / Professional | 0 | 0.0% |
| Total | 765 | 100.0% |
School Enrollment by Age by Funding Source in Lame Deer
Out of a total of 765 students who are enrolled in schools in Lame Deer, 24 (3.1%) attend a private institution, while the remaining 741 (96.9%) are enrolled in public schools. The age group of 3 to 4 year olds has the highest likelihood of being enrolled in private schools, with 18 (21.7% in the age bracket) enrolled. Conversely, the age group of 5 to 9 year old has the lowest likelihood of being enrolled in a private school, with 199 (100.0% in the age bracket) attending a public institution.
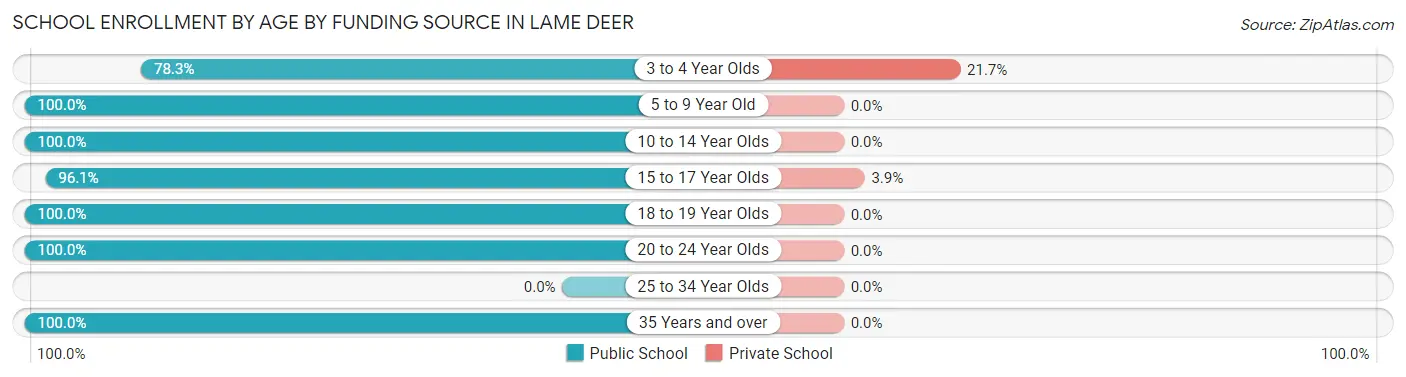
| Age Bracket | Public School | Private School |
| 3 to 4 Year Olds | 65 (78.3%) | 18 (21.7%) |
| 5 to 9 Year Old | 199 (100.0%) | 0 (0.0%) |
| 10 to 14 Year Olds | 228 (100.0%) | 0 (0.0%) |
| 15 to 17 Year Olds | 149 (96.1%) | 6 (3.9%) |
| 18 to 19 Year Olds | 50 (100.0%) | 0 (0.0%) |
| 20 to 24 Year Olds | 43 (100.0%) | 0 (0.0%) |
| 25 to 34 Year Olds | 0 (0.0%) | 0 (0.0%) |
| 35 Years and over | 7 (100.0%) | 0 (0.0%) |
| Total | 741 (96.9%) | 24 (3.1%) |
Educational Attainment by Field of Study in Lame Deer
Bio, nature & agricultural (51 | 47.2%), education (17 | 15.7%), physical & health sciences (10 | 9.3%), arts & humanities (9 | 8.3%), and visual & performing arts (8 | 7.4%) are the most common fields of study among 108 individuals in Lame Deer who have obtained a bachelor's degree or higher.
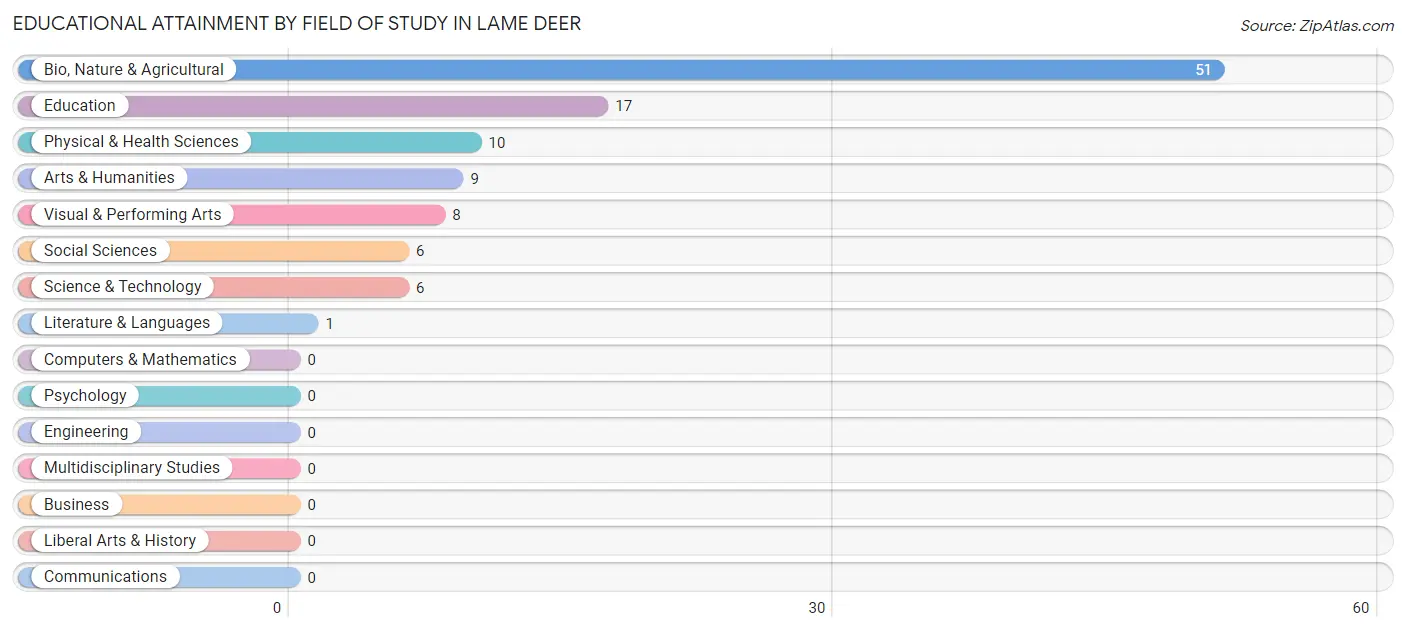
| Field of Study | # Graduates | % Graduates |
| Computers & Mathematics | 0 | 0.0% |
| Bio, Nature & Agricultural | 51 | 47.2% |
| Physical & Health Sciences | 10 | 9.3% |
| Psychology | 0 | 0.0% |
| Social Sciences | 6 | 5.6% |
| Engineering | 0 | 0.0% |
| Multidisciplinary Studies | 0 | 0.0% |
| Science & Technology | 6 | 5.6% |
| Business | 0 | 0.0% |
| Education | 17 | 15.7% |
| Literature & Languages | 1 | 0.9% |
| Liberal Arts & History | 0 | 0.0% |
| Visual & Performing Arts | 8 | 7.4% |
| Communications | 0 | 0.0% |
| Arts & Humanities | 9 | 8.3% |
| Total | 108 | 100.0% |
Transportation & Commute in Lame Deer
Vehicle Availability by Sex in Lame Deer
The most prevalent vehicle ownership categories in Lame Deer are males with 2 vehicles (68, accounting for 34.5%) and females with 2 vehicles (83, making up 27.8%).
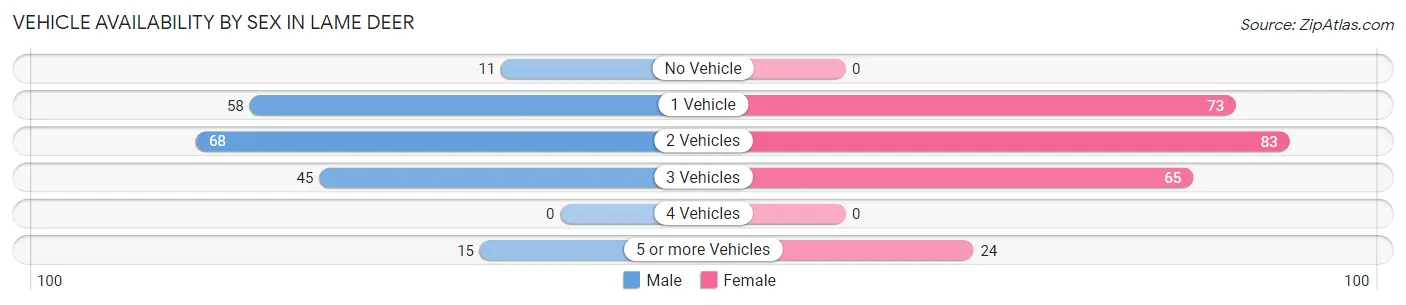
| Vehicles Available | Male | Female |
| No Vehicle | 11 (5.6%) | 0 (0.0%) |
| 1 Vehicle | 58 (29.4%) | 73 (29.8%) |
| 2 Vehicles | 68 (34.5%) | 83 (33.9%) |
| 3 Vehicles | 45 (22.8%) | 65 (26.5%) |
| 4 Vehicles | 0 (0.0%) | 0 (0.0%) |
| 5 or more Vehicles | 15 (7.6%) | 24 (9.8%) |
| Total | 197 (100.0%) | 245 (100.0%) |
Commute Time in Lame Deer
The most frequently occuring commute durations in Lame Deer are 5 to 9 minutes (193 commuters, 45.4%), less than 5 minutes (111 commuters, 26.1%), and 10 to 14 minutes (59 commuters, 13.9%).
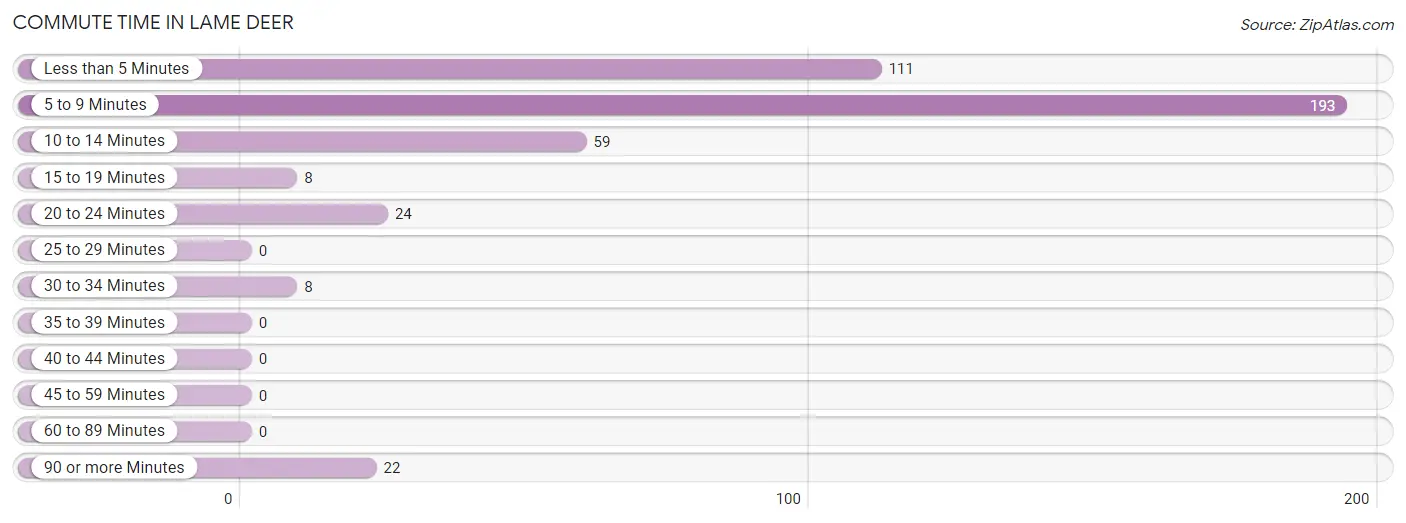
| Commute Time | # Commuters | % Commuters |
| Less than 5 Minutes | 111 | 26.1% |
| 5 to 9 Minutes | 193 | 45.4% |
| 10 to 14 Minutes | 59 | 13.9% |
| 15 to 19 Minutes | 8 | 1.9% |
| 20 to 24 Minutes | 24 | 5.7% |
| 25 to 29 Minutes | 0 | 0.0% |
| 30 to 34 Minutes | 8 | 1.9% |
| 35 to 39 Minutes | 0 | 0.0% |
| 40 to 44 Minutes | 0 | 0.0% |
| 45 to 59 Minutes | 0 | 0.0% |
| 60 to 89 Minutes | 0 | 0.0% |
| 90 or more Minutes | 22 | 5.2% |
Commute Time by Sex in Lame Deer
The most common commute times in Lame Deer are 5 to 9 minutes (74 commuters, 41.1%) for males and 5 to 9 minutes (119 commuters, 48.6%) for females.
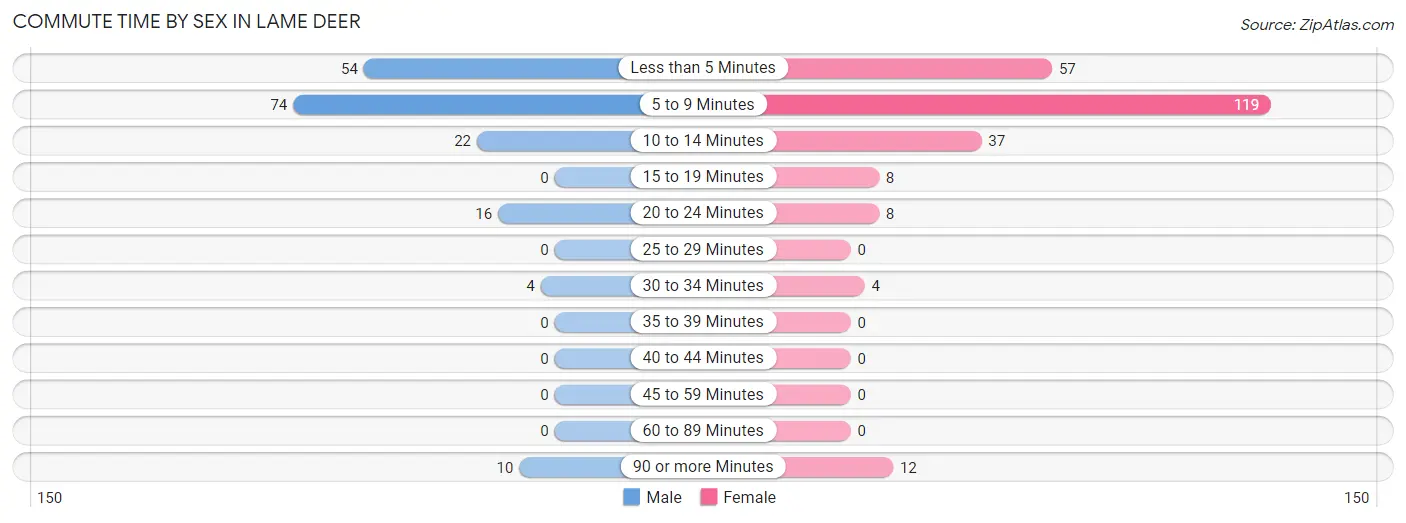
| Commute Time | Male | Female |
| Less than 5 Minutes | 54 (30.0%) | 57 (23.3%) |
| 5 to 9 Minutes | 74 (41.1%) | 119 (48.6%) |
| 10 to 14 Minutes | 22 (12.2%) | 37 (15.1%) |
| 15 to 19 Minutes | 0 (0.0%) | 8 (3.3%) |
| 20 to 24 Minutes | 16 (8.9%) | 8 (3.3%) |
| 25 to 29 Minutes | 0 (0.0%) | 0 (0.0%) |
| 30 to 34 Minutes | 4 (2.2%) | 4 (1.6%) |
| 35 to 39 Minutes | 0 (0.0%) | 0 (0.0%) |
| 40 to 44 Minutes | 0 (0.0%) | 0 (0.0%) |
| 45 to 59 Minutes | 0 (0.0%) | 0 (0.0%) |
| 60 to 89 Minutes | 0 (0.0%) | 0 (0.0%) |
| 90 or more Minutes | 10 (5.6%) | 12 (4.9%) |
Time of Departure to Work by Sex in Lame Deer
The most frequent times of departure to work in Lame Deer are 7:30 AM to 7:59 AM (58, 32.2%) for males and 7:30 AM to 7:59 AM (96, 39.2%) for females.
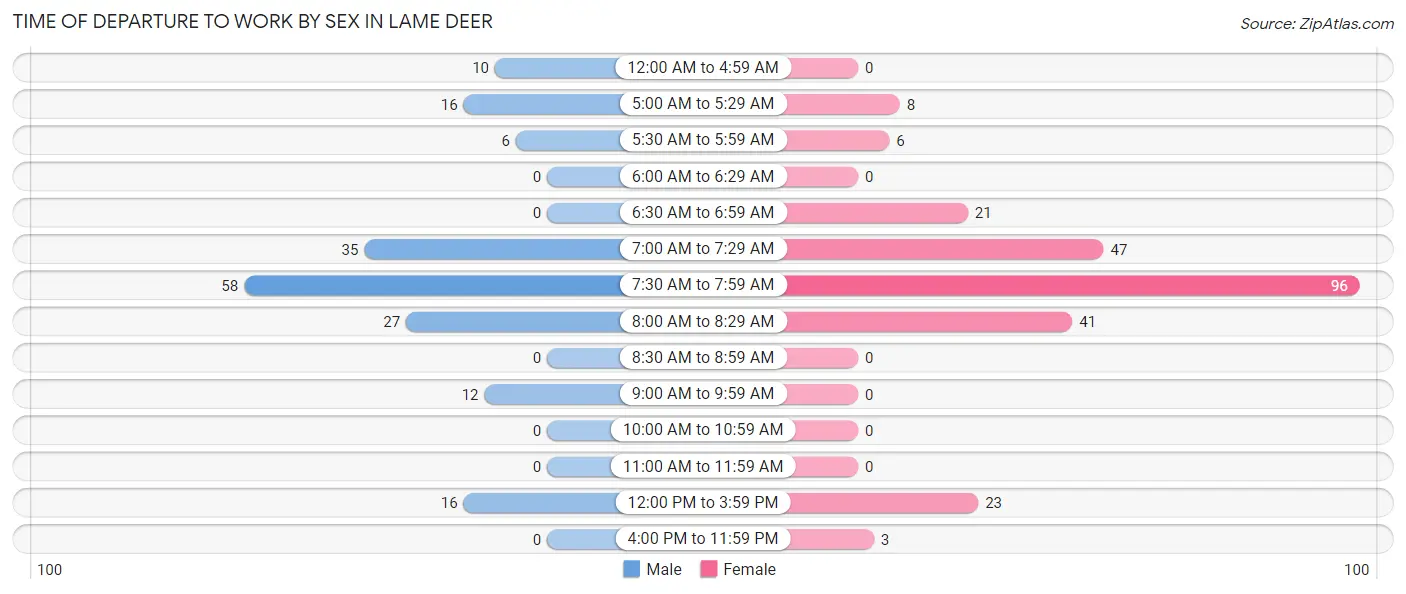
| Time of Departure | Male | Female |
| 12:00 AM to 4:59 AM | 10 (5.6%) | 0 (0.0%) |
| 5:00 AM to 5:29 AM | 16 (8.9%) | 8 (3.3%) |
| 5:30 AM to 5:59 AM | 6 (3.3%) | 6 (2.5%) |
| 6:00 AM to 6:29 AM | 0 (0.0%) | 0 (0.0%) |
| 6:30 AM to 6:59 AM | 0 (0.0%) | 21 (8.6%) |
| 7:00 AM to 7:29 AM | 35 (19.4%) | 47 (19.2%) |
| 7:30 AM to 7:59 AM | 58 (32.2%) | 96 (39.2%) |
| 8:00 AM to 8:29 AM | 27 (15.0%) | 41 (16.7%) |
| 8:30 AM to 8:59 AM | 0 (0.0%) | 0 (0.0%) |
| 9:00 AM to 9:59 AM | 12 (6.7%) | 0 (0.0%) |
| 10:00 AM to 10:59 AM | 0 (0.0%) | 0 (0.0%) |
| 11:00 AM to 11:59 AM | 0 (0.0%) | 0 (0.0%) |
| 12:00 PM to 3:59 PM | 16 (8.9%) | 23 (9.4%) |
| 4:00 PM to 11:59 PM | 0 (0.0%) | 3 (1.2%) |
| Total | 180 (100.0%) | 245 (100.0%) |
Housing Occupancy in Lame Deer
Occupancy by Ownership in Lame Deer
Of the total 484 dwellings in Lame Deer, owner-occupied units account for 261 (53.9%), while renter-occupied units make up 223 (46.1%).
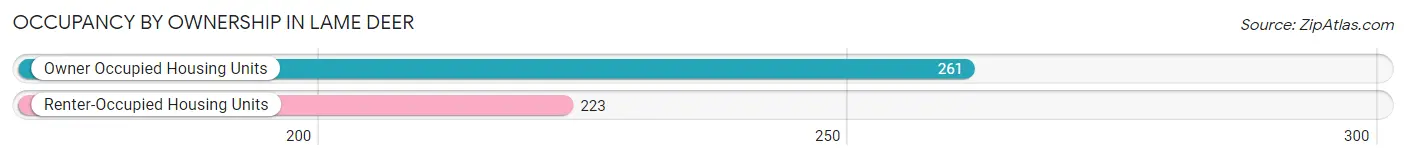
| Occupancy | # Housing Units | % Housing Units |
| Owner Occupied Housing Units | 261 | 53.9% |
| Renter-Occupied Housing Units | 223 | 46.1% |
| Total Occupied Housing Units | 484 | 100.0% |
Occupancy by Household Size in Lame Deer
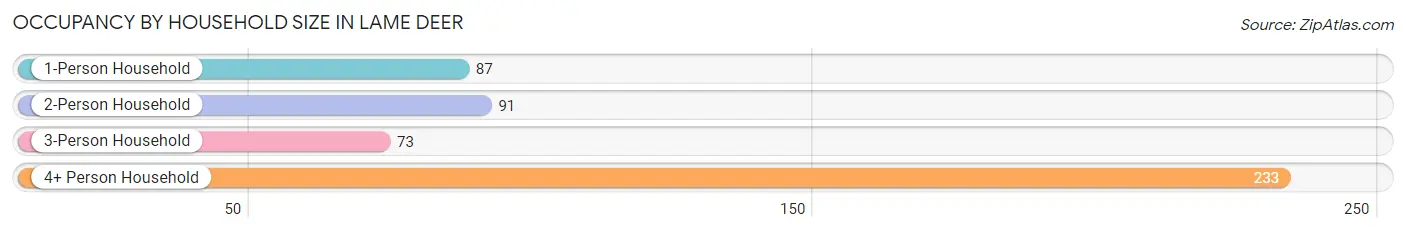
| Household Size | # Housing Units | % Housing Units |
| 1-Person Household | 87 | 18.0% |
| 2-Person Household | 91 | 18.8% |
| 3-Person Household | 73 | 15.1% |
| 4+ Person Household | 233 | 48.1% |
| Total Housing Units | 484 | 100.0% |
Occupancy by Ownership by Household Size in Lame Deer
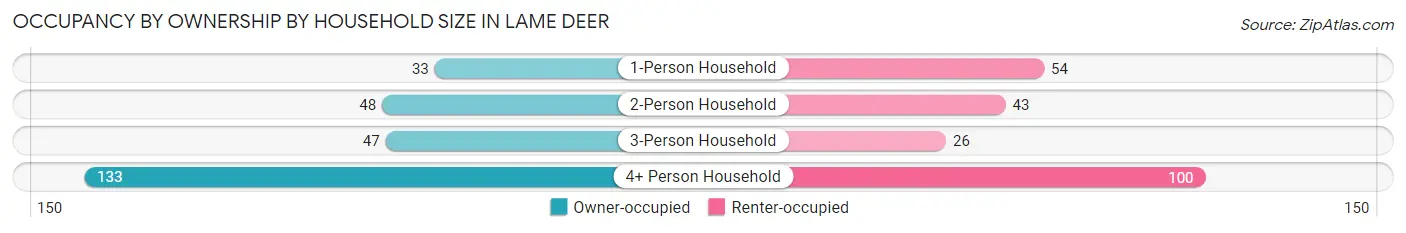
| Household Size | Owner-occupied | Renter-occupied |
| 1-Person Household | 33 (37.9%) | 54 (62.1%) |
| 2-Person Household | 48 (52.7%) | 43 (47.2%) |
| 3-Person Household | 47 (64.4%) | 26 (35.6%) |
| 4+ Person Household | 133 (57.1%) | 100 (42.9%) |
| Total Housing Units | 261 (53.9%) | 223 (46.1%) |
Occupancy by Educational Attainment in Lame Deer
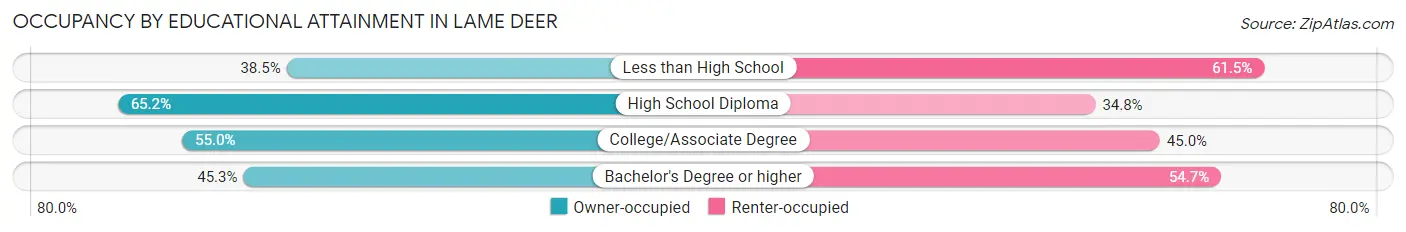
| Household Size | Owner-occupied | Renter-occupied |
| Less than High School | 25 (38.5%) | 40 (61.5%) |
| High School Diploma | 75 (65.2%) | 40 (34.8%) |
| College/Associate Degree | 132 (55.0%) | 108 (45.0%) |
| Bachelor's Degree or higher | 29 (45.3%) | 35 (54.7%) |
Occupancy by Age of Householder in Lame Deer
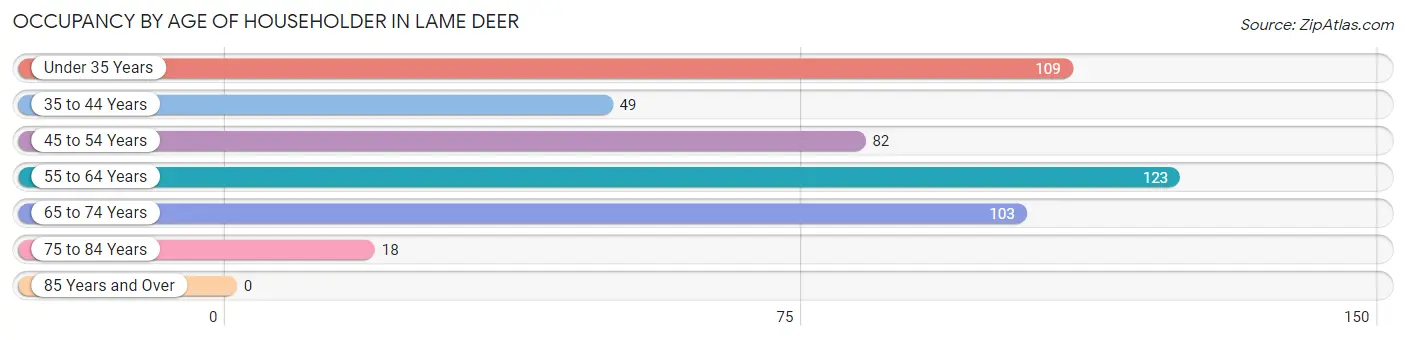
| Age Bracket | # Households | % Households |
| Under 35 Years | 109 | 22.5% |
| 35 to 44 Years | 49 | 10.1% |
| 45 to 54 Years | 82 | 16.9% |
| 55 to 64 Years | 123 | 25.4% |
| 65 to 74 Years | 103 | 21.3% |
| 75 to 84 Years | 18 | 3.7% |
| 85 Years and Over | 0 | 0.0% |
| Total | 484 | 100.0% |
Housing Finances in Lame Deer
Median Income by Occupancy in Lame Deer
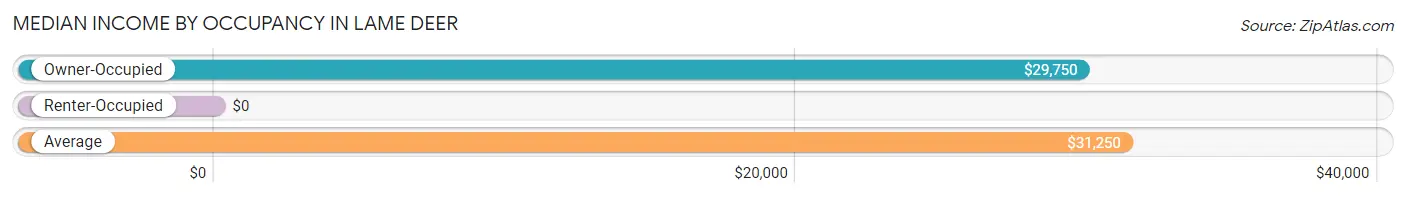
| Occupancy Type | # Households | Median Income |
| Owner-Occupied | 261 (53.9%) | $29,750 |
| Renter-Occupied | 223 (46.1%) | $0 |
| Average | 484 (100.0%) | $31,250 |
Occupancy by Householder Income Bracket in Lame Deer
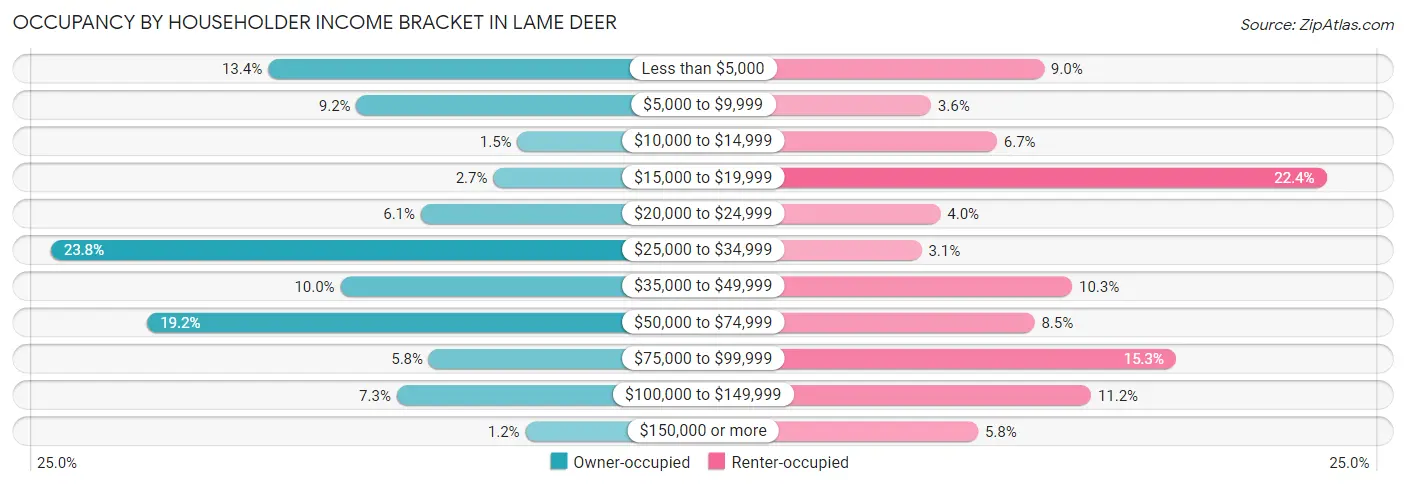
| Income Bracket | Owner-occupied | Renter-occupied |
| Less than $5,000 | 35 (13.4%) | 20 (9.0%) |
| $5,000 to $9,999 | 24 (9.2%) | 8 (3.6%) |
| $10,000 to $14,999 | 4 (1.5%) | 15 (6.7%) |
| $15,000 to $19,999 | 7 (2.7%) | 50 (22.4%) |
| $20,000 to $24,999 | 16 (6.1%) | 9 (4.0%) |
| $25,000 to $34,999 | 62 (23.7%) | 7 (3.1%) |
| $35,000 to $49,999 | 26 (10.0%) | 23 (10.3%) |
| $50,000 to $74,999 | 50 (19.2%) | 19 (8.5%) |
| $75,000 to $99,999 | 15 (5.8%) | 34 (15.2%) |
| $100,000 to $149,999 | 19 (7.3%) | 25 (11.2%) |
| $150,000 or more | 3 (1.1%) | 13 (5.8%) |
| Total | 261 (100.0%) | 223 (100.0%) |
Monthly Housing Cost Tiers in Lame Deer
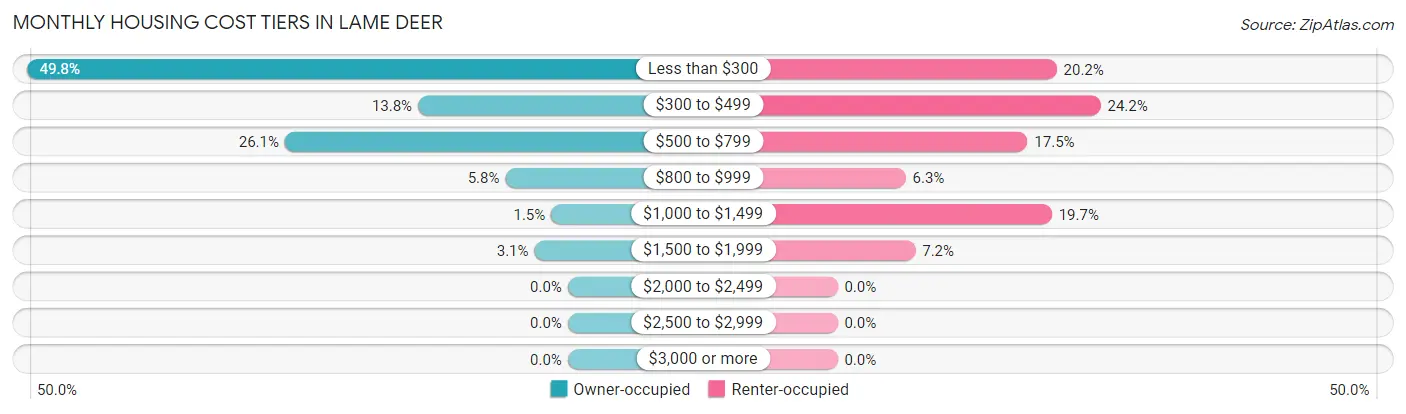
| Monthly Cost | Owner-occupied | Renter-occupied |
| Less than $300 | 130 (49.8%) | 45 (20.2%) |
| $300 to $499 | 36 (13.8%) | 54 (24.2%) |
| $500 to $799 | 68 (26.1%) | 39 (17.5%) |
| $800 to $999 | 15 (5.8%) | 14 (6.3%) |
| $1,000 to $1,499 | 4 (1.5%) | 44 (19.7%) |
| $1,500 to $1,999 | 8 (3.1%) | 16 (7.2%) |
| $2,000 to $2,499 | 0 (0.0%) | 0 (0.0%) |
| $2,500 to $2,999 | 0 (0.0%) | 0 (0.0%) |
| $3,000 or more | 0 (0.0%) | 0 (0.0%) |
| Total | 261 (100.0%) | 223 (100.0%) |
Physical Housing Characteristics in Lame Deer
Housing Structures in Lame Deer
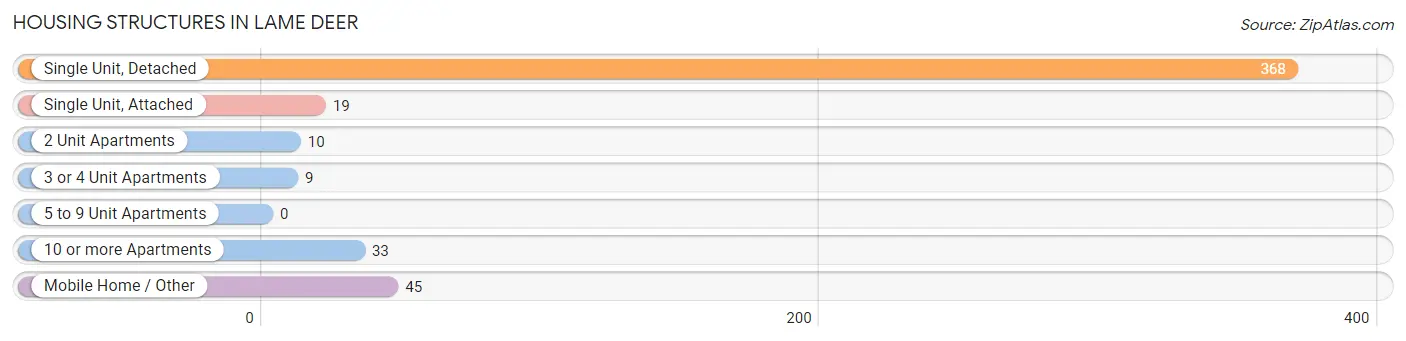
| Structure Type | # Housing Units | % Housing Units |
| Single Unit, Detached | 368 | 76.0% |
| Single Unit, Attached | 19 | 3.9% |
| 2 Unit Apartments | 10 | 2.1% |
| 3 or 4 Unit Apartments | 9 | 1.9% |
| 5 to 9 Unit Apartments | 0 | 0.0% |
| 10 or more Apartments | 33 | 6.8% |
| Mobile Home / Other | 45 | 9.3% |
| Total | 484 | 100.0% |
Housing Structures by Occupancy in Lame Deer
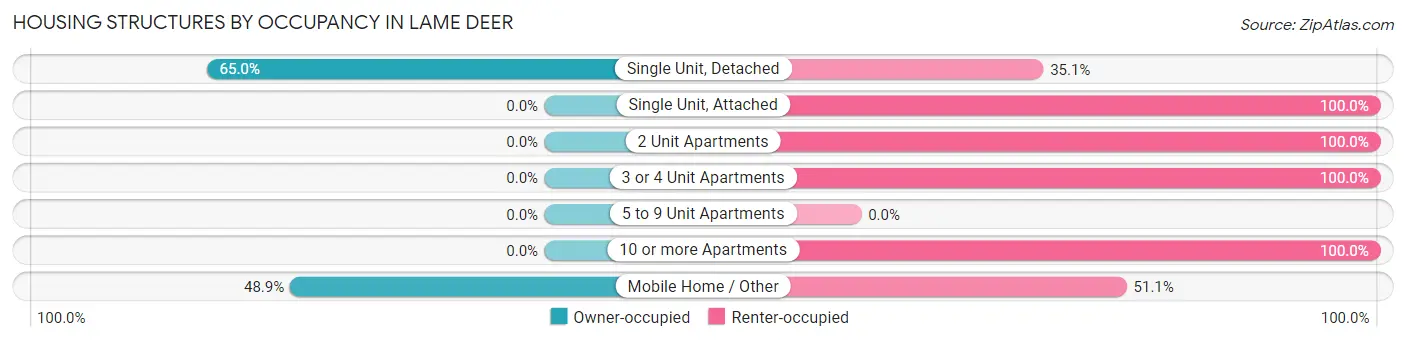
| Structure Type | Owner-occupied | Renter-occupied |
| Single Unit, Detached | 239 (64.9%) | 129 (35.0%) |
| Single Unit, Attached | 0 (0.0%) | 19 (100.0%) |
| 2 Unit Apartments | 0 (0.0%) | 10 (100.0%) |
| 3 or 4 Unit Apartments | 0 (0.0%) | 9 (100.0%) |
| 5 to 9 Unit Apartments | 0 (0.0%) | 0 (0.0%) |
| 10 or more Apartments | 0 (0.0%) | 33 (100.0%) |
| Mobile Home / Other | 22 (48.9%) | 23 (51.1%) |
| Total | 261 (53.9%) | 223 (46.1%) |
Housing Structures by Number of Rooms in Lame Deer
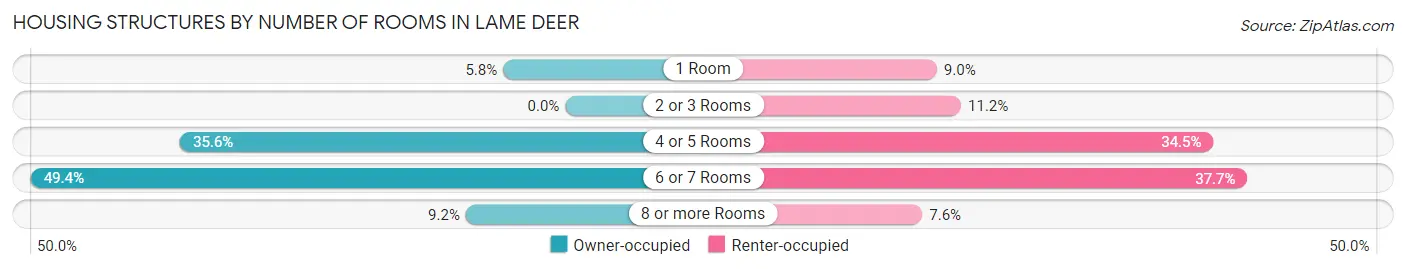
| Number of Rooms | Owner-occupied | Renter-occupied |
| 1 Room | 15 (5.8%) | 20 (9.0%) |
| 2 or 3 Rooms | 0 (0.0%) | 25 (11.2%) |
| 4 or 5 Rooms | 93 (35.6%) | 77 (34.5%) |
| 6 or 7 Rooms | 129 (49.4%) | 84 (37.7%) |
| 8 or more Rooms | 24 (9.2%) | 17 (7.6%) |
| Total | 261 (100.0%) | 223 (100.0%) |
Housing Structure by Heating Type in Lame Deer
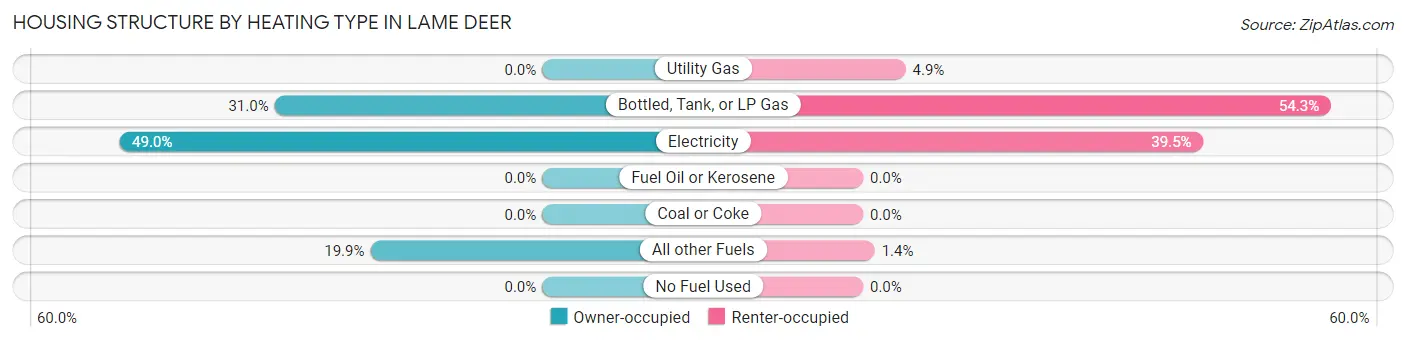
| Heating Type | Owner-occupied | Renter-occupied |
| Utility Gas | 0 (0.0%) | 11 (4.9%) |
| Bottled, Tank, or LP Gas | 81 (31.0%) | 121 (54.3%) |
| Electricity | 128 (49.0%) | 88 (39.5%) |
| Fuel Oil or Kerosene | 0 (0.0%) | 0 (0.0%) |
| Coal or Coke | 0 (0.0%) | 0 (0.0%) |
| All other Fuels | 52 (19.9%) | 3 (1.3%) |
| No Fuel Used | 0 (0.0%) | 0 (0.0%) |
| Total | 261 (100.0%) | 223 (100.0%) |
Household Vehicle Usage in Lame Deer
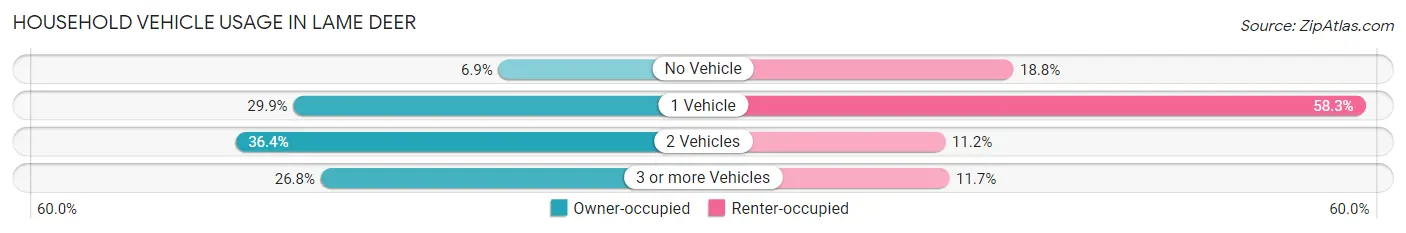
| Vehicles per Household | Owner-occupied | Renter-occupied |
| No Vehicle | 18 (6.9%) | 42 (18.8%) |
| 1 Vehicle | 78 (29.9%) | 130 (58.3%) |
| 2 Vehicles | 95 (36.4%) | 25 (11.2%) |
| 3 or more Vehicles | 70 (26.8%) | 26 (11.7%) |
| Total | 261 (100.0%) | 223 (100.0%) |
Real Estate & Mortgages in Lame Deer
Real Estate and Mortgage Overview in Lame Deer
| Characteristic | Without Mortgage | With Mortgage |
| Housing Units | 238 | 23 |
| Median Property Value | $98,600 | $0 |
| Median Household Income | $28,600 | $0 |
| Monthly Housing Costs | $275 | $0 |
| Real Estate Taxes | $1,045 | $15 |
Property Value by Mortgage Status in Lame Deer
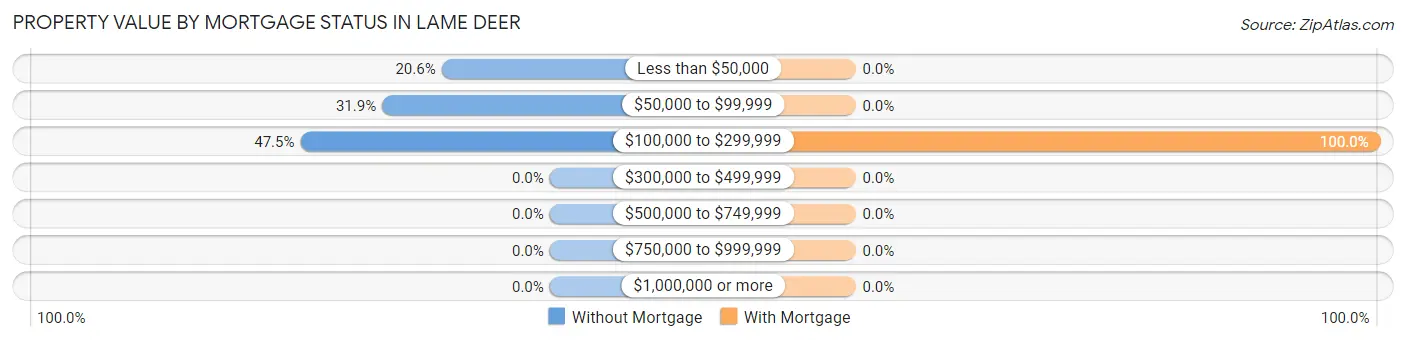
| Property Value | Without Mortgage | With Mortgage |
| Less than $50,000 | 49 (20.6%) | 0 (0.0%) |
| $50,000 to $99,999 | 76 (31.9%) | 0 (0.0%) |
| $100,000 to $299,999 | 113 (47.5%) | 23 (100.0%) |
| $300,000 to $499,999 | 0 (0.0%) | 0 (0.0%) |
| $500,000 to $749,999 | 0 (0.0%) | 0 (0.0%) |
| $750,000 to $999,999 | 0 (0.0%) | 0 (0.0%) |
| $1,000,000 or more | 0 (0.0%) | 0 (0.0%) |
| Total | 238 (100.0%) | 23 (100.0%) |
Household Income by Mortgage Status in Lame Deer
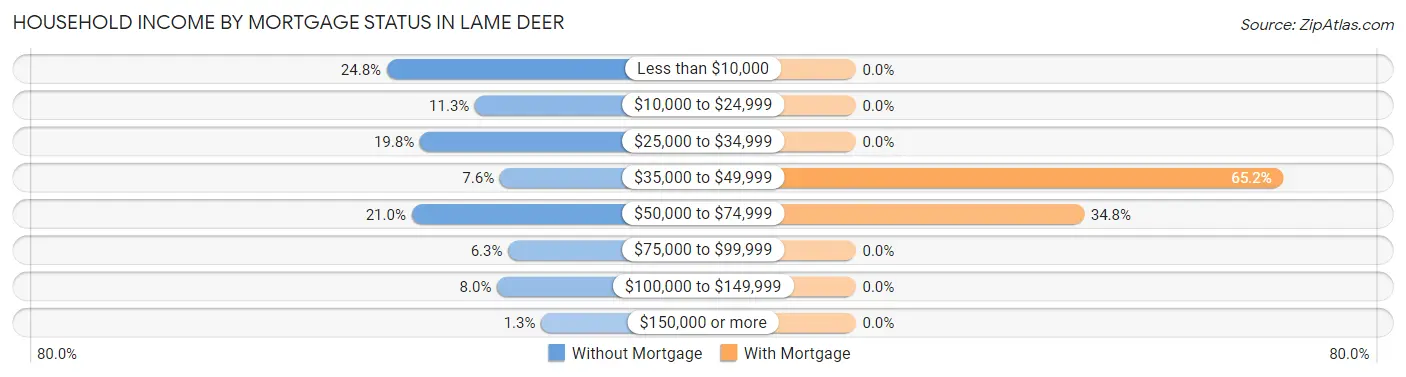
| Household Income | Without Mortgage | With Mortgage |
| Less than $10,000 | 59 (24.8%) | 0 (0.0%) |
| $10,000 to $24,999 | 27 (11.3%) | 0 (0.0%) |
| $25,000 to $34,999 | 47 (19.8%) | 0 (0.0%) |
| $35,000 to $49,999 | 18 (7.6%) | 15 (65.2%) |
| $50,000 to $74,999 | 50 (21.0%) | 8 (34.8%) |
| $75,000 to $99,999 | 15 (6.3%) | 0 (0.0%) |
| $100,000 to $149,999 | 19 (8.0%) | 0 (0.0%) |
| $150,000 or more | 3 (1.3%) | 0 (0.0%) |
| Total | 238 (100.0%) | 23 (100.0%) |
Property Value to Household Income Ratio in Lame Deer
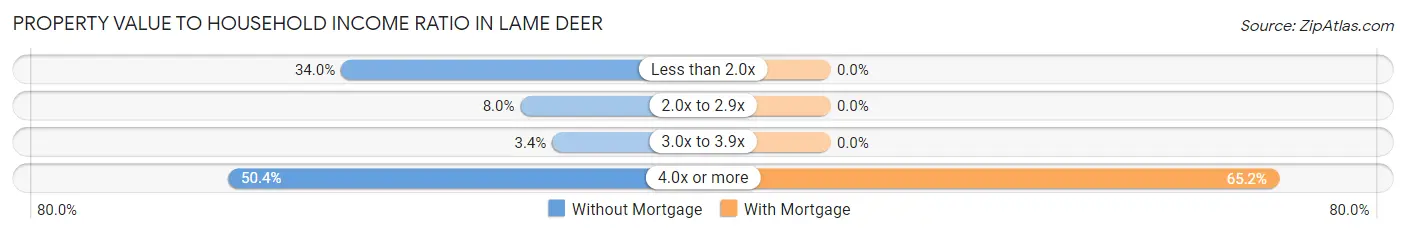
| Value-to-Income Ratio | Without Mortgage | With Mortgage |
| Less than 2.0x | 81 (34.0%) | 0 (0.0%) |
| 2.0x to 2.9x | 19 (8.0%) | 0 (0.0%) |
| 3.0x to 3.9x | 8 (3.4%) | 0 (0.0%) |
| 4.0x or more | 120 (50.4%) | 15 (65.2%) |
| Total | 238 (100.0%) | 23 (100.0%) |
Real Estate Taxes by Mortgage Status in Lame Deer
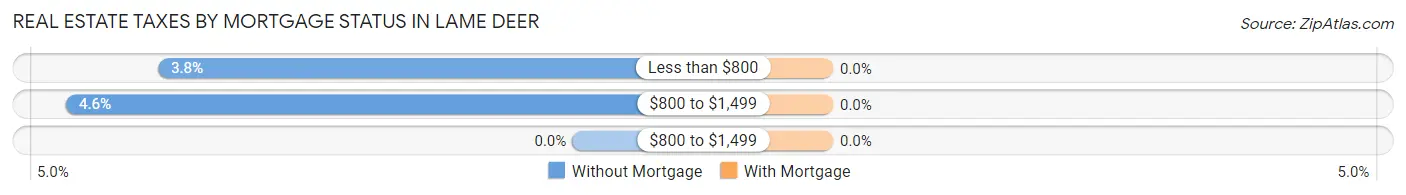
| Property Taxes | Without Mortgage | With Mortgage |
| Less than $800 | 9 (3.8%) | 0 (0.0%) |
| $800 to $1,499 | 11 (4.6%) | 0 (0.0%) |
| $800 to $1,499 | 0 (0.0%) | 0 (0.0%) |
| Total | 238 (100.0%) | 23 (100.0%) |
Health & Disability in Lame Deer
Health Insurance Coverage by Age in Lame Deer
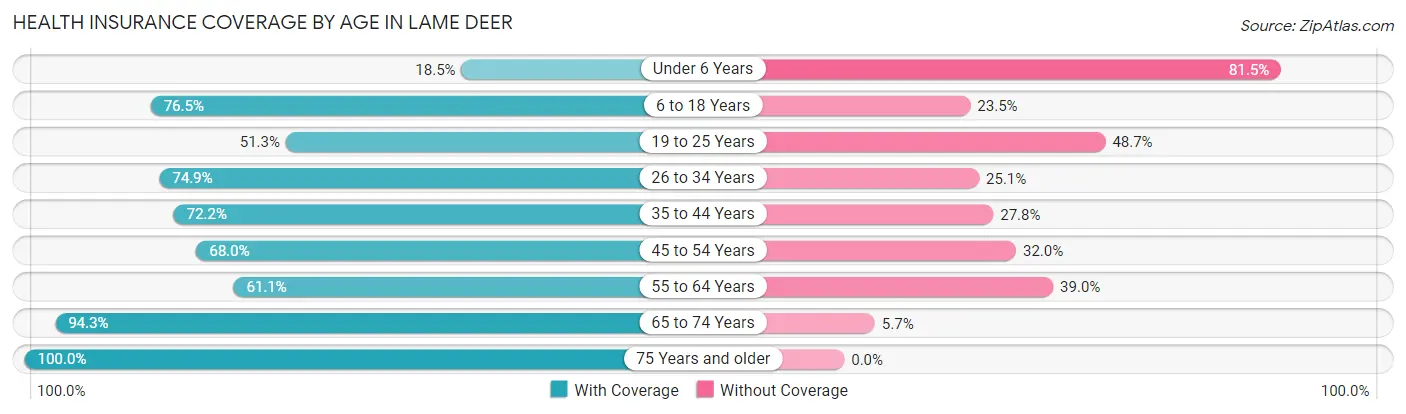
| Age Bracket | With Coverage | Without Coverage |
| Under 6 Years | 61 (18.5%) | 268 (81.5%) |
| 6 to 18 Years | 478 (76.5%) | 147 (23.5%) |
| 19 to 25 Years | 158 (51.3%) | 150 (48.7%) |
| 26 to 34 Years | 131 (74.9%) | 44 (25.1%) |
| 35 to 44 Years | 130 (72.2%) | 50 (27.8%) |
| 45 to 54 Years | 87 (68.0%) | 41 (32.0%) |
| 55 to 64 Years | 105 (61.1%) | 67 (39.0%) |
| 65 to 74 Years | 99 (94.3%) | 6 (5.7%) |
| 75 Years and older | 21 (100.0%) | 0 (0.0%) |
| Total | 1,270 (62.2%) | 773 (37.8%) |
Health Insurance Coverage by Citizenship Status in Lame Deer
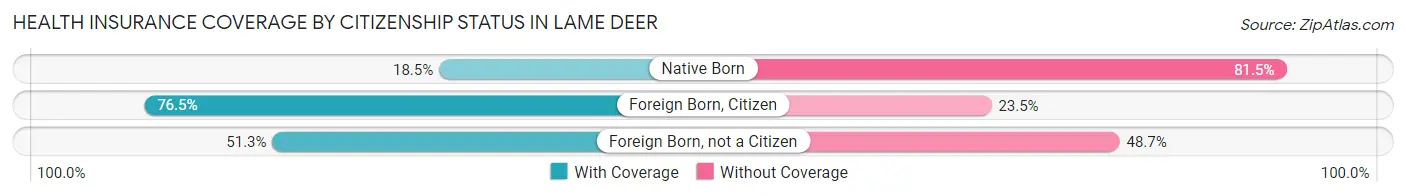
| Citizenship Status | With Coverage | Without Coverage |
| Native Born | 61 (18.5%) | 268 (81.5%) |
| Foreign Born, Citizen | 478 (76.5%) | 147 (23.5%) |
| Foreign Born, not a Citizen | 158 (51.3%) | 150 (48.7%) |
Health Insurance Coverage by Household Income in Lame Deer
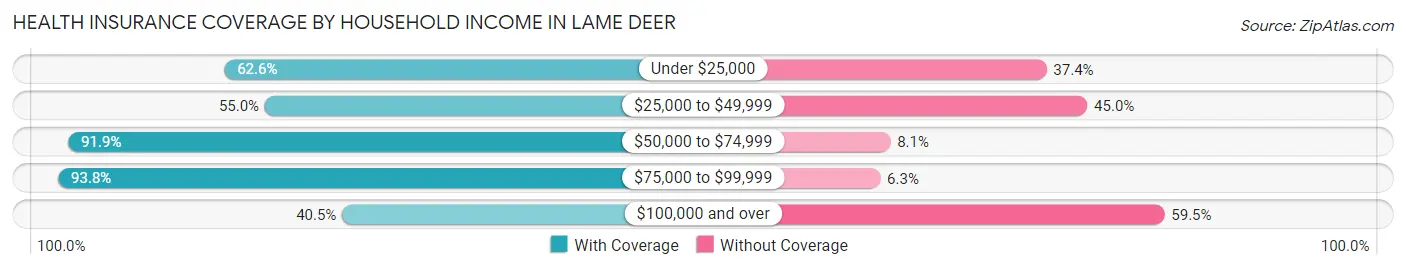
| Household Income | With Coverage | Without Coverage |
| Under $25,000 | 380 (62.6%) | 227 (37.4%) |
| $25,000 to $49,999 | 249 (55.0%) | 204 (45.0%) |
| $50,000 to $74,999 | 282 (91.9%) | 25 (8.1%) |
| $75,000 to $99,999 | 150 (93.8%) | 10 (6.2%) |
| $100,000 and over | 209 (40.5%) | 307 (59.5%) |
Public vs Private Health Insurance Coverage by Age in Lame Deer
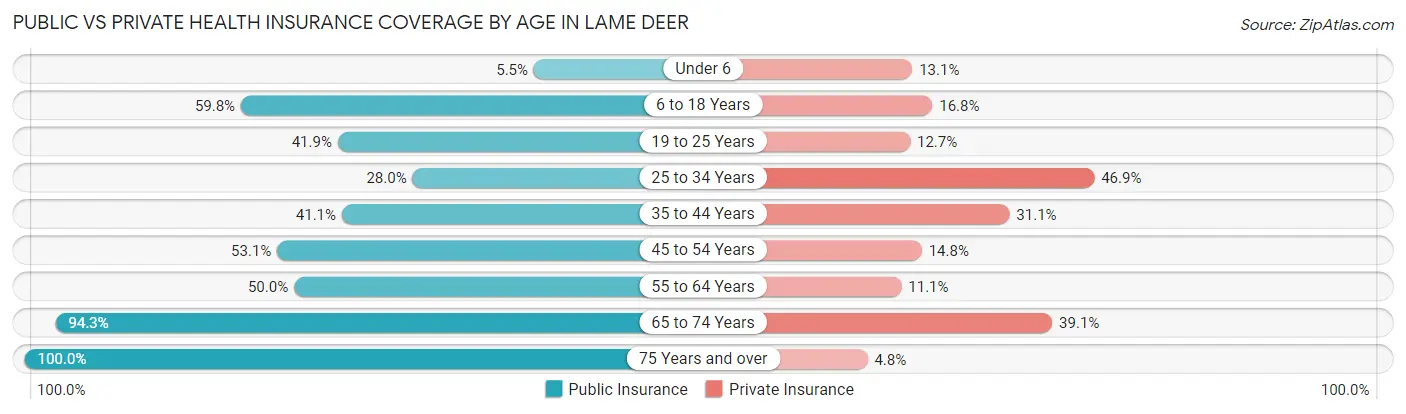
| Age Bracket | Public Insurance | Private Insurance |
| Under 6 | 18 (5.5%) | 43 (13.1%) |
| 6 to 18 Years | 374 (59.8%) | 105 (16.8%) |
| 19 to 25 Years | 129 (41.9%) | 39 (12.7%) |
| 25 to 34 Years | 49 (28.0%) | 82 (46.9%) |
| 35 to 44 Years | 74 (41.1%) | 56 (31.1%) |
| 45 to 54 Years | 68 (53.1%) | 19 (14.8%) |
| 55 to 64 Years | 86 (50.0%) | 19 (11.1%) |
| 65 to 74 Years | 99 (94.3%) | 41 (39.1%) |
| 75 Years and over | 21 (100.0%) | 1 (4.8%) |
| Total | 918 (44.9%) | 405 (19.8%) |
Disability Status by Sex by Age in Lame Deer
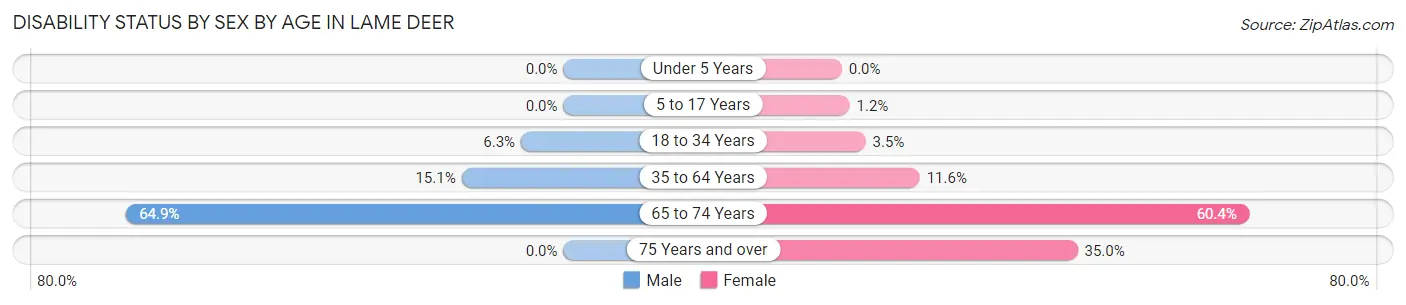
| Age Bracket | Male | Female |
| Under 5 Years | 0 (0.0%) | 0 (0.0%) |
| 5 to 17 Years | 0 (0.0%) | 4 (1.2%) |
| 18 to 34 Years | 17 (6.3%) | 10 (3.5%) |
| 35 to 64 Years | 36 (15.1%) | 28 (11.6%) |
| 65 to 74 Years | 37 (64.9%) | 29 (60.4%) |
| 75 Years and over | 0 (0.0%) | 7 (35.0%) |
Disability Class by Sex by Age in Lame Deer
Disability Class: Hearing Difficulty
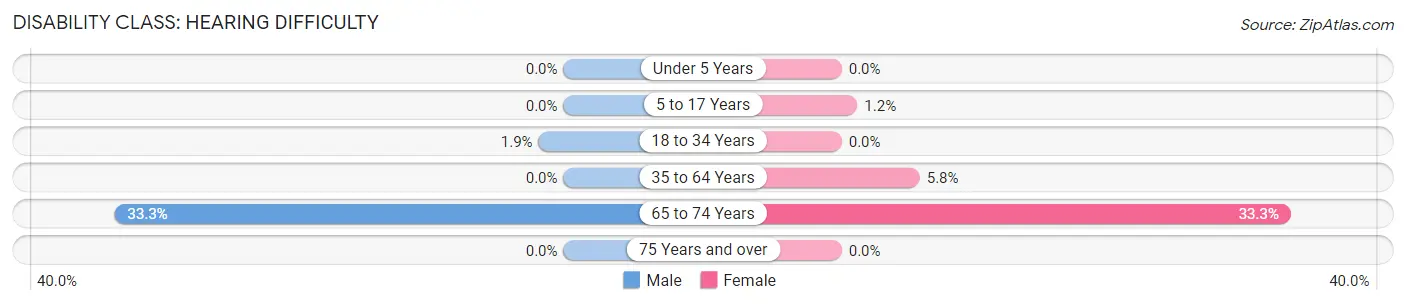
| Age Bracket | Male | Female |
| Under 5 Years | 0 (0.0%) | 0 (0.0%) |
| 5 to 17 Years | 0 (0.0%) | 4 (1.2%) |
| 18 to 34 Years | 5 (1.8%) | 0 (0.0%) |
| 35 to 64 Years | 0 (0.0%) | 14 (5.8%) |
| 65 to 74 Years | 19 (33.3%) | 16 (33.3%) |
| 75 Years and over | 0 (0.0%) | 0 (0.0%) |
Disability Class: Vision Difficulty
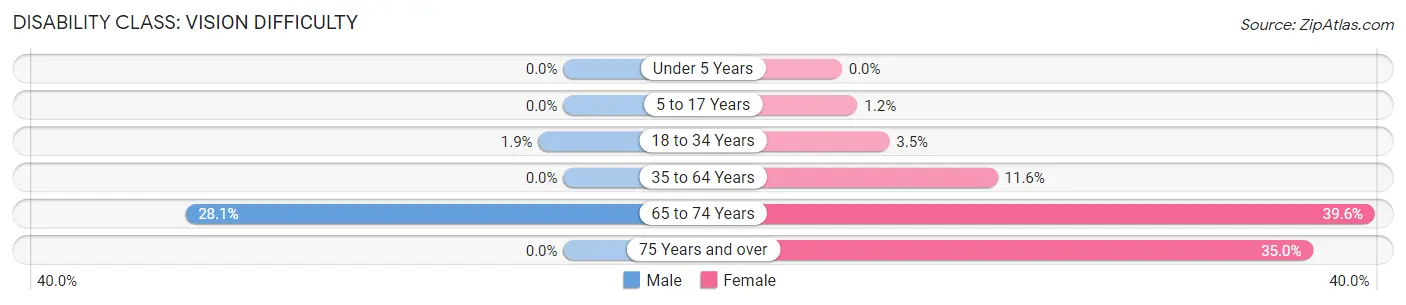
| Age Bracket | Male | Female |
| Under 5 Years | 0 (0.0%) | 0 (0.0%) |
| 5 to 17 Years | 0 (0.0%) | 4 (1.2%) |
| 18 to 34 Years | 5 (1.8%) | 10 (3.5%) |
| 35 to 64 Years | 0 (0.0%) | 28 (11.6%) |
| 65 to 74 Years | 16 (28.1%) | 19 (39.6%) |
| 75 Years and over | 0 (0.0%) | 7 (35.0%) |
Disability Class: Cognitive Difficulty
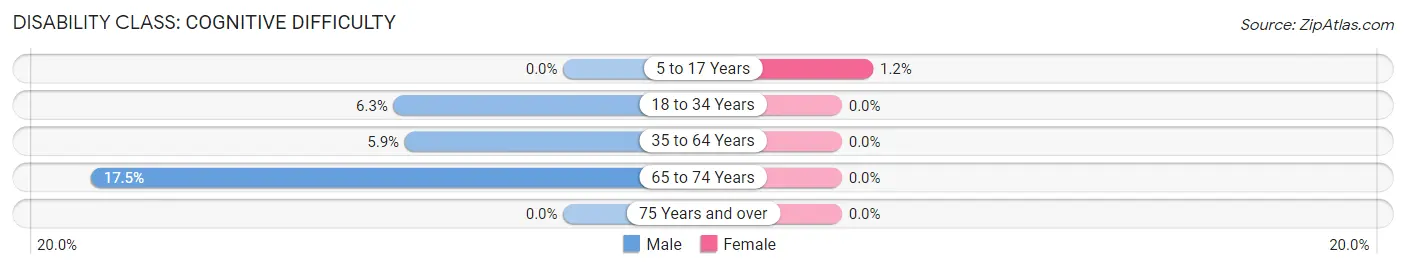
| Age Bracket | Male | Female |
| 5 to 17 Years | 0 (0.0%) | 4 (1.2%) |
| 18 to 34 Years | 17 (6.3%) | 0 (0.0%) |
| 35 to 64 Years | 14 (5.9%) | 0 (0.0%) |
| 65 to 74 Years | 10 (17.5%) | 0 (0.0%) |
| 75 Years and over | 0 (0.0%) | 0 (0.0%) |
Disability Class: Ambulatory Difficulty
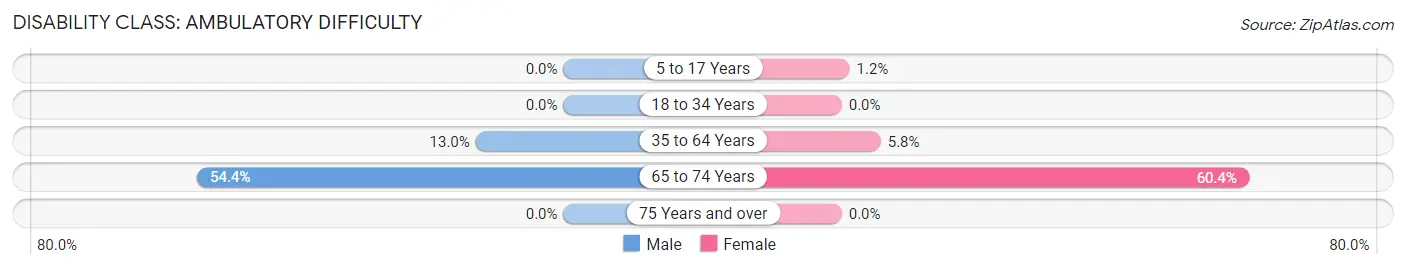
| Age Bracket | Male | Female |
| 5 to 17 Years | 0 (0.0%) | 4 (1.2%) |
| 18 to 34 Years | 0 (0.0%) | 0 (0.0%) |
| 35 to 64 Years | 31 (13.0%) | 14 (5.8%) |
| 65 to 74 Years | 31 (54.4%) | 29 (60.4%) |
| 75 Years and over | 0 (0.0%) | 0 (0.0%) |
Disability Class: Self-Care Difficulty
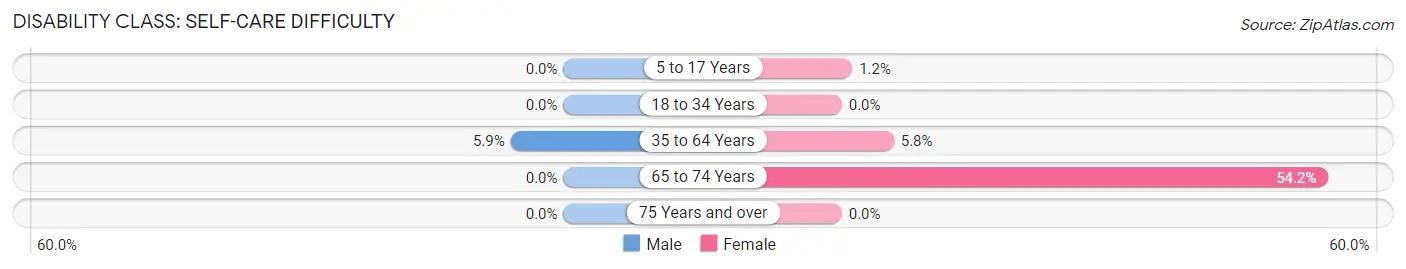
| Age Bracket | Male | Female |
| 5 to 17 Years | 0 (0.0%) | 4 (1.2%) |
| 18 to 34 Years | 0 (0.0%) | 0 (0.0%) |
| 35 to 64 Years | 14 (5.9%) | 14 (5.8%) |
| 65 to 74 Years | 0 (0.0%) | 26 (54.2%) |
| 75 Years and over | 0 (0.0%) | 0 (0.0%) |
Technology Access in Lame Deer
Computing Device Access in Lame Deer
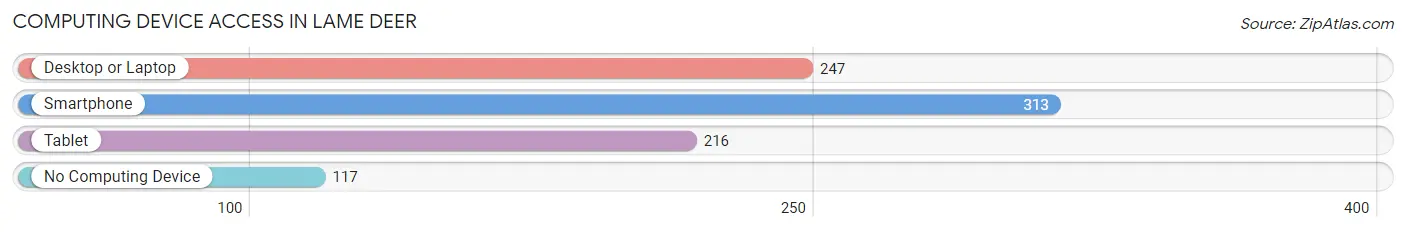
| Device Type | # Households | % Households |
| Desktop or Laptop | 247 | 51.0% |
| Smartphone | 313 | 64.7% |
| Tablet | 216 | 44.6% |
| No Computing Device | 117 | 24.2% |
| Total | 484 | 100.0% |
Internet Access in Lame Deer
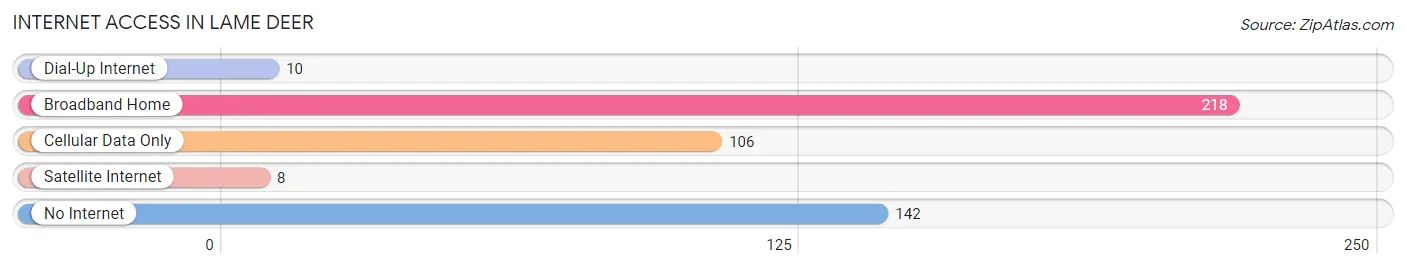
| Internet Type | # Households | % Households |
| Dial-Up Internet | 10 | 2.1% |
| Broadband Home | 218 | 45.0% |
| Cellular Data Only | 106 | 21.9% |
| Satellite Internet | 8 | 1.7% |
| No Internet | 142 | 29.3% |
| Total | 484 | 100.0% |
Lame Deer Summary
Lame Deer is a small town located in the Northern Cheyenne Indian Reservation in southeastern Montana. It is the tribal headquarters of the Northern Cheyenne Tribe and is the largest town in the reservation. The town is located in Rosebud County and has a population of 1,200 people as of the 2010 census.
History
The Northern Cheyenne Tribe has lived in the area for centuries, and the town of Lame Deer was established in the late 19th century. The town was named after Chief Lame Deer, a leader of the Northern Cheyenne Tribe. The town was originally a trading post and was used as a base for the tribe’s buffalo hunts.
In the early 20th century, the town was a major stop on the Chicago, Milwaukee, St. Paul and Pacific Railroad. The railroad brought in new settlers and businesses, and the town grew rapidly. In the 1950s, the town was incorporated and the population grew to over 1,000 people.
Geography
Lame Deer is located in southeastern Montana, in the Northern Cheyenne Indian Reservation. The town is situated in the foothills of the Little Rocky Mountains, and is surrounded by rolling hills and prairies. The town is located at an elevation of 3,400 feet and has a total area of 1.2 square miles.
The climate in Lame Deer is semi-arid, with hot summers and cold winters. The average annual temperature is 48°F, and the average annual precipitation is 13.5 inches.
Economy
The economy of Lame Deer is largely based on agriculture and tourism. The town is home to several small businesses, including a grocery store, a gas station, and a few restaurants. The town is also home to the Northern Cheyenne Tribal College, which offers courses in business, education, and health care.
The town is also home to the Northern Cheyenne Indian Reservation, which is a major source of employment for the town’s residents. The reservation is home to several businesses, including a casino, a hotel, and a golf course.
Demographics
As of the 2010 census, the population of Lame Deer was 1,200 people. The racial makeup of the town was 95.3% Native American, 2.3% White, 0.3% African American, 0.2% Asian, and 1.9% from other races. The median household income was $25,000, and the median age was 33 years.
Conclusion
Lame Deer is a small town located in the Northern Cheyenne Indian Reservation in southeastern Montana. The town has a long history, and is home to the Northern Cheyenne Tribe. The economy of the town is largely based on agriculture and tourism, and the town is home to several small businesses. The population of the town is 1,200 people, and the racial makeup is predominantly Native American.
Common Questions
What is Per Capita Income in Lame Deer?
Per Capita income in Lame Deer is $11,650.
What is the Median Family Income in Lame Deer?
Median Family Income in Lame Deer is $36,167.
What is the Median Household income in Lame Deer?
Median Household Income in Lame Deer is $31,250.
What is Income or Wage Gap in Lame Deer?
Income or Wage Gap in Lame Deer is 0.6%.
Women in Lame Deer earn 99.4 cents for every dollar earned by a man.
What is Family Income Deficit in Lame Deer?
Family Income Deficit in Lame Deer is $17,099.
Families that are below poverty line in Lame Deer earn $17,099 less on average than the poverty threshold level.
What is Inequality or Gini Index in Lame Deer?
Inequality or Gini Index in Lame Deer is 0.48.
What is the Total Population of Lame Deer?
Total Population of Lame Deer is 2,064.
What is the Total Male Population of Lame Deer?
Total Male Population of Lame Deer is 973.
What is the Total Female Population of Lame Deer?
Total Female Population of Lame Deer is 1,091.
What is the Ratio of Males per 100 Females in Lame Deer?
There are 89.18 Males per 100 Females in Lame Deer.
What is the Ratio of Females per 100 Males in Lame Deer?
There are 112.13 Females per 100 Males in Lame Deer.
What is the Median Population Age in Lame Deer?
Median Population Age in Lame Deer is 20.9 Years.
What is the Average Family Size in Lame Deer
Average Family Size in Lame Deer is 4.8 People.
What is the Average Household Size in Lame Deer
Average Household Size in Lame Deer is 4.2 People.
How Large is the Labor Force in Lame Deer?
There are 596 People in the Labor Forcein in Lame Deer.
What is the Percentage of People in the Labor Force in Lame Deer?
47.1% of People are in the Labor Force in Lame Deer.
What is the Unemployment Rate in Lame Deer?
Unemployment Rate in Lame Deer is 26.3%.