Craig, MT Map & Demographics
Craig Map
Craig Overview
$42,582
PER CAPITA INCOME
$108,750
AVG FAMILY INCOME
48.4%
WAGE / INCOME GAP [ % ]
51.6¢/ $1
WAGE / INCOME GAP [ $ ]
0.34
INEQUALITY / GINI INDEX
39
TOTAL POPULATION
21
MALE POPULATION
18
FEMALE POPULATION
116.67
MALES / 100 FEMALES
85.71
FEMALES / 100 MALES
52.4
MEDIAN AGE
2.1
AVG FAMILY SIZE
2.0
AVG HOUSEHOLD SIZE
23
LABOR FORCE [ PEOPLE ]
59.0%
PERCENT IN LABOR FORCE
Craig Area Codes
Income in Craig
Income Overview in Craig
| Characteristic | Number | Measure |
| Per Capita Income | 39 | $42,582 |
| Median Family Income | 12 | $108,750 |
| Mean Family Income | 12 | $119,533 |
| Median Household Income | 19 | $0 |
| Mean Household Income | 19 | $91,453 |
| Income Deficit | 12 | $0 |
| Wage / Income Gap (%) | 39 | 48.39% |
| Wage / Income Gap ($) | 39 | 51.61¢ per $1 |
| Gini / Inequality Index | 39 | 0.34 |
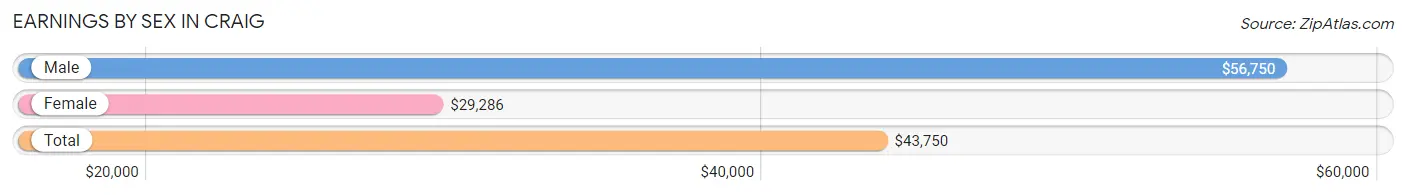
Earnings by Sex in Craig
Average Earnings in Craig are $43,750, $56,750 for men and $29,286 for women, a difference of 48.4%.
| Sex | Number | Average Earnings |
| Male | 15 (48.4%) | $56,750 |
| Female | 16 (51.6%) | $29,286 |
| Total | 31 (100.0%) | $43,750 |
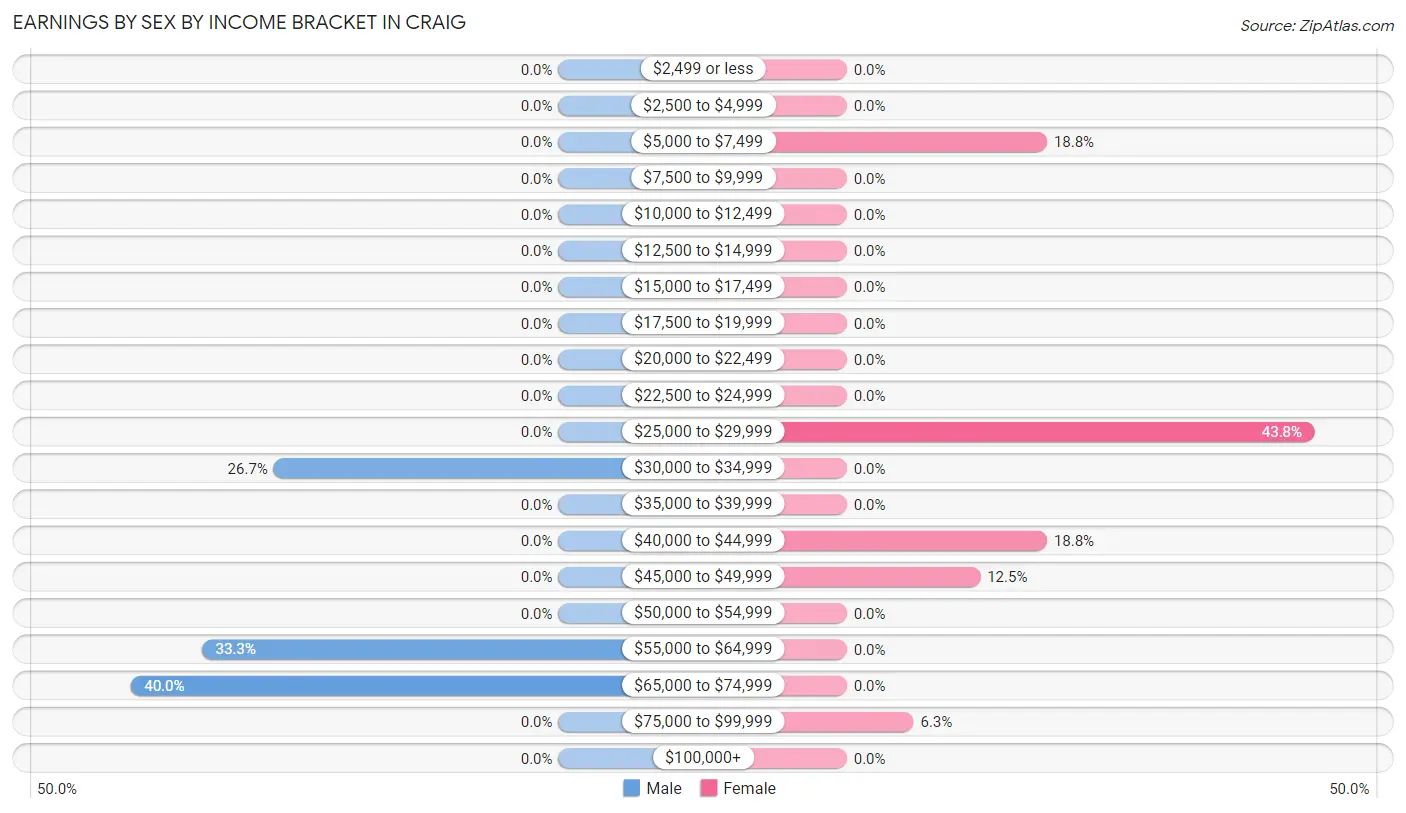
Earnings by Sex by Income Bracket in Craig
The most common earnings brackets in Craig are $65,000 to $74,999 for men (6 | 40.0%) and $25,000 to $29,999 for women (7 | 43.8%).
| Income | Male | Female |
| $2,499 or less | 0 (0.0%) | 0 (0.0%) |
| $2,500 to $4,999 | 0 (0.0%) | 0 (0.0%) |
| $5,000 to $7,499 | 0 (0.0%) | 3 (18.8%) |
| $7,500 to $9,999 | 0 (0.0%) | 0 (0.0%) |
| $10,000 to $12,499 | 0 (0.0%) | 0 (0.0%) |
| $12,500 to $14,999 | 0 (0.0%) | 0 (0.0%) |
| $15,000 to $17,499 | 0 (0.0%) | 0 (0.0%) |
| $17,500 to $19,999 | 0 (0.0%) | 0 (0.0%) |
| $20,000 to $22,499 | 0 (0.0%) | 0 (0.0%) |
| $22,500 to $24,999 | 0 (0.0%) | 0 (0.0%) |
| $25,000 to $29,999 | 0 (0.0%) | 7 (43.8%) |
| $30,000 to $34,999 | 4 (26.7%) | 0 (0.0%) |
| $35,000 to $39,999 | 0 (0.0%) | 0 (0.0%) |
| $40,000 to $44,999 | 0 (0.0%) | 3 (18.8%) |
| $45,000 to $49,999 | 0 (0.0%) | 2 (12.5%) |
| $50,000 to $54,999 | 0 (0.0%) | 0 (0.0%) |
| $55,000 to $64,999 | 5 (33.3%) | 0 (0.0%) |
| $65,000 to $74,999 | 6 (40.0%) | 0 (0.0%) |
| $75,000 to $99,999 | 0 (0.0%) | 1 (6.2%) |
| $100,000+ | 0 (0.0%) | 0 (0.0%) |
| Total | 15 (100.0%) | 16 (100.0%) |
Earnings by Sex by Educational Attainment in Craig
| Educational Attainment | Male Income | Female Income |
| Less than High School | - | - |
| High School Diploma | - | - |
| College or Associate's Degree | - | - |
| Bachelor's Degree | - | - |
| Graduate Degree | - | - |
| Total | $56,750 | $0 |
Family Income in Craig
Family Income Brackets in Craig
According to the Craig family income data, there are 6 families falling into the $75,000 to $99,999 income range, which is the most common income bracket and makes up 50.0% of all families.
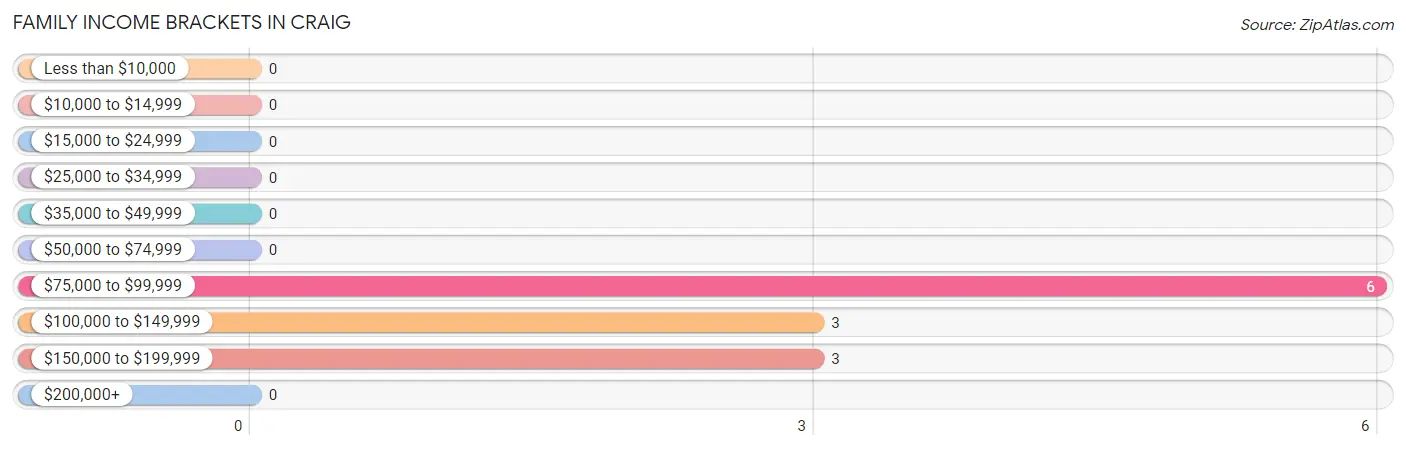
| Income Bracket | # Families | % Families |
| Less than $10,000 | 0 | 0.0% |
| $10,000 to $14,999 | 0 | 0.0% |
| $15,000 to $24,999 | 0 | 0.0% |
| $25,000 to $34,999 | 0 | 0.0% |
| $35,000 to $49,999 | 0 | 0.0% |
| $50,000 to $74,999 | 0 | 0.0% |
| $75,000 to $99,999 | 6 | 50.0% |
| $100,000 to $149,999 | 3 | 25.0% |
| $150,000 to $199,999 | 3 | 25.0% |
| $200,000+ | 0 | 0.0% |
Family Income by Famaliy Size in Craig
2-person families (9 | 75.0%) account for the highest median family income in Craig with $99,063 per family, while 2-person families (9 | 75.0%) have the highest median income of $49,532 per family member.
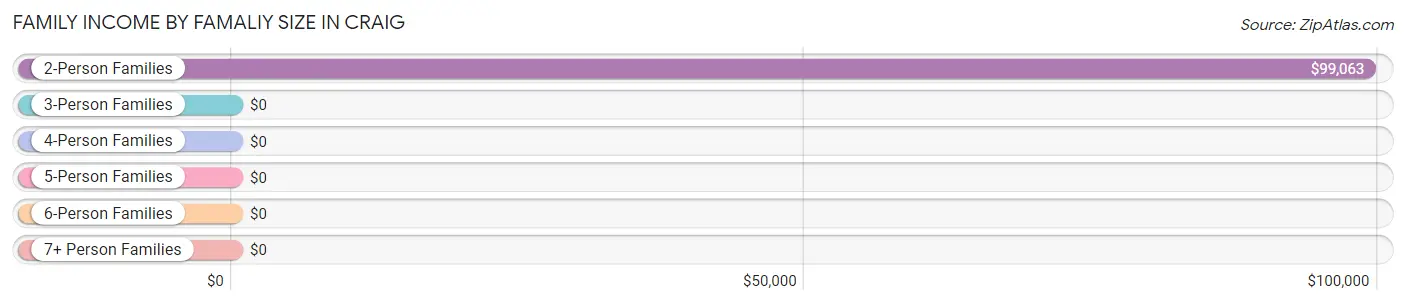
| Income Bracket | # Families | Median Income |
| 2-Person Families | 9 (75.0%) | $99,063 |
| 3-Person Families | 3 (25.0%) | $0 |
| 4-Person Families | 0 (0.0%) | $0 |
| 5-Person Families | 0 (0.0%) | $0 |
| 6-Person Families | 0 (0.0%) | $0 |
| 7+ Person Families | 0 (0.0%) | $0 |
| Total | 12 (100.0%) | $108,750 |
Family Income by Number of Earners in Craig
| Number of Earners | # Families | Median Income |
| No Earners | 0 (0.0%) | $0 |
| 1 Earner | 4 (33.3%) | $0 |
| 2 Earners | 5 (41.7%) | $0 |
| 3+ Earners | 3 (25.0%) | $0 |
| Total | 12 (100.0%) | $108,750 |
Household Income in Craig
Household Income Brackets in Craig
With 7 households falling in the category, the $100,000 to $149,999 income range is the most frequent in Craig, accounting for 36.8% of all households.
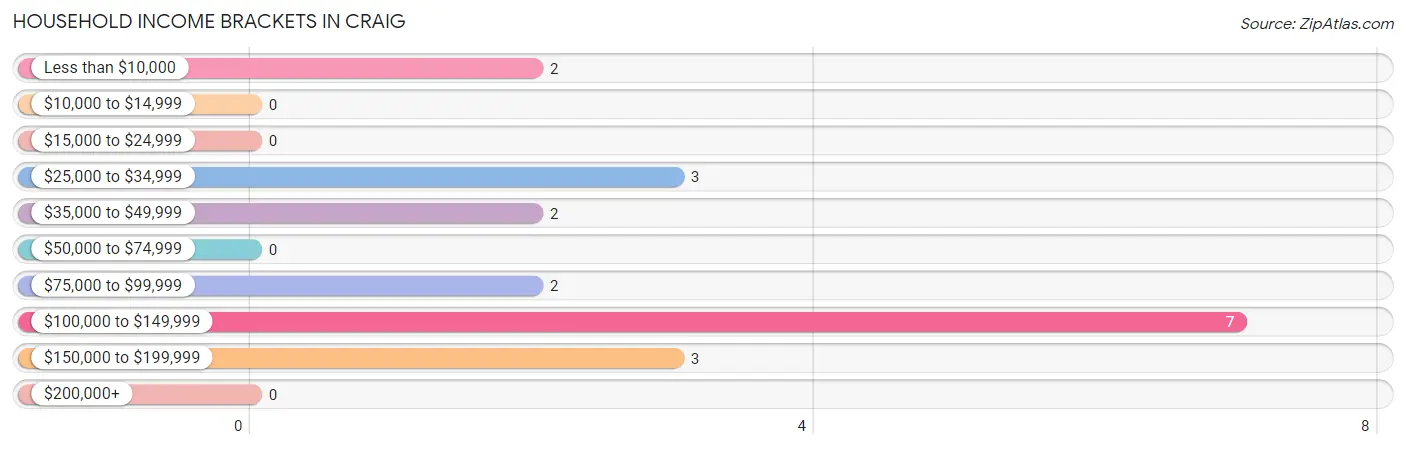
| Income Bracket | # Households | % Households |
| Less than $10,000 | 2 | 10.5% |
| $10,000 to $14,999 | 0 | 0.0% |
| $15,000 to $24,999 | 0 | 0.0% |
| $25,000 to $34,999 | 3 | 15.8% |
| $35,000 to $49,999 | 2 | 10.5% |
| $50,000 to $74,999 | 0 | 0.0% |
| $75,000 to $99,999 | 2 | 10.5% |
| $100,000 to $149,999 | 7 | 36.8% |
| $150,000 to $199,999 | 3 | 15.8% |
| $200,000+ | 0 | 0.0% |
Household Income by Householder Age in Craig
| Income Bracket | # Households | Median Income |
| 15 to 24 Years | 0 (0.0%) | $0 |
| 25 to 44 Years | 0 (0.0%) | $0 |
| 45 to 64 Years | 13 (68.4%) | $0 |
| 65+ Years | 6 (31.6%) | $0 |
| Total | 19 (100.0%) | $0 |
Poverty in Craig
Income Below Poverty by Sex and Age in Craig
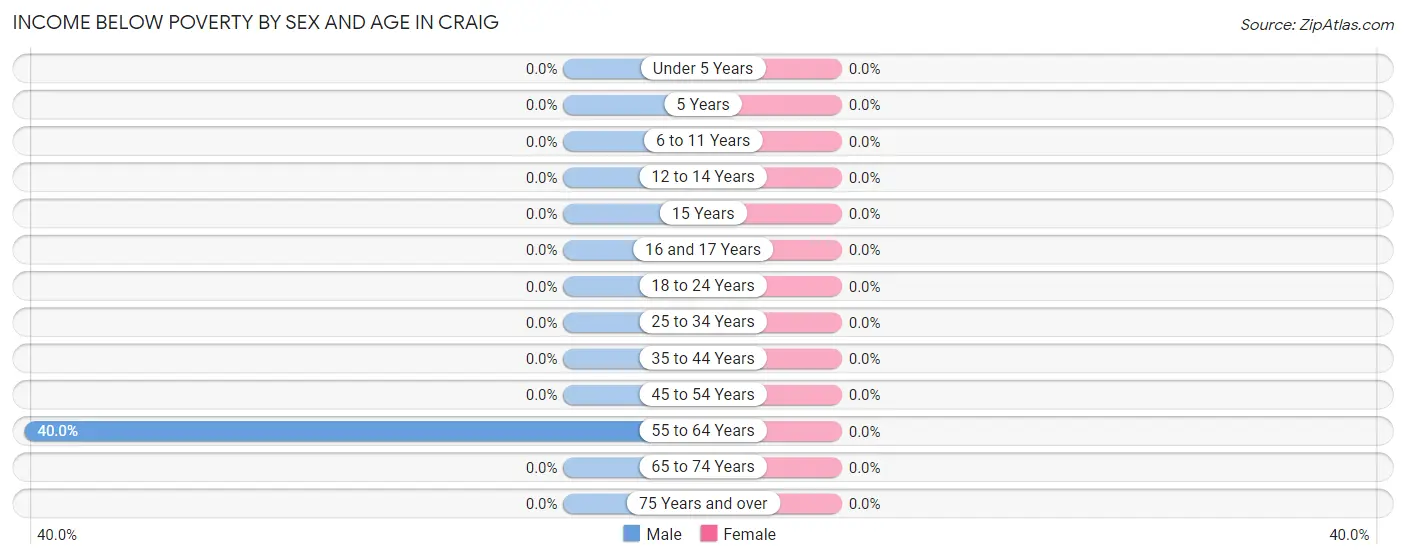
| Age Bracket | Male | Female |
| Under 5 Years | 0 (0.0%) | 0 (0.0%) |
| 5 Years | 0 (0.0%) | 0 (0.0%) |
| 6 to 11 Years | 0 (0.0%) | 0 (0.0%) |
| 12 to 14 Years | 0 (0.0%) | 0 (0.0%) |
| 15 Years | 0 (0.0%) | 0 (0.0%) |
| 16 and 17 Years | 0 (0.0%) | 0 (0.0%) |
| 18 to 24 Years | 0 (0.0%) | 0 (0.0%) |
| 25 to 34 Years | 0 (0.0%) | 0 (0.0%) |
| 35 to 44 Years | 0 (0.0%) | 0 (0.0%) |
| 45 to 54 Years | 0 (0.0%) | 0 (0.0%) |
| 55 to 64 Years | 2 (40.0%) | 0 (0.0%) |
| 65 to 74 Years | 0 (0.0%) | 0 (0.0%) |
| 75 Years and over | 0 (0.0%) | 0 (0.0%) |
| Total | 2 (9.5%) | 0 (0.0%) |
Income Above Poverty by Sex and Age in Craig
According to the poverty statistics in Craig, males aged 25 to 34 years and females aged 18 to 24 years are the age groups that are most secure financially, with 100.0% of males and 100.0% of females in these age groups living above the poverty line.
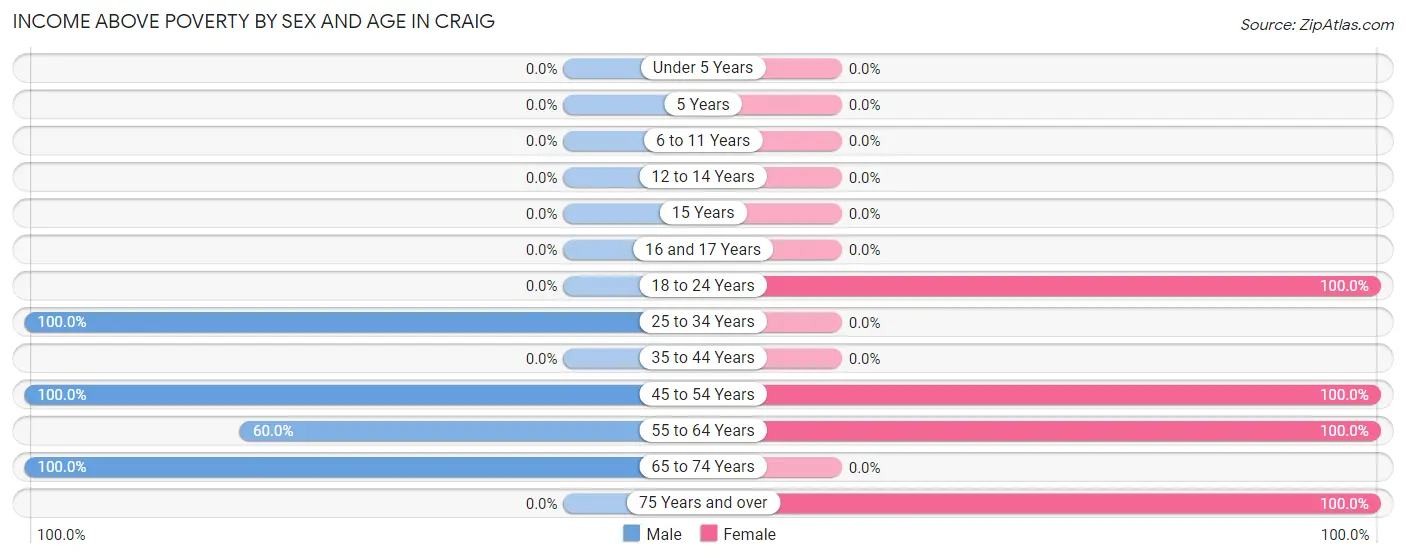
| Age Bracket | Male | Female |
| Under 5 Years | 0 (0.0%) | 0 (0.0%) |
| 5 Years | 0 (0.0%) | 0 (0.0%) |
| 6 to 11 Years | 0 (0.0%) | 0 (0.0%) |
| 12 to 14 Years | 0 (0.0%) | 0 (0.0%) |
| 15 Years | 0 (0.0%) | 0 (0.0%) |
| 16 and 17 Years | 0 (0.0%) | 0 (0.0%) |
| 18 to 24 Years | 0 (0.0%) | 6 (100.0%) |
| 25 to 34 Years | 5 (100.0%) | 0 (0.0%) |
| 35 to 44 Years | 0 (0.0%) | 0 (0.0%) |
| 45 to 54 Years | 6 (100.0%) | 7 (100.0%) |
| 55 to 64 Years | 3 (60.0%) | 3 (100.0%) |
| 65 to 74 Years | 5 (100.0%) | 0 (0.0%) |
| 75 Years and over | 0 (0.0%) | 2 (100.0%) |
| Total | 19 (90.5%) | 18 (100.0%) |
Income Below Poverty Among Married-Couple Families in Craig
| Children | Above Poverty | Below Poverty |
| No Children | 5 (100.0%) | 0 (0.0%) |
| 1 or 2 Children | 0 (0.0%) | 0 (0.0%) |
| 3 or 4 Children | 0 (0.0%) | 0 (0.0%) |
| 5 or more Children | 0 (0.0%) | 0 (0.0%) |
| Total | 5 (100.0%) | 0 (0.0%) |
Income Below Poverty Among Single-Parent Households in Craig
| Children | Single Father | Single Mother |
| No Children | 0 (0.0%) | 0 (0.0%) |
| 1 or 2 Children | 0 (0.0%) | 0 (0.0%) |
| 3 or 4 Children | 0 (0.0%) | 0 (0.0%) |
| 5 or more Children | 0 (0.0%) | 0 (0.0%) |
| Total | 0 (0.0%) | 0 (0.0%) |
Income Below Poverty Among Married-Couple vs Single-Parent Households in Craig
| Children | Married-Couple Families | Single-Parent Households |
| No Children | 0 (0.0%) | 0 (0.0%) |
| 1 or 2 Children | 0 (0.0%) | 0 (0.0%) |
| 3 or 4 Children | 0 (0.0%) | 0 (0.0%) |
| 5 or more Children | 0 (0.0%) | 0 (0.0%) |
| Total | 0 (0.0%) | 0 (0.0%) |
Race in Craig
The most populous races in Craig are White / Caucasian (29 | 74.4%), Two or more Races (9 | 23.1%), and Asian (1 | 2.6%).
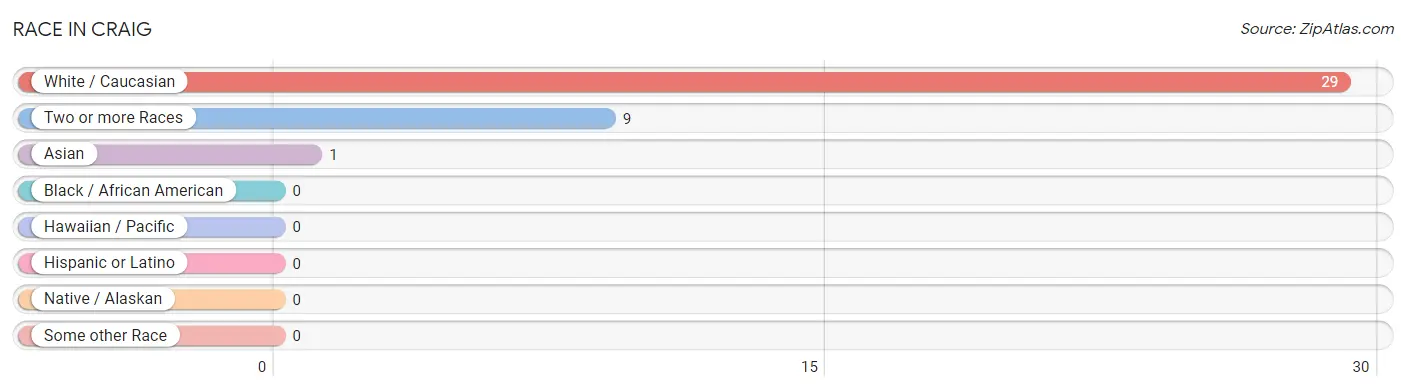
| Race | # Population | % Population |
| Asian | 1 | 2.6% |
| Black / African American | 0 | 0.0% |
| Hawaiian / Pacific | 0 | 0.0% |
| Hispanic or Latino | 0 | 0.0% |
| Native / Alaskan | 0 | 0.0% |
| White / Caucasian | 29 | 74.4% |
| Two or more Races | 9 | 23.1% |
| Some other Race | 0 | 0.0% |
| Total | 39 | 100.0% |
Ancestry in Craig
The most populous ancestries reported in Craig are German (21 | 53.8%), Irish (20 | 51.3%), Chippewa (9 | 23.1%), French (9 | 23.1%), and English (3 | 7.7%), together accounting for 159.0% of all Craig residents.
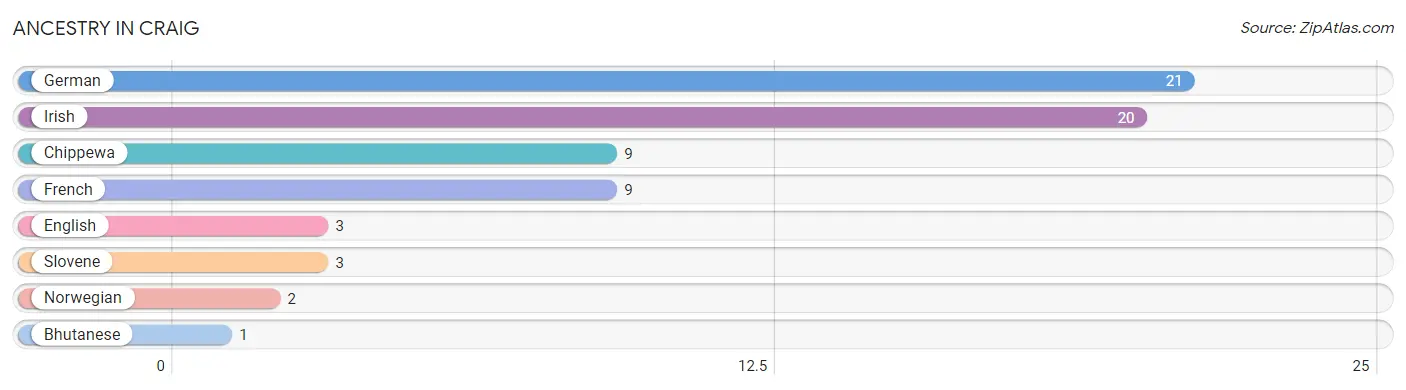
| Ancestry | # Population | % Population |
| Bhutanese | 1 | 2.6% |
| Chippewa | 9 | 23.1% |
| English | 3 | 7.7% |
| French | 9 | 23.1% |
| German | 21 | 53.8% |
| Irish | 20 | 51.3% |
| Norwegian | 2 | 5.1% |
| Slovene | 3 | 7.7% | View All 8 Rows |
Immigrants in Craig

| Immigration Origin | # Population | % Population | View All 0 Rows |
Sex and Age in Craig
Sex and Age in Craig
The most populous age groups in Craig are 30 to 34 Years (5 | 23.8%) for men and 50 to 54 Years (7 | 38.9%) for women.
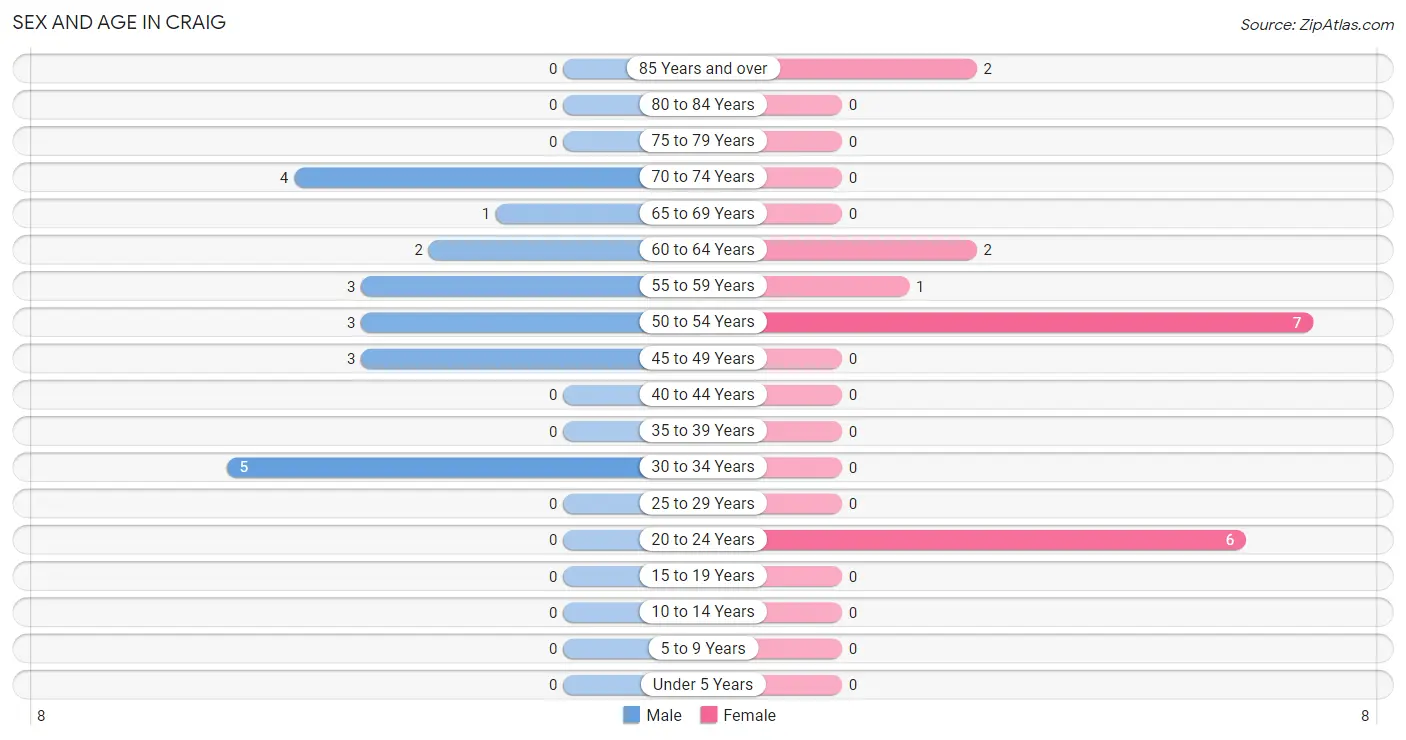
| Age Bracket | Male | Female |
| Under 5 Years | 0 (0.0%) | 0 (0.0%) |
| 5 to 9 Years | 0 (0.0%) | 0 (0.0%) |
| 10 to 14 Years | 0 (0.0%) | 0 (0.0%) |
| 15 to 19 Years | 0 (0.0%) | 0 (0.0%) |
| 20 to 24 Years | 0 (0.0%) | 6 (33.3%) |
| 25 to 29 Years | 0 (0.0%) | 0 (0.0%) |
| 30 to 34 Years | 5 (23.8%) | 0 (0.0%) |
| 35 to 39 Years | 0 (0.0%) | 0 (0.0%) |
| 40 to 44 Years | 0 (0.0%) | 0 (0.0%) |
| 45 to 49 Years | 3 (14.3%) | 0 (0.0%) |
| 50 to 54 Years | 3 (14.3%) | 7 (38.9%) |
| 55 to 59 Years | 3 (14.3%) | 1 (5.6%) |
| 60 to 64 Years | 2 (9.5%) | 2 (11.1%) |
| 65 to 69 Years | 1 (4.8%) | 0 (0.0%) |
| 70 to 74 Years | 4 (19.1%) | 0 (0.0%) |
| 75 to 79 Years | 0 (0.0%) | 0 (0.0%) |
| 80 to 84 Years | 0 (0.0%) | 0 (0.0%) |
| 85 Years and over | 0 (0.0%) | 2 (11.1%) |
| Total | 21 (100.0%) | 18 (100.0%) |
Families and Households in Craig
Median Family Size in Craig
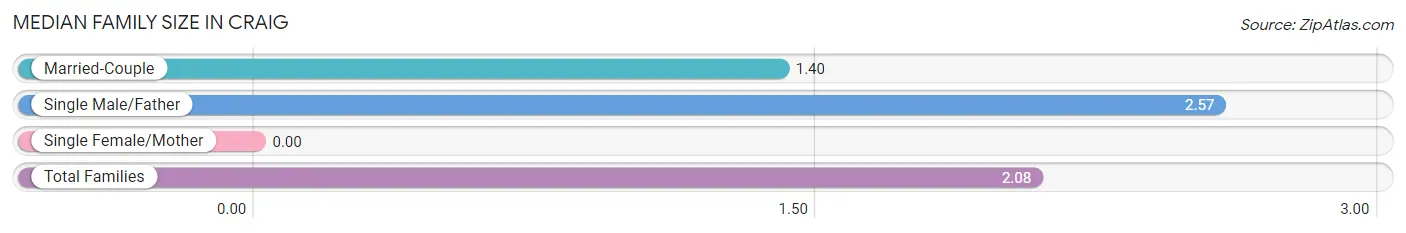
| Family Type | # Families | Family Size |
| Married-Couple | 5 (41.7%) | 1.40 |
| Single Male/Father | 7 (58.3%) | 2.57 |
| Single Female/Mother | 0 (0.0%) | - |
| Total Families | 12 (100.0%) | 2.08 |
Median Household Size in Craig
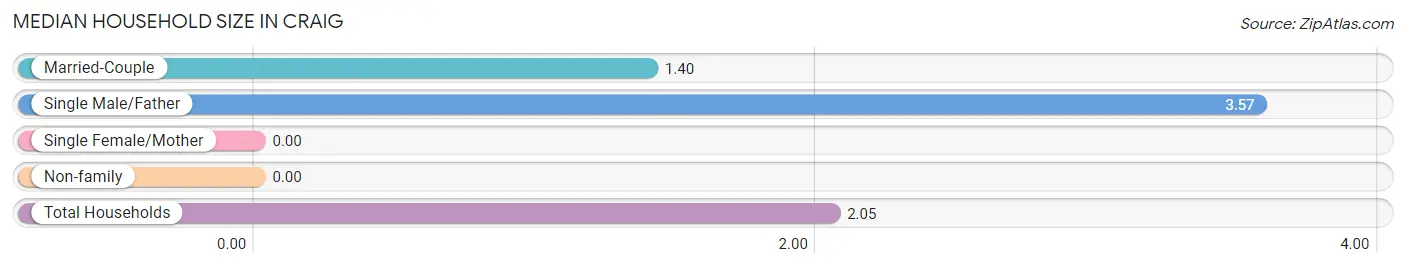
| Household Type | # Households | Household Size |
| Married-Couple | 5 (26.3%) | 1.40 |
| Single Male/Father | 7 (36.8%) | 3.57 |
| Single Female/Mother | 0 (0.0%) | - |
| Non-family | 7 (36.8%) | - |
| Total Households | 19 (100.0%) | 2.05 |
Household Size by Marriage Status in Craig
Out of a total of 19 households in Craig, 12 (63.2%) are family households, while 7 (36.8%) are nonfamily households. The most numerous type of family households are 3-person households, comprising 7, and the most common type of nonfamily households are 1-person households, comprising 7.
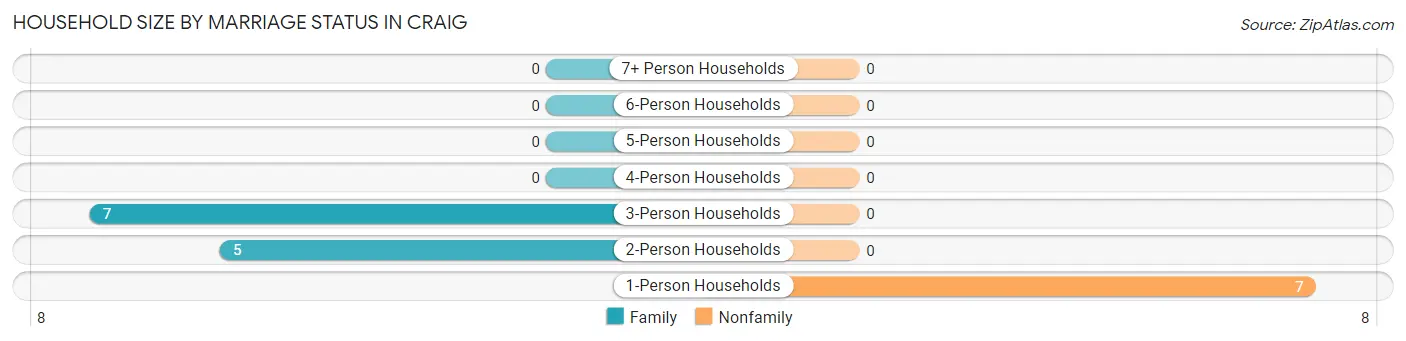
| Household Size | Family Households | Nonfamily Households |
| 1-Person Households | - | 7 (36.8%) |
| 2-Person Households | 5 (26.3%) | 0 (0.0%) |
| 3-Person Households | 7 (36.8%) | 0 (0.0%) |
| 4-Person Households | 0 (0.0%) | 0 (0.0%) |
| 5-Person Households | 0 (0.0%) | 0 (0.0%) |
| 6-Person Households | 0 (0.0%) | 0 (0.0%) |
| 7+ Person Households | 0 (0.0%) | 0 (0.0%) |
| Total | 12 (63.2%) | 7 (36.8%) |
Female Fertility in Craig
Fertility by Age in Craig
| Age Bracket | Women with Births | Births / 1,000 Women |
| 15 to 19 years | 0 (0.0%) | 0.0 |
| 20 to 34 years | 0 (0.0%) | 0.0 |
| 35 to 50 years | 0 (0.0%) | 0.0 |
| Total | 0 (0.0%) | 0.0 |
Fertility by Age by Marriage Status in Craig
| Age Bracket | Married | Unmarried |
| 15 to 19 years | 0 (0.0%) | 0 (0.0%) |
| 20 to 34 years | 0 (0.0%) | 0 (0.0%) |
| 35 to 50 years | 0 (0.0%) | 0 (0.0%) |
| Total | 0 (0.0%) | 0 (0.0%) |
Fertility by Education in Craig
| Educational Attainment | Women with Births | Births / 1,000 Women |
| Less than High School | 0 (0.0%) | 0.0 |
| High School Diploma | 0 (0.0%) | 0.0 |
| College or Associate's Degree | 0 (0.0%) | 0.0 |
| Bachelor's Degree | 0 (0.0%) | 0.0 |
| Graduate Degree | 0 (0.0%) | 0.0 |
| Total | 0 (0.0%) | 0.0 |
Fertility by Education by Marriage Status in Craig
| Educational Attainment | Married | Unmarried |
| Less than High School | 0 (0.0%) | 0 (0.0%) |
| High School Diploma | 0 (0.0%) | 0 (0.0%) |
| College or Associate's Degree | 0 (0.0%) | 0 (0.0%) |
| Bachelor's Degree | 0 (0.0%) | 0 (0.0%) |
| Graduate Degree | 0 (0.0%) | 0 (0.0%) |
| Total | 0 (0.0%) | 0 (0.0%) |
Employment Characteristics in Craig
Employment by Class of Employer in Craig
Among the 23 employed individuals in Craig, private company employees (13 | 56.5%), self-employed (incorporated) (6 | 26.1%), and self-employed (not incorporated) (3 | 13.0%) make up the most common classes of employment.
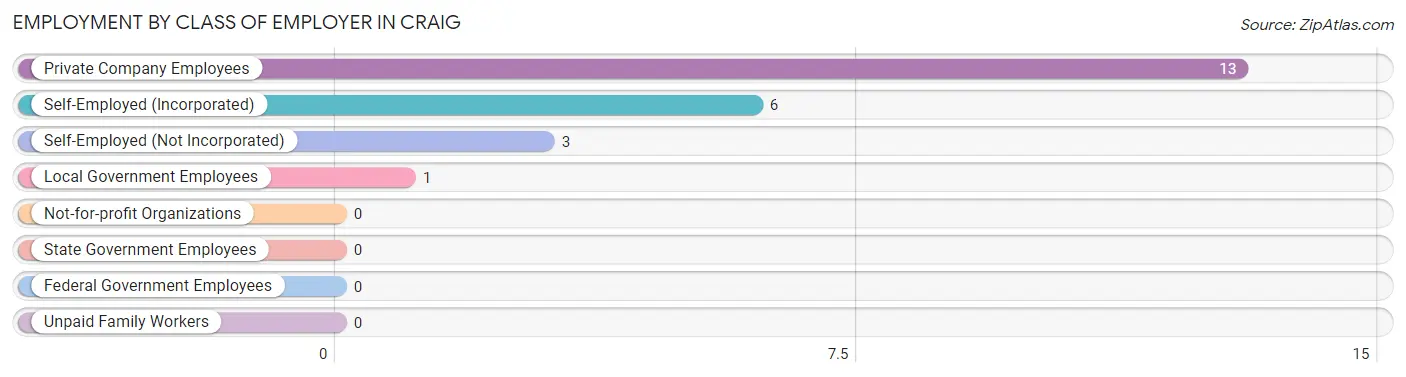
| Employer Class | # Employees | % Employees |
| Private Company Employees | 13 | 56.5% |
| Self-Employed (Incorporated) | 6 | 26.1% |
| Self-Employed (Not Incorporated) | 3 | 13.0% |
| Not-for-profit Organizations | 0 | 0.0% |
| Local Government Employees | 1 | 4.3% |
| State Government Employees | 0 | 0.0% |
| Federal Government Employees | 0 | 0.0% |
| Unpaid Family Workers | 0 | 0.0% |
| Total | 23 | 100.0% |
Employment Status by Age in Craig
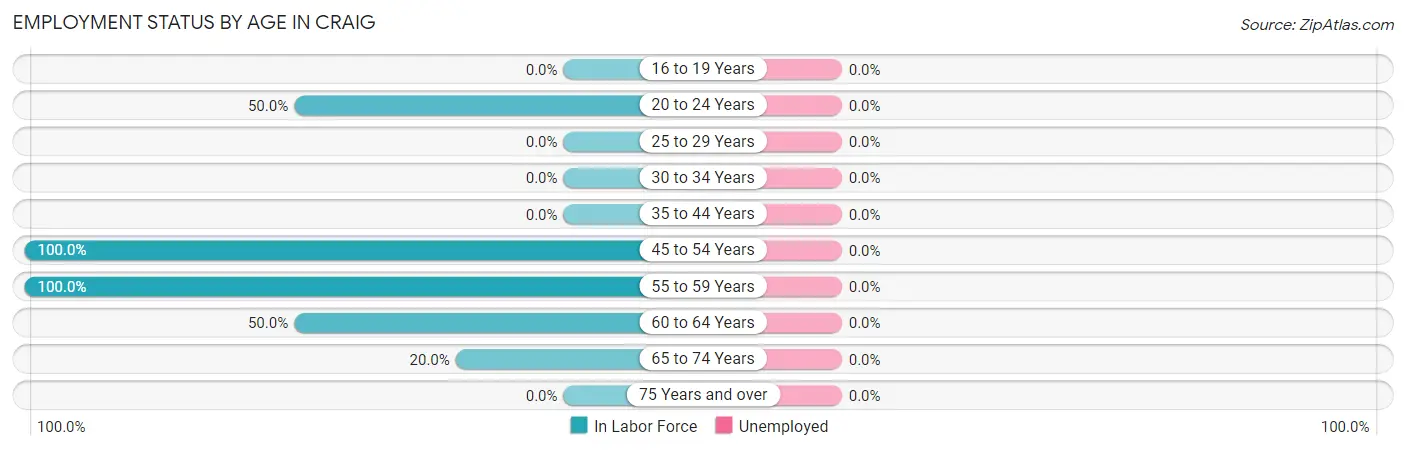
| Age Bracket | In Labor Force | Unemployed |
| 16 to 19 Years | 0 (0.0%) | 0 (0.0%) |
| 20 to 24 Years | 3 (50.0%) | 0 (0.0%) |
| 25 to 29 Years | 0 (0.0%) | 0 (0.0%) |
| 30 to 34 Years | 0 (0.0%) | 0 (0.0%) |
| 35 to 44 Years | 0 (0.0%) | 0 (0.0%) |
| 45 to 54 Years | 13 (100.0%) | 0 (0.0%) |
| 55 to 59 Years | 4 (100.0%) | 0 (0.0%) |
| 60 to 64 Years | 2 (50.0%) | 0 (0.0%) |
| 65 to 74 Years | 1 (20.0%) | 0 (0.0%) |
| 75 Years and over | 0 (0.0%) | 0 (0.0%) |
| Total | 23 (59.0%) | 0 (0.0%) |
Employment Status by Educational Attainment in Craig
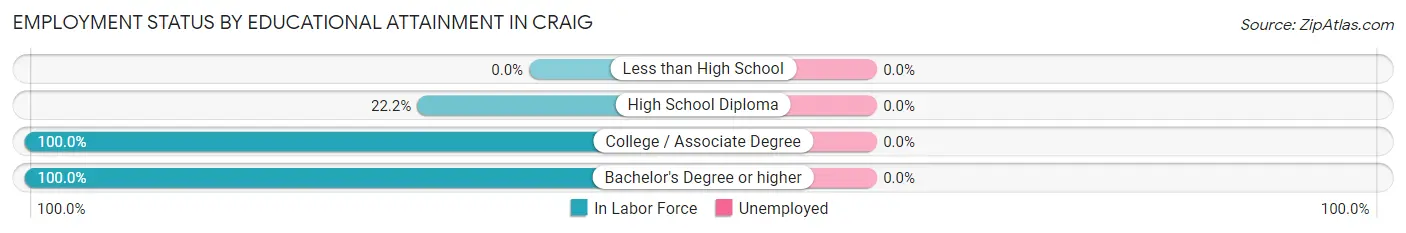
| Educational Attainment | In Labor Force | Unemployed |
| Less than High School | 0 (0.0%) | 0 (0.0%) |
| High School Diploma | 2 (22.2%) | 0 (0.0%) |
| College / Associate Degree | 10 (100.0%) | 0 (0.0%) |
| Bachelor's Degree or higher | 7 (100.0%) | 0 (0.0%) |
| Total | 19 (73.1%) | 0 (0.0%) |
Employment Occupations by Sex in Craig
Management, Business, Science and Arts Occupations
The most common Management, Business, Science and Arts occupations in Craig are Business & Financial (3 | 13.0%), Health Diagnosing & Treating (2 | 8.7%), Community & Social Service (1 | 4.3%), and Arts, Media & Entertainment (1 | 4.3%).
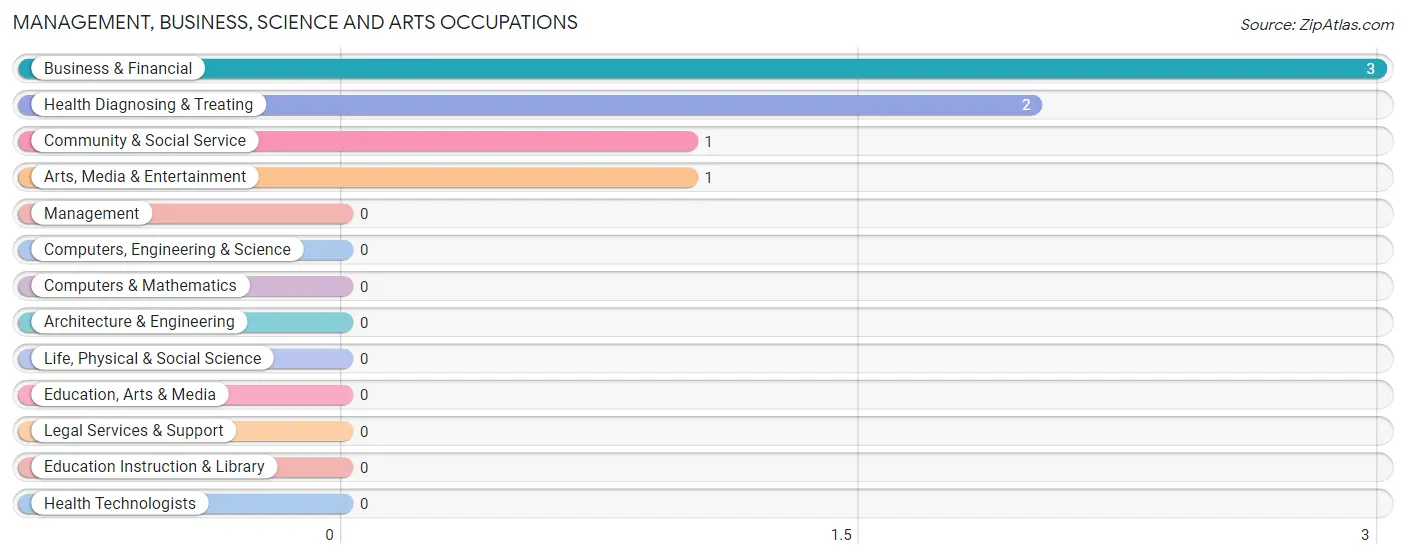
Management, Business, Science and Arts Occupations by Sex
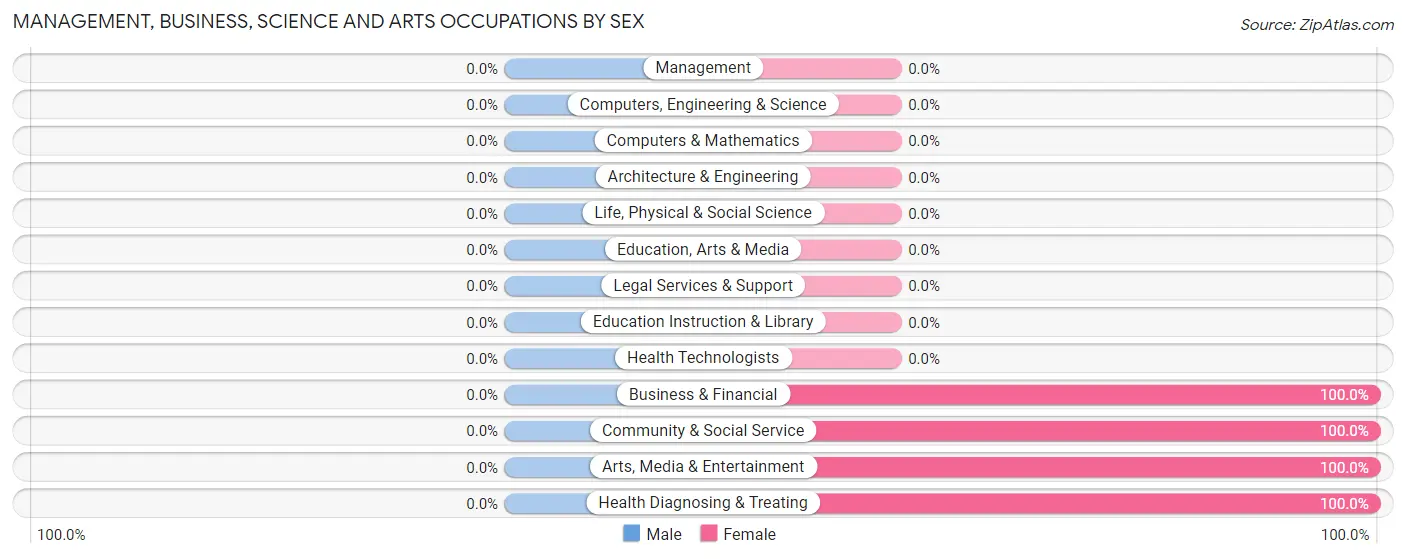
| Occupation | Male | Female |
| Management | 0 (0.0%) | 0 (0.0%) |
| Business & Financial | 0 (0.0%) | 3 (100.0%) |
| Computers, Engineering & Science | 0 (0.0%) | 0 (0.0%) |
| Computers & Mathematics | 0 (0.0%) | 0 (0.0%) |
| Architecture & Engineering | 0 (0.0%) | 0 (0.0%) |
| Life, Physical & Social Science | 0 (0.0%) | 0 (0.0%) |
| Community & Social Service | 0 (0.0%) | 1 (100.0%) |
| Education, Arts & Media | 0 (0.0%) | 0 (0.0%) |
| Legal Services & Support | 0 (0.0%) | 0 (0.0%) |
| Education Instruction & Library | 0 (0.0%) | 0 (0.0%) |
| Arts, Media & Entertainment | 0 (0.0%) | 1 (100.0%) |
| Health Diagnosing & Treating | 0 (0.0%) | 2 (100.0%) |
| Health Technologists | 0 (0.0%) | 0 (0.0%) |
| Total (Category) | 0 (0.0%) | 6 (100.0%) |
| Total (Overall) | 10 (43.5%) | 13 (56.5%) |
Services Occupations
Services Occupations by Sex
| Occupation | Male | Female |
| Healthcare Support | 0 (0.0%) | 0 (0.0%) |
| Security & Protection | 0 (0.0%) | 0 (0.0%) |
| Firefighting & Prevention | 0 (0.0%) | 0 (0.0%) |
| Law Enforcement | 0 (0.0%) | 0 (0.0%) |
| Food Preparation & Serving | 0 (0.0%) | 0 (0.0%) |
| Cleaning & Maintenance | 0 (0.0%) | 0 (0.0%) |
| Personal Care & Service | 0 (0.0%) | 0 (0.0%) |
| Total (Category) | 0 (0.0%) | 0 (0.0%) |
| Total (Overall) | 10 (43.5%) | 13 (56.5%) |
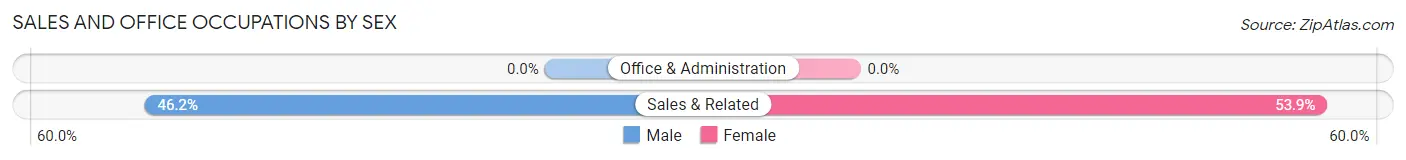
Sales and Office Occupations
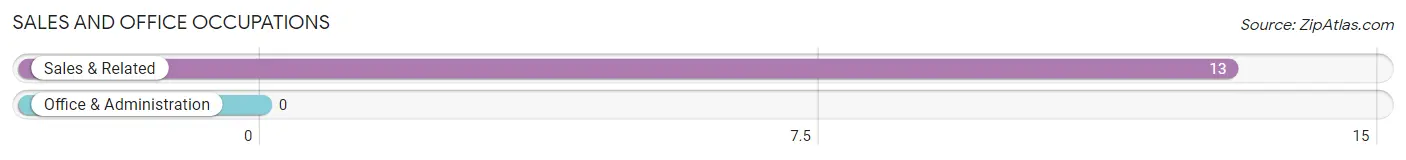
The most common Sales and Office occupations in Craig are , and Sales & Related (13 | 56.5%).
Sales and Office Occupations by Sex
| Occupation | Male | Female |
| Sales & Related | 6 (46.2%) | 7 (53.8%) |
| Office & Administration | 0 (0.0%) | 0 (0.0%) |
| Total (Category) | 6 (46.2%) | 7 (53.8%) |
| Total (Overall) | 10 (43.5%) | 13 (56.5%) |
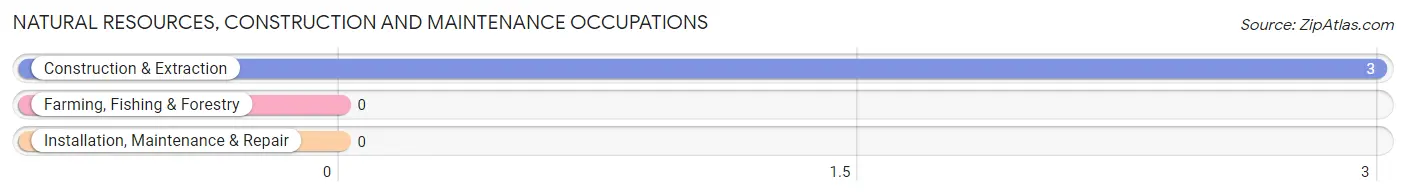
Natural Resources, Construction and Maintenance Occupations
The most common Natural Resources, Construction and Maintenance occupations in Craig are , and Construction & Extraction (3 | 13.0%).
Natural Resources, Construction and Maintenance Occupations by Sex
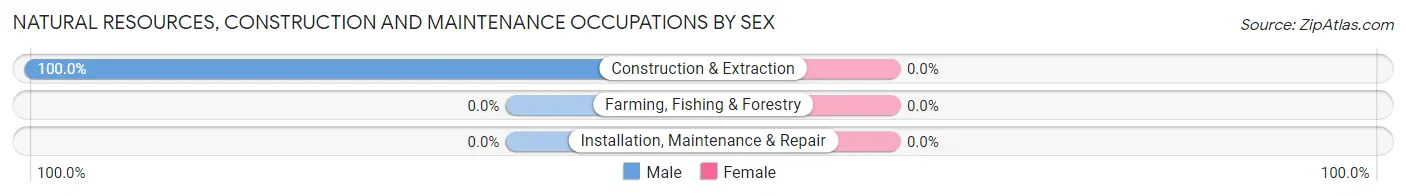
| Occupation | Male | Female |
| Farming, Fishing & Forestry | 0 (0.0%) | 0 (0.0%) |
| Construction & Extraction | 3 (100.0%) | 0 (0.0%) |
| Installation, Maintenance & Repair | 0 (0.0%) | 0 (0.0%) |
| Total (Category) | 3 (100.0%) | 0 (0.0%) |
| Total (Overall) | 10 (43.5%) | 13 (56.5%) |
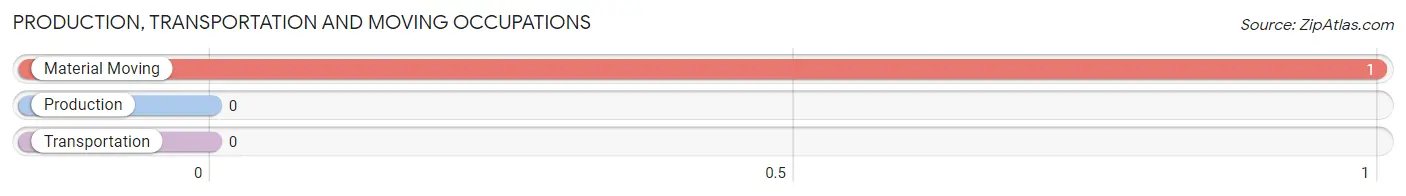
Production, Transportation and Moving Occupations
The most common Production, Transportation and Moving occupations in Craig are , and Material Moving (1 | 4.3%).
Production, Transportation and Moving Occupations by Sex
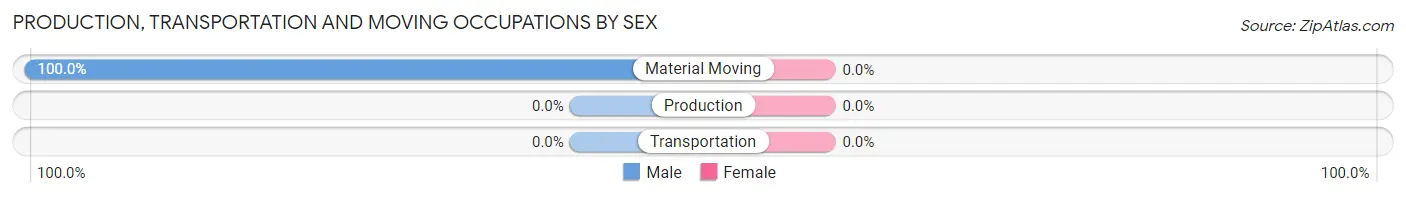
| Occupation | Male | Female |
| Production | 0 (0.0%) | 0 (0.0%) |
| Transportation | 0 (0.0%) | 0 (0.0%) |
| Material Moving | 1 (100.0%) | 0 (0.0%) |
| Total (Category) | 1 (100.0%) | 0 (0.0%) |
| Total (Overall) | 10 (43.5%) | 13 (56.5%) |
Employment Industries by Sex in Craig
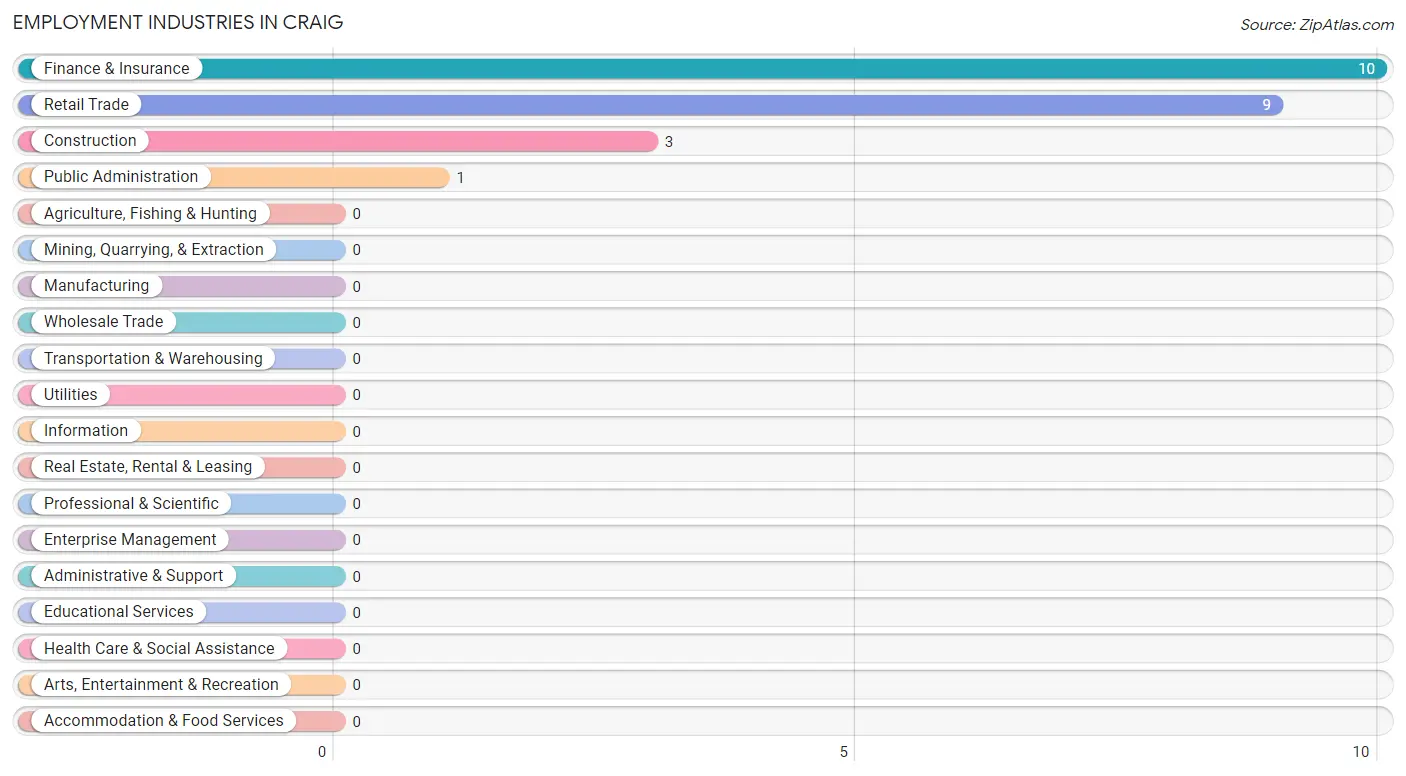
Employment Industries in Craig
The major employment industries in Craig include Finance & Insurance (10 | 43.5%), Retail Trade (9 | 39.1%), Construction (3 | 13.0%), and Public Administration (1 | 4.3%).
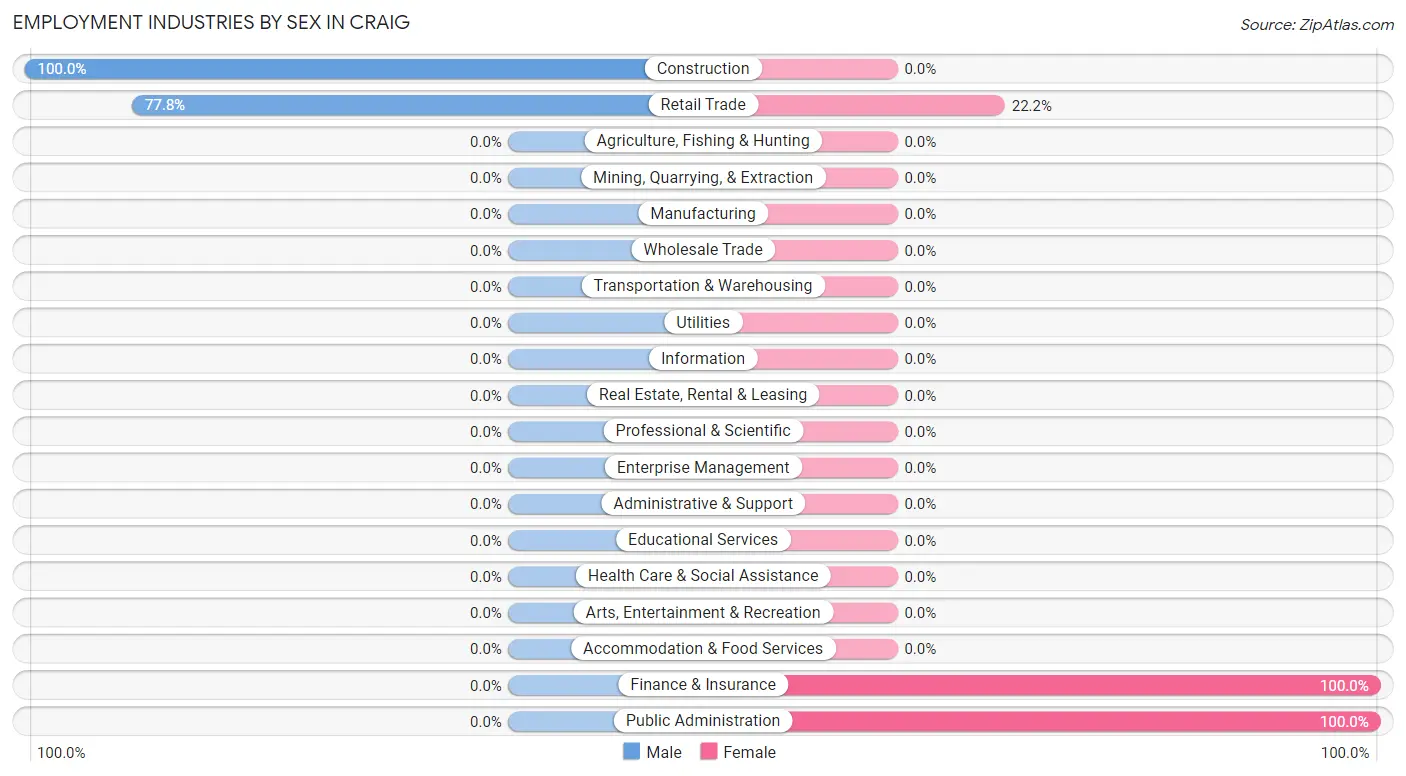
Employment Industries by Sex in Craig
The Craig industries that see more men than women are Construction (100.0%), and Retail Trade (77.8%), whereas the industries that tend to have a higher number of women are Finance & Insurance (100.0%), Public Administration (100.0%), and Retail Trade (22.2%).
| Industry | Male | Female |
| Agriculture, Fishing & Hunting | 0 (0.0%) | 0 (0.0%) |
| Mining, Quarrying, & Extraction | 0 (0.0%) | 0 (0.0%) |
| Construction | 3 (100.0%) | 0 (0.0%) |
| Manufacturing | 0 (0.0%) | 0 (0.0%) |
| Wholesale Trade | 0 (0.0%) | 0 (0.0%) |
| Retail Trade | 7 (77.8%) | 2 (22.2%) |
| Transportation & Warehousing | 0 (0.0%) | 0 (0.0%) |
| Utilities | 0 (0.0%) | 0 (0.0%) |
| Information | 0 (0.0%) | 0 (0.0%) |
| Finance & Insurance | 0 (0.0%) | 10 (100.0%) |
| Real Estate, Rental & Leasing | 0 (0.0%) | 0 (0.0%) |
| Professional & Scientific | 0 (0.0%) | 0 (0.0%) |
| Enterprise Management | 0 (0.0%) | 0 (0.0%) |
| Administrative & Support | 0 (0.0%) | 0 (0.0%) |
| Educational Services | 0 (0.0%) | 0 (0.0%) |
| Health Care & Social Assistance | 0 (0.0%) | 0 (0.0%) |
| Arts, Entertainment & Recreation | 0 (0.0%) | 0 (0.0%) |
| Accommodation & Food Services | 0 (0.0%) | 0 (0.0%) |
| Public Administration | 0 (0.0%) | 1 (100.0%) |
| Total | 10 (43.5%) | 13 (56.5%) |
Education in Craig
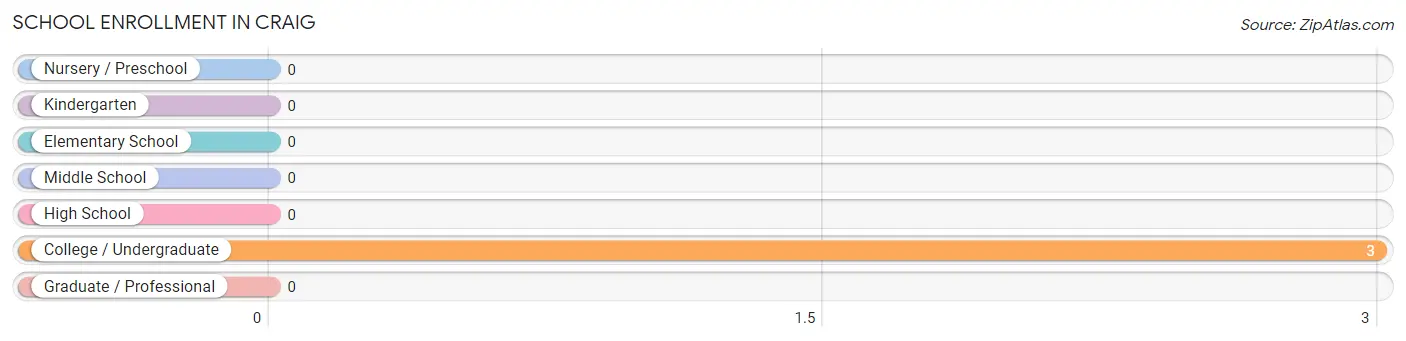
School Enrollment in Craig
| School Level | # Students | % Students |
| Nursery / Preschool | 0 | 0.0% |
| Kindergarten | 0 | 0.0% |
| Elementary School | 0 | 0.0% |
| Middle School | 0 | 0.0% |
| High School | 0 | 0.0% |
| College / Undergraduate | 3 | 100.0% |
| Graduate / Professional | 0 | 0.0% |
| Total | 3 | 100.0% |
School Enrollment by Age by Funding Source in Craig
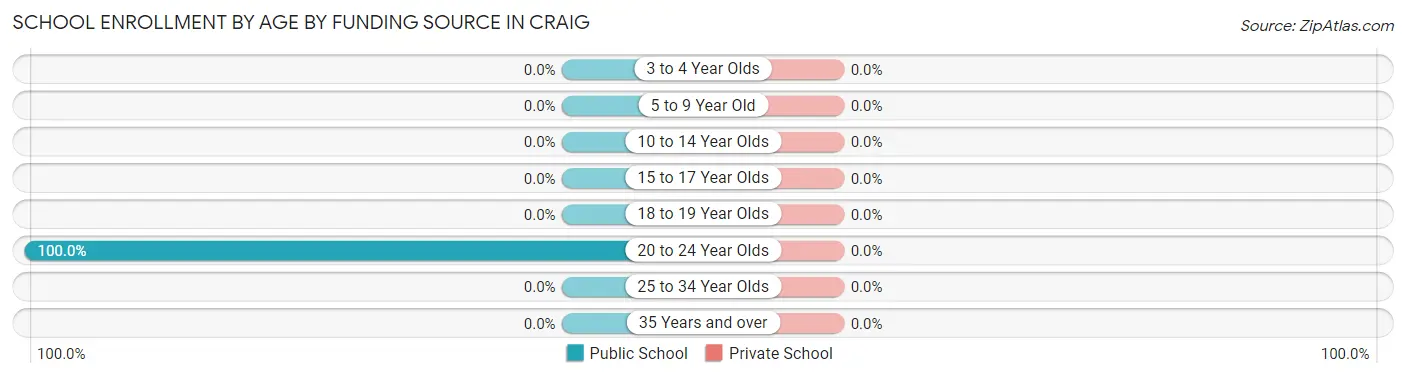
| Age Bracket | Public School | Private School |
| 3 to 4 Year Olds | 0 (0.0%) | 0 (0.0%) |
| 5 to 9 Year Old | 0 (0.0%) | 0 (0.0%) |
| 10 to 14 Year Olds | 0 (0.0%) | 0 (0.0%) |
| 15 to 17 Year Olds | 0 (0.0%) | 0 (0.0%) |
| 18 to 19 Year Olds | 0 (0.0%) | 0 (0.0%) |
| 20 to 24 Year Olds | 3 (100.0%) | 0 (0.0%) |
| 25 to 34 Year Olds | 0 (0.0%) | 0 (0.0%) |
| 35 Years and over | 0 (0.0%) | 0 (0.0%) |
| Total | 3 (100.0%) | 0 (0.0%) |
Educational Attainment by Field of Study in Craig
Bio, nature & agricultural (6 | 66.7%), and education (3 | 33.3%) are the most common fields of study among 9 individuals in Craig who have obtained a bachelor's degree or higher.
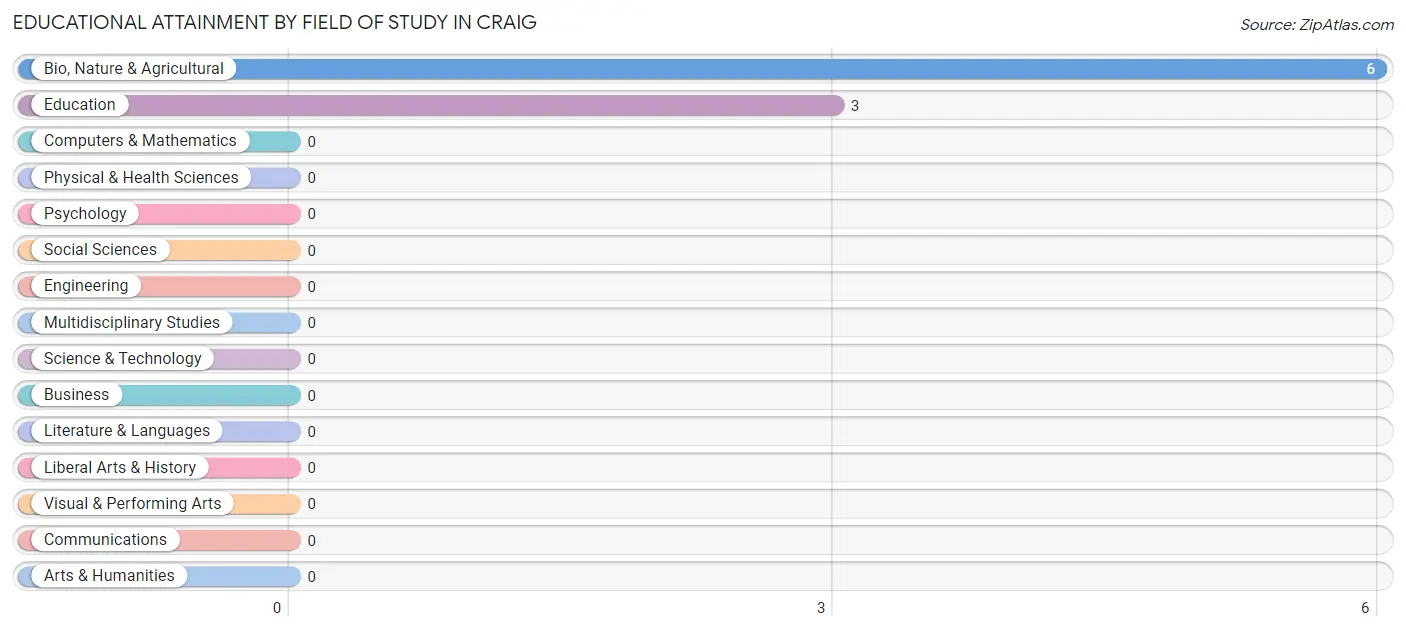
| Field of Study | # Graduates | % Graduates |
| Computers & Mathematics | 0 | 0.0% |
| Bio, Nature & Agricultural | 6 | 66.7% |
| Physical & Health Sciences | 0 | 0.0% |
| Psychology | 0 | 0.0% |
| Social Sciences | 0 | 0.0% |
| Engineering | 0 | 0.0% |
| Multidisciplinary Studies | 0 | 0.0% |
| Science & Technology | 0 | 0.0% |
| Business | 0 | 0.0% |
| Education | 3 | 33.3% |
| Literature & Languages | 0 | 0.0% |
| Liberal Arts & History | 0 | 0.0% |
| Visual & Performing Arts | 0 | 0.0% |
| Communications | 0 | 0.0% |
| Arts & Humanities | 0 | 0.0% |
| Total | 9 | 100.0% |
Transportation & Commute in Craig
Vehicle Availability by Sex in Craig
The most prevalent vehicle ownership categories in Craig are males with 3 vehicles (7, accounting for 70.0%) and females with 3 vehicles (6, making up 53.8%).
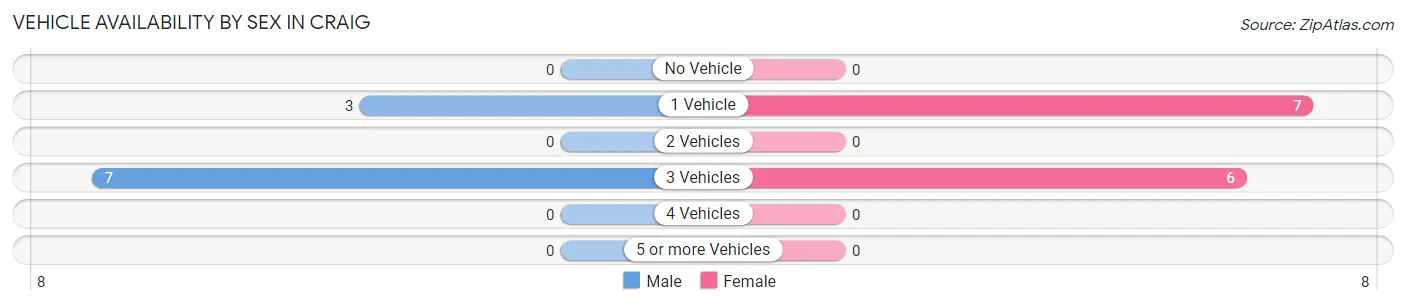
| Vehicles Available | Male | Female |
| No Vehicle | 0 (0.0%) | 0 (0.0%) |
| 1 Vehicle | 3 (30.0%) | 7 (53.8%) |
| 2 Vehicles | 0 (0.0%) | 0 (0.0%) |
| 3 Vehicles | 7 (70.0%) | 6 (46.2%) |
| 4 Vehicles | 0 (0.0%) | 0 (0.0%) |
| 5 or more Vehicles | 0 (0.0%) | 0 (0.0%) |
| Total | 10 (100.0%) | 13 (100.0%) |
Commute Time in Craig
The most frequently occuring commute durations in Craig are 35 to 39 minutes (7 commuters, 36.8%), less than 5 minutes (6 commuters, 31.6%), and 45 to 59 minutes (3 commuters, 15.8%).
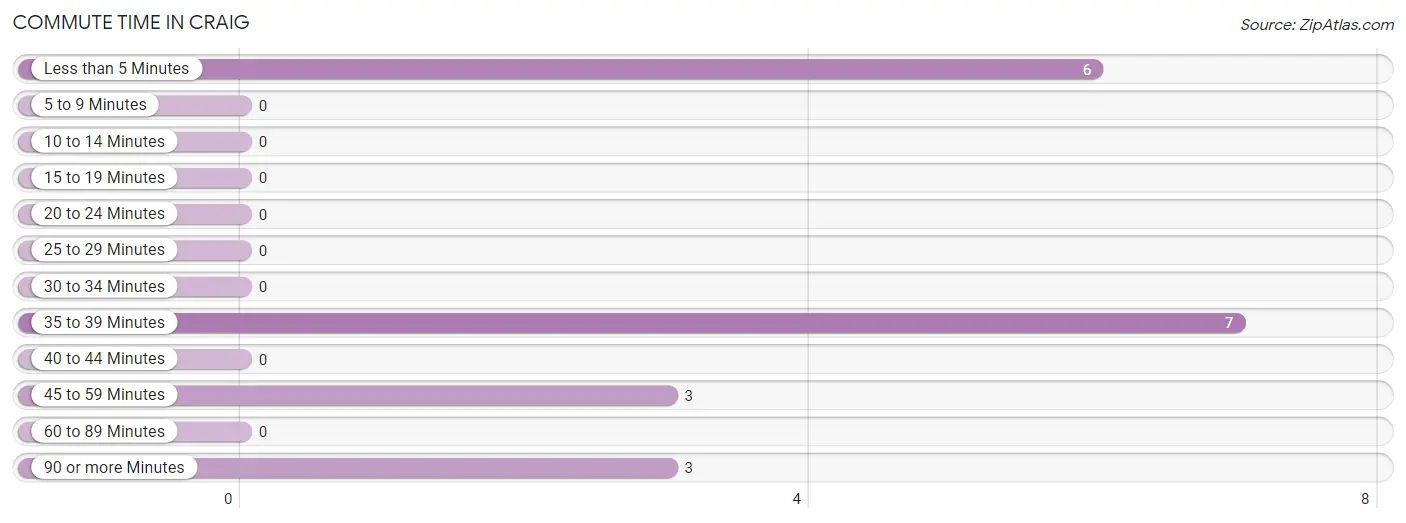
| Commute Time | # Commuters | % Commuters |
| Less than 5 Minutes | 6 | 31.6% |
| 5 to 9 Minutes | 0 | 0.0% |
| 10 to 14 Minutes | 0 | 0.0% |
| 15 to 19 Minutes | 0 | 0.0% |
| 20 to 24 Minutes | 0 | 0.0% |
| 25 to 29 Minutes | 0 | 0.0% |
| 30 to 34 Minutes | 0 | 0.0% |
| 35 to 39 Minutes | 7 | 36.8% |
| 40 to 44 Minutes | 0 | 0.0% |
| 45 to 59 Minutes | 3 | 15.8% |
| 60 to 89 Minutes | 0 | 0.0% |
| 90 or more Minutes | 3 | 15.8% |
Commute Time by Sex in Craig
The most common commute times in Craig are less than 5 minutes (6 commuters, 60.0%) for males and 35 to 39 minutes (7 commuters, 77.8%) for females.
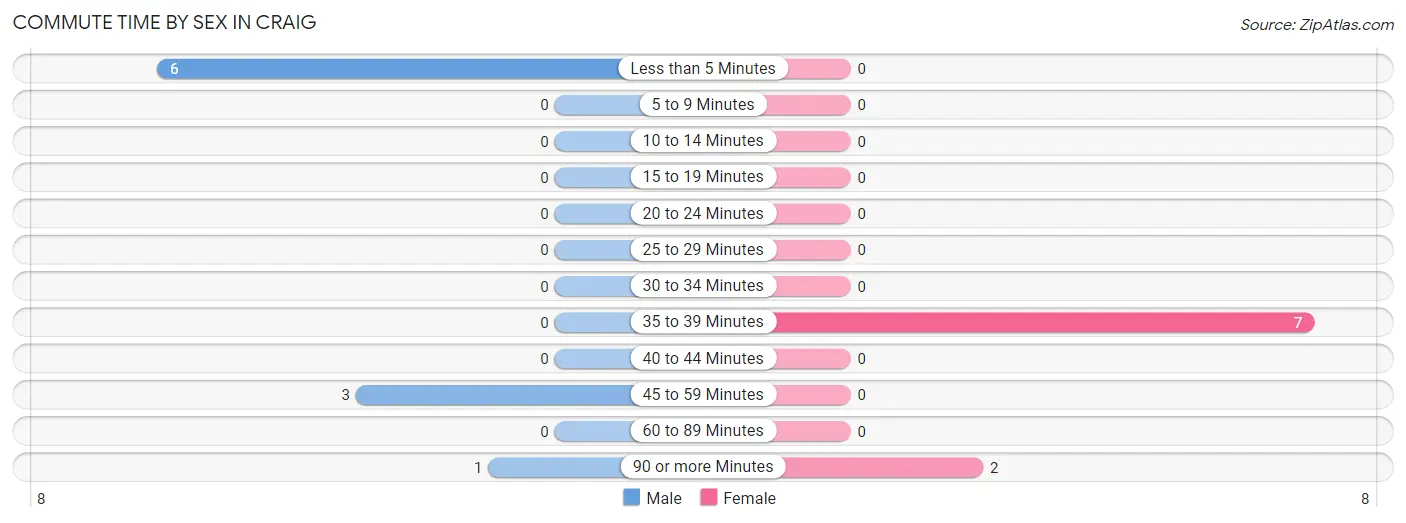
| Commute Time | Male | Female |
| Less than 5 Minutes | 6 (60.0%) | 0 (0.0%) |
| 5 to 9 Minutes | 0 (0.0%) | 0 (0.0%) |
| 10 to 14 Minutes | 0 (0.0%) | 0 (0.0%) |
| 15 to 19 Minutes | 0 (0.0%) | 0 (0.0%) |
| 20 to 24 Minutes | 0 (0.0%) | 0 (0.0%) |
| 25 to 29 Minutes | 0 (0.0%) | 0 (0.0%) |
| 30 to 34 Minutes | 0 (0.0%) | 0 (0.0%) |
| 35 to 39 Minutes | 0 (0.0%) | 7 (77.8%) |
| 40 to 44 Minutes | 0 (0.0%) | 0 (0.0%) |
| 45 to 59 Minutes | 3 (30.0%) | 0 (0.0%) |
| 60 to 89 Minutes | 0 (0.0%) | 0 (0.0%) |
| 90 or more Minutes | 1 (10.0%) | 2 (22.2%) |
Time of Departure to Work by Sex in Craig
The most frequent times of departure to work in Craig are 5:30 AM to 5:59 AM (3, 30.0%) for males and 7:30 AM to 7:59 AM (7, 77.8%) for females.
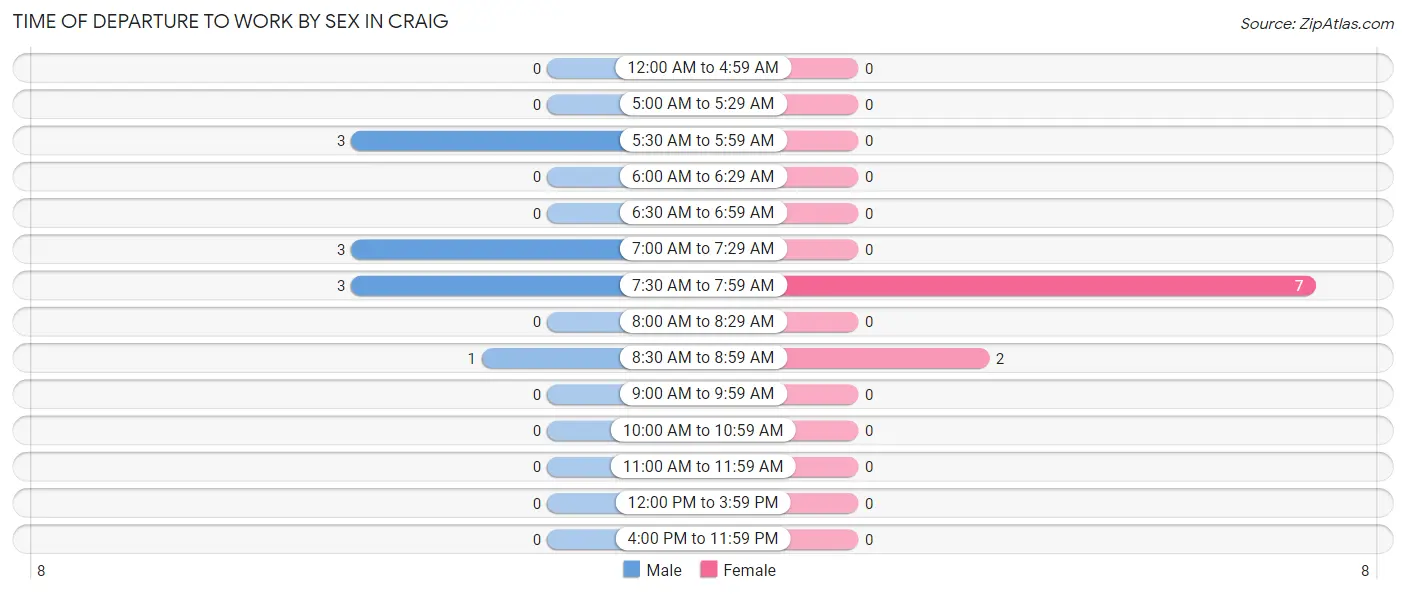
| Time of Departure | Male | Female |
| 12:00 AM to 4:59 AM | 0 (0.0%) | 0 (0.0%) |
| 5:00 AM to 5:29 AM | 0 (0.0%) | 0 (0.0%) |
| 5:30 AM to 5:59 AM | 3 (30.0%) | 0 (0.0%) |
| 6:00 AM to 6:29 AM | 0 (0.0%) | 0 (0.0%) |
| 6:30 AM to 6:59 AM | 0 (0.0%) | 0 (0.0%) |
| 7:00 AM to 7:29 AM | 3 (30.0%) | 0 (0.0%) |
| 7:30 AM to 7:59 AM | 3 (30.0%) | 7 (77.8%) |
| 8:00 AM to 8:29 AM | 0 (0.0%) | 0 (0.0%) |
| 8:30 AM to 8:59 AM | 1 (10.0%) | 2 (22.2%) |
| 9:00 AM to 9:59 AM | 0 (0.0%) | 0 (0.0%) |
| 10:00 AM to 10:59 AM | 0 (0.0%) | 0 (0.0%) |
| 11:00 AM to 11:59 AM | 0 (0.0%) | 0 (0.0%) |
| 12:00 PM to 3:59 PM | 0 (0.0%) | 0 (0.0%) |
| 4:00 PM to 11:59 PM | 0 (0.0%) | 0 (0.0%) |
| Total | 10 (100.0%) | 9 (100.0%) |
Housing Occupancy in Craig
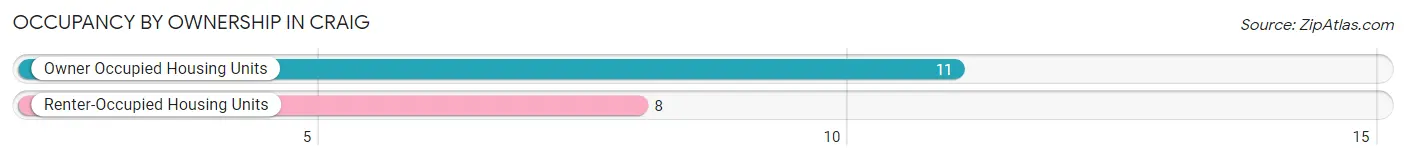
Occupancy by Ownership in Craig
Of the total 19 dwellings in Craig, owner-occupied units account for 11 (57.9%), while renter-occupied units make up 8 (42.1%).
| Occupancy | # Housing Units | % Housing Units |
| Owner Occupied Housing Units | 11 | 57.9% |
| Renter-Occupied Housing Units | 8 | 42.1% |
| Total Occupied Housing Units | 19 | 100.0% |
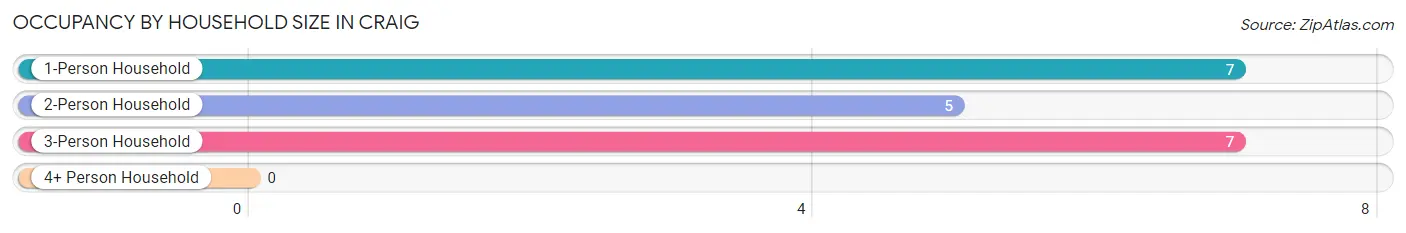
Occupancy by Household Size in Craig
| Household Size | # Housing Units | % Housing Units |
| 1-Person Household | 7 | 36.8% |
| 2-Person Household | 5 | 26.3% |
| 3-Person Household | 7 | 36.8% |
| 4+ Person Household | 0 | 0.0% |
| Total Housing Units | 19 | 100.0% |
Occupancy by Ownership by Household Size in Craig
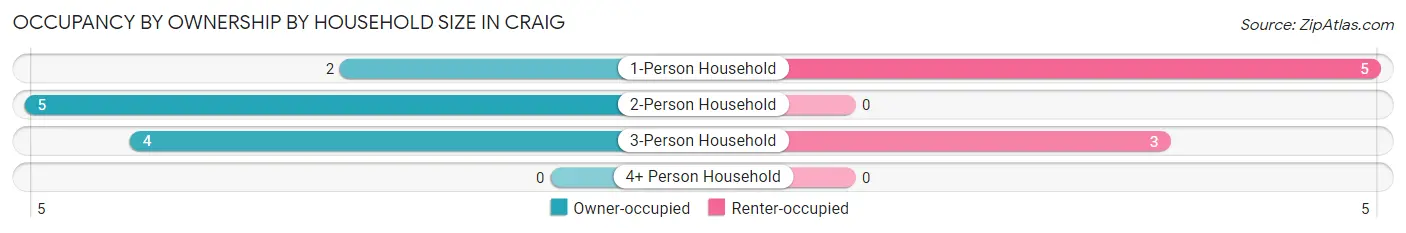
| Household Size | Owner-occupied | Renter-occupied |
| 1-Person Household | 2 (28.6%) | 5 (71.4%) |
| 2-Person Household | 5 (100.0%) | 0 (0.0%) |
| 3-Person Household | 4 (57.1%) | 3 (42.9%) |
| 4+ Person Household | 0 (0.0%) | 0 (0.0%) |
| Total Housing Units | 11 (57.9%) | 8 (42.1%) |
Occupancy by Educational Attainment in Craig
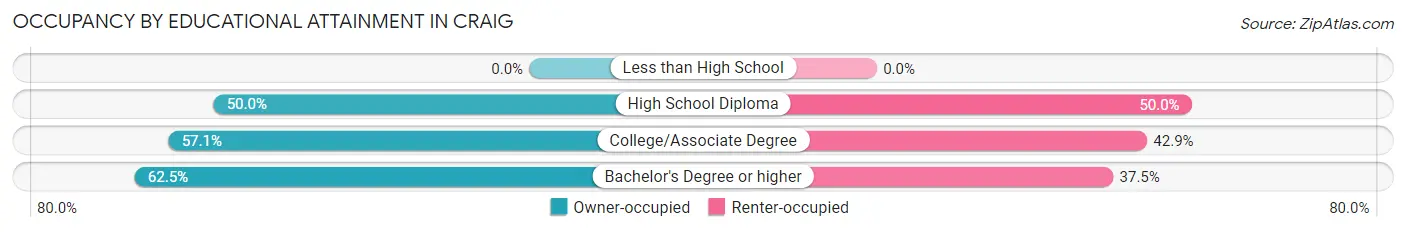
| Household Size | Owner-occupied | Renter-occupied |
| Less than High School | 0 (0.0%) | 0 (0.0%) |
| High School Diploma | 2 (50.0%) | 2 (50.0%) |
| College/Associate Degree | 4 (57.1%) | 3 (42.9%) |
| Bachelor's Degree or higher | 5 (62.5%) | 3 (37.5%) |
Occupancy by Age of Householder in Craig
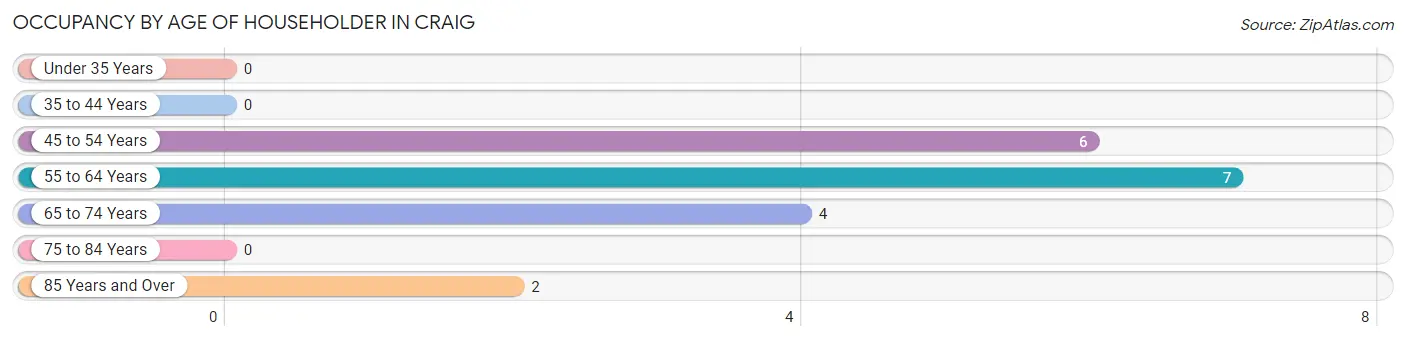
| Age Bracket | # Households | % Households |
| Under 35 Years | 0 | 0.0% |
| 35 to 44 Years | 0 | 0.0% |
| 45 to 54 Years | 6 | 31.6% |
| 55 to 64 Years | 7 | 36.8% |
| 65 to 74 Years | 4 | 21.0% |
| 75 to 84 Years | 0 | 0.0% |
| 85 Years and Over | 2 | 10.5% |
| Total | 19 | 100.0% |
Housing Finances in Craig
Median Income by Occupancy in Craig
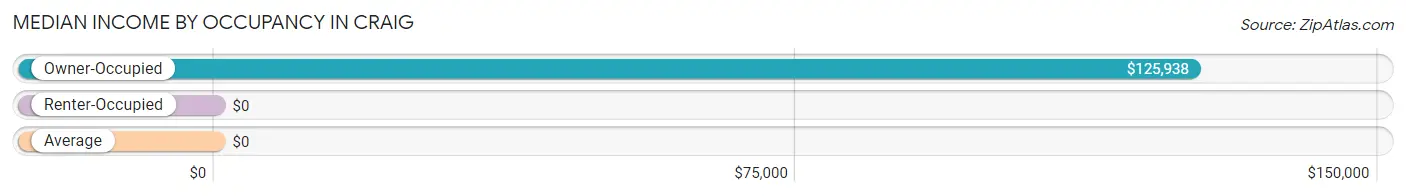
| Occupancy Type | # Households | Median Income |
| Owner-Occupied | 11 (57.9%) | $125,938 |
| Renter-Occupied | 8 (42.1%) | $0 |
| Average | 19 (100.0%) | $0 |
Occupancy by Householder Income Bracket in Craig
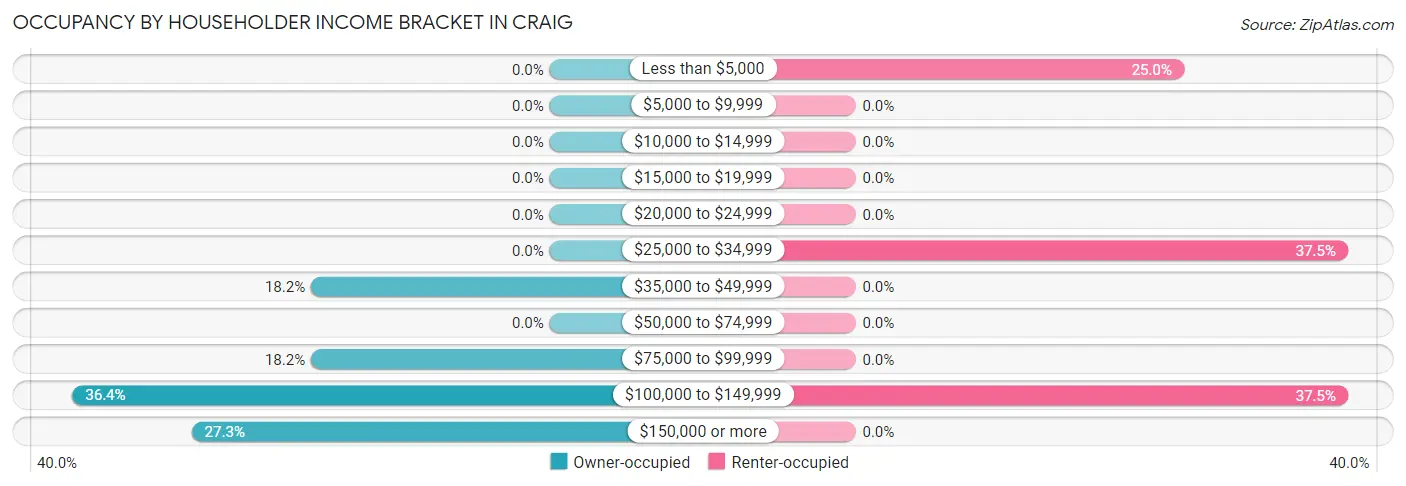
| Income Bracket | Owner-occupied | Renter-occupied |
| Less than $5,000 | 0 (0.0%) | 2 (25.0%) |
| $5,000 to $9,999 | 0 (0.0%) | 0 (0.0%) |
| $10,000 to $14,999 | 0 (0.0%) | 0 (0.0%) |
| $15,000 to $19,999 | 0 (0.0%) | 0 (0.0%) |
| $20,000 to $24,999 | 0 (0.0%) | 0 (0.0%) |
| $25,000 to $34,999 | 0 (0.0%) | 3 (37.5%) |
| $35,000 to $49,999 | 2 (18.2%) | 0 (0.0%) |
| $50,000 to $74,999 | 0 (0.0%) | 0 (0.0%) |
| $75,000 to $99,999 | 2 (18.2%) | 0 (0.0%) |
| $100,000 to $149,999 | 4 (36.4%) | 3 (37.5%) |
| $150,000 or more | 3 (27.3%) | 0 (0.0%) |
| Total | 11 (100.0%) | 8 (100.0%) |
Monthly Housing Cost Tiers in Craig
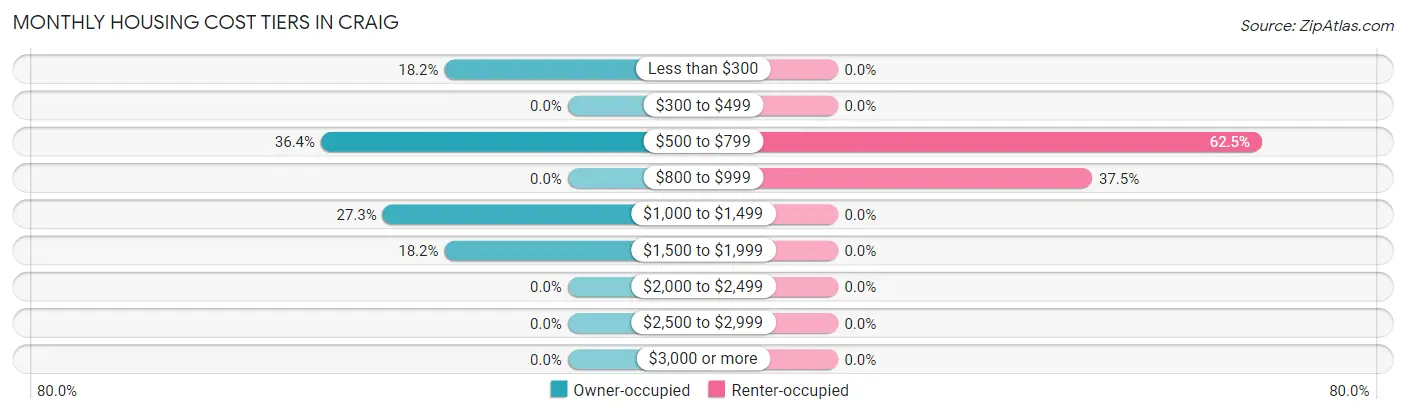
| Monthly Cost | Owner-occupied | Renter-occupied |
| Less than $300 | 2 (18.2%) | 0 (0.0%) |
| $300 to $499 | 0 (0.0%) | 0 (0.0%) |
| $500 to $799 | 4 (36.4%) | 5 (62.5%) |
| $800 to $999 | 0 (0.0%) | 3 (37.5%) |
| $1,000 to $1,499 | 3 (27.3%) | 0 (0.0%) |
| $1,500 to $1,999 | 2 (18.2%) | 0 (0.0%) |
| $2,000 to $2,499 | 0 (0.0%) | 0 (0.0%) |
| $2,500 to $2,999 | 0 (0.0%) | 0 (0.0%) |
| $3,000 or more | 0 (0.0%) | 0 (0.0%) |
| Total | 11 (100.0%) | 8 (100.0%) |
Physical Housing Characteristics in Craig
Housing Structures in Craig
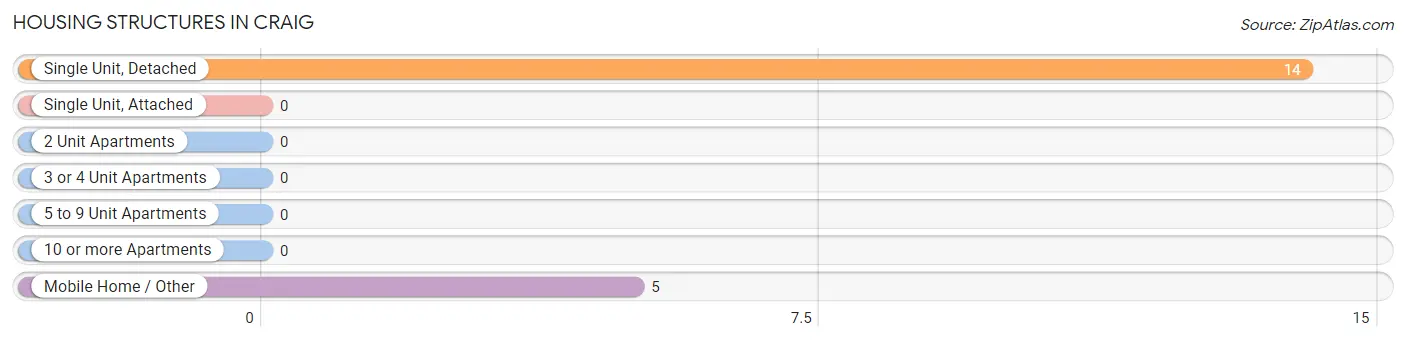
| Structure Type | # Housing Units | % Housing Units |
| Single Unit, Detached | 14 | 73.7% |
| Single Unit, Attached | 0 | 0.0% |
| 2 Unit Apartments | 0 | 0.0% |
| 3 or 4 Unit Apartments | 0 | 0.0% |
| 5 to 9 Unit Apartments | 0 | 0.0% |
| 10 or more Apartments | 0 | 0.0% |
| Mobile Home / Other | 5 | 26.3% |
| Total | 19 | 100.0% |
Housing Structures by Occupancy in Craig
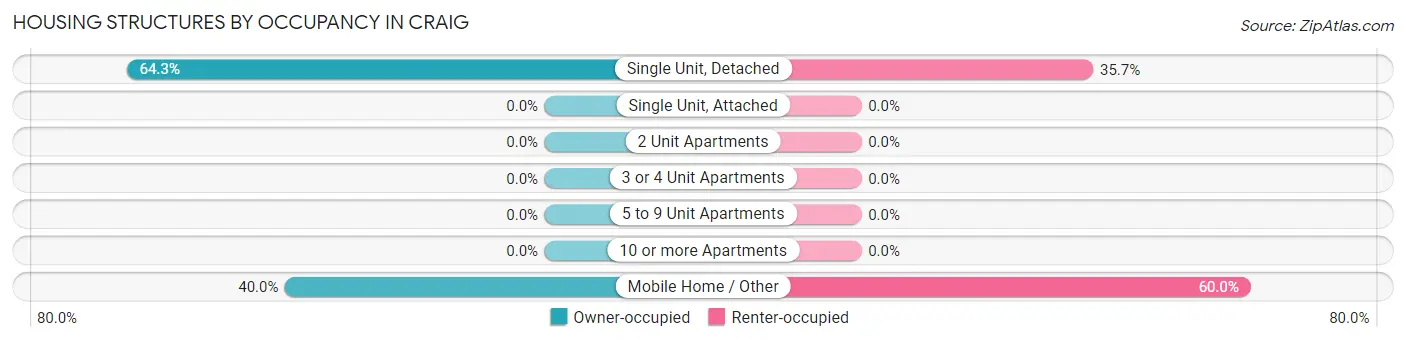
| Structure Type | Owner-occupied | Renter-occupied |
| Single Unit, Detached | 9 (64.3%) | 5 (35.7%) |
| Single Unit, Attached | 0 (0.0%) | 0 (0.0%) |
| 2 Unit Apartments | 0 (0.0%) | 0 (0.0%) |
| 3 or 4 Unit Apartments | 0 (0.0%) | 0 (0.0%) |
| 5 to 9 Unit Apartments | 0 (0.0%) | 0 (0.0%) |
| 10 or more Apartments | 0 (0.0%) | 0 (0.0%) |
| Mobile Home / Other | 2 (40.0%) | 3 (60.0%) |
| Total | 11 (57.9%) | 8 (42.1%) |
Housing Structures by Number of Rooms in Craig
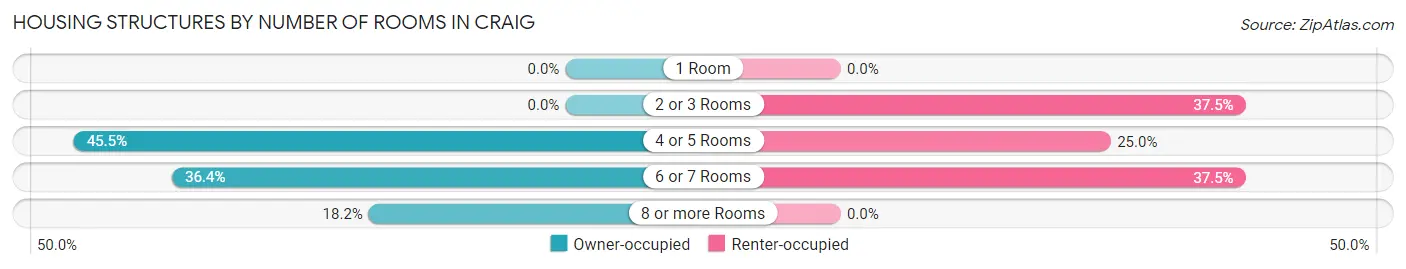
| Number of Rooms | Owner-occupied | Renter-occupied |
| 1 Room | 0 (0.0%) | 0 (0.0%) |
| 2 or 3 Rooms | 0 (0.0%) | 3 (37.5%) |
| 4 or 5 Rooms | 5 (45.5%) | 2 (25.0%) |
| 6 or 7 Rooms | 4 (36.4%) | 3 (37.5%) |
| 8 or more Rooms | 2 (18.2%) | 0 (0.0%) |
| Total | 11 (100.0%) | 8 (100.0%) |
Housing Structure by Heating Type in Craig
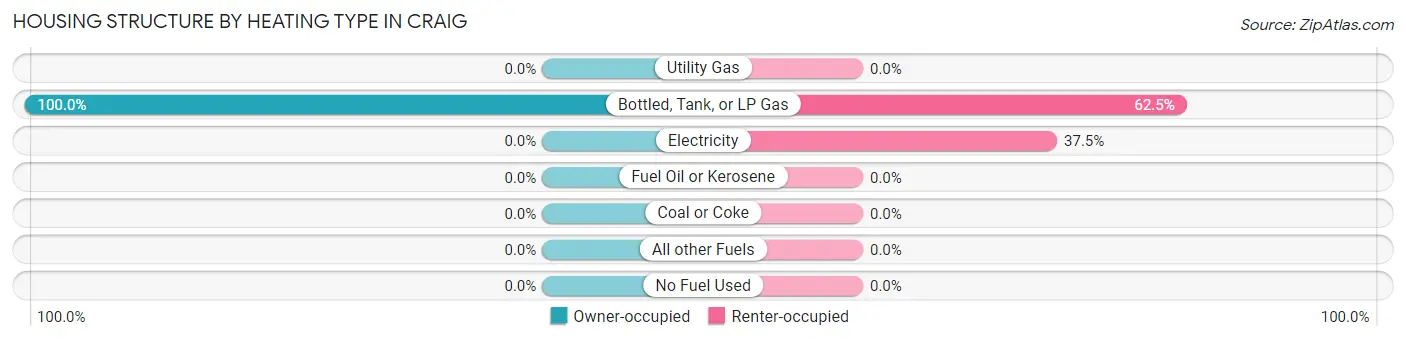
| Heating Type | Owner-occupied | Renter-occupied |
| Utility Gas | 0 (0.0%) | 0 (0.0%) |
| Bottled, Tank, or LP Gas | 11 (100.0%) | 5 (62.5%) |
| Electricity | 0 (0.0%) | 3 (37.5%) |
| Fuel Oil or Kerosene | 0 (0.0%) | 0 (0.0%) |
| Coal or Coke | 0 (0.0%) | 0 (0.0%) |
| All other Fuels | 0 (0.0%) | 0 (0.0%) |
| No Fuel Used | 0 (0.0%) | 0 (0.0%) |
| Total | 11 (100.0%) | 8 (100.0%) |
Household Vehicle Usage in Craig
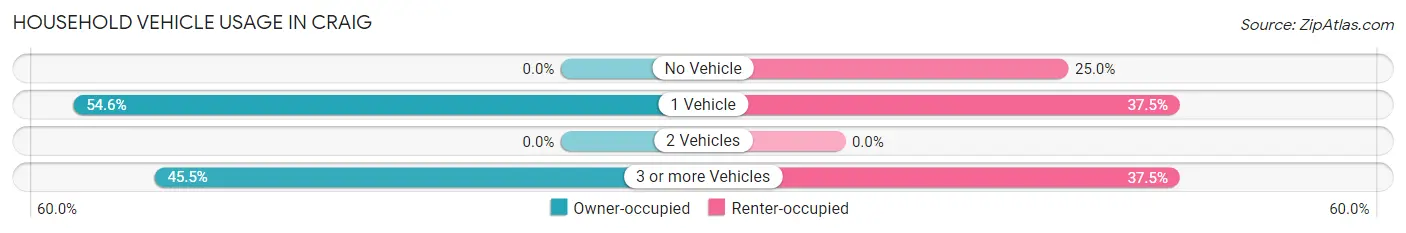
| Vehicles per Household | Owner-occupied | Renter-occupied |
| No Vehicle | 0 (0.0%) | 2 (25.0%) |
| 1 Vehicle | 6 (54.5%) | 3 (37.5%) |
| 2 Vehicles | 0 (0.0%) | 0 (0.0%) |
| 3 or more Vehicles | 5 (45.5%) | 3 (37.5%) |
| Total | 11 (100.0%) | 8 (100.0%) |
Real Estate & Mortgages in Craig
Real Estate and Mortgage Overview in Craig
| Characteristic | Without Mortgage | With Mortgage |
| Housing Units | 6 | 5 |
| Median Property Value | - | - |
| Median Household Income | - | - |
| Monthly Housing Costs | - | - |
| Real Estate Taxes | - | - |
Property Value by Mortgage Status in Craig
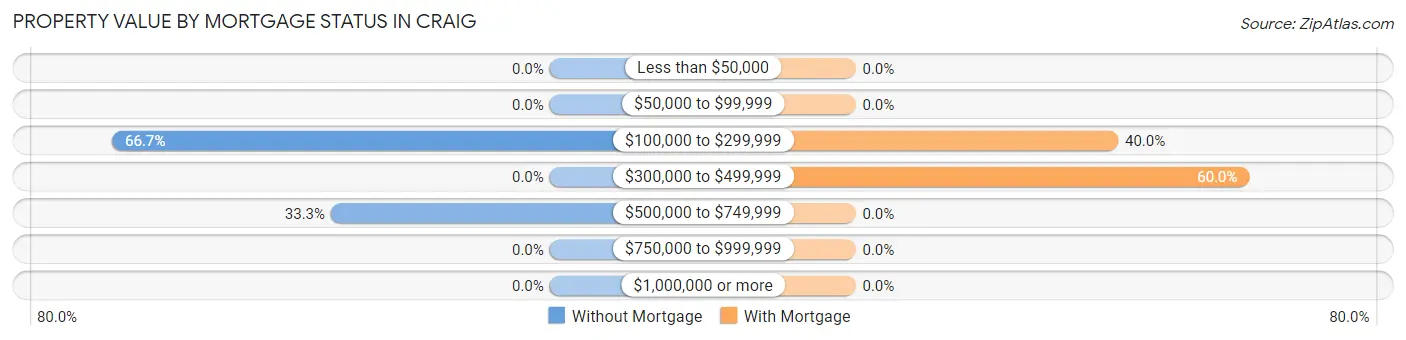
| Property Value | Without Mortgage | With Mortgage |
| Less than $50,000 | 0 (0.0%) | 0 (0.0%) |
| $50,000 to $99,999 | 0 (0.0%) | 0 (0.0%) |
| $100,000 to $299,999 | 4 (66.7%) | 2 (40.0%) |
| $300,000 to $499,999 | 0 (0.0%) | 3 (60.0%) |
| $500,000 to $749,999 | 2 (33.3%) | 0 (0.0%) |
| $750,000 to $999,999 | 0 (0.0%) | 0 (0.0%) |
| $1,000,000 or more | 0 (0.0%) | 0 (0.0%) |
| Total | 6 (100.0%) | 5 (100.0%) |
Household Income by Mortgage Status in Craig
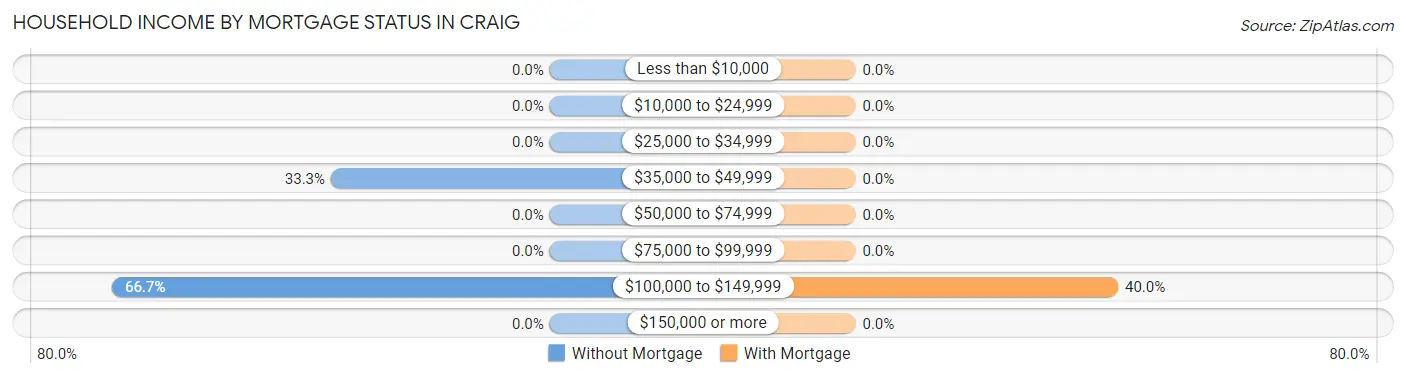
| Household Income | Without Mortgage | With Mortgage |
| Less than $10,000 | 0 (0.0%) | 0 (0.0%) |
| $10,000 to $24,999 | 0 (0.0%) | 0 (0.0%) |
| $25,000 to $34,999 | 0 (0.0%) | 0 (0.0%) |
| $35,000 to $49,999 | 2 (33.3%) | 0 (0.0%) |
| $50,000 to $74,999 | 0 (0.0%) | 0 (0.0%) |
| $75,000 to $99,999 | 0 (0.0%) | 0 (0.0%) |
| $100,000 to $149,999 | 4 (66.7%) | 2 (40.0%) |
| $150,000 or more | 0 (0.0%) | 0 (0.0%) |
| Total | 6 (100.0%) | 5 (100.0%) |
Property Value to Household Income Ratio in Craig
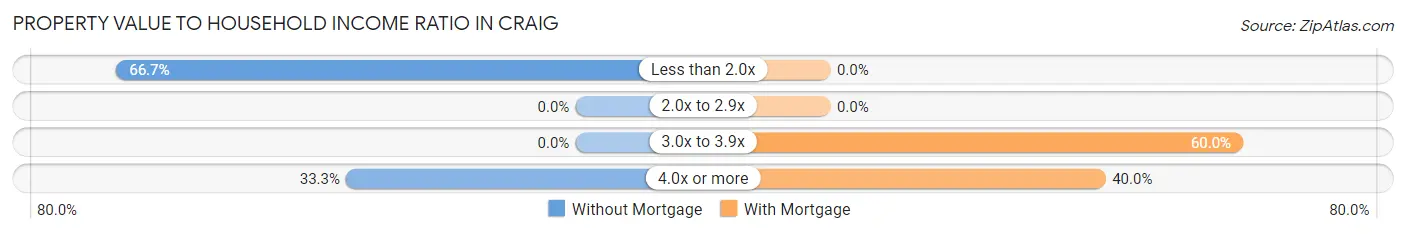
| Value-to-Income Ratio | Without Mortgage | With Mortgage |
| Less than 2.0x | 4 (66.7%) | 0 (0.0%) |
| 2.0x to 2.9x | 0 (0.0%) | 0 (0.0%) |
| 3.0x to 3.9x | 0 (0.0%) | 3 (60.0%) |
| 4.0x or more | 2 (33.3%) | 2 (40.0%) |
| Total | 6 (100.0%) | 5 (100.0%) |
Real Estate Taxes by Mortgage Status in Craig
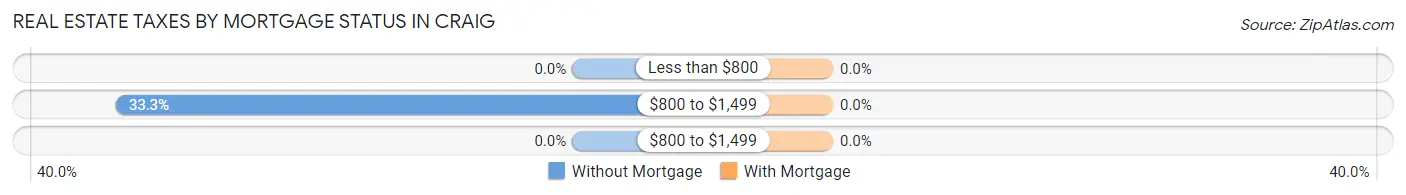
| Property Taxes | Without Mortgage | With Mortgage |
| Less than $800 | 0 (0.0%) | 0 (0.0%) |
| $800 to $1,499 | 2 (33.3%) | 0 (0.0%) |
| $800 to $1,499 | 0 (0.0%) | 0 (0.0%) |
| Total | 6 (100.0%) | 5 (100.0%) |
Health & Disability in Craig
Health Insurance Coverage by Age in Craig
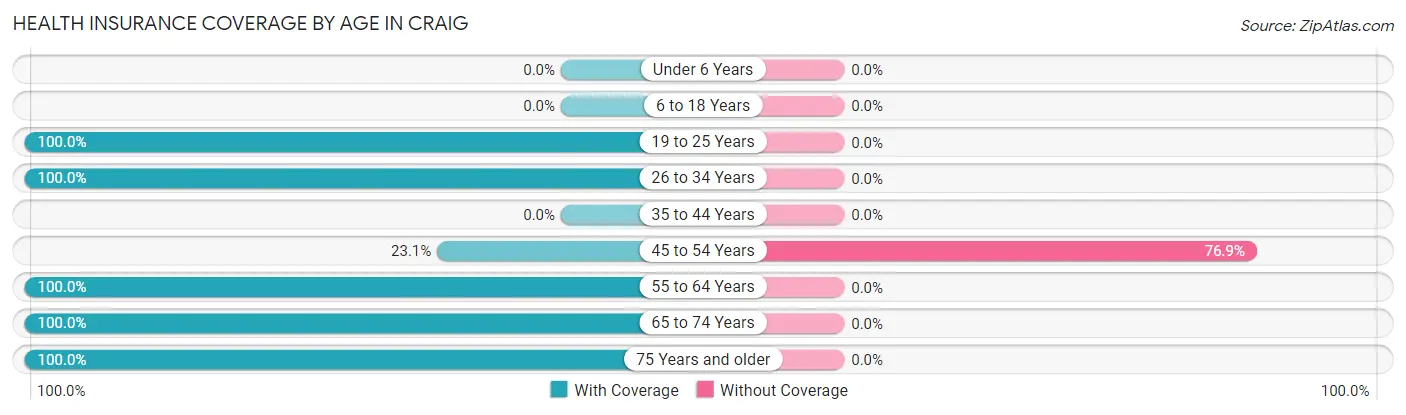
| Age Bracket | With Coverage | Without Coverage |
| Under 6 Years | 0 (0.0%) | 0 (0.0%) |
| 6 to 18 Years | 0 (0.0%) | 0 (0.0%) |
| 19 to 25 Years | 6 (100.0%) | 0 (0.0%) |
| 26 to 34 Years | 5 (100.0%) | 0 (0.0%) |
| 35 to 44 Years | 0 (0.0%) | 0 (0.0%) |
| 45 to 54 Years | 3 (23.1%) | 10 (76.9%) |
| 55 to 64 Years | 8 (100.0%) | 0 (0.0%) |
| 65 to 74 Years | 5 (100.0%) | 0 (0.0%) |
| 75 Years and older | 2 (100.0%) | 0 (0.0%) |
| Total | 29 (74.4%) | 10 (25.6%) |
Health Insurance Coverage by Citizenship Status in Craig
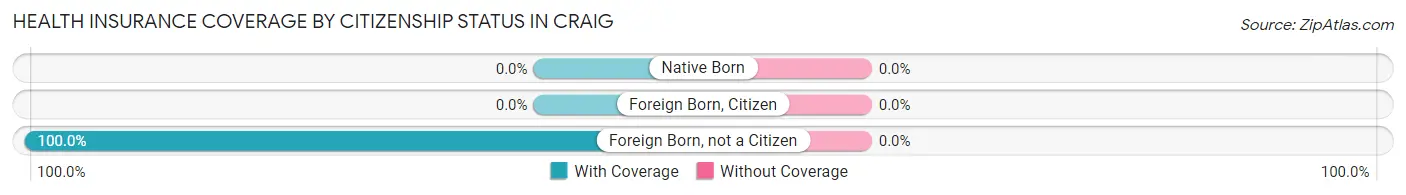
| Citizenship Status | With Coverage | Without Coverage |
| Native Born | 0 (0.0%) | 0 (0.0%) |
| Foreign Born, Citizen | 0 (0.0%) | 0 (0.0%) |
| Foreign Born, not a Citizen | 6 (100.0%) | 0 (0.0%) |
Health Insurance Coverage by Household Income in Craig
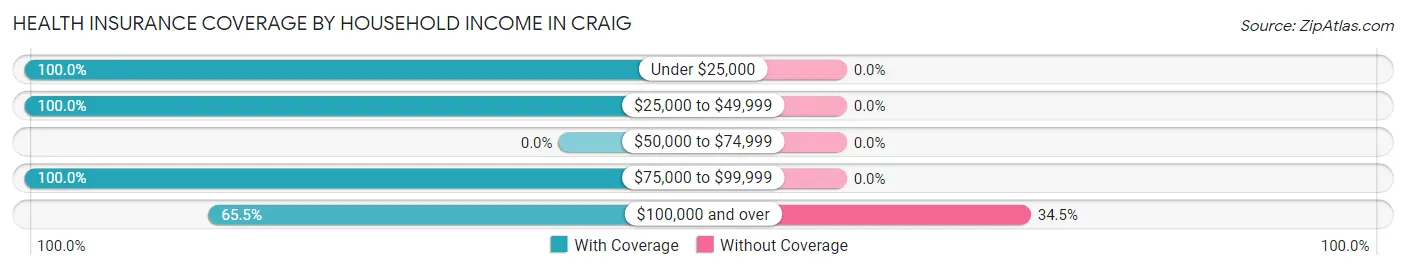
| Household Income | With Coverage | Without Coverage |
| Under $25,000 | 2 (100.0%) | 0 (0.0%) |
| $25,000 to $49,999 | 5 (100.0%) | 0 (0.0%) |
| $50,000 to $74,999 | 0 (0.0%) | 0 (0.0%) |
| $75,000 to $99,999 | 3 (100.0%) | 0 (0.0%) |
| $100,000 and over | 19 (65.5%) | 10 (34.5%) |
Public vs Private Health Insurance Coverage by Age in Craig
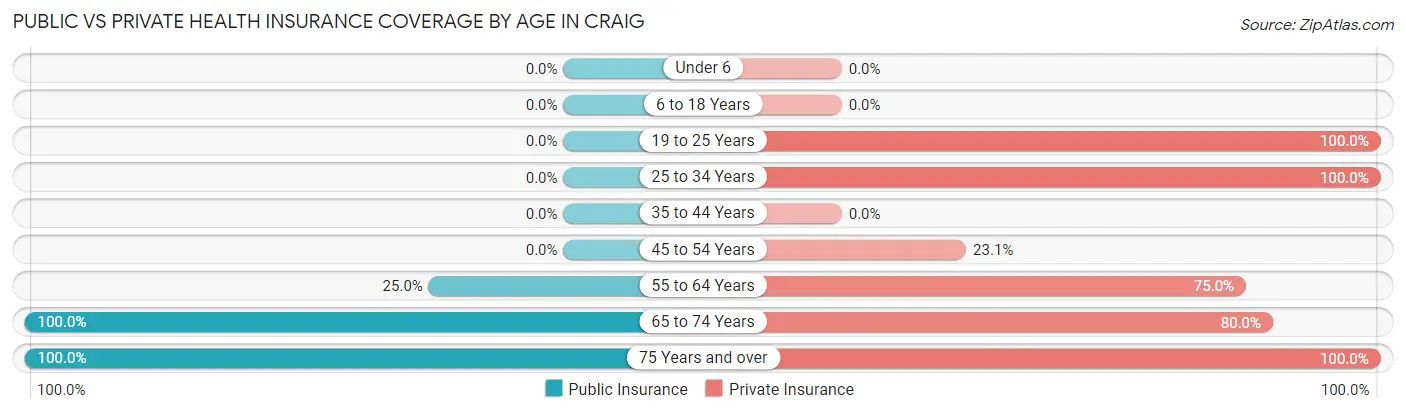
| Age Bracket | Public Insurance | Private Insurance |
| Under 6 | 0 (0.0%) | 0 (0.0%) |
| 6 to 18 Years | 0 (0.0%) | 0 (0.0%) |
| 19 to 25 Years | 0 (0.0%) | 6 (100.0%) |
| 25 to 34 Years | 0 (0.0%) | 5 (100.0%) |
| 35 to 44 Years | 0 (0.0%) | 0 (0.0%) |
| 45 to 54 Years | 0 (0.0%) | 3 (23.1%) |
| 55 to 64 Years | 2 (25.0%) | 6 (75.0%) |
| 65 to 74 Years | 5 (100.0%) | 4 (80.0%) |
| 75 Years and over | 2 (100.0%) | 2 (100.0%) |
| Total | 9 (23.1%) | 26 (66.7%) |
Disability Status by Sex by Age in Craig
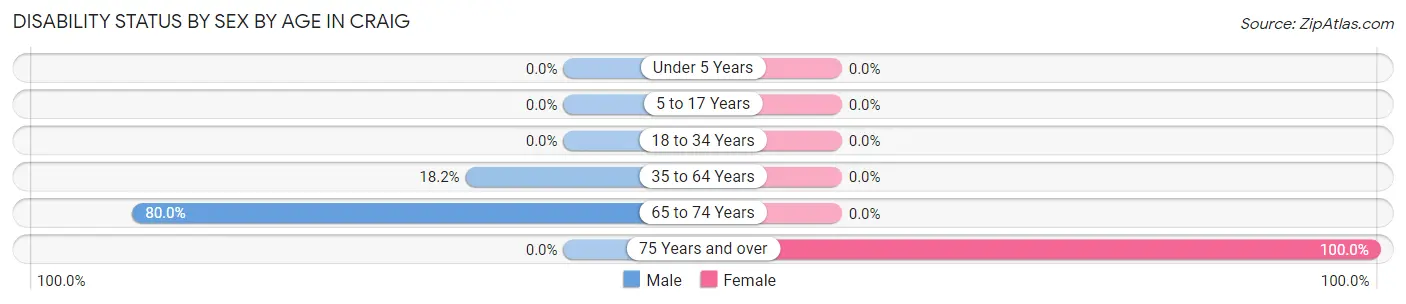
| Age Bracket | Male | Female |
| Under 5 Years | 0 (0.0%) | 0 (0.0%) |
| 5 to 17 Years | 0 (0.0%) | 0 (0.0%) |
| 18 to 34 Years | 0 (0.0%) | 0 (0.0%) |
| 35 to 64 Years | 2 (18.2%) | 0 (0.0%) |
| 65 to 74 Years | 4 (80.0%) | 0 (0.0%) |
| 75 Years and over | 0 (0.0%) | 2 (100.0%) |
Disability Class by Sex by Age in Craig
Disability Class: Hearing Difficulty
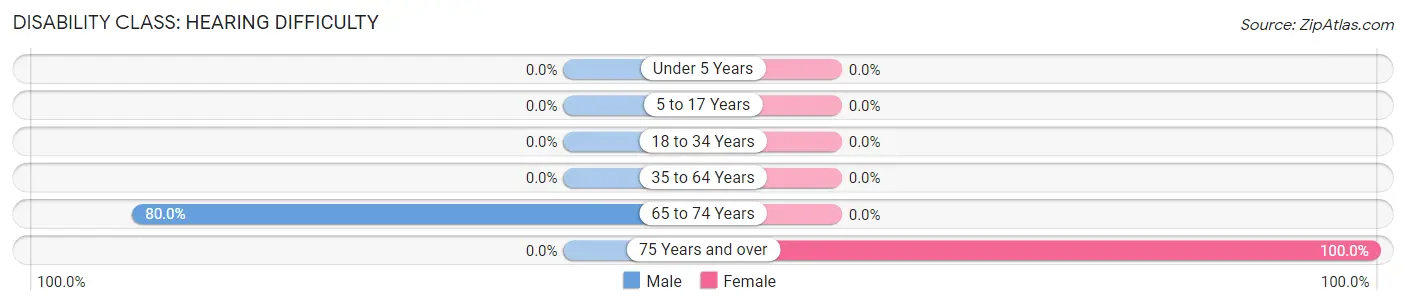
| Age Bracket | Male | Female |
| Under 5 Years | 0 (0.0%) | 0 (0.0%) |
| 5 to 17 Years | 0 (0.0%) | 0 (0.0%) |
| 18 to 34 Years | 0 (0.0%) | 0 (0.0%) |
| 35 to 64 Years | 0 (0.0%) | 0 (0.0%) |
| 65 to 74 Years | 4 (80.0%) | 0 (0.0%) |
| 75 Years and over | 0 (0.0%) | 2 (100.0%) |
Disability Class: Vision Difficulty
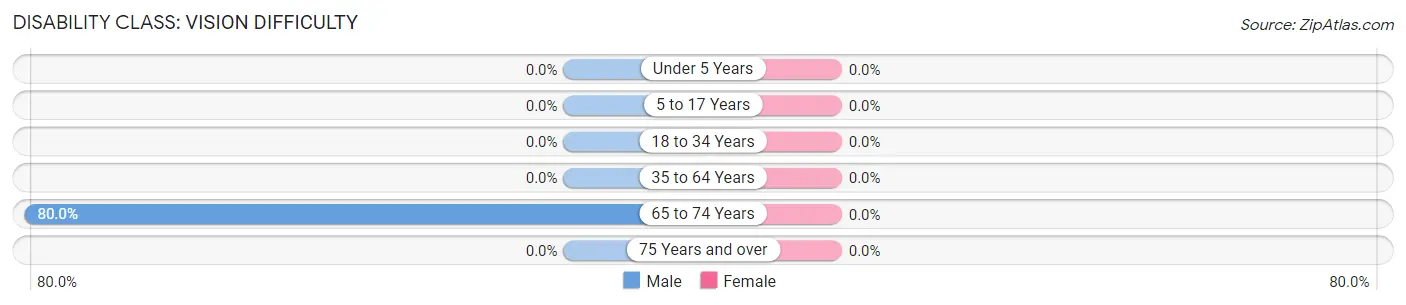
| Age Bracket | Male | Female |
| Under 5 Years | 0 (0.0%) | 0 (0.0%) |
| 5 to 17 Years | 0 (0.0%) | 0 (0.0%) |
| 18 to 34 Years | 0 (0.0%) | 0 (0.0%) |
| 35 to 64 Years | 0 (0.0%) | 0 (0.0%) |
| 65 to 74 Years | 4 (80.0%) | 0 (0.0%) |
| 75 Years and over | 0 (0.0%) | 0 (0.0%) |
Disability Class: Cognitive Difficulty
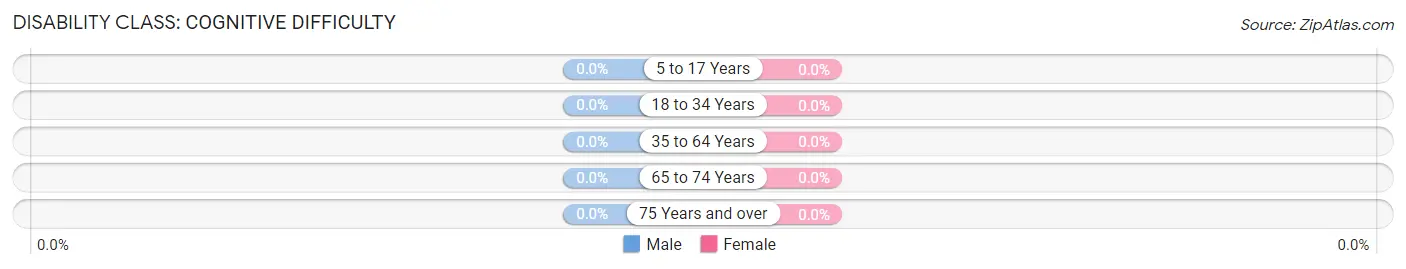
| Age Bracket | Male | Female |
| 5 to 17 Years | 0 (0.0%) | 0 (0.0%) |
| 18 to 34 Years | 0 (0.0%) | 0 (0.0%) |
| 35 to 64 Years | 0 (0.0%) | 0 (0.0%) |
| 65 to 74 Years | 0 (0.0%) | 0 (0.0%) |
| 75 Years and over | 0 (0.0%) | 0 (0.0%) |
Disability Class: Ambulatory Difficulty
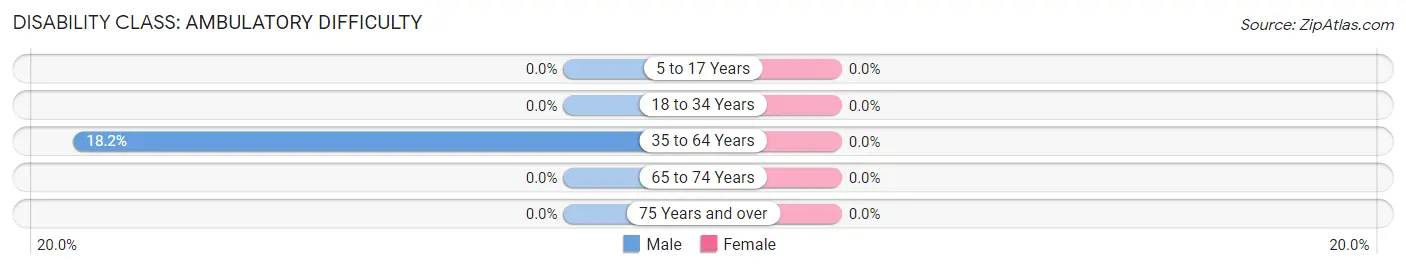
| Age Bracket | Male | Female |
| 5 to 17 Years | 0 (0.0%) | 0 (0.0%) |
| 18 to 34 Years | 0 (0.0%) | 0 (0.0%) |
| 35 to 64 Years | 2 (18.2%) | 0 (0.0%) |
| 65 to 74 Years | 0 (0.0%) | 0 (0.0%) |
| 75 Years and over | 0 (0.0%) | 0 (0.0%) |
Disability Class: Self-Care Difficulty

| Age Bracket | Male | Female |
| 5 to 17 Years | 0 (0.0%) | 0 (0.0%) |
| 18 to 34 Years | 0 (0.0%) | 0 (0.0%) |
| 35 to 64 Years | 0 (0.0%) | 0 (0.0%) |
| 65 to 74 Years | 0 (0.0%) | 0 (0.0%) |
| 75 Years and over | 0 (0.0%) | 0 (0.0%) |
Technology Access in Craig
Computing Device Access in Craig
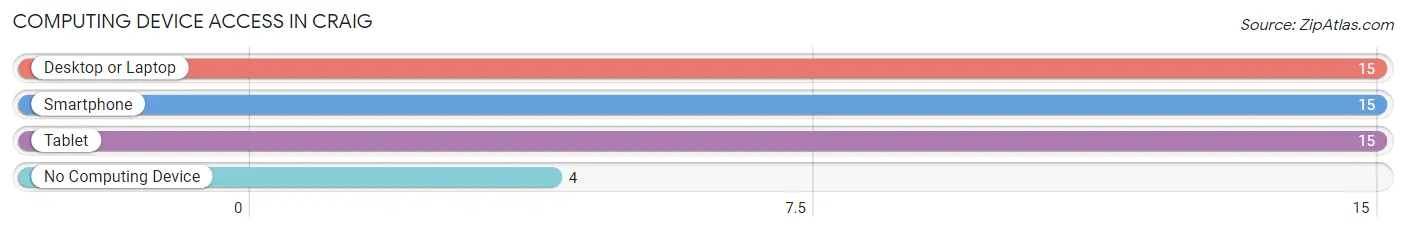
| Device Type | # Households | % Households |
| Desktop or Laptop | 15 | 78.9% |
| Smartphone | 15 | 78.9% |
| Tablet | 15 | 78.9% |
| No Computing Device | 4 | 21.0% |
| Total | 19 | 100.0% |
Internet Access in Craig
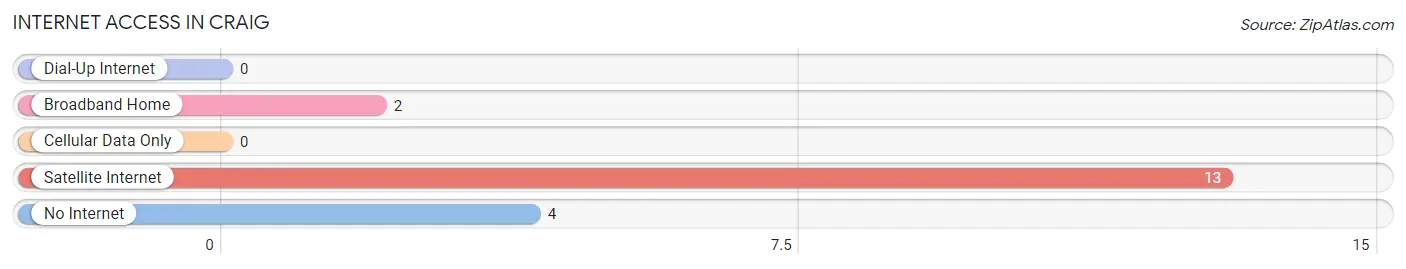
| Internet Type | # Households | % Households |
| Dial-Up Internet | 0 | 0.0% |
| Broadband Home | 2 | 10.5% |
| Cellular Data Only | 0 | 0.0% |
| Satellite Internet | 13 | 68.4% |
| No Internet | 4 | 21.0% |
| Total | 19 | 100.0% |
Craig Summary
Craig is a small city located in Montana, United States. It is situated in the northwestern part of the state, in the Flathead Valley, and is the county seat of Flathead County. The city is located on the Flathead River, and is surrounded by the Flathead National Forest. As of the 2010 census, the population of Craig was 1,817.
History
The area around Craig was first inhabited by the Kootenai and Salish Native American tribes. The first European settlers arrived in the area in the late 1800s, and the town of Craig was established in 1891. The town was named after William Craig, a local rancher and businessman.
In the early 1900s, Craig became an important center for the timber industry, and the town grew rapidly. The Great Northern Railway arrived in the area in 1906, and the town was incorporated in 1909.
Geography
Craig is located in the northwestern part of Montana, in the Flathead Valley. The city is situated on the Flathead River, and is surrounded by the Flathead National Forest. The city has a total area of 1.7 square miles, all of which is land.
Climate
Craig has a humid continental climate, with cold, snowy winters and warm, dry summers. The average annual temperature is 44°F, and the average annual precipitation is 16.5 inches.
Economy
The economy of Craig is largely based on tourism and agriculture. The city is home to several tourist attractions, including the Flathead National Forest, the Flathead River, and the Flathead Valley Museum. The city is also home to several agricultural businesses, including cattle ranches, dairy farms, and fruit orchards.
Demographics
As of the 2010 census, the population of Craig was 1,817. The racial makeup of the city was 94.3% White, 0.2% African American, 1.2% Native American, 0.3% Asian, 0.1% Pacific Islander, 0.7% from other races, and 2.4% from two or more races. Hispanic or Latino of any race were 2.7% of the population.
The median household income in Craig was $37,917, and the median family income was $45,938. The per capita income was $20,845. About 11.2% of families and 14.2% of the population were below the poverty line, including 18.2% of those under age 18 and 8.2% of those age 65 or over.
Common Questions
What is Per Capita Income in Craig?
Per Capita income in Craig is $42,582.
What is the Median Family Income in Craig?
Median Family Income in Craig is $108,750.
What is Income or Wage Gap in Craig?
Income or Wage Gap in Craig is 48.4%.
Women in Craig earn 51.6 cents for every dollar earned by a man.
What is Inequality or Gini Index in Craig?
Inequality or Gini Index in Craig is 0.34.
What is the Total Population of Craig?
Total Population of Craig is 39.
What is the Total Male Population of Craig?
Total Male Population of Craig is 21.
What is the Total Female Population of Craig?
Total Female Population of Craig is 18.
What is the Ratio of Males per 100 Females in Craig?
There are 116.67 Males per 100 Females in Craig.
What is the Ratio of Females per 100 Males in Craig?
There are 85.71 Females per 100 Males in Craig.
What is the Median Population Age in Craig?
Median Population Age in Craig is 52.4 Years.
What is the Average Family Size in Craig
Average Family Size in Craig is 2.1 People.
What is the Average Household Size in Craig
Average Household Size in Craig is 2.0 People.
How Large is the Labor Force in Craig?
There are 23 People in the Labor Forcein in Craig.
What is the Percentage of People in the Labor Force in Craig?
59.0% of People are in the Labor Force in Craig.