Noxon, MT Map & Demographics
Noxon Map
Noxon Overview
$29,850
PER CAPITA INCOME
$56,250
AVG HOUSEHOLD INCOME
45.1%
WAGE / INCOME GAP [ % ]
54.9¢/ $1
WAGE / INCOME GAP [ $ ]
0.35
INEQUALITY / GINI INDEX
205
TOTAL POPULATION
131
MALE POPULATION
74
FEMALE POPULATION
177.03
MALES / 100 FEMALES
56.49
FEMALES / 100 MALES
45.4
MEDIAN AGE
2.8
AVG FAMILY SIZE
2.4
AVG HOUSEHOLD SIZE
109
LABOR FORCE [ PEOPLE ]
65.3%
PERCENT IN LABOR FORCE
8.3%
UNEMPLOYMENT RATE
Noxon Zip Codes
Noxon Area Codes
Income in Noxon
Income Overview in Noxon
| Characteristic | Number | Measure |
| Per Capita Income | 205 | $29,850 |
| Median Family Income | 45 | $0 |
| Mean Family Income | 45 | $70,682 |
| Median Household Income | 85 | $56,250 |
| Mean Household Income | 85 | $61,472 |
| Income Deficit | 45 | $0 |
| Wage / Income Gap (%) | 205 | 45.08% |
| Wage / Income Gap ($) | 205 | 54.92¢ per $1 |
| Gini / Inequality Index | 205 | 0.35 |
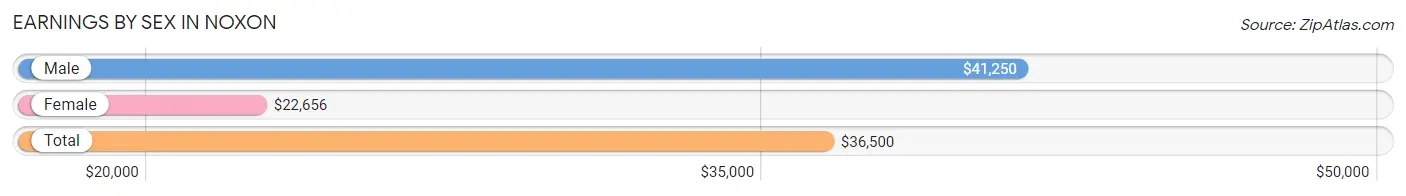
Earnings by Sex in Noxon
Average Earnings in Noxon are $36,500, $41,250 for men and $22,656 for women, a difference of 45.1%.
| Sex | Number | Average Earnings |
| Male | 91 (77.1%) | $41,250 |
| Female | 27 (22.9%) | $22,656 |
| Total | 118 (100.0%) | $36,500 |
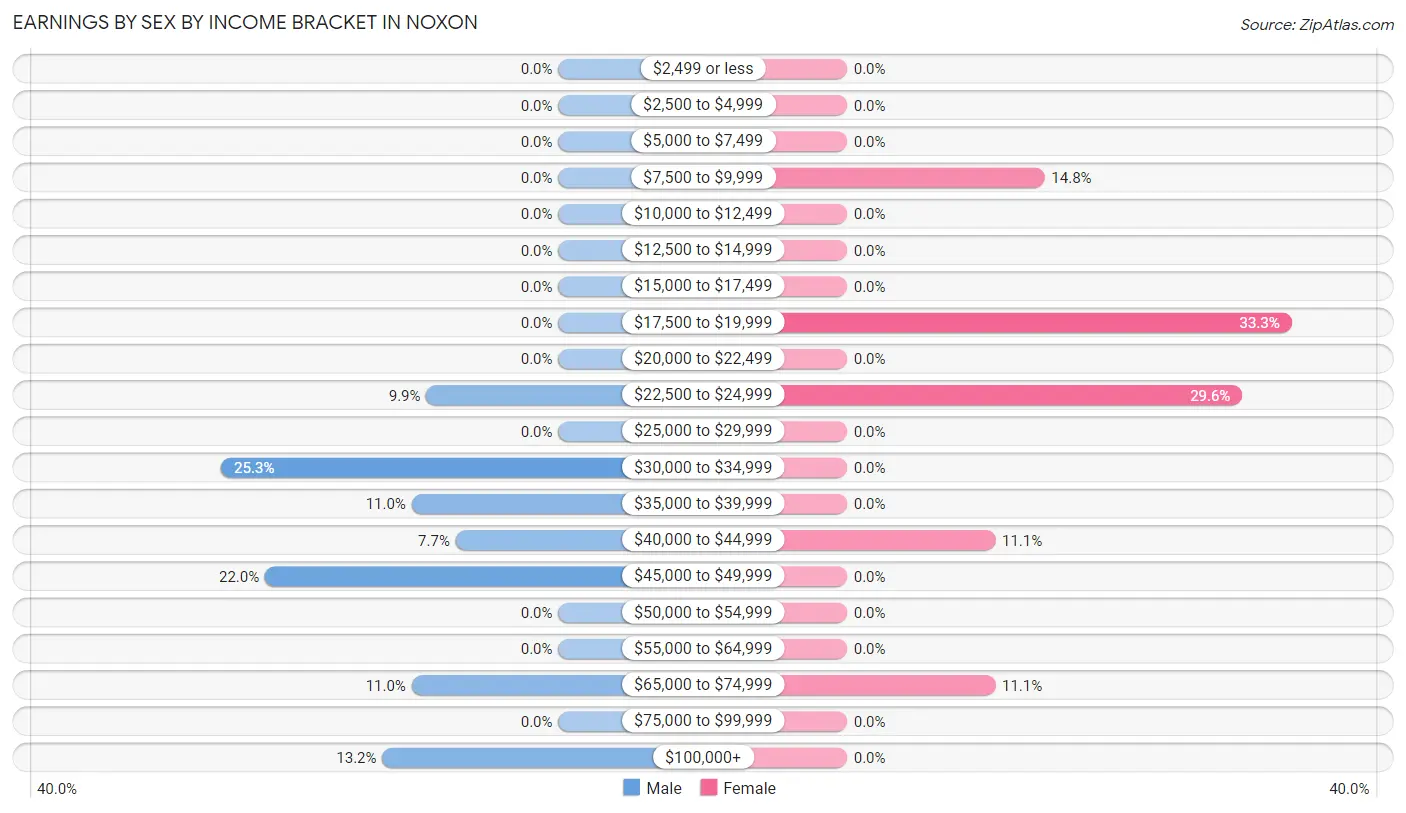
Earnings by Sex by Income Bracket in Noxon
The most common earnings brackets in Noxon are $30,000 to $34,999 for men (23 | 25.3%) and $17,500 to $19,999 for women (9 | 33.3%).
| Income | Male | Female |
| $2,499 or less | 0 (0.0%) | 0 (0.0%) |
| $2,500 to $4,999 | 0 (0.0%) | 0 (0.0%) |
| $5,000 to $7,499 | 0 (0.0%) | 0 (0.0%) |
| $7,500 to $9,999 | 0 (0.0%) | 4 (14.8%) |
| $10,000 to $12,499 | 0 (0.0%) | 0 (0.0%) |
| $12,500 to $14,999 | 0 (0.0%) | 0 (0.0%) |
| $15,000 to $17,499 | 0 (0.0%) | 0 (0.0%) |
| $17,500 to $19,999 | 0 (0.0%) | 9 (33.3%) |
| $20,000 to $22,499 | 0 (0.0%) | 0 (0.0%) |
| $22,500 to $24,999 | 9 (9.9%) | 8 (29.6%) |
| $25,000 to $29,999 | 0 (0.0%) | 0 (0.0%) |
| $30,000 to $34,999 | 23 (25.3%) | 0 (0.0%) |
| $35,000 to $39,999 | 10 (11.0%) | 0 (0.0%) |
| $40,000 to $44,999 | 7 (7.7%) | 3 (11.1%) |
| $45,000 to $49,999 | 20 (22.0%) | 0 (0.0%) |
| $50,000 to $54,999 | 0 (0.0%) | 0 (0.0%) |
| $55,000 to $64,999 | 0 (0.0%) | 0 (0.0%) |
| $65,000 to $74,999 | 10 (11.0%) | 3 (11.1%) |
| $75,000 to $99,999 | 0 (0.0%) | 0 (0.0%) |
| $100,000+ | 12 (13.2%) | 0 (0.0%) |
| Total | 91 (100.0%) | 27 (100.0%) |
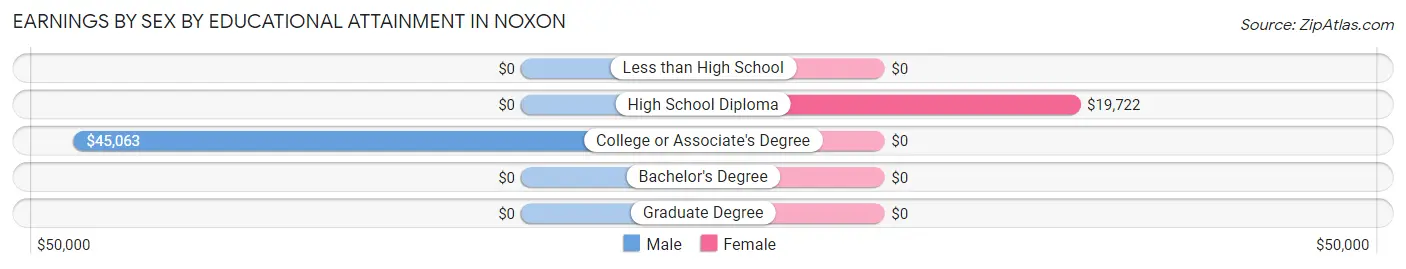
Earnings by Sex by Educational Attainment in Noxon
Average earnings in Noxon are $41,250 for men and $22,656 for women, a difference of 45.1%. Men with an educational attainment of college or associate's degree enjoy the highest average annual earnings of $45,063, while those with college or associate's degree education earn the least with $45,063. Women with an educational attainment of high school diploma earn the most with the average annual earnings of $19,722, while those with high school diploma education have the smallest earnings of $19,722.
| Educational Attainment | Male Income | Female Income |
| Less than High School | - | - |
| High School Diploma | - | - |
| College or Associate's Degree | $45,063 | $0 |
| Bachelor's Degree | - | - |
| Graduate Degree | - | - |
| Total | $41,250 | $22,656 |
Family Income in Noxon
Family Income Brackets in Noxon
According to the Noxon family income data, there are 17 families falling into the $35,000 to $49,999 income range, which is the most common income bracket and makes up 37.8% of all families.
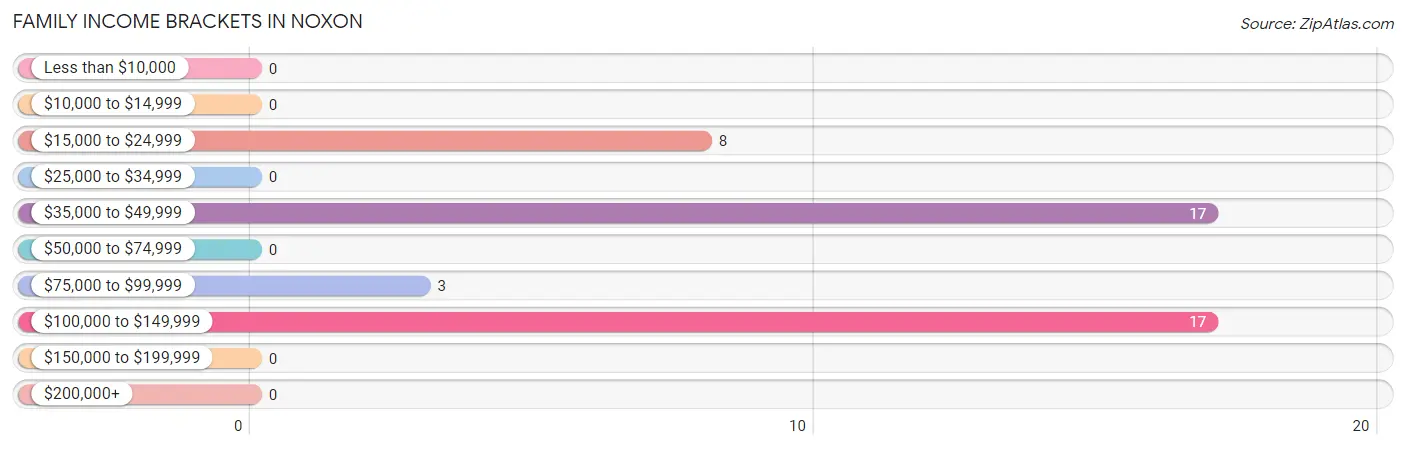
| Income Bracket | # Families | % Families |
| Less than $10,000 | 0 | 0.0% |
| $10,000 to $14,999 | 0 | 0.0% |
| $15,000 to $24,999 | 8 | 17.8% |
| $25,000 to $34,999 | 0 | 0.0% |
| $35,000 to $49,999 | 17 | 37.8% |
| $50,000 to $74,999 | 0 | 0.0% |
| $75,000 to $99,999 | 3 | 6.7% |
| $100,000 to $149,999 | 17 | 37.8% |
| $150,000 to $199,999 | 0 | 0.0% |
| $200,000+ | 0 | 0.0% |
Family Income by Famaliy Size in Noxon
2-person families (24 | 53.3%) account for the highest median family income in Noxon with $127,857 per family, while 2-person families (24 | 53.3%) have the highest median income of $63,928 per family member.
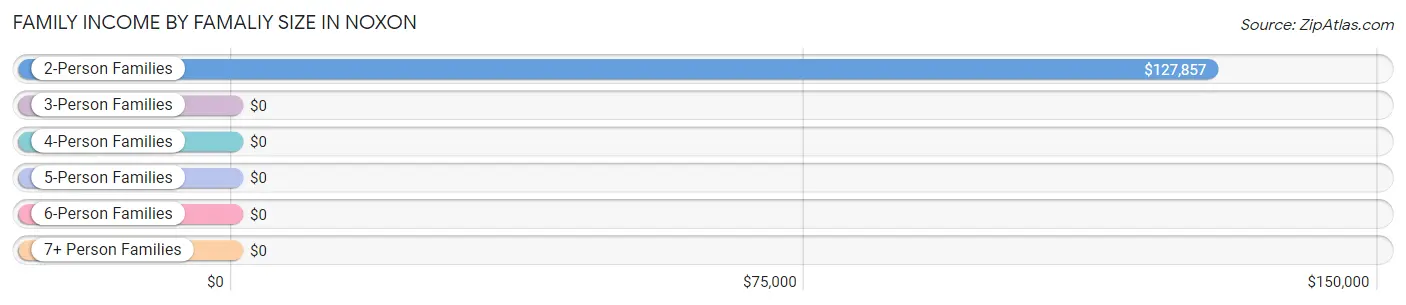
| Income Bracket | # Families | Median Income |
| 2-Person Families | 24 (53.3%) | $127,857 |
| 3-Person Families | 18 (40.0%) | $0 |
| 4-Person Families | 3 (6.7%) | $0 |
| 5-Person Families | 0 (0.0%) | $0 |
| 6-Person Families | 0 (0.0%) | $0 |
| 7+ Person Families | 0 (0.0%) | $0 |
| Total | 45 (100.0%) | $0 |
Family Income by Number of Earners in Noxon
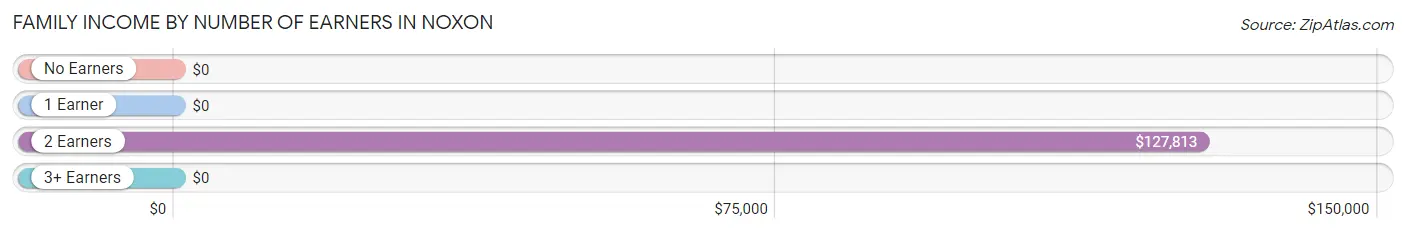
| Number of Earners | # Families | Median Income |
| No Earners | 6 (13.3%) | $0 |
| 1 Earner | 18 (40.0%) | $0 |
| 2 Earners | 21 (46.7%) | $127,813 |
| 3+ Earners | 0 (0.0%) | $0 |
| Total | 45 (100.0%) | $0 |
Household Income in Noxon
Household Income Brackets in Noxon
With 27 households falling in the category, the $50,000 to $74,999 income range is the most frequent in Noxon, accounting for 31.8% of all households.
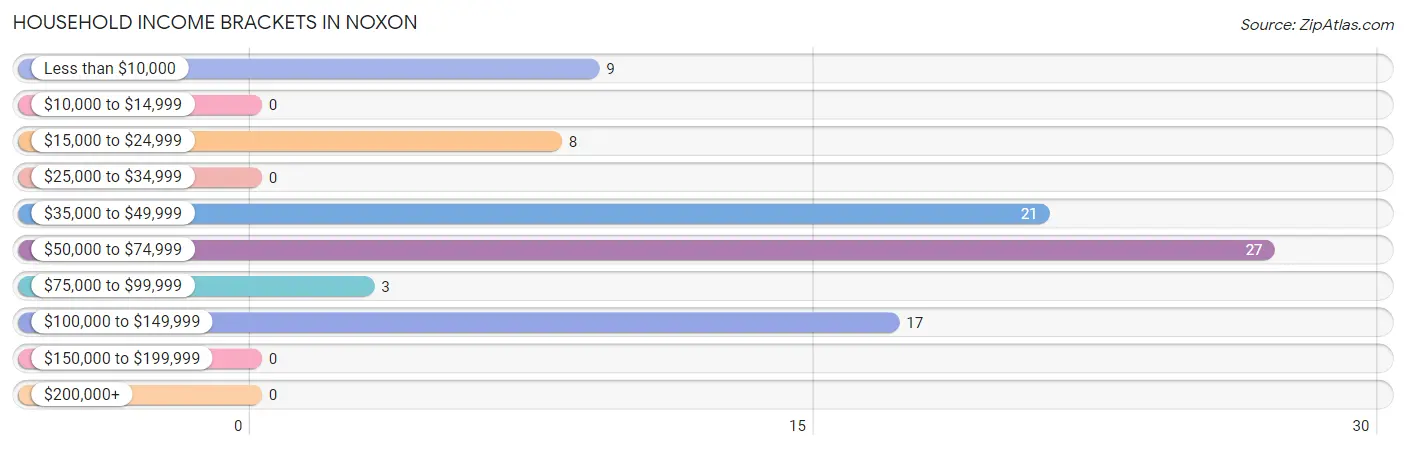
| Income Bracket | # Households | % Households |
| Less than $10,000 | 9 | 10.6% |
| $10,000 to $14,999 | 0 | 0.0% |
| $15,000 to $24,999 | 8 | 9.4% |
| $25,000 to $34,999 | 0 | 0.0% |
| $35,000 to $49,999 | 21 | 24.7% |
| $50,000 to $74,999 | 27 | 31.8% |
| $75,000 to $99,999 | 3 | 3.5% |
| $100,000 to $149,999 | 17 | 20.0% |
| $150,000 to $199,999 | 0 | 0.0% |
| $200,000+ | 0 | 0.0% |
Household Income by Householder Age in Noxon
The median household income in Noxon is $56,250, with the highest median household income of $73,125 found in the 25 to 44 years age bracket for the primary householder. A total of 21 households (24.7%) fall into this category.
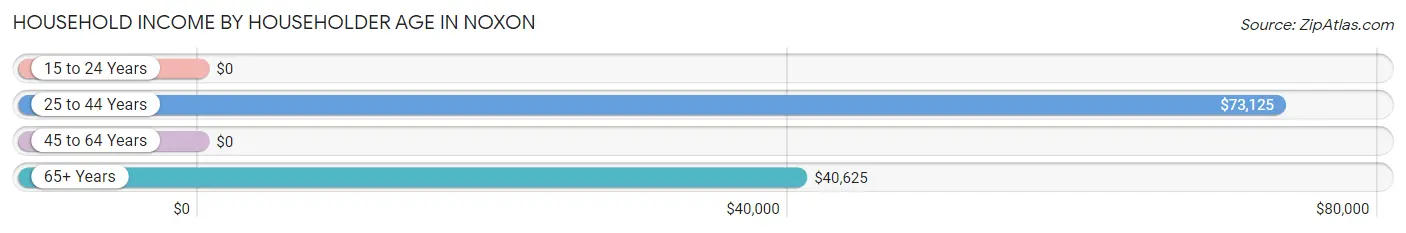
| Income Bracket | # Households | Median Income |
| 15 to 24 Years | 0 (0.0%) | $0 |
| 25 to 44 Years | 21 (24.7%) | $73,125 |
| 45 to 64 Years | 36 (42.3%) | $0 |
| 65+ Years | 28 (32.9%) | $40,625 |
| Total | 85 (100.0%) | $56,250 |
Poverty in Noxon
Income Below Poverty by Sex and Age in Noxon

| Age Bracket | Male | Female |
| Under 5 Years | 0 (0.0%) | 0 (0.0%) |
| 5 Years | 0 (0.0%) | 0 (0.0%) |
| 6 to 11 Years | 0 (0.0%) | 0 (0.0%) |
| 12 to 14 Years | 0 (0.0%) | 8 (100.0%) |
| 15 Years | 0 (0.0%) | 0 (0.0%) |
| 16 and 17 Years | 0 (0.0%) | 6 (100.0%) |
| 18 to 24 Years | 0 (0.0%) | 0 (0.0%) |
| 25 to 34 Years | 0 (0.0%) | 0 (0.0%) |
| 35 to 44 Years | 0 (0.0%) | 8 (36.4%) |
| 45 to 54 Years | 0 (0.0%) | 0 (0.0%) |
| 55 to 64 Years | 0 (0.0%) | 0 (0.0%) |
| 65 to 74 Years | 0 (0.0%) | 0 (0.0%) |
| 75 Years and over | 0 (0.0%) | 9 (75.0%) |
| Total | 0 (0.0%) | 31 (41.9%) |
Income Above Poverty by Sex and Age in Noxon
According to the poverty statistics in Noxon, males aged 15 years and females aged 6 to 11 years are the age groups that are most secure financially, with 100.0% of males and 100.0% of females in these age groups living above the poverty line.
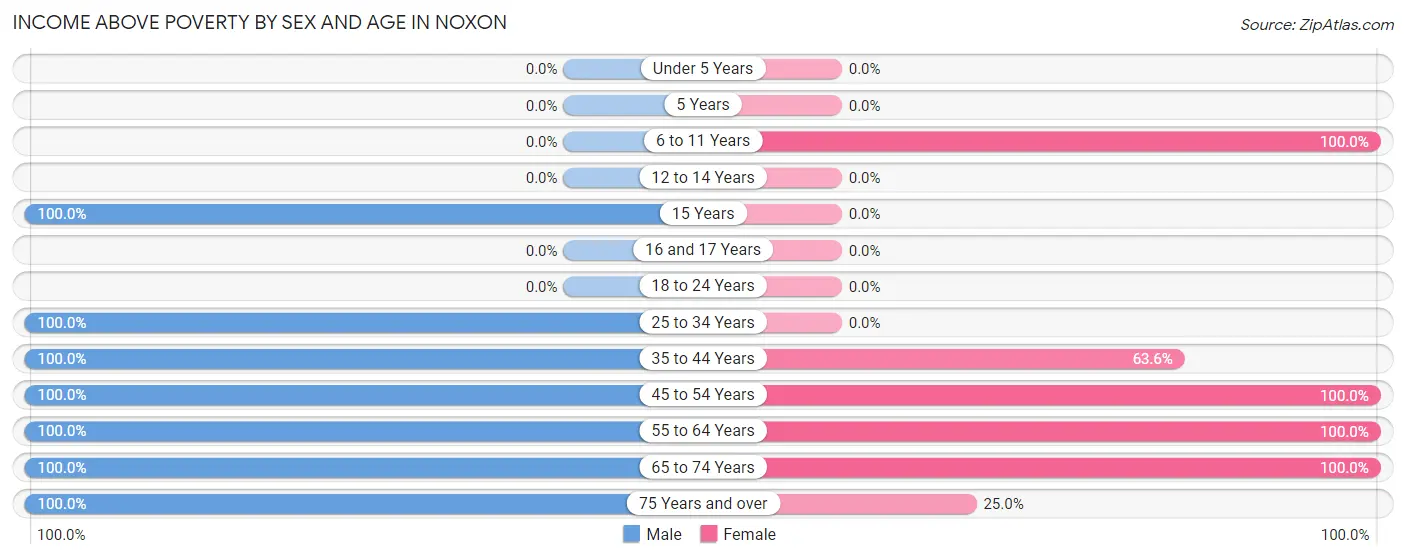
| Age Bracket | Male | Female |
| Under 5 Years | 0 (0.0%) | 0 (0.0%) |
| 5 Years | 0 (0.0%) | 0 (0.0%) |
| 6 to 11 Years | 0 (0.0%) | 8 (100.0%) |
| 12 to 14 Years | 0 (0.0%) | 0 (0.0%) |
| 15 Years | 22 (100.0%) | 0 (0.0%) |
| 16 and 17 Years | 0 (0.0%) | 0 (0.0%) |
| 18 to 24 Years | 0 (0.0%) | 0 (0.0%) |
| 25 to 34 Years | 20 (100.0%) | 0 (0.0%) |
| 35 to 44 Years | 13 (100.0%) | 14 (63.6%) |
| 45 to 54 Years | 42 (100.0%) | 12 (100.0%) |
| 55 to 64 Years | 15 (100.0%) | 4 (100.0%) |
| 65 to 74 Years | 15 (100.0%) | 2 (100.0%) |
| 75 Years and over | 4 (100.0%) | 3 (25.0%) |
| Total | 131 (100.0%) | 43 (58.1%) |
Income Below Poverty Among Married-Couple Families in Noxon
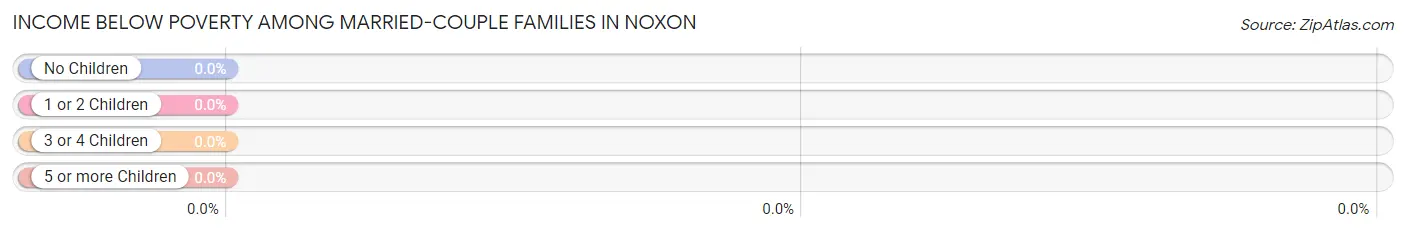
| Children | Above Poverty | Below Poverty |
| No Children | 24 (100.0%) | 0 (0.0%) |
| 1 or 2 Children | 13 (100.0%) | 0 (0.0%) |
| 3 or 4 Children | 0 (0.0%) | 0 (0.0%) |
| 5 or more Children | 0 (0.0%) | 0 (0.0%) |
| Total | 37 (100.0%) | 0 (0.0%) |
Income Below Poverty Among Single-Parent Households in Noxon
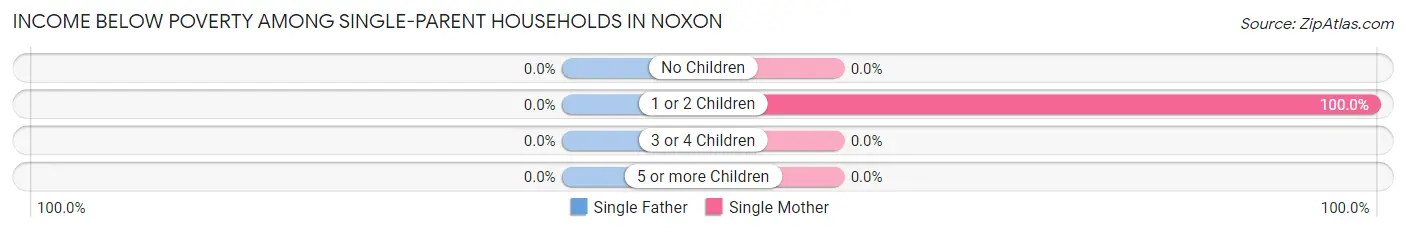
| Children | Single Father | Single Mother |
| No Children | 0 (0.0%) | 0 (0.0%) |
| 1 or 2 Children | 0 (0.0%) | 8 (100.0%) |
| 3 or 4 Children | 0 (0.0%) | 0 (0.0%) |
| 5 or more Children | 0 (0.0%) | 0 (0.0%) |
| Total | 0 (0.0%) | 8 (100.0%) |
Income Below Poverty Among Married-Couple vs Single-Parent Households in Noxon
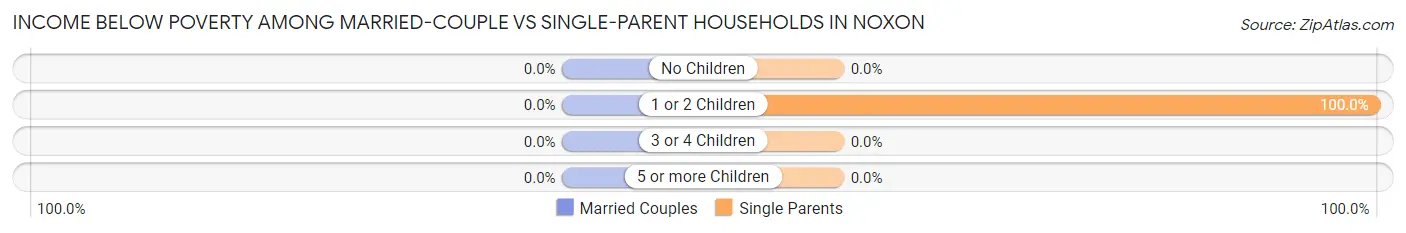
| Children | Married-Couple Families | Single-Parent Households |
| No Children | 0 (0.0%) | 0 (0.0%) |
| 1 or 2 Children | 0 (0.0%) | 8 (100.0%) |
| 3 or 4 Children | 0 (0.0%) | 0 (0.0%) |
| 5 or more Children | 0 (0.0%) | 0 (0.0%) |
| Total | 0 (0.0%) | 8 (100.0%) |
Race in Noxon
The most populous races in Noxon are White / Caucasian (194 | 94.6%), Native / Alaskan (8 | 3.9%), and Two or more Races (3 | 1.5%).
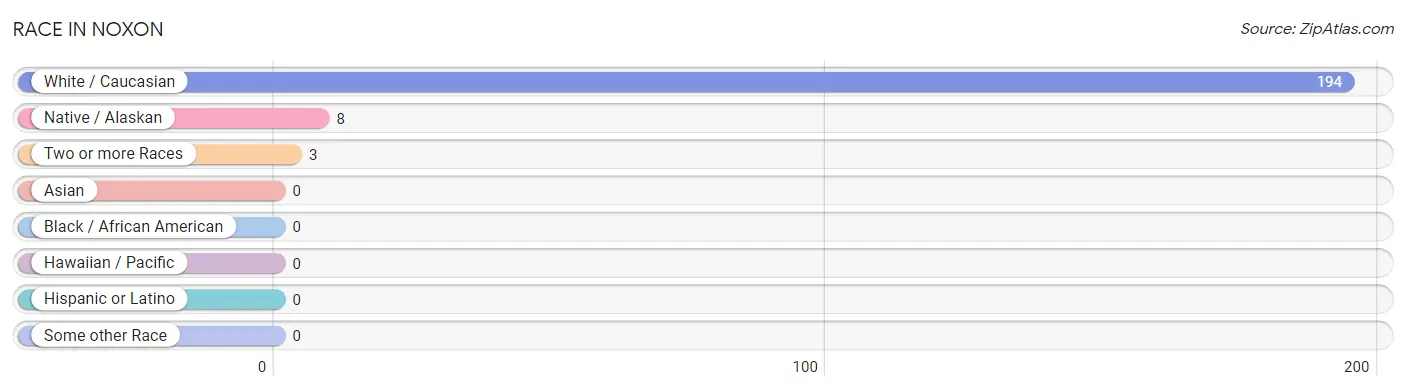
| Race | # Population | % Population |
| Asian | 0 | 0.0% |
| Black / African American | 0 | 0.0% |
| Hawaiian / Pacific | 0 | 0.0% |
| Hispanic or Latino | 0 | 0.0% |
| Native / Alaskan | 8 | 3.9% |
| White / Caucasian | 194 | 94.6% |
| Two or more Races | 3 | 1.5% |
| Some other Race | 0 | 0.0% |
| Total | 205 | 100.0% |
Ancestry in Noxon
The most populous ancestries reported in Noxon are German (71 | 34.6%), American (42 | 20.5%), Polish (20 | 9.8%), English (16 | 7.8%), and Swedish (12 | 5.9%), together accounting for 78.5% of all Noxon residents.
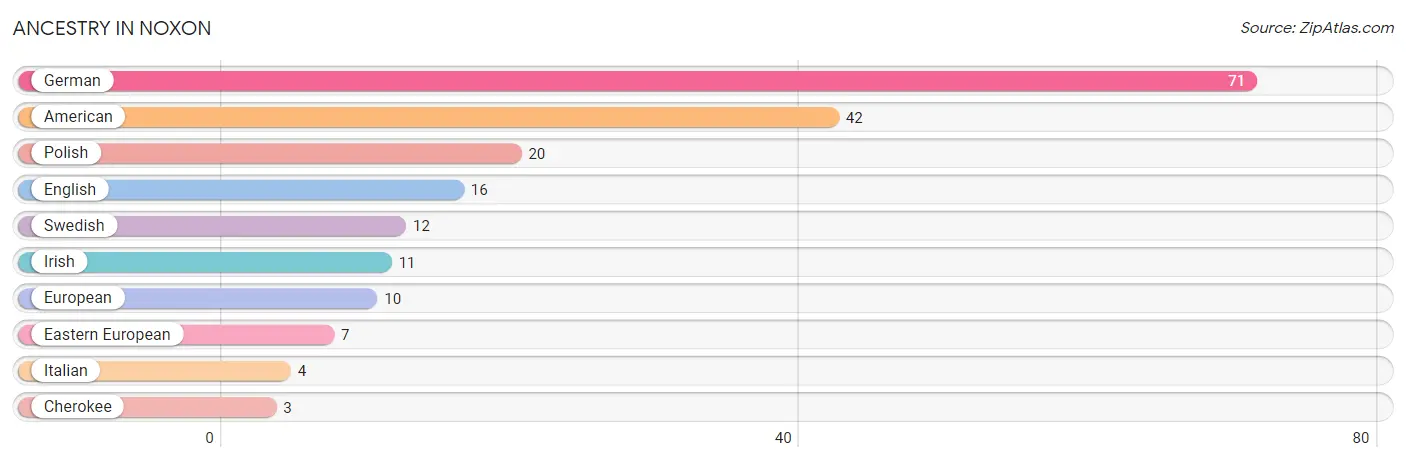
| Ancestry | # Population | % Population |
| American | 42 | 20.5% |
| Cherokee | 3 | 1.5% |
| Eastern European | 7 | 3.4% |
| English | 16 | 7.8% |
| European | 10 | 4.9% |
| German | 71 | 34.6% |
| Irish | 11 | 5.4% |
| Italian | 4 | 1.9% |
| Polish | 20 | 9.8% |
| Swedish | 12 | 5.9% | View All 10 Rows |
Immigrants in Noxon

| Immigration Origin | # Population | % Population | View All 0 Rows |
Sex and Age in Noxon
Sex and Age in Noxon
The most populous age groups in Noxon are 45 to 49 Years (30 | 22.9%) for men and 35 to 39 Years (22 | 29.7%) for women.
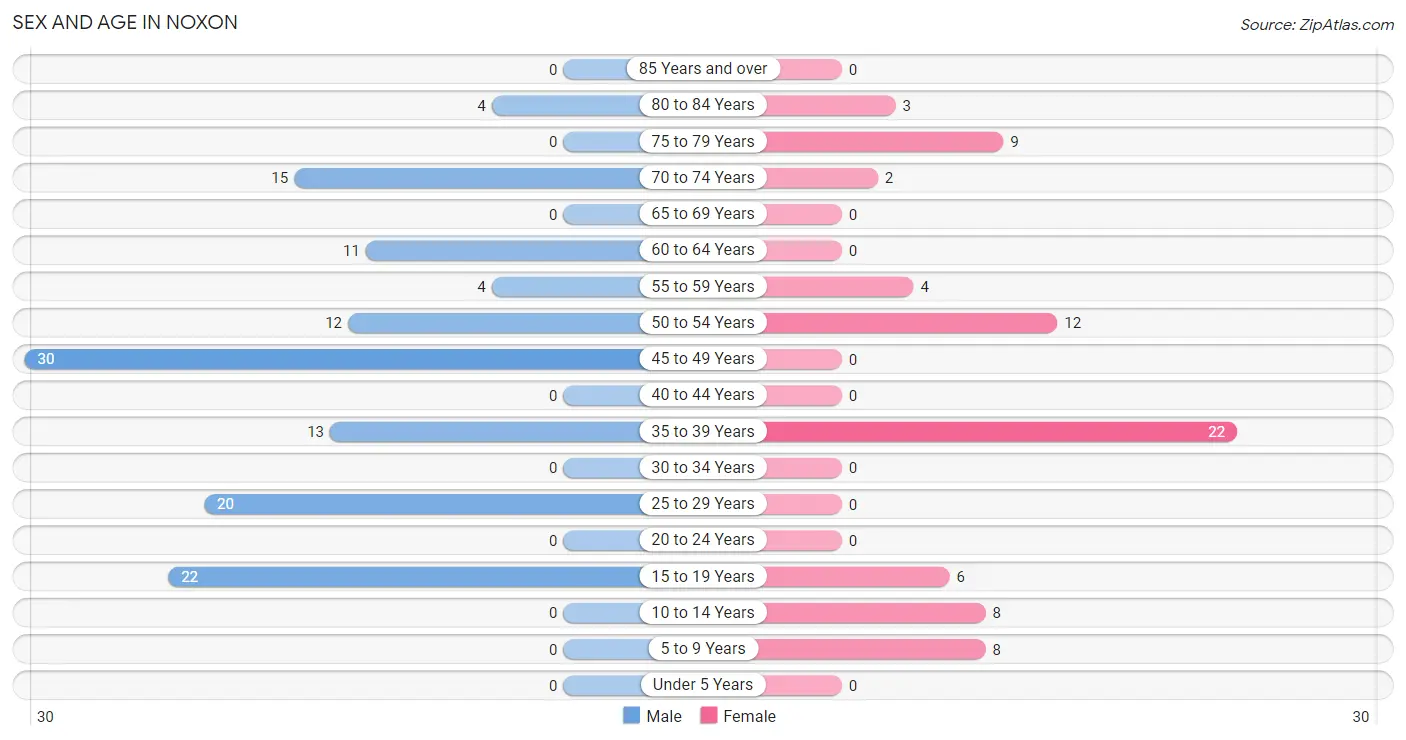
| Age Bracket | Male | Female |
| Under 5 Years | 0 (0.0%) | 0 (0.0%) |
| 5 to 9 Years | 0 (0.0%) | 8 (10.8%) |
| 10 to 14 Years | 0 (0.0%) | 8 (10.8%) |
| 15 to 19 Years | 22 (16.8%) | 6 (8.1%) |
| 20 to 24 Years | 0 (0.0%) | 0 (0.0%) |
| 25 to 29 Years | 20 (15.3%) | 0 (0.0%) |
| 30 to 34 Years | 0 (0.0%) | 0 (0.0%) |
| 35 to 39 Years | 13 (9.9%) | 22 (29.7%) |
| 40 to 44 Years | 0 (0.0%) | 0 (0.0%) |
| 45 to 49 Years | 30 (22.9%) | 0 (0.0%) |
| 50 to 54 Years | 12 (9.2%) | 12 (16.2%) |
| 55 to 59 Years | 4 (3.0%) | 4 (5.4%) |
| 60 to 64 Years | 11 (8.4%) | 0 (0.0%) |
| 65 to 69 Years | 0 (0.0%) | 0 (0.0%) |
| 70 to 74 Years | 15 (11.5%) | 2 (2.7%) |
| 75 to 79 Years | 0 (0.0%) | 9 (12.2%) |
| 80 to 84 Years | 4 (3.0%) | 3 (4.1%) |
| 85 Years and over | 0 (0.0%) | 0 (0.0%) |
| Total | 131 (100.0%) | 74 (100.0%) |
Families and Households in Noxon
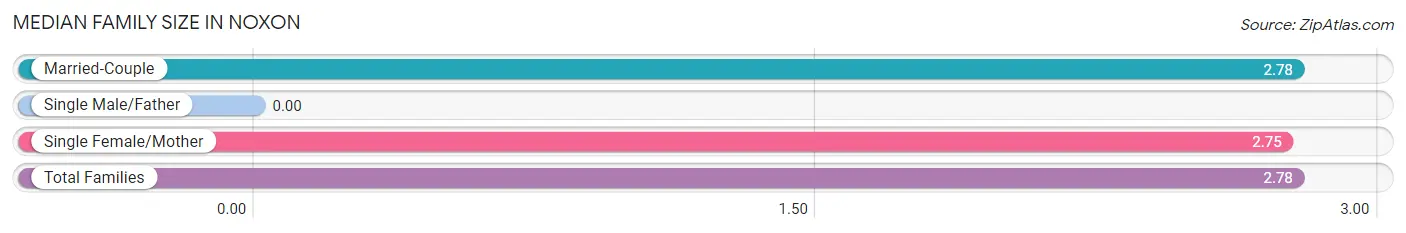
Median Family Size in Noxon
| Family Type | # Families | Family Size |
| Married-Couple | 37 (82.2%) | 2.78 |
| Single Male/Father | 0 (0.0%) | - |
| Single Female/Mother | 8 (17.8%) | 2.75 |
| Total Families | 45 (100.0%) | 2.78 |
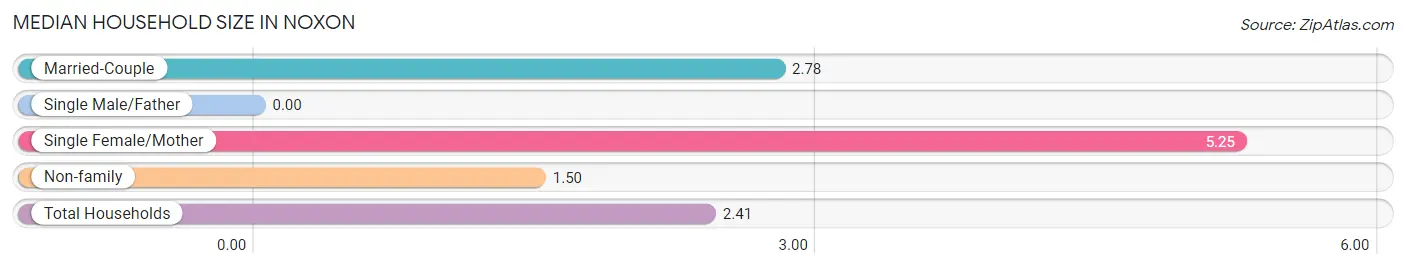
Median Household Size in Noxon
| Household Type | # Households | Household Size |
| Married-Couple | 37 (43.5%) | 2.78 |
| Single Male/Father | 0 (0.0%) | - |
| Single Female/Mother | 8 (9.4%) | 5.25 |
| Non-family | 40 (47.1%) | 1.50 |
| Total Households | 85 (100.0%) | 2.41 |
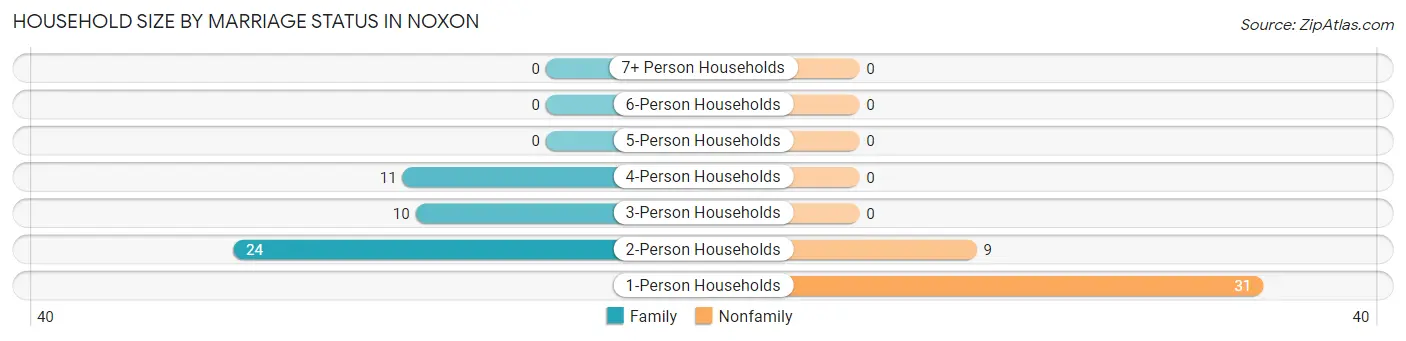
Household Size by Marriage Status in Noxon
Out of a total of 85 households in Noxon, 45 (52.9%) are family households, while 40 (47.1%) are nonfamily households. The most numerous type of family households are 2-person households, comprising 24, and the most common type of nonfamily households are 1-person households, comprising 31.
| Household Size | Family Households | Nonfamily Households |
| 1-Person Households | - | 31 (36.5%) |
| 2-Person Households | 24 (28.2%) | 9 (10.6%) |
| 3-Person Households | 10 (11.8%) | 0 (0.0%) |
| 4-Person Households | 11 (12.9%) | 0 (0.0%) |
| 5-Person Households | 0 (0.0%) | 0 (0.0%) |
| 6-Person Households | 0 (0.0%) | 0 (0.0%) |
| 7+ Person Households | 0 (0.0%) | 0 (0.0%) |
| Total | 45 (52.9%) | 40 (47.1%) |
Female Fertility in Noxon
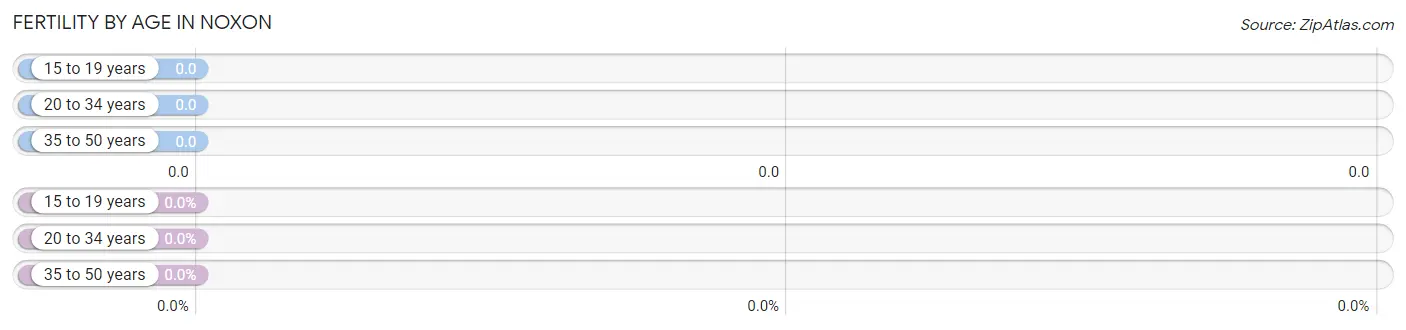
Fertility by Age in Noxon
| Age Bracket | Women with Births | Births / 1,000 Women |
| 15 to 19 years | 0 (0.0%) | 0.0 |
| 20 to 34 years | 0 (0.0%) | 0.0 |
| 35 to 50 years | 0 (0.0%) | 0.0 |
| Total | 0 (0.0%) | 0.0 |
Fertility by Age by Marriage Status in Noxon
| Age Bracket | Married | Unmarried |
| 15 to 19 years | 0 (0.0%) | 0 (0.0%) |
| 20 to 34 years | 0 (0.0%) | 0 (0.0%) |
| 35 to 50 years | 0 (0.0%) | 0 (0.0%) |
| Total | 0 (0.0%) | 0 (0.0%) |
Fertility by Education in Noxon
| Educational Attainment | Women with Births | Births / 1,000 Women |
| Less than High School | 0 (0.0%) | 0.0 |
| High School Diploma | 0 (0.0%) | 0.0 |
| College or Associate's Degree | 0 (0.0%) | 0.0 |
| Bachelor's Degree | 0 (0.0%) | 0.0 |
| Graduate Degree | 0 (0.0%) | 0.0 |
| Total | 0 (0.0%) | 0.0 |
Fertility by Education by Marriage Status in Noxon
| Educational Attainment | Married | Unmarried |
| Less than High School | 0 (0.0%) | 0 (0.0%) |
| High School Diploma | 0 (0.0%) | 0 (0.0%) |
| College or Associate's Degree | 0 (0.0%) | 0 (0.0%) |
| Bachelor's Degree | 0 (0.0%) | 0 (0.0%) |
| Graduate Degree | 0 (0.0%) | 0 (0.0%) |
| Total | 0 (0.0%) | 0 (0.0%) |
Employment Characteristics in Noxon
Employment by Class of Employer in Noxon
Among the 100 employed individuals in Noxon, private company employees (43 | 43.0%), federal government employees (26 | 26.0%), and local government employees (18 | 18.0%) make up the most common classes of employment.
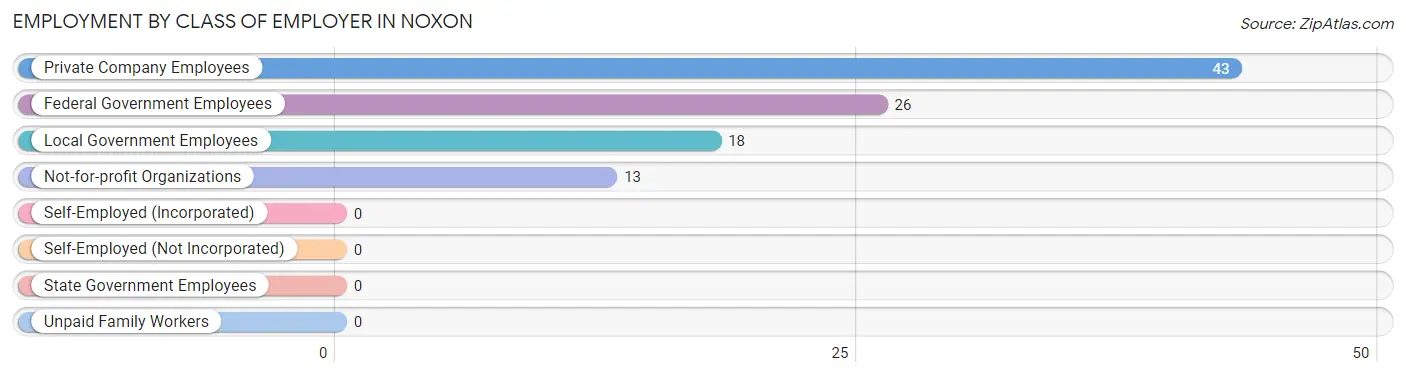
| Employer Class | # Employees | % Employees |
| Private Company Employees | 43 | 43.0% |
| Self-Employed (Incorporated) | 0 | 0.0% |
| Self-Employed (Not Incorporated) | 0 | 0.0% |
| Not-for-profit Organizations | 13 | 13.0% |
| Local Government Employees | 18 | 18.0% |
| State Government Employees | 0 | 0.0% |
| Federal Government Employees | 26 | 26.0% |
| Unpaid Family Workers | 0 | 0.0% |
| Total | 100 | 100.0% |
Employment Status by Age in Noxon
According to the labor force statistics for Noxon, out of the total population over 16 years of age (167), 65.3% or 109 individuals are in the labor force, with 8.3% or 9 of them unemployed. The age group with the highest labor force participation rate is 25 to 29 years, with 100.0% or 20 individuals in the labor force. Within the labor force, the 65 to 74 years age range has the highest percentage of unemployed individuals, with 100.0% or 9 of them being unemployed.
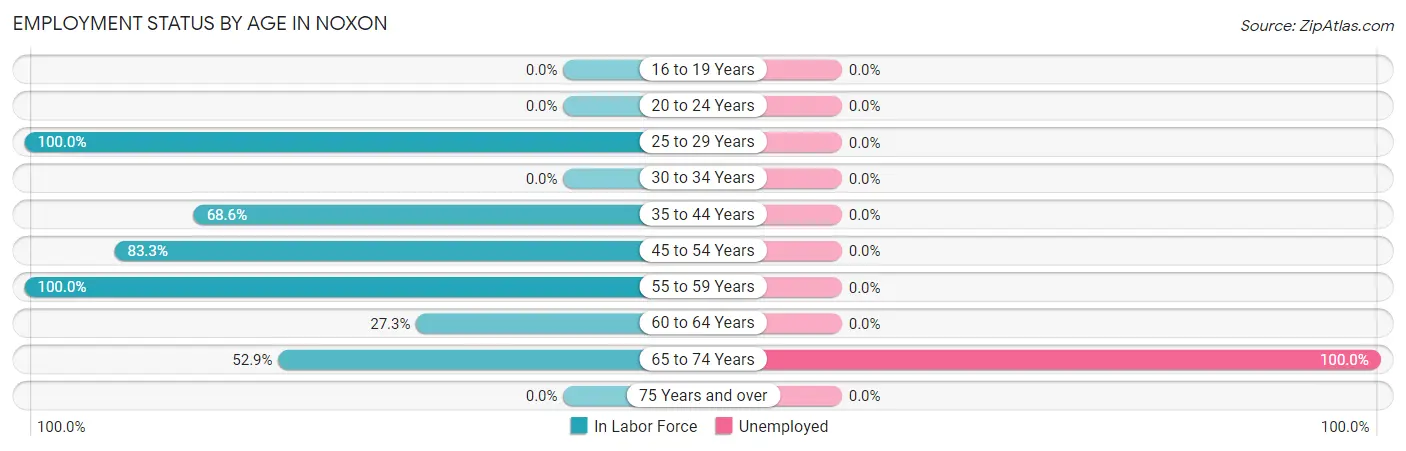
| Age Bracket | In Labor Force | Unemployed |
| 16 to 19 Years | 0 (0.0%) | 0 (0.0%) |
| 20 to 24 Years | 0 (0.0%) | 0 (0.0%) |
| 25 to 29 Years | 20 (100.0%) | 0 (0.0%) |
| 30 to 34 Years | 0 (0.0%) | 0 (0.0%) |
| 35 to 44 Years | 24 (68.6%) | 0 (0.0%) |
| 45 to 54 Years | 45 (83.3%) | 0 (0.0%) |
| 55 to 59 Years | 8 (100.0%) | 0 (0.0%) |
| 60 to 64 Years | 3 (27.3%) | 0 (0.0%) |
| 65 to 74 Years | 9 (52.9%) | 9 (100.0%) |
| 75 Years and over | 0 (0.0%) | 0 (0.0%) |
| Total | 109 (65.3%) | 9 (8.3%) |
Employment Status by Educational Attainment in Noxon
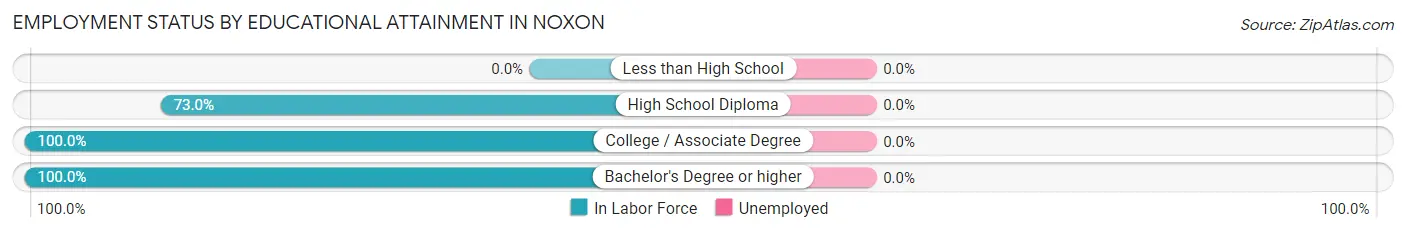
| Educational Attainment | In Labor Force | Unemployed |
| Less than High School | 0 (0.0%) | 0 (0.0%) |
| High School Diploma | 54 (73.0%) | 0 (0.0%) |
| College / Associate Degree | 30 (100.0%) | 0 (0.0%) |
| Bachelor's Degree or higher | 16 (100.0%) | 0 (0.0%) |
| Total | 100 (78.1%) | 0 (0.0%) |
Employment Occupations by Sex in Noxon
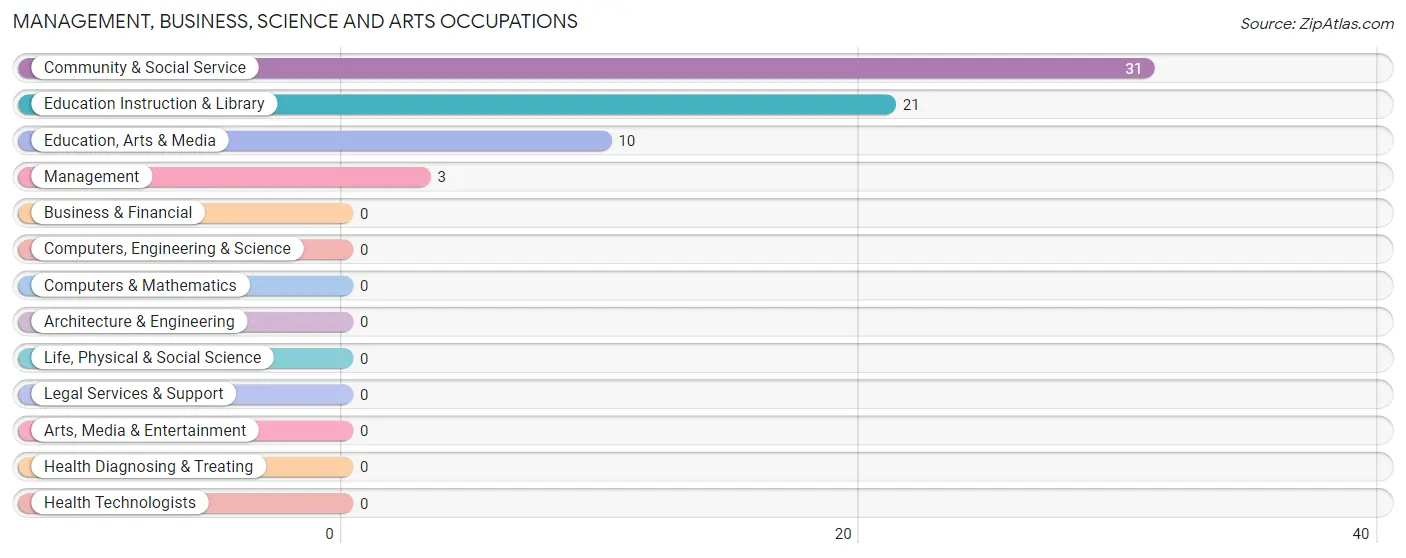
Management, Business, Science and Arts Occupations
The most common Management, Business, Science and Arts occupations in Noxon are Community & Social Service (31 | 31.0%), Education Instruction & Library (21 | 21.0%), Education, Arts & Media (10 | 10.0%), and Management (3 | 3.0%).
Management, Business, Science and Arts Occupations by Sex
Within the Management, Business, Science and Arts occupations in Noxon, the most male-oriented occupations are Education, Arts & Media (100.0%), Community & Social Service (64.5%), and Education Instruction & Library (47.6%), while the most female-oriented occupations are Management (100.0%), Education Instruction & Library (52.4%), and Community & Social Service (35.5%).
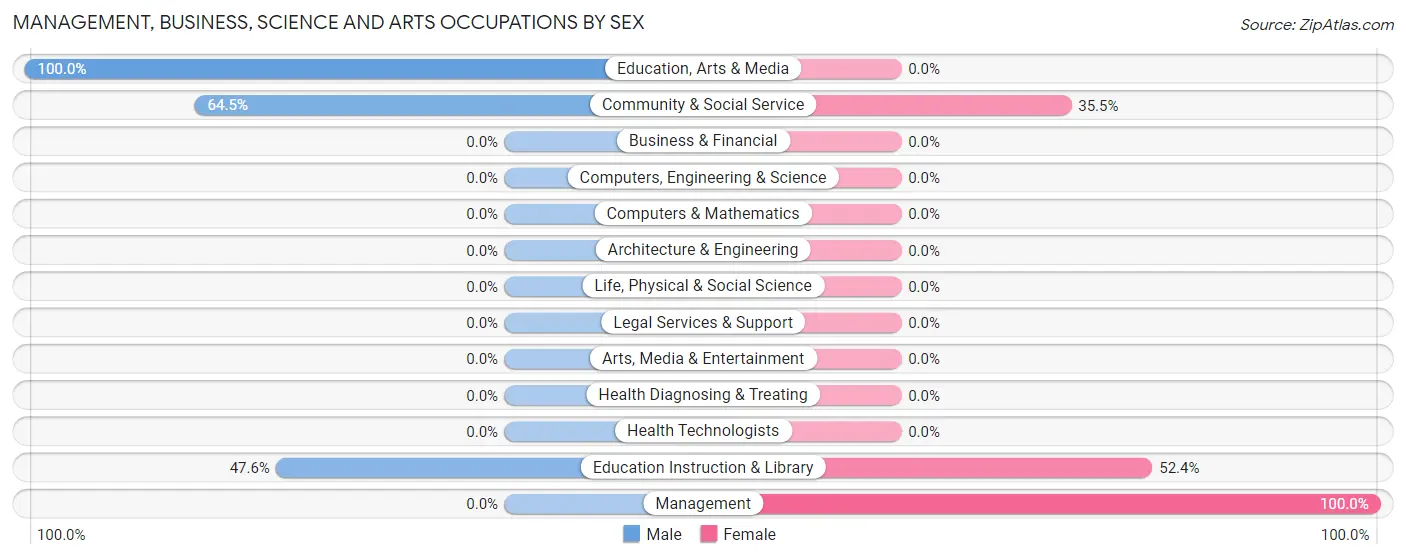
| Occupation | Male | Female |
| Management | 0 (0.0%) | 3 (100.0%) |
| Business & Financial | 0 (0.0%) | 0 (0.0%) |
| Computers, Engineering & Science | 0 (0.0%) | 0 (0.0%) |
| Computers & Mathematics | 0 (0.0%) | 0 (0.0%) |
| Architecture & Engineering | 0 (0.0%) | 0 (0.0%) |
| Life, Physical & Social Science | 0 (0.0%) | 0 (0.0%) |
| Community & Social Service | 20 (64.5%) | 11 (35.5%) |
| Education, Arts & Media | 10 (100.0%) | 0 (0.0%) |
| Legal Services & Support | 0 (0.0%) | 0 (0.0%) |
| Education Instruction & Library | 10 (47.6%) | 11 (52.4%) |
| Arts, Media & Entertainment | 0 (0.0%) | 0 (0.0%) |
| Health Diagnosing & Treating | 0 (0.0%) | 0 (0.0%) |
| Health Technologists | 0 (0.0%) | 0 (0.0%) |
| Total (Category) | 20 (58.8%) | 14 (41.2%) |
| Total (Overall) | 82 (82.0%) | 18 (18.0%) |
Services Occupations
The most common Services occupations in Noxon are Security & Protection (23 | 23.0%), and Firefighting & Prevention (23 | 23.0%).
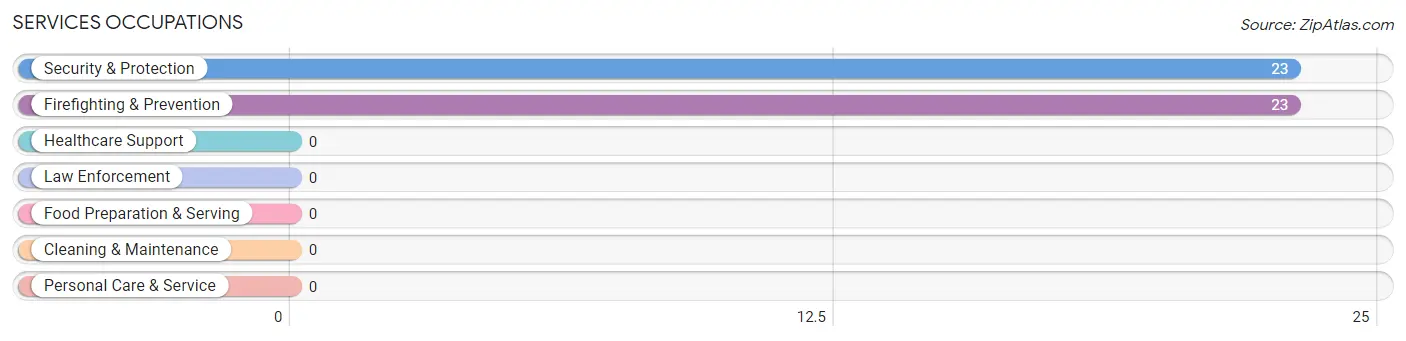
Services Occupations by Sex
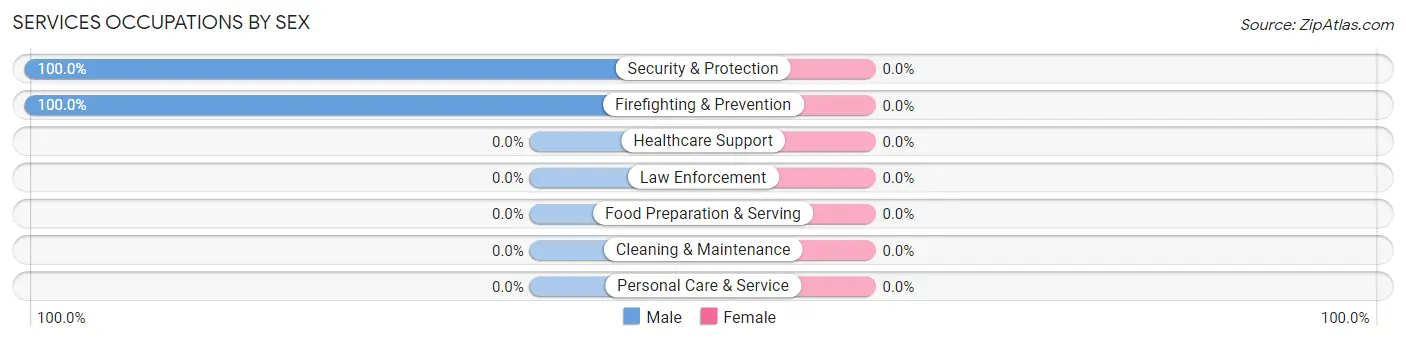
| Occupation | Male | Female |
| Healthcare Support | 0 (0.0%) | 0 (0.0%) |
| Security & Protection | 23 (100.0%) | 0 (0.0%) |
| Firefighting & Prevention | 23 (100.0%) | 0 (0.0%) |
| Law Enforcement | 0 (0.0%) | 0 (0.0%) |
| Food Preparation & Serving | 0 (0.0%) | 0 (0.0%) |
| Cleaning & Maintenance | 0 (0.0%) | 0 (0.0%) |
| Personal Care & Service | 0 (0.0%) | 0 (0.0%) |
| Total (Category) | 23 (100.0%) | 0 (0.0%) |
| Total (Overall) | 82 (82.0%) | 18 (18.0%) |
Sales and Office Occupations
The most common Sales and Office occupations in Noxon are , and Sales & Related (4 | 4.0%).
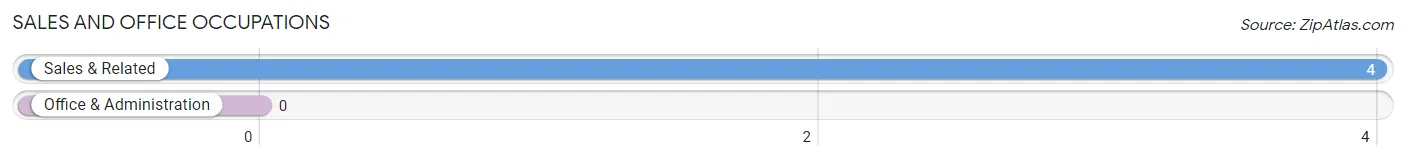
Sales and Office Occupations by Sex
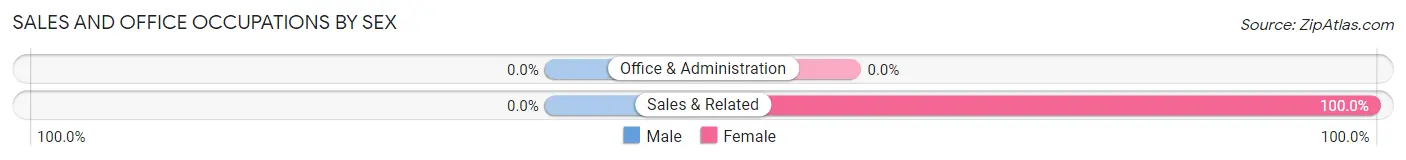
| Occupation | Male | Female |
| Sales & Related | 0 (0.0%) | 4 (100.0%) |
| Office & Administration | 0 (0.0%) | 0 (0.0%) |
| Total (Category) | 0 (0.0%) | 4 (100.0%) |
| Total (Overall) | 82 (82.0%) | 18 (18.0%) |
Natural Resources, Construction and Maintenance Occupations
The most common Natural Resources, Construction and Maintenance occupations in Noxon are , and Farming, Fishing & Forestry (20 | 20.0%).
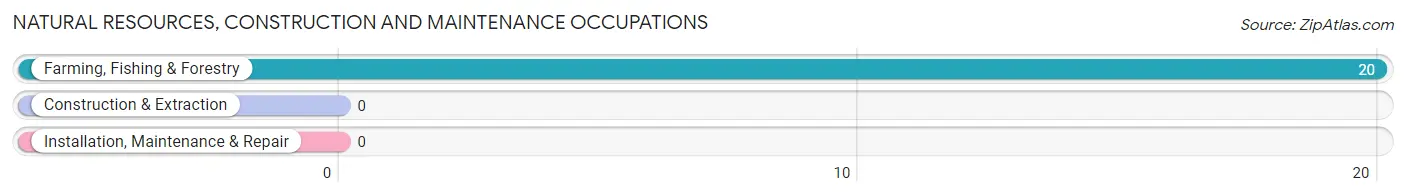
Natural Resources, Construction and Maintenance Occupations by Sex
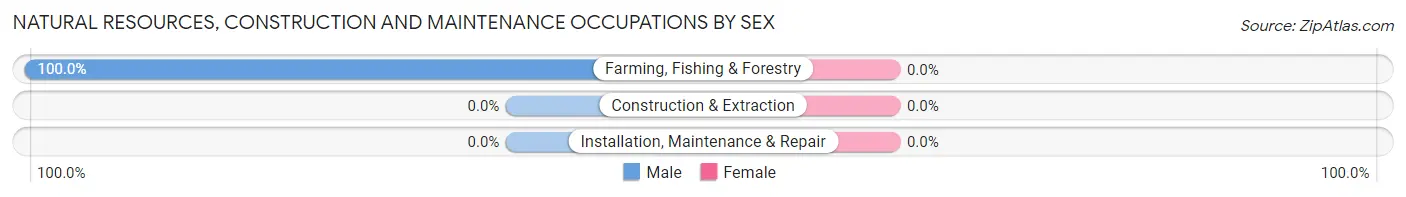
| Occupation | Male | Female |
| Farming, Fishing & Forestry | 20 (100.0%) | 0 (0.0%) |
| Construction & Extraction | 0 (0.0%) | 0 (0.0%) |
| Installation, Maintenance & Repair | 0 (0.0%) | 0 (0.0%) |
| Total (Category) | 20 (100.0%) | 0 (0.0%) |
| Total (Overall) | 82 (82.0%) | 18 (18.0%) |
Production, Transportation and Moving Occupations
The most common Production, Transportation and Moving occupations in Noxon are Transportation (12 | 12.0%), Production (4 | 4.0%), and Material Moving (3 | 3.0%).
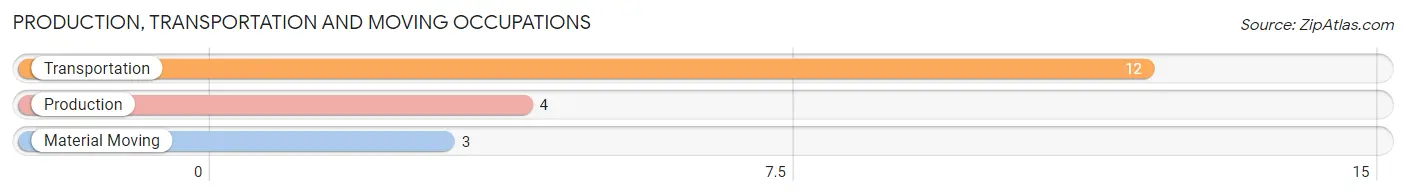
Production, Transportation and Moving Occupations by Sex
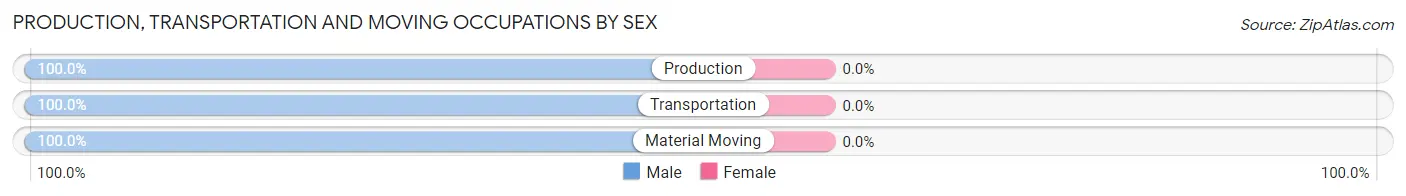
| Occupation | Male | Female |
| Production | 4 (100.0%) | 0 (0.0%) |
| Transportation | 12 (100.0%) | 0 (0.0%) |
| Material Moving | 3 (100.0%) | 0 (0.0%) |
| Total (Category) | 19 (100.0%) | 0 (0.0%) |
| Total (Overall) | 82 (82.0%) | 18 (18.0%) |
Employment Industries by Sex in Noxon
Employment Industries in Noxon
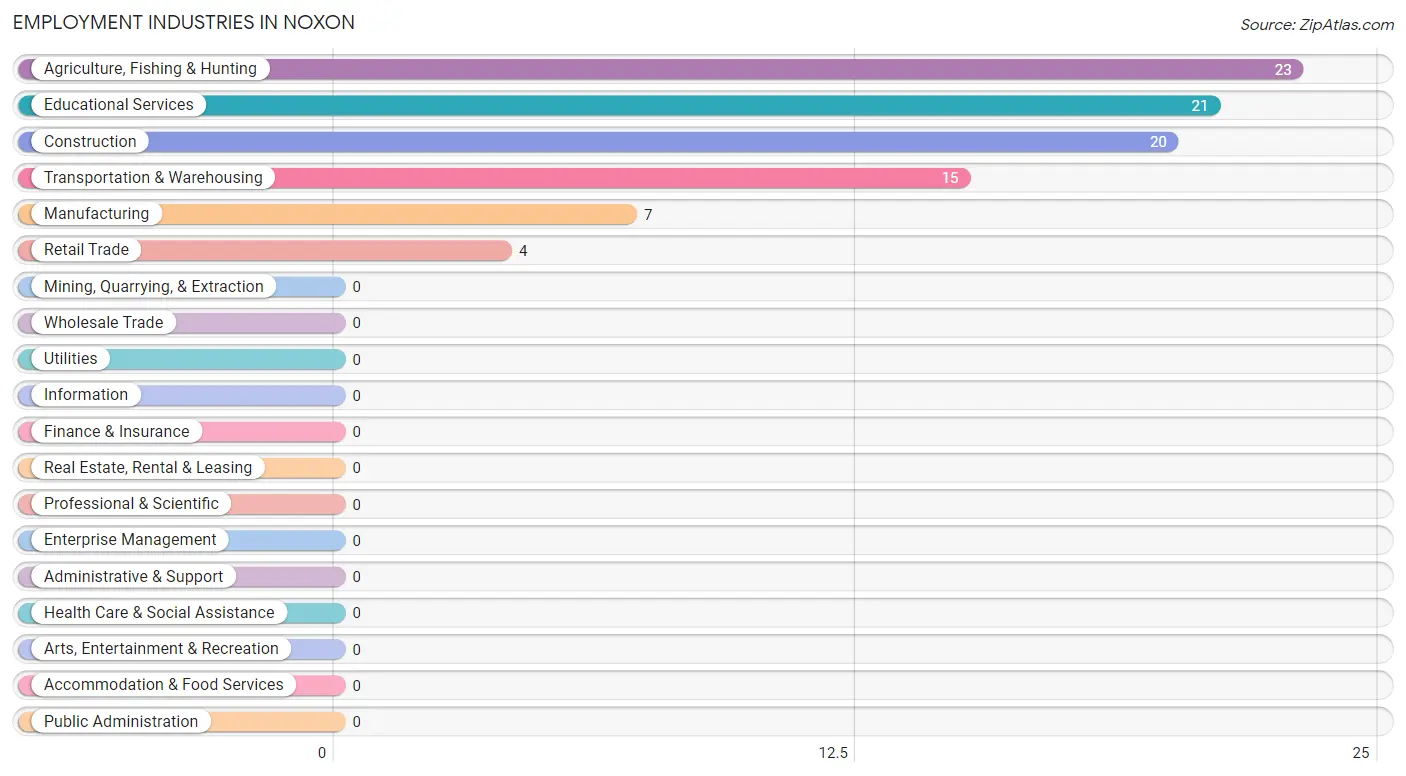
The major employment industries in Noxon include Agriculture, Fishing & Hunting (23 | 23.0%), Educational Services (21 | 21.0%), Construction (20 | 20.0%), Transportation & Warehousing (15 | 15.0%), and Manufacturing (7 | 7.0%).
Employment Industries by Sex in Noxon
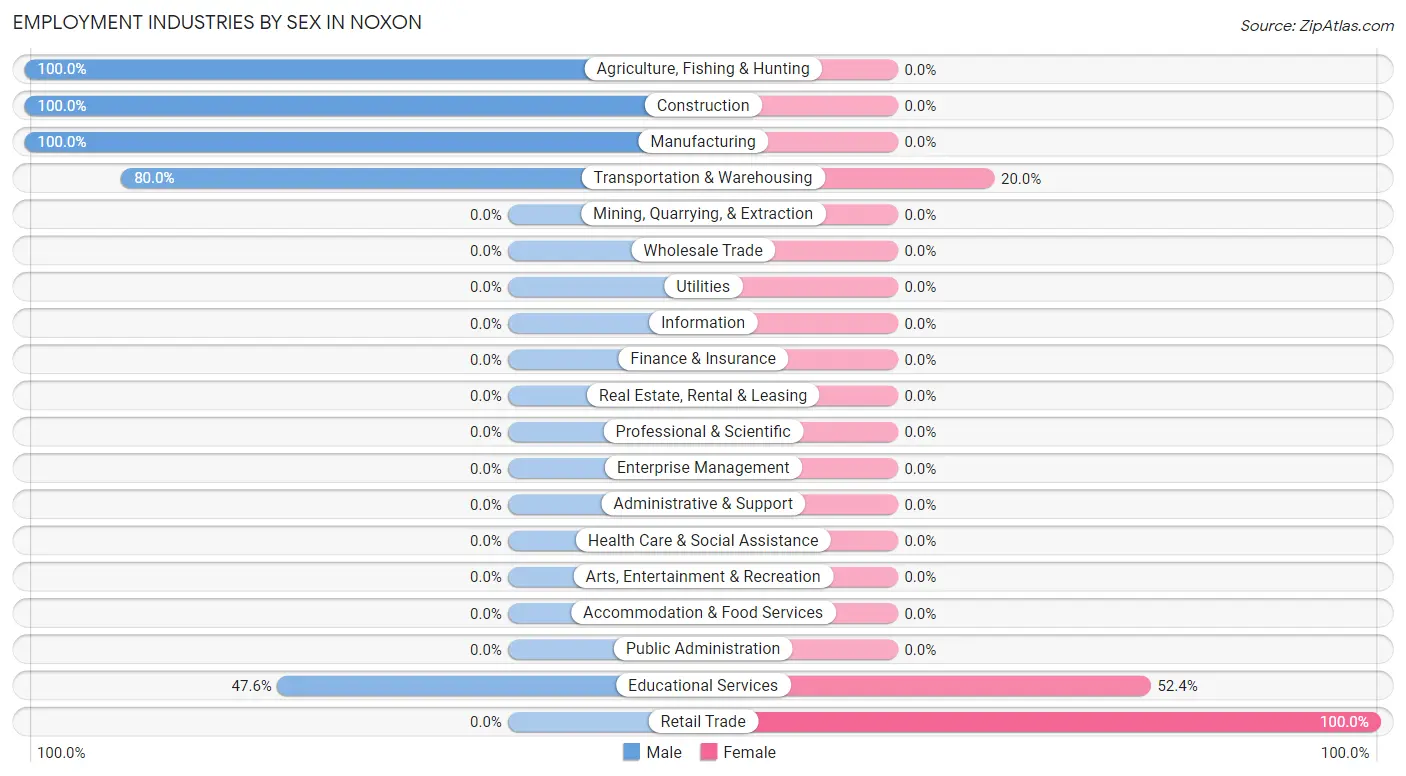
The Noxon industries that see more men than women are Agriculture, Fishing & Hunting (100.0%), Construction (100.0%), and Manufacturing (100.0%), whereas the industries that tend to have a higher number of women are Retail Trade (100.0%), Educational Services (52.4%), and Transportation & Warehousing (20.0%).
| Industry | Male | Female |
| Agriculture, Fishing & Hunting | 23 (100.0%) | 0 (0.0%) |
| Mining, Quarrying, & Extraction | 0 (0.0%) | 0 (0.0%) |
| Construction | 20 (100.0%) | 0 (0.0%) |
| Manufacturing | 7 (100.0%) | 0 (0.0%) |
| Wholesale Trade | 0 (0.0%) | 0 (0.0%) |
| Retail Trade | 0 (0.0%) | 4 (100.0%) |
| Transportation & Warehousing | 12 (80.0%) | 3 (20.0%) |
| Utilities | 0 (0.0%) | 0 (0.0%) |
| Information | 0 (0.0%) | 0 (0.0%) |
| Finance & Insurance | 0 (0.0%) | 0 (0.0%) |
| Real Estate, Rental & Leasing | 0 (0.0%) | 0 (0.0%) |
| Professional & Scientific | 0 (0.0%) | 0 (0.0%) |
| Enterprise Management | 0 (0.0%) | 0 (0.0%) |
| Administrative & Support | 0 (0.0%) | 0 (0.0%) |
| Educational Services | 10 (47.6%) | 11 (52.4%) |
| Health Care & Social Assistance | 0 (0.0%) | 0 (0.0%) |
| Arts, Entertainment & Recreation | 0 (0.0%) | 0 (0.0%) |
| Accommodation & Food Services | 0 (0.0%) | 0 (0.0%) |
| Public Administration | 0 (0.0%) | 0 (0.0%) |
| Total | 82 (82.0%) | 18 (18.0%) |
Education in Noxon
School Enrollment in Noxon
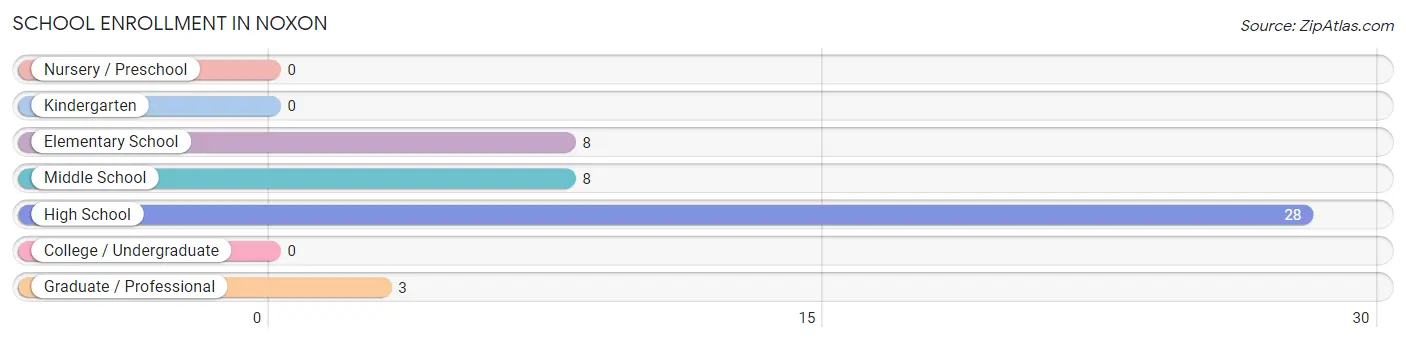
The most common levels of schooling among the 47 students in Noxon are high school (28 | 59.6%), elementary school (8 | 17.0%), and middle school (8 | 17.0%).
| School Level | # Students | % Students |
| Nursery / Preschool | 0 | 0.0% |
| Kindergarten | 0 | 0.0% |
| Elementary School | 8 | 17.0% |
| Middle School | 8 | 17.0% |
| High School | 28 | 59.6% |
| College / Undergraduate | 0 | 0.0% |
| Graduate / Professional | 3 | 6.4% |
| Total | 47 | 100.0% |
School Enrollment by Age by Funding Source in Noxon
| Age Bracket | Public School | Private School |
| 3 to 4 Year Olds | 0 (0.0%) | 0 (0.0%) |
| 5 to 9 Year Old | 8 (100.0%) | 0 (0.0%) |
| 10 to 14 Year Olds | 8 (100.0%) | 0 (0.0%) |
| 15 to 17 Year Olds | 28 (100.0%) | 0 (0.0%) |
| 18 to 19 Year Olds | 0 (0.0%) | 0 (0.0%) |
| 20 to 24 Year Olds | 0 (0.0%) | 0 (0.0%) |
| 25 to 34 Year Olds | 0 (0.0%) | 0 (0.0%) |
| 35 Years and over | 3 (100.0%) | 0 (0.0%) |
| Total | 47 (100.0%) | 0 (0.0%) |
Educational Attainment by Field of Study in Noxon
Education (20 | 90.9%), and bio, nature & agricultural (2 | 9.1%) are the most common fields of study among 22 individuals in Noxon who have obtained a bachelor's degree or higher.
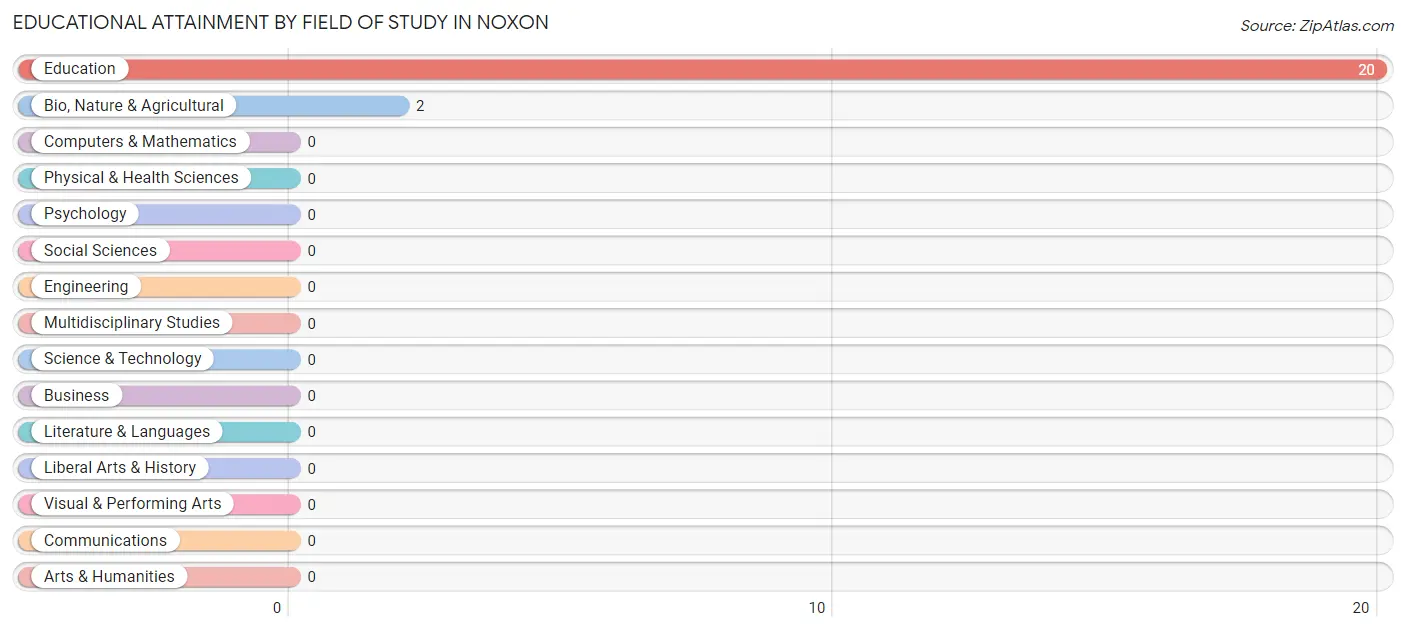
| Field of Study | # Graduates | % Graduates |
| Computers & Mathematics | 0 | 0.0% |
| Bio, Nature & Agricultural | 2 | 9.1% |
| Physical & Health Sciences | 0 | 0.0% |
| Psychology | 0 | 0.0% |
| Social Sciences | 0 | 0.0% |
| Engineering | 0 | 0.0% |
| Multidisciplinary Studies | 0 | 0.0% |
| Science & Technology | 0 | 0.0% |
| Business | 0 | 0.0% |
| Education | 20 | 90.9% |
| Literature & Languages | 0 | 0.0% |
| Liberal Arts & History | 0 | 0.0% |
| Visual & Performing Arts | 0 | 0.0% |
| Communications | 0 | 0.0% |
| Arts & Humanities | 0 | 0.0% |
| Total | 22 | 100.0% |
Transportation & Commute in Noxon
Vehicle Availability by Sex in Noxon
The most prevalent vehicle ownership categories in Noxon are males with 3 vehicles (27, accounting for 32.9%) and females with 3 vehicles (14, making up 150.0%).
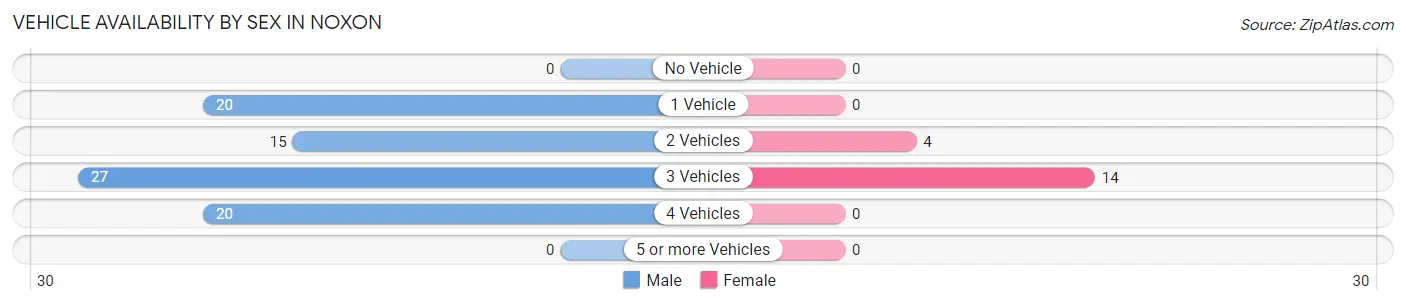
| Vehicles Available | Male | Female |
| No Vehicle | 0 (0.0%) | 0 (0.0%) |
| 1 Vehicle | 20 (24.4%) | 0 (0.0%) |
| 2 Vehicles | 15 (18.3%) | 4 (22.2%) |
| 3 Vehicles | 27 (32.9%) | 14 (77.8%) |
| 4 Vehicles | 20 (24.4%) | 0 (0.0%) |
| 5 or more Vehicles | 0 (0.0%) | 0 (0.0%) |
| Total | 82 (100.0%) | 18 (100.0%) |
Commute Time in Noxon
The most frequently occuring commute durations in Noxon are 15 to 19 minutes (37 commuters, 37.0%), 5 to 9 minutes (21 commuters, 21.0%), and 30 to 34 minutes (20 commuters, 20.0%).
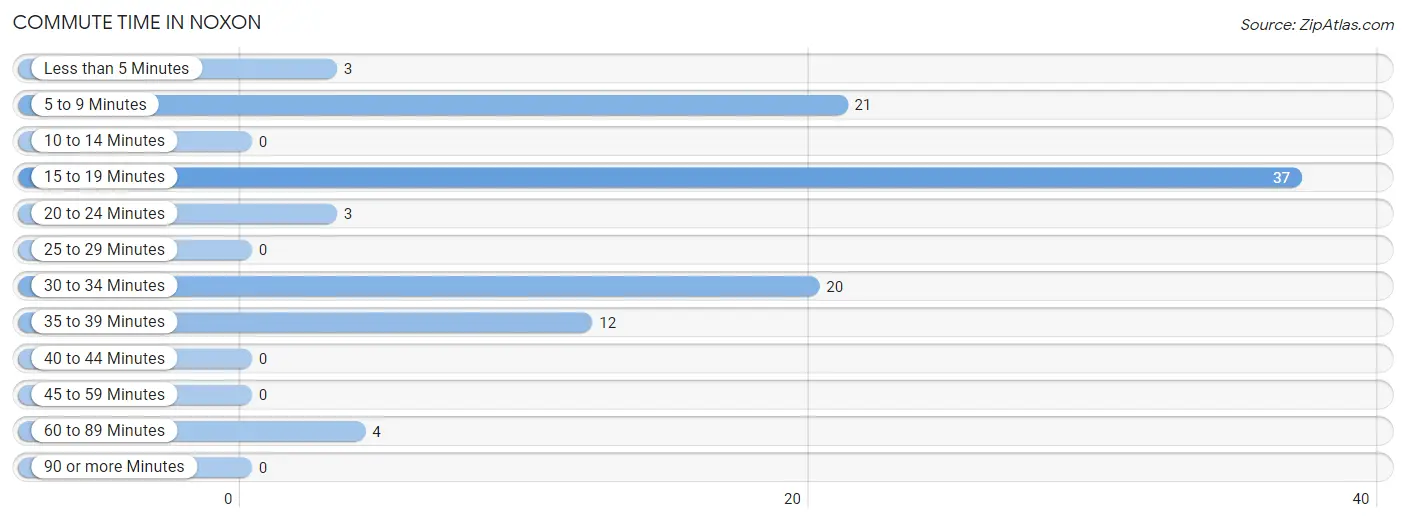
| Commute Time | # Commuters | % Commuters |
| Less than 5 Minutes | 3 | 3.0% |
| 5 to 9 Minutes | 21 | 21.0% |
| 10 to 14 Minutes | 0 | 0.0% |
| 15 to 19 Minutes | 37 | 37.0% |
| 20 to 24 Minutes | 3 | 3.0% |
| 25 to 29 Minutes | 0 | 0.0% |
| 30 to 34 Minutes | 20 | 20.0% |
| 35 to 39 Minutes | 12 | 12.0% |
| 40 to 44 Minutes | 0 | 0.0% |
| 45 to 59 Minutes | 0 | 0.0% |
| 60 to 89 Minutes | 4 | 4.0% |
| 90 or more Minutes | 0 | 0.0% |
Commute Time by Sex in Noxon
The most common commute times in Noxon are 15 to 19 minutes (33 commuters, 40.2%) for males and 5 to 9 minutes (8 commuters, 44.4%) for females.
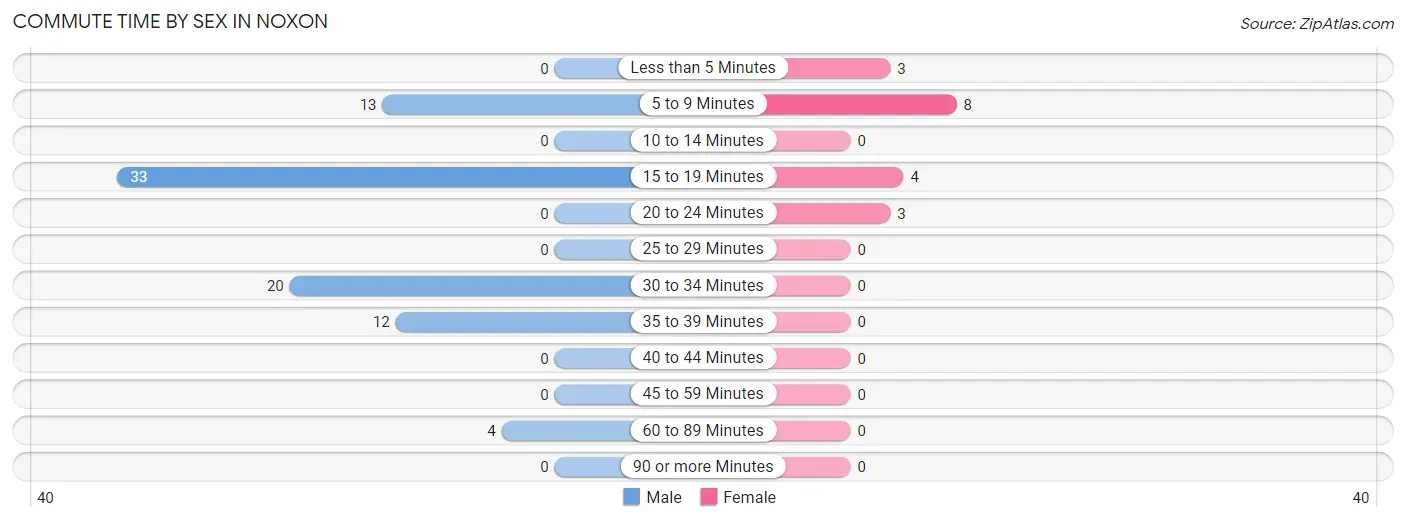
| Commute Time | Male | Female |
| Less than 5 Minutes | 0 (0.0%) | 3 (16.7%) |
| 5 to 9 Minutes | 13 (15.9%) | 8 (44.4%) |
| 10 to 14 Minutes | 0 (0.0%) | 0 (0.0%) |
| 15 to 19 Minutes | 33 (40.2%) | 4 (22.2%) |
| 20 to 24 Minutes | 0 (0.0%) | 3 (16.7%) |
| 25 to 29 Minutes | 0 (0.0%) | 0 (0.0%) |
| 30 to 34 Minutes | 20 (24.4%) | 0 (0.0%) |
| 35 to 39 Minutes | 12 (14.6%) | 0 (0.0%) |
| 40 to 44 Minutes | 0 (0.0%) | 0 (0.0%) |
| 45 to 59 Minutes | 0 (0.0%) | 0 (0.0%) |
| 60 to 89 Minutes | 4 (4.9%) | 0 (0.0%) |
| 90 or more Minutes | 0 (0.0%) | 0 (0.0%) |
Time of Departure to Work by Sex in Noxon
The most frequent times of departure to work in Noxon are 5:30 AM to 5:59 AM (24, 29.3%) for males and 7:30 AM to 7:59 AM (11, 61.1%) for females.
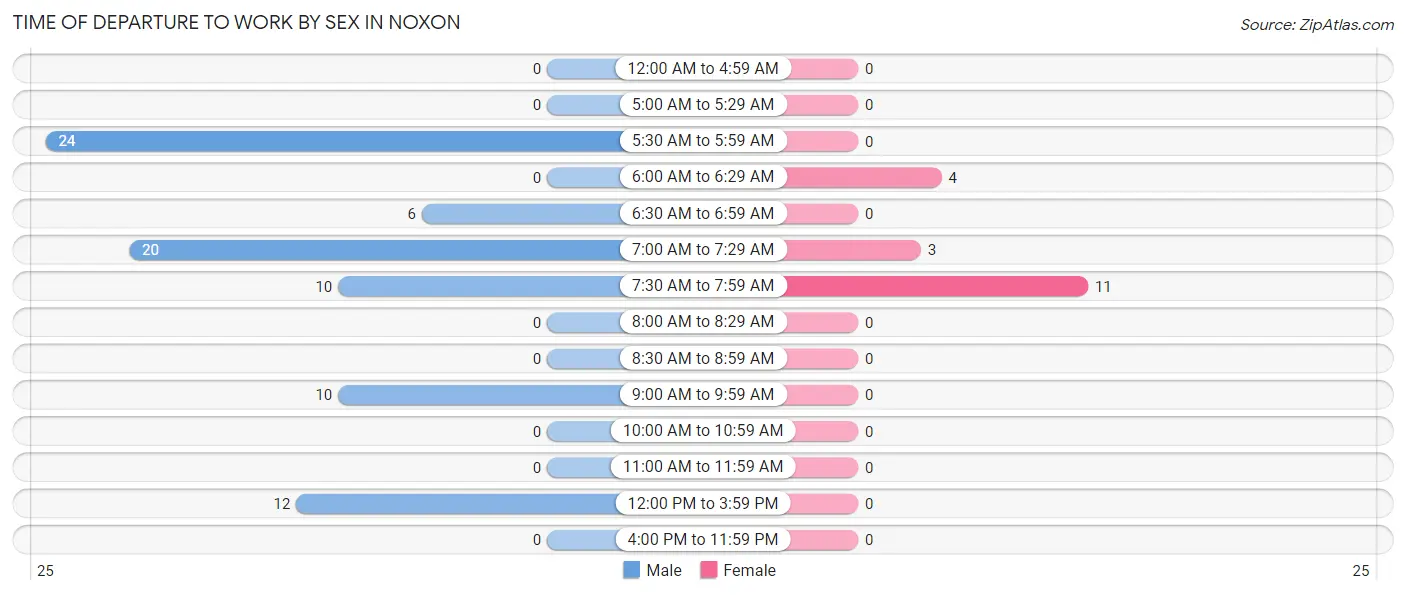
| Time of Departure | Male | Female |
| 12:00 AM to 4:59 AM | 0 (0.0%) | 0 (0.0%) |
| 5:00 AM to 5:29 AM | 0 (0.0%) | 0 (0.0%) |
| 5:30 AM to 5:59 AM | 24 (29.3%) | 0 (0.0%) |
| 6:00 AM to 6:29 AM | 0 (0.0%) | 4 (22.2%) |
| 6:30 AM to 6:59 AM | 6 (7.3%) | 0 (0.0%) |
| 7:00 AM to 7:29 AM | 20 (24.4%) | 3 (16.7%) |
| 7:30 AM to 7:59 AM | 10 (12.2%) | 11 (61.1%) |
| 8:00 AM to 8:29 AM | 0 (0.0%) | 0 (0.0%) |
| 8:30 AM to 8:59 AM | 0 (0.0%) | 0 (0.0%) |
| 9:00 AM to 9:59 AM | 10 (12.2%) | 0 (0.0%) |
| 10:00 AM to 10:59 AM | 0 (0.0%) | 0 (0.0%) |
| 11:00 AM to 11:59 AM | 0 (0.0%) | 0 (0.0%) |
| 12:00 PM to 3:59 PM | 12 (14.6%) | 0 (0.0%) |
| 4:00 PM to 11:59 PM | 0 (0.0%) | 0 (0.0%) |
| Total | 82 (100.0%) | 18 (100.0%) |
Housing Occupancy in Noxon
Occupancy by Ownership in Noxon
Of the total 85 dwellings in Noxon, owner-occupied units account for 57 (67.1%), while renter-occupied units make up 28 (32.9%).
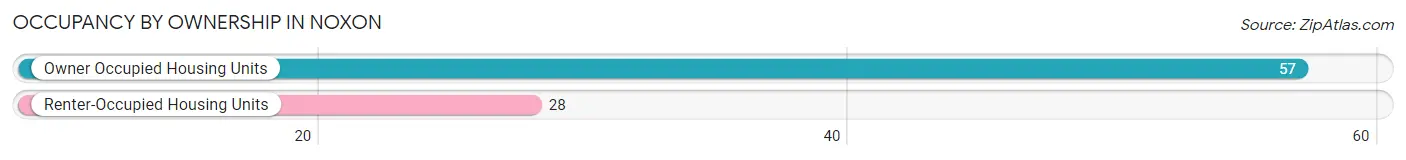
| Occupancy | # Housing Units | % Housing Units |
| Owner Occupied Housing Units | 57 | 67.1% |
| Renter-Occupied Housing Units | 28 | 32.9% |
| Total Occupied Housing Units | 85 | 100.0% |
Occupancy by Household Size in Noxon
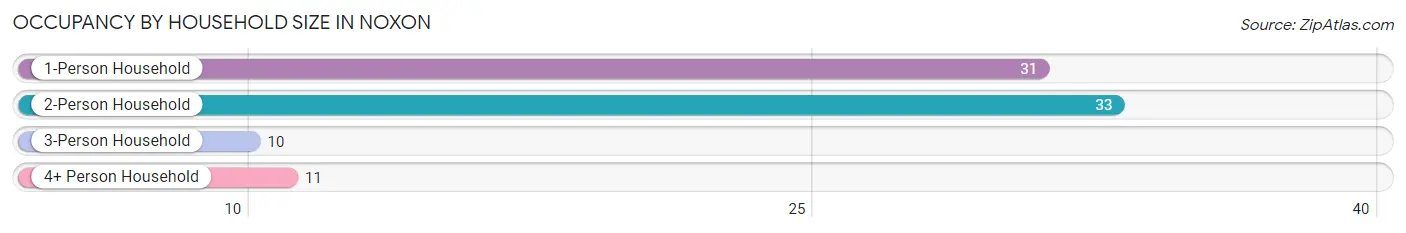
| Household Size | # Housing Units | % Housing Units |
| 1-Person Household | 31 | 36.5% |
| 2-Person Household | 33 | 38.8% |
| 3-Person Household | 10 | 11.8% |
| 4+ Person Household | 11 | 12.9% |
| Total Housing Units | 85 | 100.0% |
Occupancy by Ownership by Household Size in Noxon
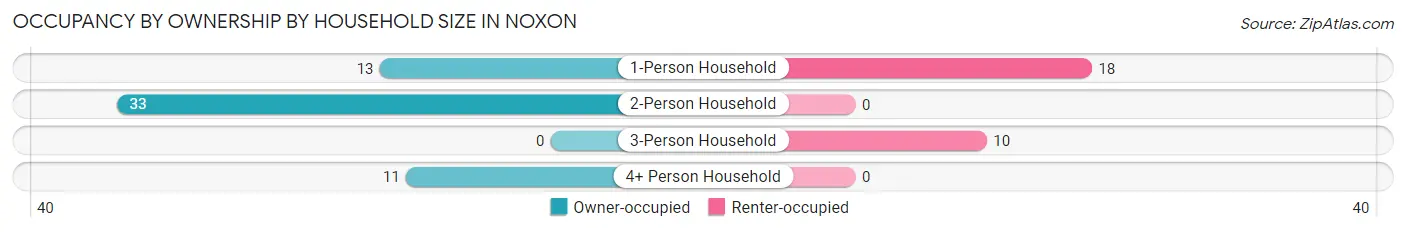
| Household Size | Owner-occupied | Renter-occupied |
| 1-Person Household | 13 (41.9%) | 18 (58.1%) |
| 2-Person Household | 33 (100.0%) | 0 (0.0%) |
| 3-Person Household | 0 (0.0%) | 10 (100.0%) |
| 4+ Person Household | 11 (100.0%) | 0 (0.0%) |
| Total Housing Units | 57 (67.1%) | 28 (32.9%) |
Occupancy by Educational Attainment in Noxon
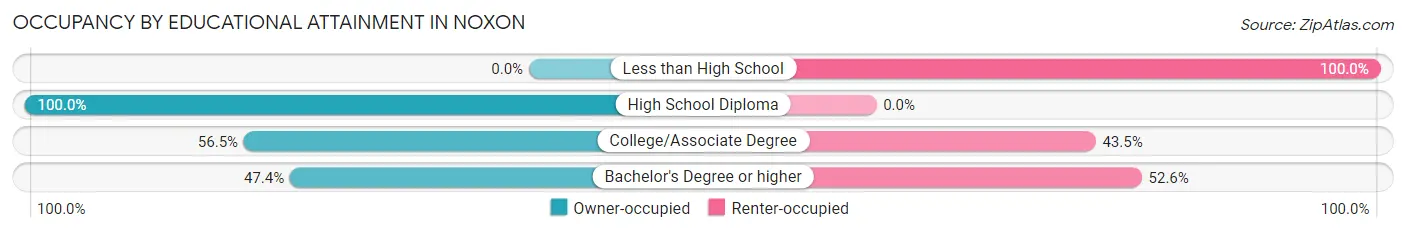
| Household Size | Owner-occupied | Renter-occupied |
| Less than High School | 0 (0.0%) | 8 (100.0%) |
| High School Diploma | 35 (100.0%) | 0 (0.0%) |
| College/Associate Degree | 13 (56.5%) | 10 (43.5%) |
| Bachelor's Degree or higher | 9 (47.4%) | 10 (52.6%) |
Occupancy by Age of Householder in Noxon
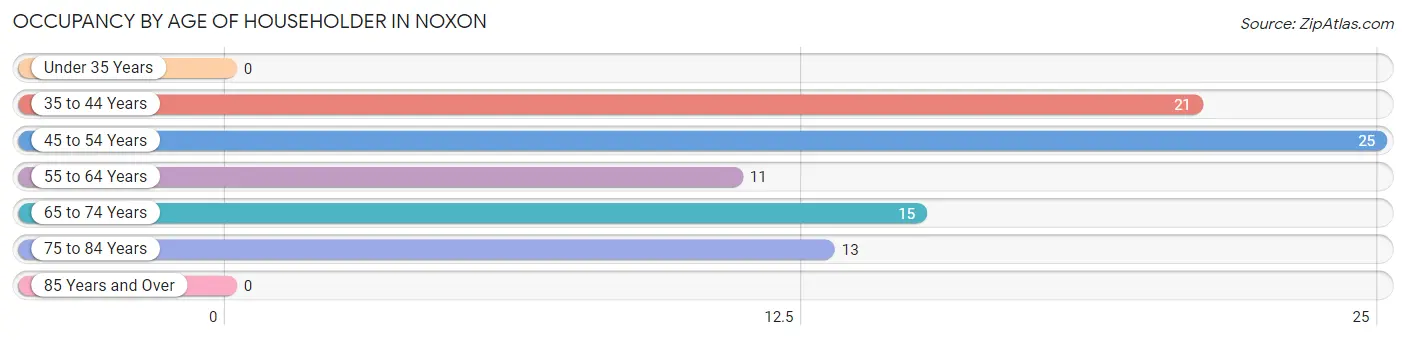
| Age Bracket | # Households | % Households |
| Under 35 Years | 0 | 0.0% |
| 35 to 44 Years | 21 | 24.7% |
| 45 to 54 Years | 25 | 29.4% |
| 55 to 64 Years | 11 | 12.9% |
| 65 to 74 Years | 15 | 17.6% |
| 75 to 84 Years | 13 | 15.3% |
| 85 Years and Over | 0 | 0.0% |
| Total | 85 | 100.0% |
Housing Finances in Noxon
Median Income by Occupancy in Noxon

| Occupancy Type | # Households | Median Income |
| Owner-Occupied | 57 (67.1%) | $57,361 |
| Renter-Occupied | 28 (32.9%) | $0 |
| Average | 85 (100.0%) | $56,250 |
Occupancy by Householder Income Bracket in Noxon
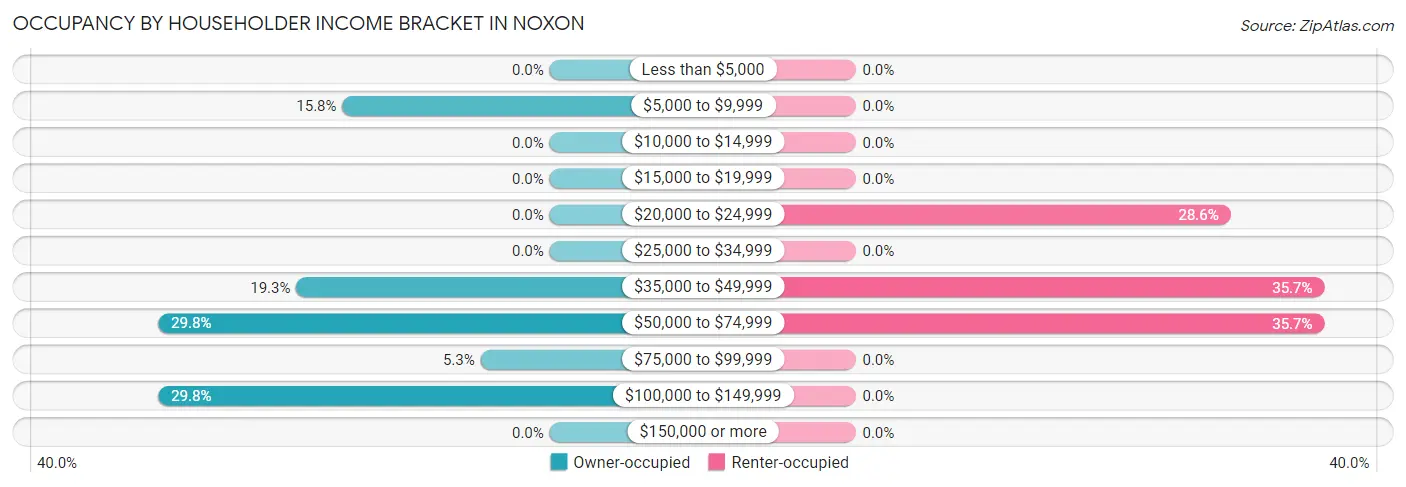
| Income Bracket | Owner-occupied | Renter-occupied |
| Less than $5,000 | 0 (0.0%) | 0 (0.0%) |
| $5,000 to $9,999 | 9 (15.8%) | 0 (0.0%) |
| $10,000 to $14,999 | 0 (0.0%) | 0 (0.0%) |
| $15,000 to $19,999 | 0 (0.0%) | 0 (0.0%) |
| $20,000 to $24,999 | 0 (0.0%) | 8 (28.6%) |
| $25,000 to $34,999 | 0 (0.0%) | 0 (0.0%) |
| $35,000 to $49,999 | 11 (19.3%) | 10 (35.7%) |
| $50,000 to $74,999 | 17 (29.8%) | 10 (35.7%) |
| $75,000 to $99,999 | 3 (5.3%) | 0 (0.0%) |
| $100,000 to $149,999 | 17 (29.8%) | 0 (0.0%) |
| $150,000 or more | 0 (0.0%) | 0 (0.0%) |
| Total | 57 (100.0%) | 28 (100.0%) |
Monthly Housing Cost Tiers in Noxon
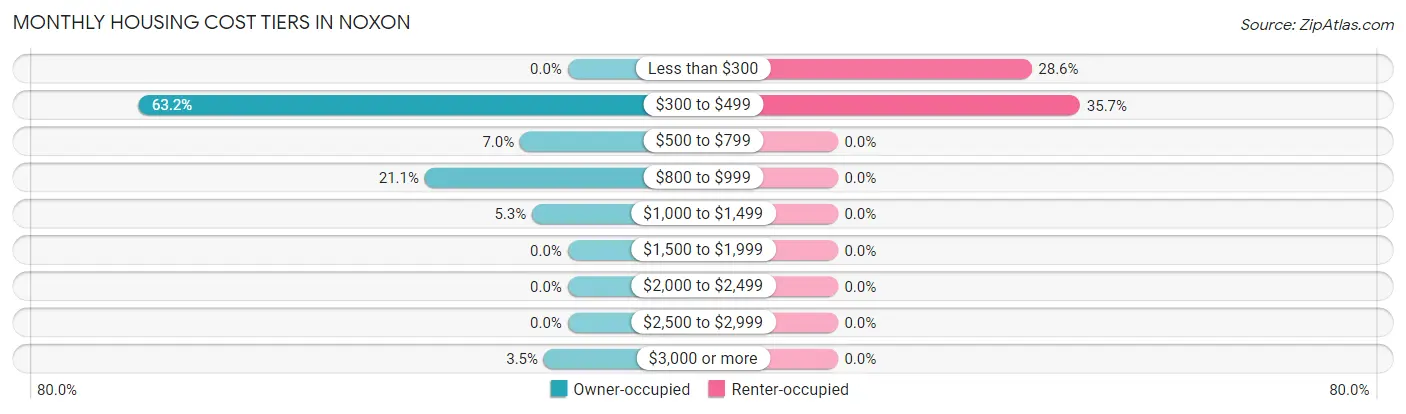
| Monthly Cost | Owner-occupied | Renter-occupied |
| Less than $300 | 0 (0.0%) | 8 (28.6%) |
| $300 to $499 | 36 (63.2%) | 10 (35.7%) |
| $500 to $799 | 4 (7.0%) | 0 (0.0%) |
| $800 to $999 | 12 (21.0%) | 0 (0.0%) |
| $1,000 to $1,499 | 3 (5.3%) | 0 (0.0%) |
| $1,500 to $1,999 | 0 (0.0%) | 0 (0.0%) |
| $2,000 to $2,499 | 0 (0.0%) | 0 (0.0%) |
| $2,500 to $2,999 | 0 (0.0%) | 0 (0.0%) |
| $3,000 or more | 2 (3.5%) | 0 (0.0%) |
| Total | 57 (100.0%) | 28 (100.0%) |
Physical Housing Characteristics in Noxon
Housing Structures in Noxon
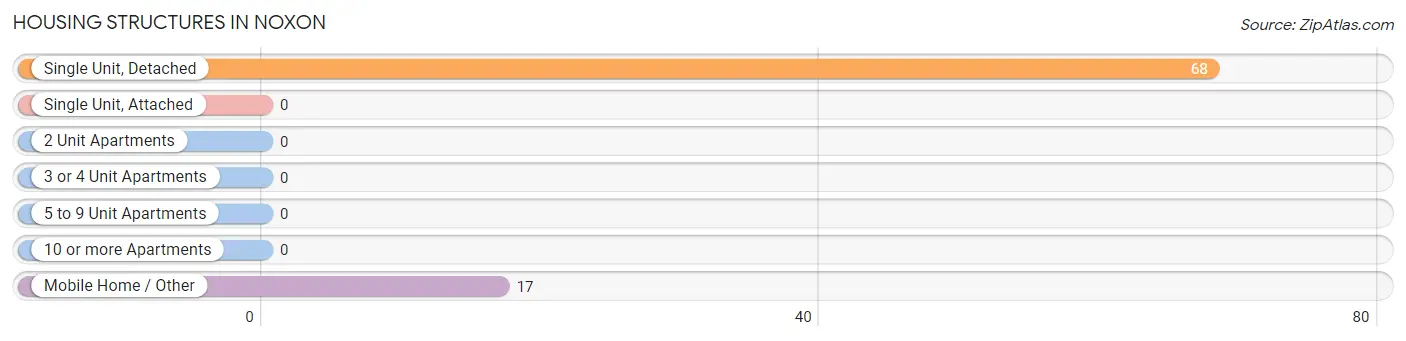
| Structure Type | # Housing Units | % Housing Units |
| Single Unit, Detached | 68 | 80.0% |
| Single Unit, Attached | 0 | 0.0% |
| 2 Unit Apartments | 0 | 0.0% |
| 3 or 4 Unit Apartments | 0 | 0.0% |
| 5 to 9 Unit Apartments | 0 | 0.0% |
| 10 or more Apartments | 0 | 0.0% |
| Mobile Home / Other | 17 | 20.0% |
| Total | 85 | 100.0% |
Housing Structures by Occupancy in Noxon
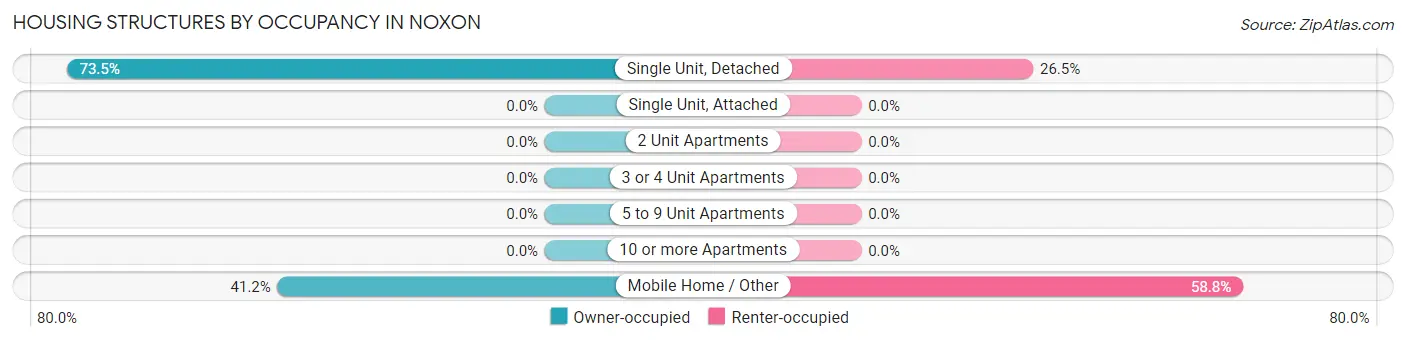
| Structure Type | Owner-occupied | Renter-occupied |
| Single Unit, Detached | 50 (73.5%) | 18 (26.5%) |
| Single Unit, Attached | 0 (0.0%) | 0 (0.0%) |
| 2 Unit Apartments | 0 (0.0%) | 0 (0.0%) |
| 3 or 4 Unit Apartments | 0 (0.0%) | 0 (0.0%) |
| 5 to 9 Unit Apartments | 0 (0.0%) | 0 (0.0%) |
| 10 or more Apartments | 0 (0.0%) | 0 (0.0%) |
| Mobile Home / Other | 7 (41.2%) | 10 (58.8%) |
| Total | 57 (67.1%) | 28 (32.9%) |
Housing Structures by Number of Rooms in Noxon
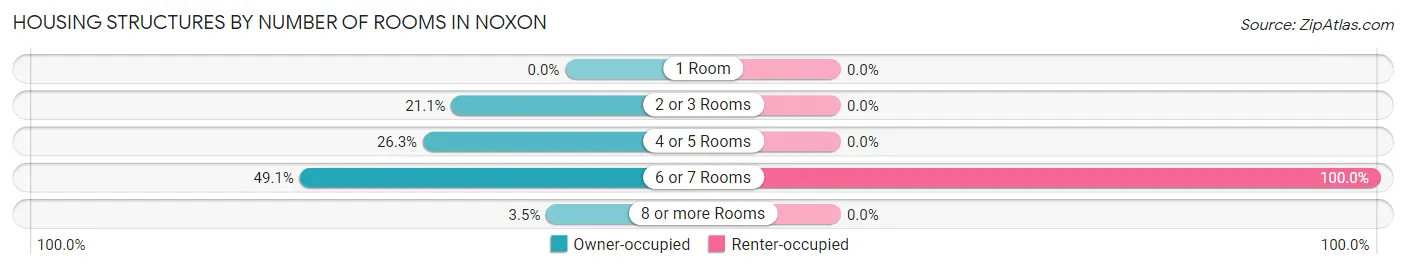
| Number of Rooms | Owner-occupied | Renter-occupied |
| 1 Room | 0 (0.0%) | 0 (0.0%) |
| 2 or 3 Rooms | 12 (21.0%) | 0 (0.0%) |
| 4 or 5 Rooms | 15 (26.3%) | 0 (0.0%) |
| 6 or 7 Rooms | 28 (49.1%) | 28 (100.0%) |
| 8 or more Rooms | 2 (3.5%) | 0 (0.0%) |
| Total | 57 (100.0%) | 28 (100.0%) |
Housing Structure by Heating Type in Noxon
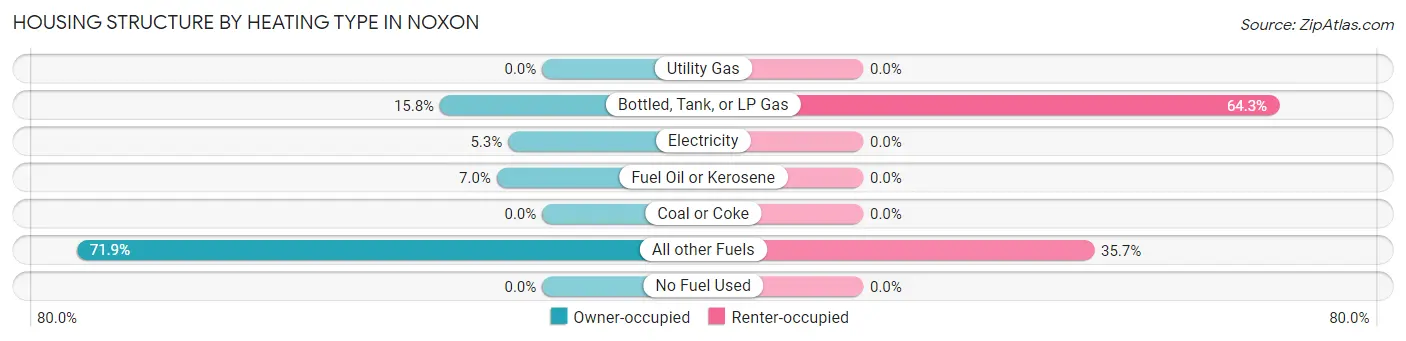
| Heating Type | Owner-occupied | Renter-occupied |
| Utility Gas | 0 (0.0%) | 0 (0.0%) |
| Bottled, Tank, or LP Gas | 9 (15.8%) | 18 (64.3%) |
| Electricity | 3 (5.3%) | 0 (0.0%) |
| Fuel Oil or Kerosene | 4 (7.0%) | 0 (0.0%) |
| Coal or Coke | 0 (0.0%) | 0 (0.0%) |
| All other Fuels | 41 (71.9%) | 10 (35.7%) |
| No Fuel Used | 0 (0.0%) | 0 (0.0%) |
| Total | 57 (100.0%) | 28 (100.0%) |
Household Vehicle Usage in Noxon
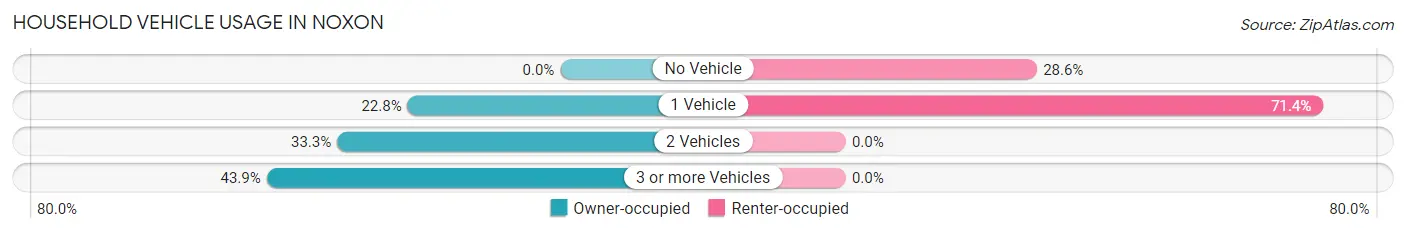
| Vehicles per Household | Owner-occupied | Renter-occupied |
| No Vehicle | 0 (0.0%) | 8 (28.6%) |
| 1 Vehicle | 13 (22.8%) | 20 (71.4%) |
| 2 Vehicles | 19 (33.3%) | 0 (0.0%) |
| 3 or more Vehicles | 25 (43.9%) | 0 (0.0%) |
| Total | 57 (100.0%) | 28 (100.0%) |
Real Estate & Mortgages in Noxon
Real Estate and Mortgage Overview in Noxon
| Characteristic | Without Mortgage | With Mortgage |
| Housing Units | 40 | 17 |
| Median Property Value | $150,000 | $285,400 |
| Median Household Income | $48,750 | $0 |
| Monthly Housing Costs | $348 | $2 |
| Real Estate Taxes | $800 | $0 |
Property Value by Mortgage Status in Noxon
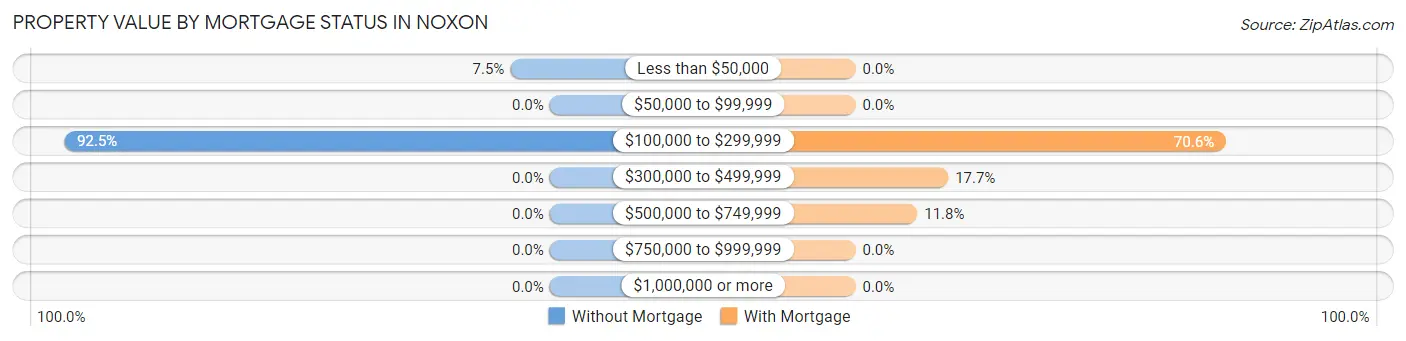
| Property Value | Without Mortgage | With Mortgage |
| Less than $50,000 | 3 (7.5%) | 0 (0.0%) |
| $50,000 to $99,999 | 0 (0.0%) | 0 (0.0%) |
| $100,000 to $299,999 | 37 (92.5%) | 12 (70.6%) |
| $300,000 to $499,999 | 0 (0.0%) | 3 (17.6%) |
| $500,000 to $749,999 | 0 (0.0%) | 2 (11.8%) |
| $750,000 to $999,999 | 0 (0.0%) | 0 (0.0%) |
| $1,000,000 or more | 0 (0.0%) | 0 (0.0%) |
| Total | 40 (100.0%) | 17 (100.0%) |
Household Income by Mortgage Status in Noxon
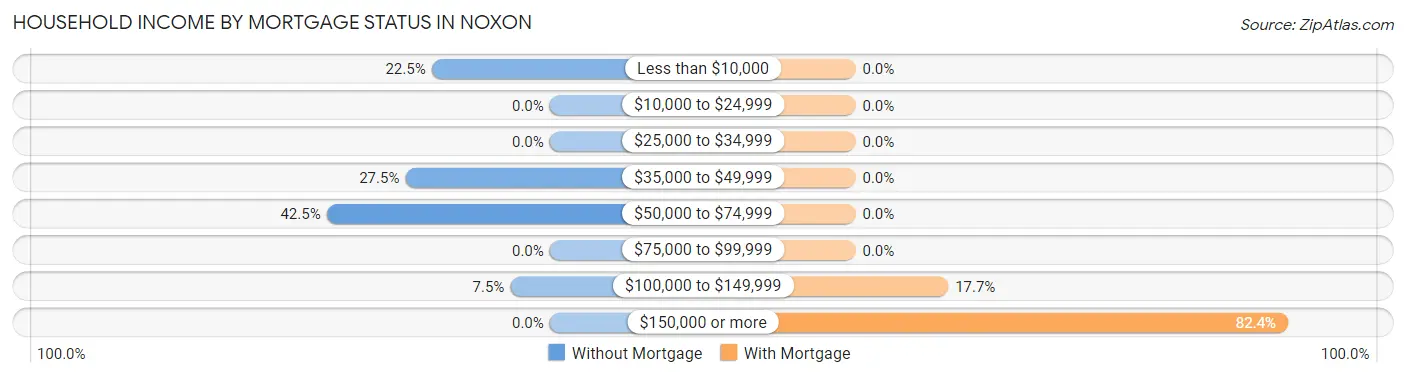
| Household Income | Without Mortgage | With Mortgage |
| Less than $10,000 | 9 (22.5%) | 0 (0.0%) |
| $10,000 to $24,999 | 0 (0.0%) | 0 (0.0%) |
| $25,000 to $34,999 | 0 (0.0%) | 0 (0.0%) |
| $35,000 to $49,999 | 11 (27.5%) | 0 (0.0%) |
| $50,000 to $74,999 | 17 (42.5%) | 0 (0.0%) |
| $75,000 to $99,999 | 0 (0.0%) | 0 (0.0%) |
| $100,000 to $149,999 | 3 (7.5%) | 3 (17.6%) |
| $150,000 or more | 0 (0.0%) | 14 (82.4%) |
| Total | 40 (100.0%) | 17 (100.0%) |
Property Value to Household Income Ratio in Noxon
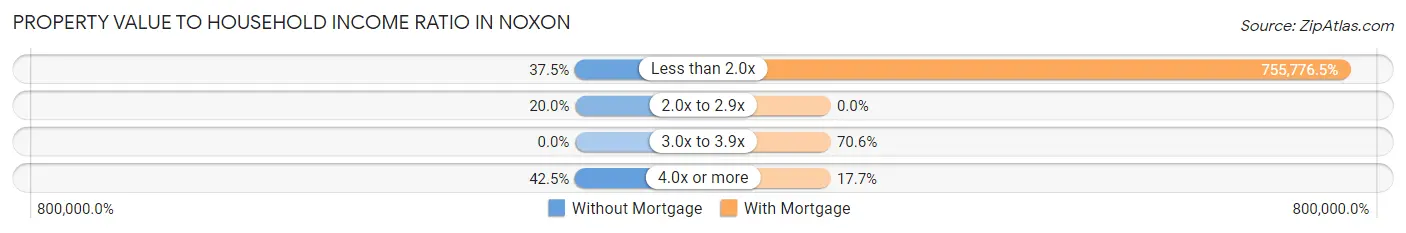
| Value-to-Income Ratio | Without Mortgage | With Mortgage |
| Less than 2.0x | 15 (37.5%) | 128,482 (755,776.5%) |
| 2.0x to 2.9x | 8 (20.0%) | 0 (0.0%) |
| 3.0x to 3.9x | 0 (0.0%) | 12 (70.6%) |
| 4.0x or more | 17 (42.5%) | 3 (17.6%) |
| Total | 40 (100.0%) | 17 (100.0%) |
Real Estate Taxes by Mortgage Status in Noxon
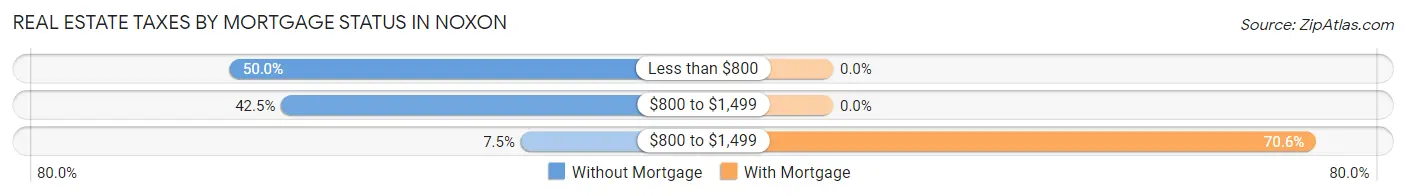
| Property Taxes | Without Mortgage | With Mortgage |
| Less than $800 | 20 (50.0%) | 0 (0.0%) |
| $800 to $1,499 | 17 (42.5%) | 0 (0.0%) |
| $800 to $1,499 | 3 (7.5%) | 12 (70.6%) |
| Total | 40 (100.0%) | 17 (100.0%) |
Health & Disability in Noxon
Health Insurance Coverage by Age in Noxon
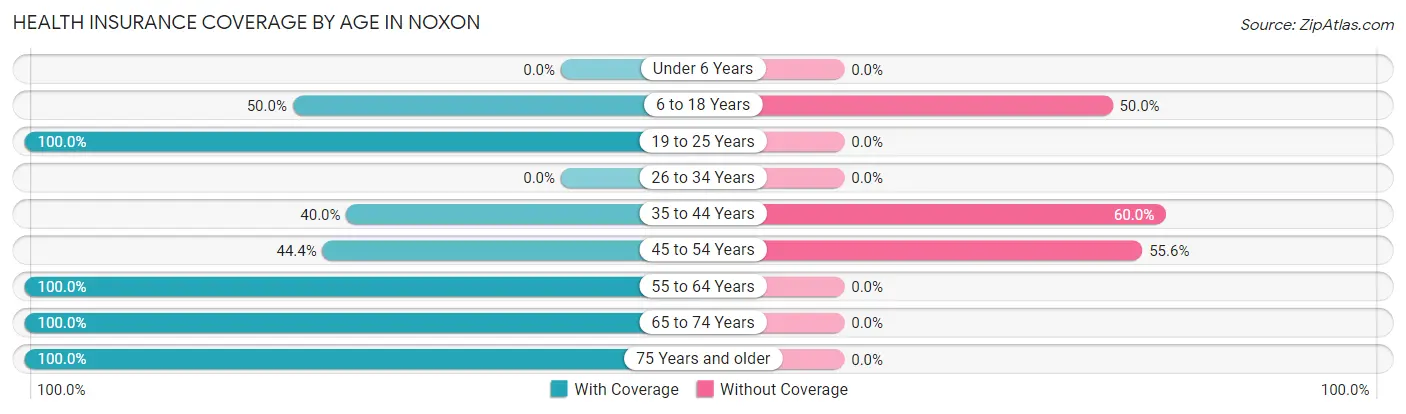
| Age Bracket | With Coverage | Without Coverage |
| Under 6 Years | 0 (0.0%) | 0 (0.0%) |
| 6 to 18 Years | 22 (50.0%) | 22 (50.0%) |
| 19 to 25 Years | 20 (100.0%) | 0 (0.0%) |
| 26 to 34 Years | 0 (0.0%) | 0 (0.0%) |
| 35 to 44 Years | 14 (40.0%) | 21 (60.0%) |
| 45 to 54 Years | 24 (44.4%) | 30 (55.6%) |
| 55 to 64 Years | 19 (100.0%) | 0 (0.0%) |
| 65 to 74 Years | 17 (100.0%) | 0 (0.0%) |
| 75 Years and older | 16 (100.0%) | 0 (0.0%) |
| Total | 132 (64.4%) | 73 (35.6%) |
Health Insurance Coverage by Citizenship Status in Noxon
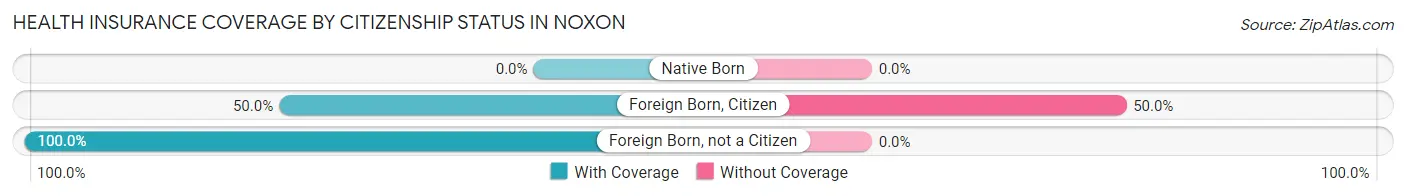
| Citizenship Status | With Coverage | Without Coverage |
| Native Born | 0 (0.0%) | 0 (0.0%) |
| Foreign Born, Citizen | 22 (50.0%) | 22 (50.0%) |
| Foreign Born, not a Citizen | 20 (100.0%) | 0 (0.0%) |
Health Insurance Coverage by Household Income in Noxon
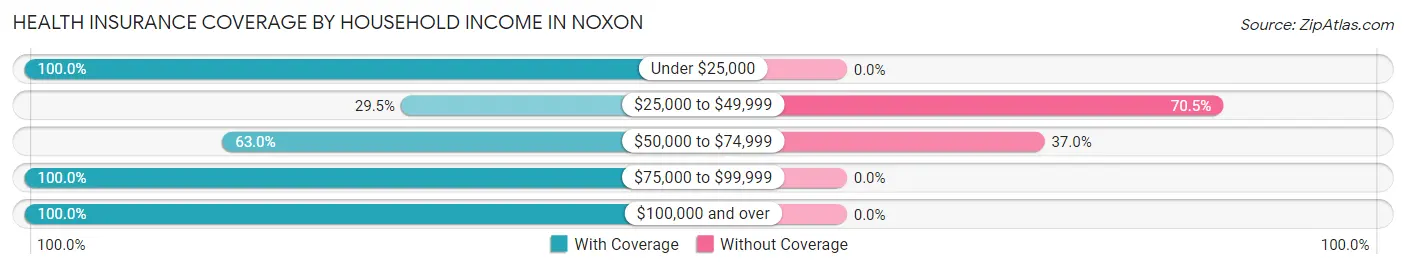
| Household Income | With Coverage | Without Coverage |
| Under $25,000 | 17 (100.0%) | 0 (0.0%) |
| $25,000 to $49,999 | 18 (29.5%) | 43 (70.5%) |
| $50,000 to $74,999 | 51 (63.0%) | 30 (37.0%) |
| $75,000 to $99,999 | 14 (100.0%) | 0 (0.0%) |
| $100,000 and over | 32 (100.0%) | 0 (0.0%) |
Public vs Private Health Insurance Coverage by Age in Noxon
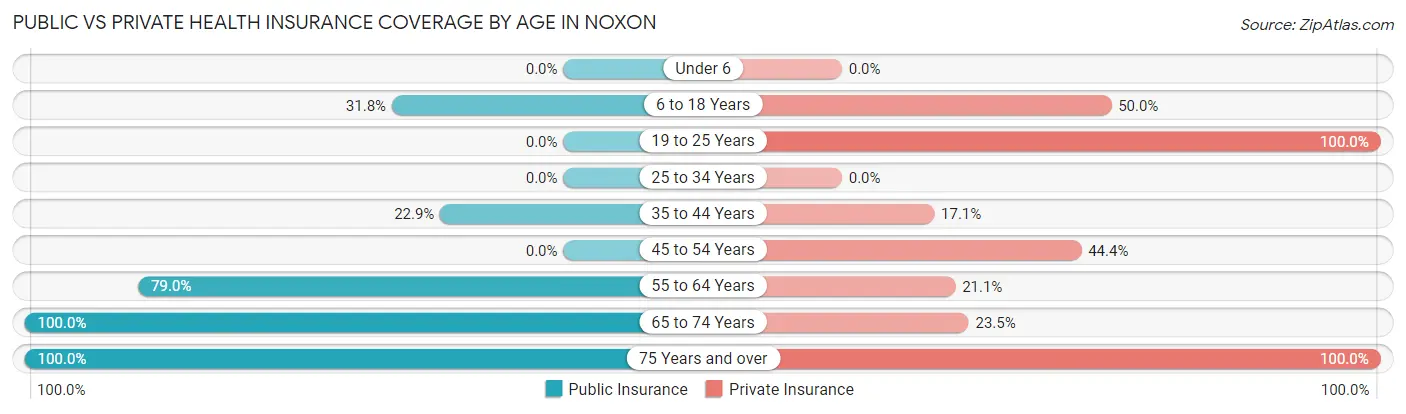
| Age Bracket | Public Insurance | Private Insurance |
| Under 6 | 0 (0.0%) | 0 (0.0%) |
| 6 to 18 Years | 14 (31.8%) | 22 (50.0%) |
| 19 to 25 Years | 0 (0.0%) | 20 (100.0%) |
| 25 to 34 Years | 0 (0.0%) | 0 (0.0%) |
| 35 to 44 Years | 8 (22.9%) | 6 (17.1%) |
| 45 to 54 Years | 0 (0.0%) | 24 (44.4%) |
| 55 to 64 Years | 15 (78.9%) | 4 (21.0%) |
| 65 to 74 Years | 17 (100.0%) | 4 (23.5%) |
| 75 Years and over | 16 (100.0%) | 16 (100.0%) |
| Total | 70 (34.2%) | 96 (46.8%) |
Disability Status by Sex by Age in Noxon
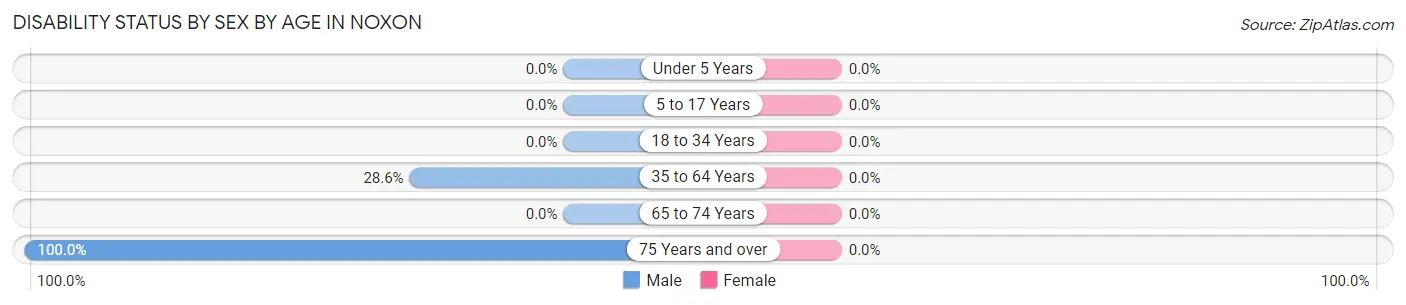
| Age Bracket | Male | Female |
| Under 5 Years | 0 (0.0%) | 0 (0.0%) |
| 5 to 17 Years | 0 (0.0%) | 0 (0.0%) |
| 18 to 34 Years | 0 (0.0%) | 0 (0.0%) |
| 35 to 64 Years | 20 (28.6%) | 0 (0.0%) |
| 65 to 74 Years | 0 (0.0%) | 0 (0.0%) |
| 75 Years and over | 4 (100.0%) | 0 (0.0%) |
Disability Class by Sex by Age in Noxon
Disability Class: Hearing Difficulty
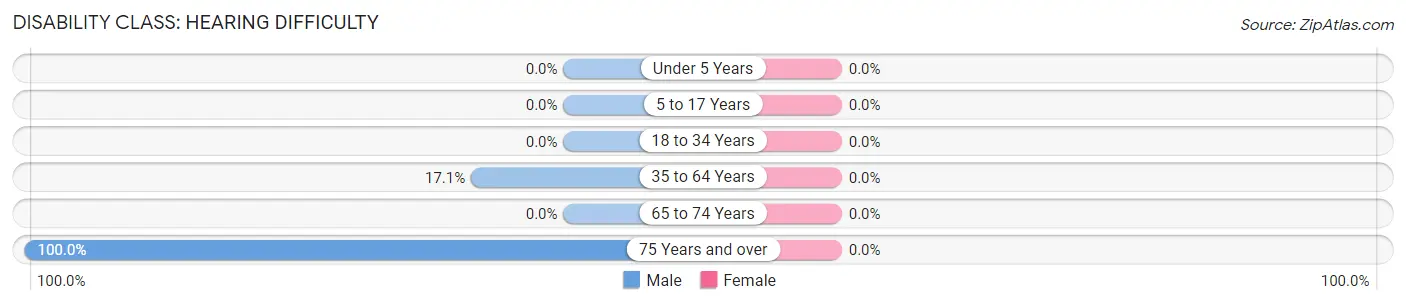
| Age Bracket | Male | Female |
| Under 5 Years | 0 (0.0%) | 0 (0.0%) |
| 5 to 17 Years | 0 (0.0%) | 0 (0.0%) |
| 18 to 34 Years | 0 (0.0%) | 0 (0.0%) |
| 35 to 64 Years | 12 (17.1%) | 0 (0.0%) |
| 65 to 74 Years | 0 (0.0%) | 0 (0.0%) |
| 75 Years and over | 4 (100.0%) | 0 (0.0%) |
Disability Class: Vision Difficulty
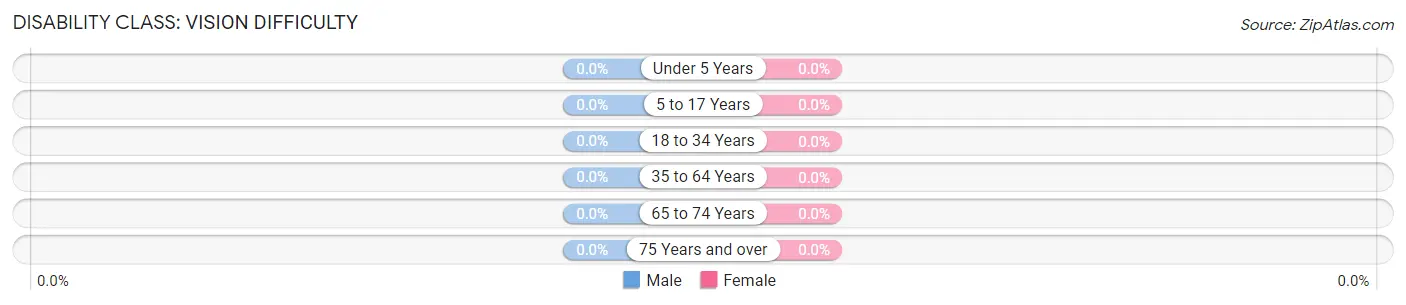
| Age Bracket | Male | Female |
| Under 5 Years | 0 (0.0%) | 0 (0.0%) |
| 5 to 17 Years | 0 (0.0%) | 0 (0.0%) |
| 18 to 34 Years | 0 (0.0%) | 0 (0.0%) |
| 35 to 64 Years | 0 (0.0%) | 0 (0.0%) |
| 65 to 74 Years | 0 (0.0%) | 0 (0.0%) |
| 75 Years and over | 0 (0.0%) | 0 (0.0%) |
Disability Class: Cognitive Difficulty
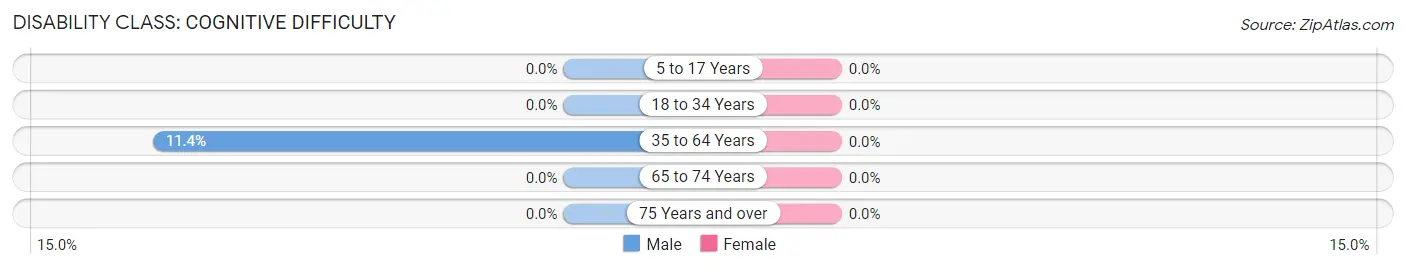
| Age Bracket | Male | Female |
| 5 to 17 Years | 0 (0.0%) | 0 (0.0%) |
| 18 to 34 Years | 0 (0.0%) | 0 (0.0%) |
| 35 to 64 Years | 8 (11.4%) | 0 (0.0%) |
| 65 to 74 Years | 0 (0.0%) | 0 (0.0%) |
| 75 Years and over | 0 (0.0%) | 0 (0.0%) |
Disability Class: Ambulatory Difficulty
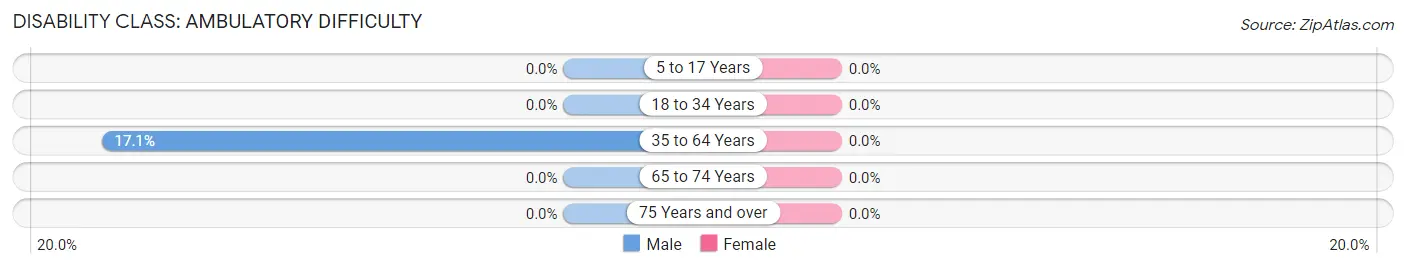
| Age Bracket | Male | Female |
| 5 to 17 Years | 0 (0.0%) | 0 (0.0%) |
| 18 to 34 Years | 0 (0.0%) | 0 (0.0%) |
| 35 to 64 Years | 12 (17.1%) | 0 (0.0%) |
| 65 to 74 Years | 0 (0.0%) | 0 (0.0%) |
| 75 Years and over | 0 (0.0%) | 0 (0.0%) |
Disability Class: Self-Care Difficulty
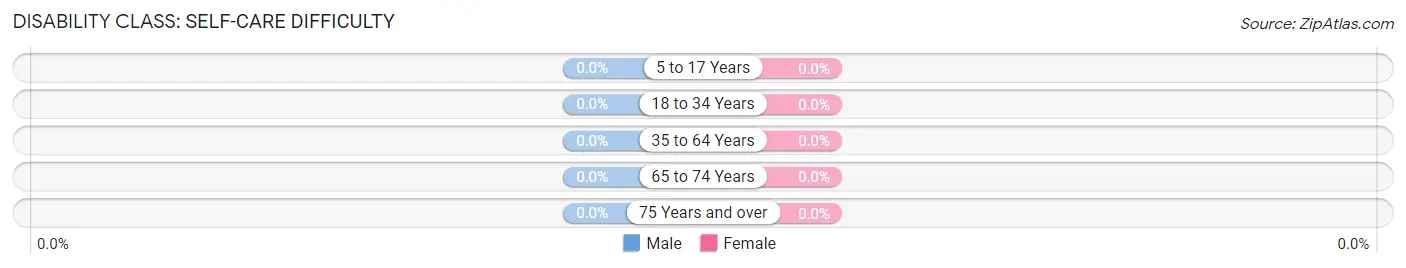
| Age Bracket | Male | Female |
| 5 to 17 Years | 0 (0.0%) | 0 (0.0%) |
| 18 to 34 Years | 0 (0.0%) | 0 (0.0%) |
| 35 to 64 Years | 0 (0.0%) | 0 (0.0%) |
| 65 to 74 Years | 0 (0.0%) | 0 (0.0%) |
| 75 Years and over | 0 (0.0%) | 0 (0.0%) |
Technology Access in Noxon
Computing Device Access in Noxon
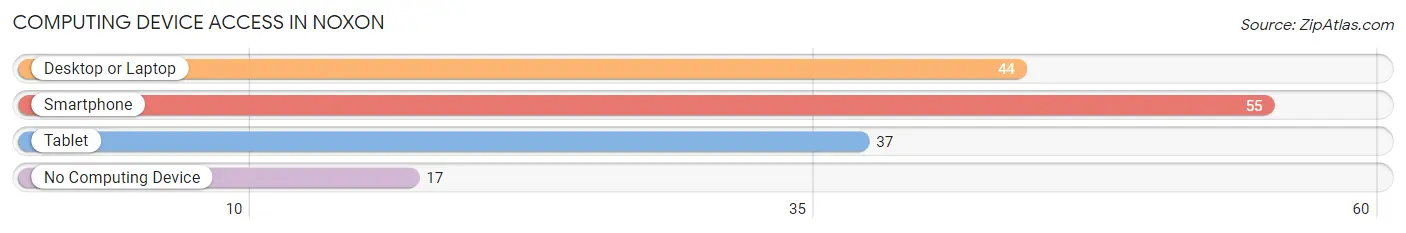
| Device Type | # Households | % Households |
| Desktop or Laptop | 44 | 51.8% |
| Smartphone | 55 | 64.7% |
| Tablet | 37 | 43.5% |
| No Computing Device | 17 | 20.0% |
| Total | 85 | 100.0% |
Internet Access in Noxon
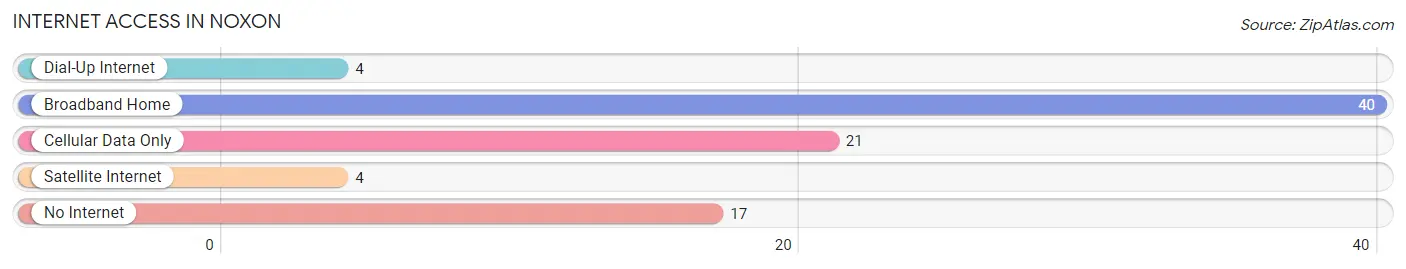
| Internet Type | # Households | % Households |
| Dial-Up Internet | 4 | 4.7% |
| Broadband Home | 40 | 47.1% |
| Cellular Data Only | 21 | 24.7% |
| Satellite Internet | 4 | 4.7% |
| No Internet | 17 | 20.0% |
| Total | 85 | 100.0% |
Noxon Summary
Noxon, Montana is a small town located in Sanders County, Montana. It is situated on the banks of the Clark Fork River, near the Idaho border. The town was founded in 1883 and has a population of approximately 500 people.
Geography
Noxon is located in the northwest corner of Montana, near the Idaho border. It is situated on the banks of the Clark Fork River, which is a tributary of the Columbia River. The town is surrounded by the Cabinet Mountains and the Kootenai National Forest. The area is known for its rugged beauty and is a popular destination for outdoor recreation.
Economy
Noxon’s economy is largely based on agriculture and timber. The town is home to several small farms and ranches, as well as a sawmill. The sawmill is the largest employer in the area, providing jobs for many of the town’s residents. The town also has a small retail sector, with several stores and restaurants.
Demographics
As of the 2010 census, the population of Noxon was 498. The racial makeup of the town was 95.2% White, 0.2% African American, 0.8% Native American, 0.2% Asian, 0.2% Pacific Islander, and 3.4% from two or more races. The median household income was $30,938, and the median family income was $37,500.
History
Noxon was founded in 1883 by a group of settlers from Wisconsin. The town was named after a local Native American chief, Chief Noxon. The town quickly grew and became a hub for the surrounding area. In the early 1900s, the town was home to several sawmills, a flour mill, and a creamery.
In the 1950s, the town began to decline as the timber industry moved away. The sawmills closed and the population began to dwindle. In the 1970s, the town was revitalized by the construction of a hydroelectric dam on the Clark Fork River. The dam provided jobs and electricity to the area, and the town began to grow again.
Today, Noxon is a small, rural town with a population of approximately 500 people. The town is still largely dependent on agriculture and timber, but it is also a popular destination for outdoor recreation. The town is home to several small businesses, including a sawmill, a restaurant, and a few stores.
Noxon is a small town with a rich history and a bright future. It is a great place to live and work, and it offers a unique combination of rural charm and modern amenities. The town is a great place to raise a family, and it is a popular destination for outdoor recreation. Noxon is a great place to call home.
Common Questions
What is Per Capita Income in Noxon?
Per Capita income in Noxon is $29,850.
What is the Median Household income in Noxon?
Median Household Income in Noxon is $56,250.
What is Income or Wage Gap in Noxon?
Income or Wage Gap in Noxon is 45.1%.
Women in Noxon earn 54.9 cents for every dollar earned by a man.
What is Inequality or Gini Index in Noxon?
Inequality or Gini Index in Noxon is 0.35.
What is the Total Population of Noxon?
Total Population of Noxon is 205.
What is the Total Male Population of Noxon?
Total Male Population of Noxon is 131.
What is the Total Female Population of Noxon?
Total Female Population of Noxon is 74.
What is the Ratio of Males per 100 Females in Noxon?
There are 177.03 Males per 100 Females in Noxon.
What is the Ratio of Females per 100 Males in Noxon?
There are 56.49 Females per 100 Males in Noxon.
What is the Median Population Age in Noxon?
Median Population Age in Noxon is 45.4 Years.
What is the Average Family Size in Noxon
Average Family Size in Noxon is 2.8 People.
What is the Average Household Size in Noxon
Average Household Size in Noxon is 2.4 People.
How Large is the Labor Force in Noxon?
There are 109 People in the Labor Forcein in Noxon.
What is the Percentage of People in the Labor Force in Noxon?
65.3% of People are in the Labor Force in Noxon.
What is the Unemployment Rate in Noxon?
Unemployment Rate in Noxon is 8.3%.